Embed Size (px)
Citation preview
KA
ND
IDAT
UPPSATS
Contents
Summary ............................................................................................................................. 1
Introduction ......................................................................................................................... 2
Methods for increasing maximal strength ....................................................................... 3
Experimental approach to the problem ........................................................................... 7
Aim of the study .................................................................................................................. 7
Hypothesis ........................................................................................................................... 7
Method ................................................................................................................................ 7
Subjects ........................................................................................................................... 7
Ethical Aspects ................................................................................................................ 8
Equipment ....................................................................................................................... 8
Exercise execution .......................................................................................................... 8
Test procedure ................................................................................................................. 9
Statistical analysis ......................................................................................................... 10
Results ............................................................................................................................... 10
Discussion ......................................................................................................................... 11
Study limitations ........................................................................................................... 12
Study strengths .............................................................................................................. 13
Practical applications .................................................................................................... 14
Conclusion ........................................................................................................................ 14
References ......................................................................................................................... 15
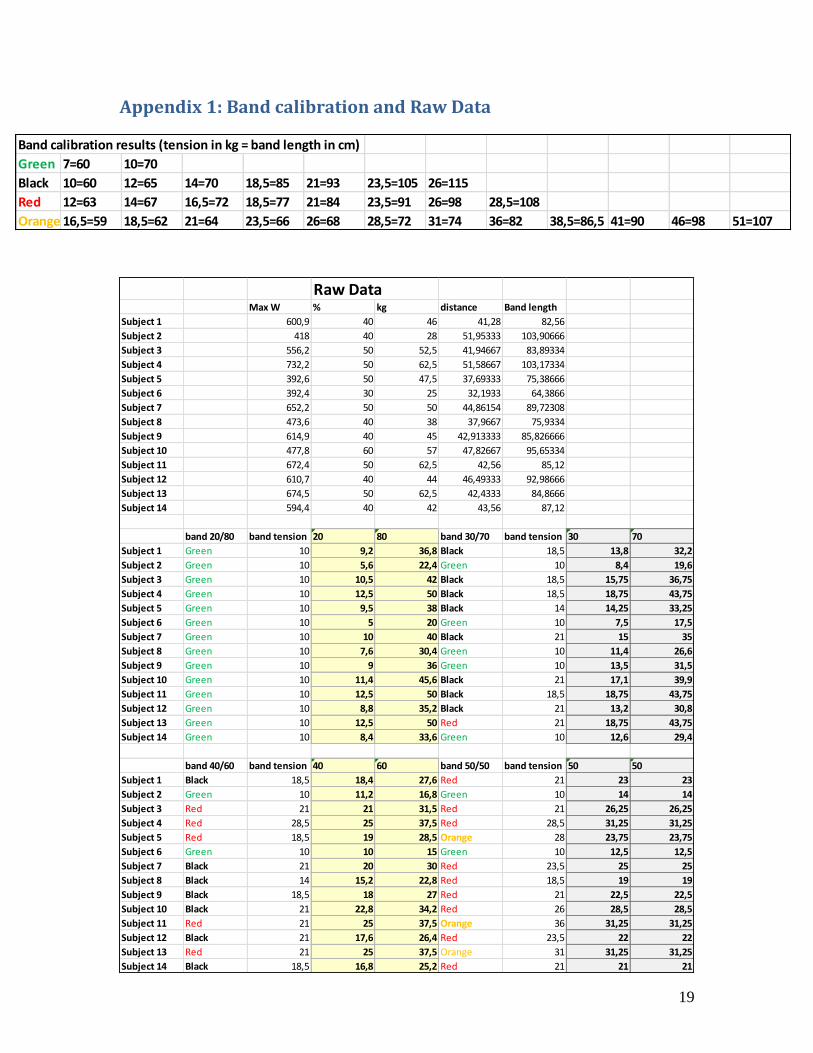
Appendix 1: Band calibration and Raw Data ................................................................... 19
1
Summary Introduction: To date, there are no definitive guidelines as for how to optimally train for
power production. Previously conducted studies are lacking consensus and have reported
conflicting suggestions regarding what loads to use and how to execute the movements.
Finding an optimal method of training for power would be beneficial for power and
strength athletes. Accommodating resistance has been suggested as an effective method
for developing power in athletes. Aim: This study examined how using different amounts
of accommodating resistance influence peak power output in the bench press exercise.
Method: Fourteen subjects tested their 1 repetition maximum (1RM) in the bench press
and after seven days performed a power test consisting of three repetitions with
30,40,50,60 and 70% of 1RM and peak power was recorded using the MuscleLab linear
encoder. A second power test was done seven days later, where the load at which the
highest power was demonstrated was used again and different amounts of that bar weight
was replaced with band resistance. The proportions used were 20:80, 30:70, 40:60 and
50:50 band tension to bar weight. Three repetitions were performed at each of the band
conditions and peak power was recorded. The highest value for each trial was used for
analysis. Results: The average load at which the highest power (553,49±111,62W) was
produced was 46,46kg (43,85±7,68% of 1RM). All of the band conditions except for the
20:80 demonstrated a significant difference in power output compared to bar weight only.
The 50:50 proportions of band tension to bar weight resulted in the highest power
(813,31±252,87W) of the band conditions. Conclusion: These findings indicate that the
use of accommodating resistance results in higher power output than using bar weight
only when the total load is constant. Higher proportions of band tension seem to result in
higher power output compared to lower proportions. These results could offer guidelines
for how to design optimal power training for athletes.
2
Introduction The bench press is a commonly used exercise for developing and testing upper-body
strength and power, and is one of three events in the sport of powerlifting. The bench
press involves laying supine on a bench and holding a barbell at arms’ length, lowering it
to the chest and pressing it back up again. The nature of most barbell lifts, such as the
bench press is that maximal power and acceleration is produced only in the first half of
the lift, after which momentum itself is moving the bar against gravity. When lifting
submaximal loads, the person performing the lift is actually decelerating the movement
during the last third of the lift in order not to overextend the joints, possibly causing
damage to the structures (Clark, Bryant & Humphries, 2008; Newton, Murphy,
Humphries, Wilson, Kraemer & Häkkinen, 1997; Newton, Kraemer, Häkkinen,
Humphries & Murphy, 1996; Castillo, Valverde, Morales, Pérez-Guerra, de León &
García-Manso, 2009).
Analysis of the bench press has indeed revealed an area in the lift where acceleration
tends to slow down, commonly referred to as the sticking point region. This sticking
point can be considered a limiting factor in maximal or near-maximal attempts.
According to Zatsiorsky & Kraemer: “Strength values at the weakest positions, or the so-
called sticking points, are also very important. The heaviest weight that is lifted through
a full range of joint motion cannot be greater than the strength at the weakest point”
(Zatsiorsky & Kraemer, 1995, p41).
The exact underlying causes are still unclear, but several factors influencing this sticking
point have been suggested, such as varying muscle strength in different joint angle
positions because the involved muscles produce different tension. Furthermore, the
moment arms change, making muscular forces act differently at different points
throughout the movement (Zatsiorsky & Kraemer, 1995, p43; Mookerjee & Ratamess,
1999; Van der Tillaar & Ettema, 2010; Elliott, Wilson & Kerr, 1989; Komi, 2003, p444).
Since deceleration of bar speed in the sticking region seems to be related to failing the
lift, a higher power output could allow for increased acceleration from the bottom
position. A higher bar speed when reaching the sticking region could decrease the time
spent in the region and thus minimize deceleration and increase chances of completing
the lift. According to Newton’s second law of motion, force equals mass times
acceleration (F= ma). Power equals force multiplied by velocity (P= F x V), where P is
power, F is force and V is velocity. Force (F) and velocity (V) are inversely related,
which causes maximal power to be achieved when a moderately heavy weight is moved
at moderate speed. Finding these optimal proportions in strength training seems to be
dependent on several factors, including but not limited to strength levels, proficiency in
the lift and muscle fiber composition of the subject (Zatsiorsky & Kraemer,1995, pp31-
33; Moss, Refsnes, Abildgaard, Nicolaysen & Jensen, 1997; Thomas, Kraemer, Spiering,
Volek, Anderson & Maresh, 2007; Aşçi & Açikada, 2007; Stock, Beck, Defreitas &
Dillon, 2010; Kawamori & Haff, 2004; Wilson, Newton, Murphy& Humphries, 1993;
McBride, Triplett-McBride, Davie & Newton, 2002; Castillo, Valverde, Morales, Pérez-
Guerra, de León & García-Manso, 2009; Jandacka &Uchytil, 2011).
3
Another factor influencing power output is the use of the stretch-shortening cycle (SSC).
When a muscle contracts immediately after being stretched, force and power output is
increased and energy expenditure is decreased. This results in greater mechanical force
and power with lower metabolic energy expenditure. Force begins to accumulate during
the eccentric phase, meaning the total time available for force development is greater
which is beneficial for the subsequent concentric phase (Zatsiorsky & Kraemer, 1995,
pp34-35).
Zatsiorsky & Kraemer concluded: “The magnitude of the force produced during the
stretch-shortening muscular action, as well as the magnitude of the stored and recoiled
potential energy of deformation, depends on both the elastic properties of muscles and
tendons and the neural control of muscle activity. The interplay of two spinal reflexes
(stretch reflex and Golgi organ reflex) is considered to be a major factor toward
determining neural inflow to the muscle during the stretch-shortening cycle” (Zatsiorsky
& Kraemer, 1995, p46).
Wilson et al. (1991) found that the effect of the SSC in the bench press diminishes rapidly
with time. However, after a pause of 1,5 seconds between the eccentric and concentric
phases, 30% of the performance augmentation is still in effect. Similarly, after a shorter
pause duration of 0,35 seconds, 75% of the performance augmentation is in effect. This is
something to take into consideration when incorporating the pause in the bench press in
order to standardize the execution of the lift. In order to avoid any performance
enhancement from the SSC, a pause of 4 seconds between the concentric and eccentric
phase would be necessary (Wilson, Elliott & Wood, 1991).
Walshe, Wilson & Ettema (1998) also suggested that the sticking region occurs when the
enhanced force gathered during the eccentric phase and the SSC diminishes, and that
there is a lag time before enough muscular force is produced to overcome this sticking
region. Maximal strength seems to have a positive effect on power production, even at
light loads such as 10% of 1RM (Peterson, Alvar & Rhea, 2006; Kawamori & Haff,
2004).
Methods for increasing maximal strength There are several ways to develop maximal strength, including but not limited to lifting a
maximal or near-maximal load, lifting submaximal loads explosively and lifting
submaximal loads repeatedly until exhaustion. Using a maximal or near-maximal load
allows the maximal number of motor units (MUs) to be recruited, including the fastest
and strongest type 2 MUs, according to Henneman’s size principle (Henneman, Somjen
& Carpenter, 1965).
This results in an optimal discharge frequency of motoneurons and motoneuron activity is
synchronized. When lifting a submaximal load (less than 80% of 1RM) only a portion of
the total MUs are recruited. The fastest and strongest MUs are not recruited, and the
frequency of neural stimulation is not optimal, and MU activity is asynchronous
(Zatsiorsky & Kraemer, 1995, p75; McArdle, Katch & Katch, 2010, p392; Kawamori &
Haff, 2004).
Lifting a maximal or near-maximal load is arguably the most effective method to increase
maximal strength (Kawamori & Haff, 2004).
Maximal strength does not, however, influence how fast the muscle contracts, also known
as rate of force development (RFD). Since it takes at least 0,3-0,4 seconds to develop
4
maximal force, RFD will not be the limiting factor in maximal strength (Komi, 2003,
pp440, 443).
Furthermore, working with maximal or near-maximal weights can increase the risk of
injury, technical breakdown and excessive fatigue. An alternative is therefore to use
submaximal weights. Even if the single goal is to develop maximal strength, using
submaximal loads for power training is useful for training RFD (Komi, 2003, p443).
It is also a way to incorporate the lift in a program more frequently without taxing the
body and nervous system as much as maximal lifting does. Mechanical efficiency in the
lift is developed when practiced frequently, and both explosive and repeated submaximal
lifting is suitable for this. Submaximal explosive lifting has thus been shown to have a
positive effect on maximal strength (Smilios, Sotiropoulos, Christou, Douda, Spaias &
Tokmakidis, 2013; Moss, Refsnes, Abildgaard, Nicolaysen & Jensen, 1997; McBride et
al, 2002).
When using a submaximal load and trying to apply maximal force and move the bar
explosively, the force applied to the barbell is greater than the weight lifted and the bar is
accelerated. This has been shown to increase MU recruitment, similar to a maximal or
near-maximal lifting (Swinton, Lloyd, Aqouris, & Stewart, 2009).
In the later phase of the lift, the built-up momentum itself is moving the barbell into
completion of the lift. The force decreases and the barbell decelerates. As a result of this,
only the first part of the lift where the force production is accentuated is similar to a
maximal or near-maximal lift, where the force applied is constant. This makes explosive
submaximal training less effective for maximal strength training than using near-maximal
loads (Zatsiorsky & Kraemer, 1995, pp75-76).
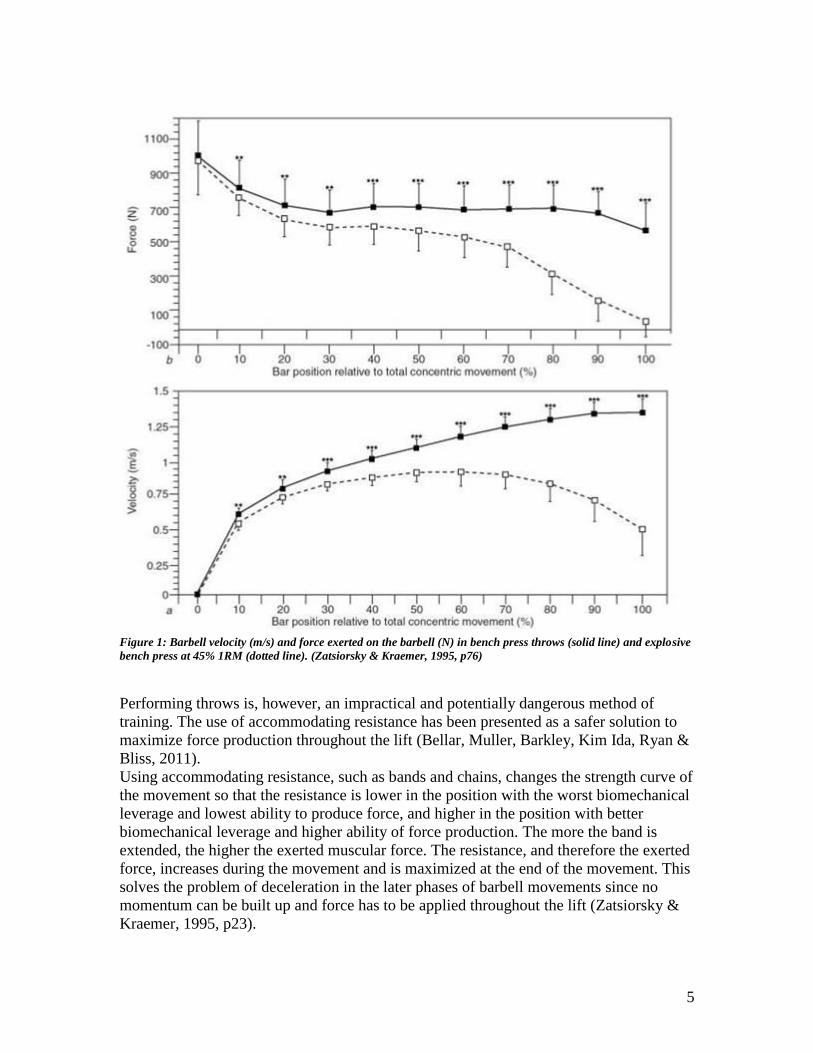
Performing ballistic movements, such as bench press throws, instead of explosive lifting
has been presented as a solution to this problem. During submaximal explosive lifting
there is an involuntary deceleration at the end of the lift, possibly a protective mechanism
not to overextend and damage joint structures. This does not occur when performing
throws, resulting in higher velocity and force during the final stages of the movement
(Zatsiorsky & Kraemer, 1995, p76; Newton et al, 1996; Newton et al, 1997; Kawamori &
Haff, 2004).
This can be seen in Figure 1.
5
Figure 1: Barbell velocity (m/s) and force exerted on the barbell (N) in bench press throws (solid line) and explosive
bench press at 45% 1RM (dotted line). (Zatsiorsky & Kraemer, 1995, p76)
Performing throws is, however, an impractical and potentially dangerous method of
training. The use of accommodating resistance has been presented as a safer solution to
maximize force production throughout the lift (Bellar, Muller, Barkley, Kim Ida, Ryan &
Bliss, 2011).
Using accommodating resistance, such as bands and chains, changes the strength curve of
the movement so that the resistance is lower in the position with the worst biomechanical
leverage and lowest ability to produce force, and higher in the position with better
biomechanical leverage and higher ability of force production. The more the band is
extended, the higher the exerted muscular force. The resistance, and therefore the exerted
force, increases during the movement and is maximized at the end of the movement. This
solves the problem of deceleration in the later phases of barbell movements since no
momentum can be built up and force has to be applied throughout the lift (Zatsiorsky &
Kraemer, 1995, p23).
6
In the bench press the biomechanically weakest position is in the bottom of the lift, when
the bar is the closest to the chest, and becomes more advantageous the more the arms are
straightened and the more the bar is lifted upwards (Castillo, Valverde, Morales, Pérez-
Guerra, de León & García-Manso, 2009).
The use of accommodating resistance also influences the eccentric phase of the
movement. Extra force is required in the eccentric phase just before reversing the
movement into the concentric phase, since the added band tension is pulling the barbell
downward with more acceleration from the top position (Wallace, Winchester &
McGuigan, 2006).
This method of training has been used in the sport of powerlifting in order to improve
power output (Simmons, 1999, p1; Simmons, 2007, p127-135; Swinton, Lloyd, Aqouris,
& Stewart, 2009).
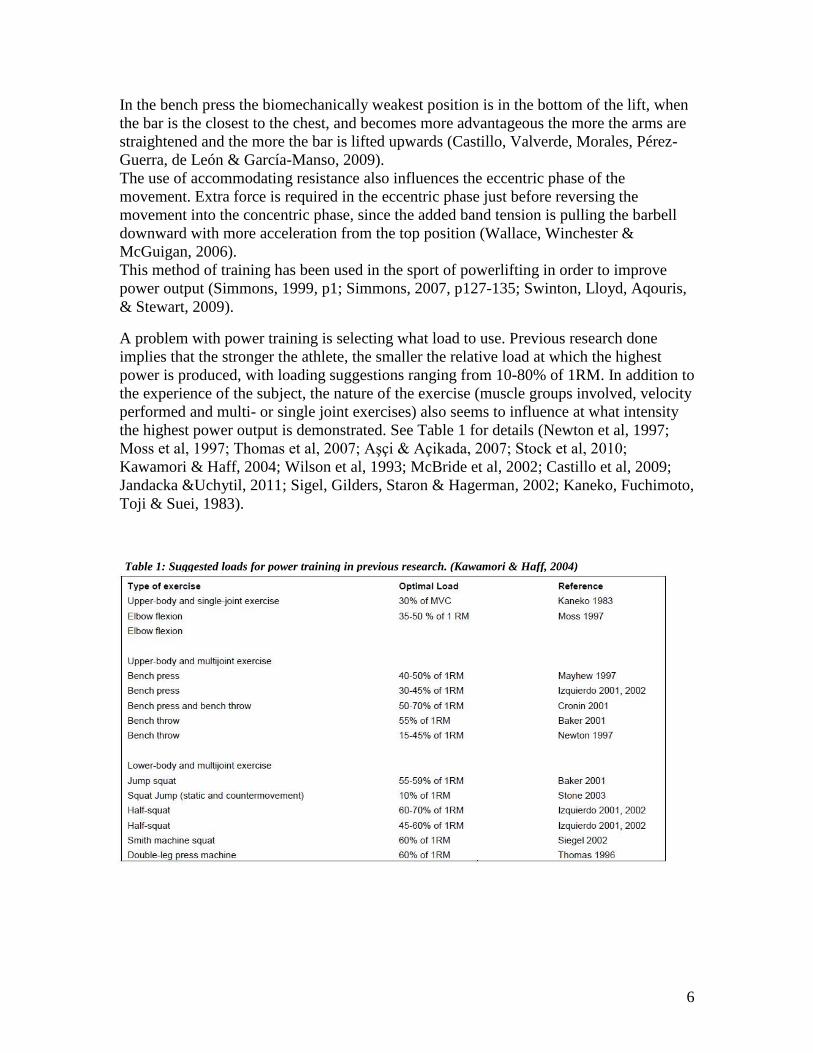
A problem with power training is selecting what load to use. Previous research done
implies that the stronger the athlete, the smaller the relative load at which the highest
power is produced, with loading suggestions ranging from 10-80% of 1RM. In addition to
the experience of the subject, the nature of the exercise (muscle groups involved, velocity
performed and multi- or single joint exercises) also seems to influence at what intensity
the highest power output is demonstrated. See Table 1 for details (Newton et al, 1997;
Moss et al, 1997; Thomas et al, 2007; Aşçi & Açikada, 2007; Stock et al, 2010;
Kawamori & Haff, 2004; Wilson et al, 1993; McBride et al, 2002; Castillo et al, 2009;
Jandacka &Uchytil, 2011; Sigel, Gilders, Staron & Hagerman, 2002; Kaneko, Fuchimoto,
Toji & Suei, 1983).
Table 1: Suggested loads for power training in previous research. (Kawamori & Haff, 2004)
7
Kaneko et al. (1983) did however show that the load at which the highest mechanical
output was produced was also the most effective for increasing maximal muscular power,
and that training at this load did increase power at a wide range of loads. This is
supported by other research (Kaneko et al, 1983; Kawamori & Haff, 2004).
Experimental approach to the problem Because of the lack of consensus regarding an optimal intensity for power training, it was
decided to find out at what intensity (as percentage of 1RM) the highest power output for
each individual is produced. This would eliminate the need of choosing one of the
suggested intensities and relying on it being optimal, and follows the findings of Kaneko
et al. (1983). The second objective was, when that intensity has been established, to find
out the ideal proportions between band resistance and bar weight in order to produce the
highest power. This could answer the question of how much of the total load should
consist of accommodating resistance in the form of band tension for optimal power
training. This could also provide some practical guidelines for how to design power
training for athletes. Previous studies conducted on the squat and bench press have used
band tension consisting of 10, 15 and 20% of the subjects’ 1RM, however, no rationale
was given for this (Ebben & Jensen, 2002; Bellar et al. 2011).
Because of the lack of data, it was decided to test several proportions of band tension to
bar weight in order to find the optimal combination for power.
Aim of the study The aim of the study was to find what intensity and proportions of bar weight to band
resistance produces the highest power output, to be used for optimal power training in the
bench press.
Hypothesis Based on the results of previously conducted studies as well as the anecdotes of using
accommodating resistance in the sport of powerlifting the authors’ hypothesis is that
maximal power output is reached at 50-60% 1RM, and of more interest, that the highest
power will be demonstrated with 20:80 band resistance to bar weight (Anderson, Sforzo
& Sigg, 2008; Wallace, Winchester & McGuigan, 2006; Simmons, 1999, p1; Simmons,
2007, pp126-135).
Method
Subjects Fourteen male subjects volunteered to participate in the study, aged 24,1±1,6 years, with
a height of 181,8±7,8 cm and weight of 82,8±9,3 kg. The test subjects were all
recreationally active with experience of the bench press exercise. Inclusion criteria were
experience of resistance training and performing the bench press exercise and no current
limiting injuries.
Test subjects were recruited through social media, advertising boards and direct contact.
8
Ethical Aspects Before participating, all subjects were informed of the methods used, possible
consequences and risks involved in participating and that basic ethical principles are
followed. Furthermore they were informed that participation is voluntary and can be
aborted at any time, and that the results are confidential. An informed consent was signed
by participants and test leaders before the onset of the study.
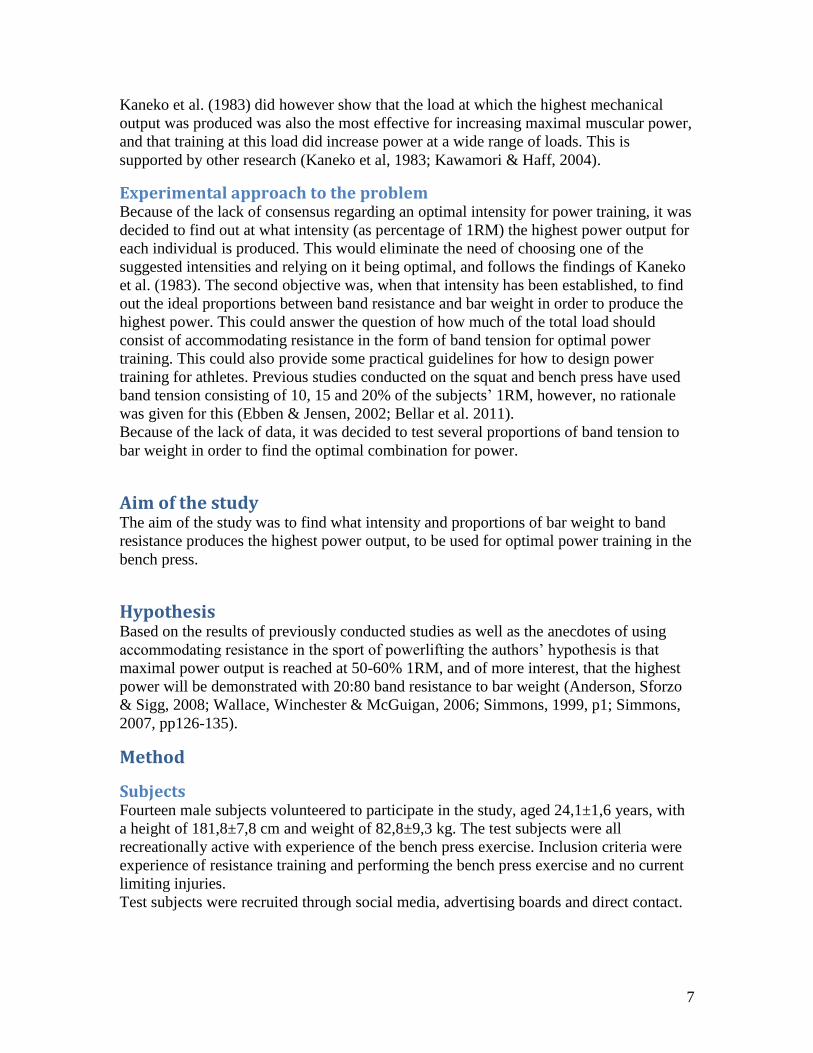
Equipment The MuscleLab linear encoder (Ergotest, Norway) is able to register force, velocity,
distance, peak power and time to peak power. Of these,
peak power and distance were of interest in this
experiment. The MuscleLab linear encoder has previously
been validated as a reliable method of recording and
registering power output (Ravier, 2011; Hansen, Cronin &
Newton, 2011).
It has been used in previous research on the bench press
(van den Tillaar, Saeterbakken & Ettema, 2012).
The linear encoder was attached to the barbell and placed
on the floor directly underneath it, in order to establish a
vertical line so that distance and power output could be
accurately recorded. Calibration of the linear encoder was
performed before the tests according to the
manufacturer’s instructions. Between attempts, the set-up
was controlled and re-set if necessary. Resistance bands
designed for the purpose of strength training were used.
Band resistance at various lengths was assessed following
the protocol presented by Shoepe et al. (2010); Each of
the bands were individually attached to the top of a squat
rack. Resting length was measured, as seen in Figure 2.
Different weights were attached to the free end and the
deformation, measured in centimeters, was recorded. This
was repeated with all bands, to compile a chart of tension
(in kg) for several relevant band lengths (59-115cm). The
longest range of motion displayed by the subjects was
52cm. Since the bands were looped under the bench and
attached to the barbell, the bands were long enough to
provide adequate tension throughout the lift (Shoepe,
Ramirez & Almstedt, 2010).
Exercise execution The International Powerlifting Federation (IPF) has provided a set of rules for performing
the bench press in competition. The bar is lifted out from the rack and held at straight
arms with the elbows locked until a down signal is given from the referee. In order to get
this signal the lifter must show control and the weight kept motionless. After the signal,
the lifter lowers the bar to the chest and holds it motionless until a press signal is given
from the referee. The bar is then pressed up to straight arms in a constant motion without
dips and held with locked elbows until a rack signal is given from the referee. The lifter
Figure 2: Calibration of bands using
protocol by Shoepe et al. (2010)
9
then puts the bar back into the rack. At all times must the lifter’s head, shoulders and
buttocks keep in contact with the bench and the whole sole of the feet be kept on the
ground. The feet may not make contact with the bench or its supports, and the bar may
not make contact with the bar rest supports. The bar may not be sunk down into the chest
or abdominal area and heaved up, and the grip on the bar may not be changed during the
lift (IPF Technical Rules Book, 2013, p18).
Test procedure The subjects performed three different tests on three different days, with one week of rest
in between in order to ensure adequate recovery. The tests were performed at the same
time of day at each occasion. IPF competition rules were used for the execution of the
bench press, with the exclusion of signals from the referee.
The first day body weight, length, chronological age and training age was recorded.
The subjects were informed of the desired execution of the bench press exercise, and the
lift was demonstrated. A standardized warm-up routine was performed, consisting of five
repetitions at 20, 40, 60, and 80 percent of estimated 1RM. After this, the subjects
performed one repetition at a progressively heavier load (an increase of 1-5kg per set)
with 4-5 minutes of rest in between sets, in order to guarantee optimal performance. The
load was increased progressively until the subjects reached their 1RM and failed the
following attempt at a heavier load (McArdle, Katch & Katch, 2010, pp492-495, 2010;
Zatsiorsky & Kraemer, 1995, p93).
The second day a power-test in the bench press exercise was performed. Three repetitions
were performed at 30, 40, 50, 60 and 70 percent of 1RM with the intention of reaching
maximal velocity. Thus, the pause on the chest was eliminated and subjects were
instructed to reverse the motion as fast as possibly while not bouncing but still touching
the chest. Peak power and distance for each set was recorded using the MuscleLab.
Subjects were given two to three minutes of rest in between sets. No specific warmup
protocol was used because of the relatively light loads used. The protocol is based on the
findings of previous studies, where maximal power output was reached at 30-60% of
1RM, depending on the experience of the subjects (McArdle, Katch & Katch, 2010,
pp502-503).
The third day, the load at which the subjects each produced the highest power output was
used, and accommodating resistance was introduced. The bands were attached to the bar
with both ends and looped under the bench, according to the protocol outlined by Shoepe
et al. (2010). The bands were re-set between each attempt in order to ensure a
standardized set-up for each subject. Keeping the absolute load constant, the distribution
between band tension and bar weight was changed and different proportions of band
tension to bar weight was used to perform a second power test. Following the same
protocol from the previous power test, three repetitions were performed at the same load
with approximately 20:80, 30:70, 40:60 and 50:50 band resistance to bar weight. Peak
power for each set was recorded using the MuscleLab.
10
Statistical analysis The criterion level for significance was set at p≤0,05. Using IBM SPSS Statistics v20, a
Shapiro-Wilks test was performed to check for normal distribution. This was followed by
comparing mean, median and mode values to see if the values were approximately
related. The data was compiled into a graph to see if the columns visually represent the
normal distribution. All three of the tests were negative, proving that the data was not
normally distributed. Thus, a Friedman test was performed, comparing the values
between all of the conditions. A significant difference between groups (Sig p<0,0001)
was found and in order to decide which of the groups that were significantly different
from each other a Wilcoxon signed rank-test was performed between the Bar Only-
condition and each of the band conditions. Because multiple comparisons (four) were
made, a Bonferroni correction was used to adjust the p-value to 0,0125 in order to
minimize the risk of type-1 error.
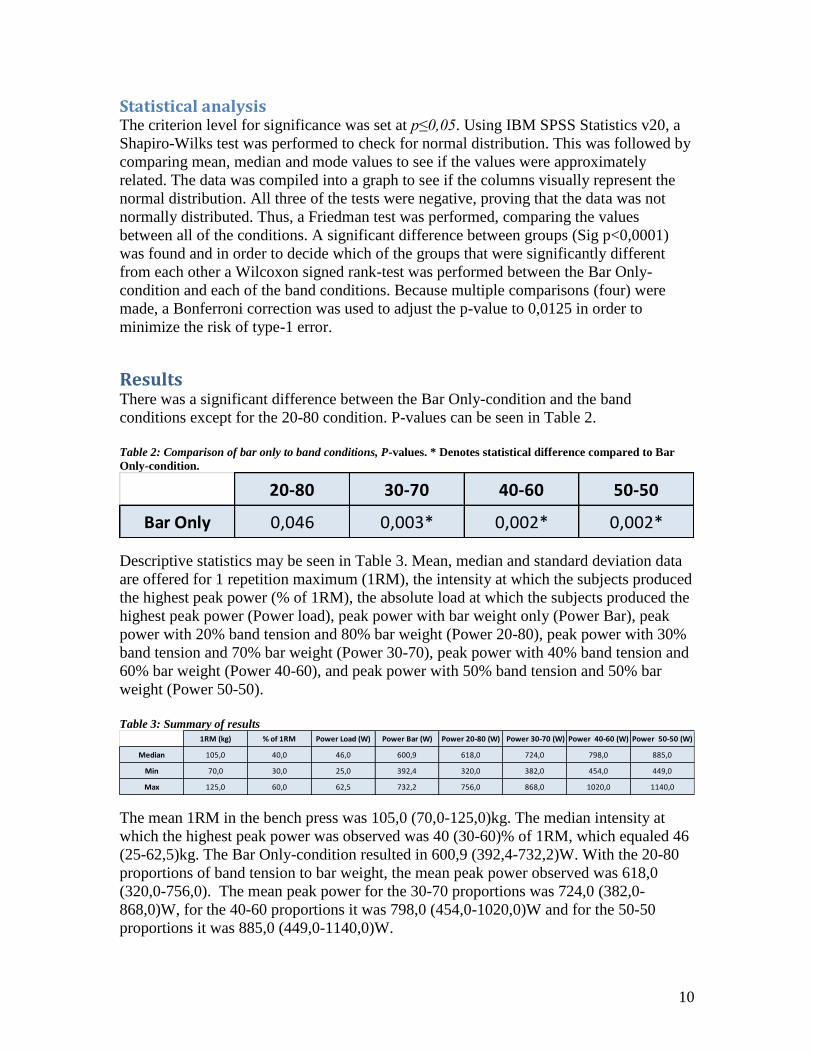
Results There was a significant difference between the Bar Only-condition and the band
conditions except for the 20-80 condition. P-values can be seen in Table 2.
Table 2: Comparison of bar only to band conditions, P-values. * Denotes statistical difference compared to Bar
Only-condition.
Descriptive statistics may be seen in Table 3. Mean, median and standard deviation data
are offered for 1 repetition maximum (1RM), the intensity at which the subjects produced
the highest peak power (% of 1RM), the absolute load at which the subjects produced the
highest peak power (Power load), peak power with bar weight only (Power Bar), peak
power with 20% band tension and 80% bar weight (Power 20-80), peak power with 30%
band tension and 70% bar weight (Power 30-70), peak power with 40% band tension and
60% bar weight (Power 40-60), and peak power with 50% band tension and 50% bar
weight (Power 50-50).
Table 3: Summary of results
The mean 1RM in the bench press was 105,0 (70,0-125,0)kg. The median intensity at
which the highest peak power was observed was 40 (30-60)% of 1RM, which equaled 46
(25-62,5)kg. The Bar Only-condition resulted in 600,9 (392,4-732,2)W. With the 20-80
proportions of band tension to bar weight, the mean peak power observed was 618,0
(320,0-756,0). The mean peak power for the 30-70 proportions was 724,0 (382,0-
868,0)W, for the 40-60 proportions it was 798,0 (454,0-1020,0)W and for the 50-50
proportions it was 885,0 (449,0-1140,0)W.
20-80 30-70 40-60 50-50
Bar Only 0,046 0,003* 0,002* 0,002*
1RM (kg) % of 1RM Power Load (W) Power Bar (W) Power 20-80 (W) Power 30-70 (W) Power 40-60 (W) Power 50-50 (W)
Median 105,0 40,0 46,0 600,9 618,0 724,0 798,0 885,0
Min 70,0 30,0 25,0 392,4 320,0 382,0 454,0 449,0
Max 125,0 60,0 62,5 732,2 756,0 868,0 1020,0 1140,0
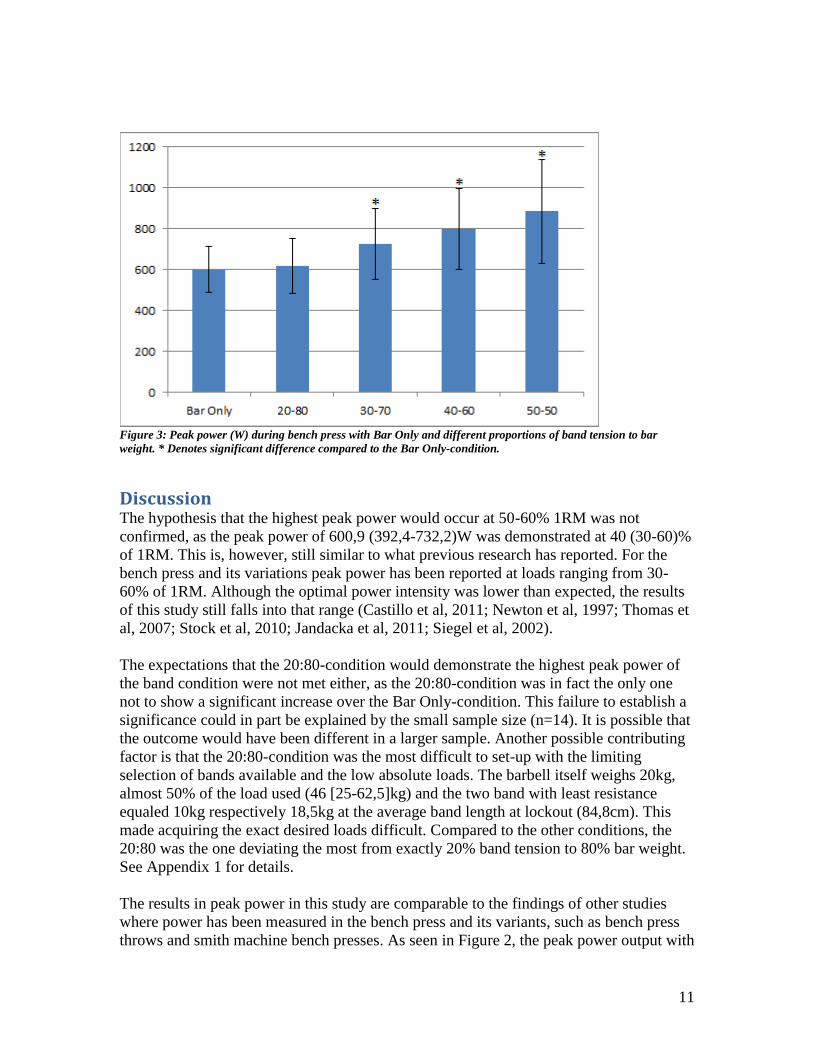
11
Figure 3: Peak power (W) during bench press with Bar Only and different proportions of band tension to bar
weight. * Denotes significant difference compared to the Bar Only-condition.
Discussion The hypothesis that the highest peak power would occur at 50-60% 1RM was not
confirmed, as the peak power of 600,9 (392,4-732,2)W was demonstrated at 40 (30-60)%
of 1RM. This is, however, still similar to what previous research has reported. For the
bench press and its variations peak power has been reported at loads ranging from 30-
60% of 1RM. Although the optimal power intensity was lower than expected, the results
of this study still falls into that range (Castillo et al, 2011; Newton et al, 1997; Thomas et
al, 2007; Stock et al, 2010; Jandacka et al, 2011; Siegel et al, 2002).
The expectations that the 20:80-condition would demonstrate the highest peak power of
the band condition were not met either, as the 20:80-condition was in fact the only one
not to show a significant increase over the Bar Only-condition. This failure to establish a
significance could in part be explained by the small sample size (n=14). It is possible that
the outcome would have been different in a larger sample. Another possible contributing
factor is that the 20:80-condition was the most difficult to set-up with the limiting
selection of bands available and the low absolute loads. The barbell itself weighs 20kg,
almost 50% of the load used (46 [25-62,5]kg) and the two band with least resistance
equaled 10kg respectively 18,5kg at the average band length at lockout (84,8cm). This
made acquiring the exact desired loads difficult. Compared to the other conditions, the
20:80 was the one deviating the most from exactly 20% band tension to 80% bar weight.
See Appendix 1 for details.
The results in peak power in this study are comparable to the findings of other studies
where power has been measured in the bench press and its variants, such as bench press
throws and smith machine bench presses. As seen in Figure 2, the peak power output with
12
bar only and the different band conditions range from 600,9 (392,4-732,2)W for the bar
only to 885,0 (449,0-1140,0)W for the 50:50 condition. Castillo et al. (2009) compiled
the results in peak power output from several studies and the results range from
437,0±138,6W to ~820,0W, depending on what type of bench press was performed in the
test. Generally concentric-only bench press was correlated with higher peak power output
than eccentric followed by concentric with the use of SSC (Castillo et al, 2009).
On the other hand, results from power tests with bench press throws have resulted in
higher peak power than regular bench press performance, and the use of SSC further
enhanced the power output in throws compared to concentric-only throws (Newton et al,
1997).
This suggests that explosive submaximal bench press with accommodating resistance is
able to achieve the same power output as bench press throws, though arguably in a safer
and more practical way. One of the advantages over bench press throws is that
accommodating resistance allows for performing subsequent repetitions, whereas
catching a barbell after a throw could potentially be dangerous.
Bellar et al. (2011) used 15% band tension to 85% bar weight and demonstrated greater
increases in 1RM in the squat in untrained subjects compared to bar weight only (Bellar
et al, 2011).
Anderson et al. (2008) used the 20:80-condition during a seven week intervention and
demonstrated greater increases in 1RM bench press and back squat compared to bar
weight only (Anderson, Sforzo & Sigg, 2008).
This is conflicting to the results of this study where the 20:80-condition failed to show a
significant increase in power output compared to the Bar Only-condition, whereas the
conditions with higher amounts of band tension did. While the 20:80-condition failed to
show a significant increase in power output compared to bar weight only during this trial,
it doesn’t rule out the possibility that it is effective for increasing strength over a period
of time. Following the results of this study and previous research by Bellar et al. (2011)
and Anderson et al. (2008) it would be plausible that an intervention using higher
amounts of accommodating resistance than previously studied could result in greater
increases in maximal strength compared to the protocols previously used. For example,
using the training protocol by Anderson et al. (2008) with higher amounts of band tension
than previously used would be of interest.
Study limitations A major confounding factor in this study is that the authors failed to take into
consideration that the calculated resistance of the bands was at arms’ length when the lift
is finished, meaning that there is actually less resistance than that during the earlier parts
of the lift. This results in lower average resistance during the band trials compared to the
bar only-trials. This exaggerates the effects of band resistance on power production, since
the linear encoder registers the banded load as still having the same weight as the bar
weight only, whereas it is in fact lighter and therefore naturally moved with higher
velocity. This problem becomes more accentuated as more band resistance is used, which
may partly explain the results in this study, where the 50:50-condition shows significantly
higher power than the 20:80-condition. Wallace et al. (2006) solved this problem by
setting up the bands so that the total resistance in the bottom was 10% lower in the
bottom and 10% higher at the top compared to bar weight only. This resulted in the same
13
average resistance for both conditions. Other studies using accommodating resistance
have failed to correct for this mathematical error altogether (Wallace, Winchester &
McGuigan, 2006).
Furthermore, even if this had been taken into consideration, the selection of resistance
band was limited; making it was difficult to attain the exact desired amount of tension at
specific lengths, as well as exact proportions between bands and bar weight.
Because of the limited selection of bands, trials with more band tension than bar weight
(greater than 50:50) were not done, which could be a limitation. There seems to be some
evidence for more pronounced positive effects on power and force production when
resistance bands make up greater percentages of the total load (Wallace, Winchester &
McGuigan, 2006).
It is possible that the order in which the tests with different band conditions were
performed could have influenced the outcome. Post-activation potentiation (PAP) is a
phenomenon where pre-loading the involved muscles result in a short-term improvement
in muscular power. Multiple sets of potentiation at moderate intensities (60-84% of 1RM)
with moderate rest periods (7-10 minutes) have been shown to optimize PAP (Wilson,
Duncan, Marin, Brown, Loenneke, Wilson, Jo, Lowery & Ungrinowitsch, Published
ahead of print).
These conditions are similar to the test protocol used in this study, where the intensity
successively raised. This could have resulted in the subjects being more potentiated
during the last set(s), both during the first power test with different loads and the second
power test with different band conditions. The effect of PAP should not, however, be as
pronounced as the overall intensities used in this study were lower than the optimal 60-
84% of 1RM and the rest periods were shorter.
Another limitation to the study was the low amount of subjects (n=14), making it more
difficult to discover statistical differences. There was no control or standardization of the
subjects’ diet, sleep, supplement use and other possibly conflicting activities other than
that the subjects were asked to abstain from exercising the day before the trials. This may
also have influenced the results.
Comparing our test protocol, execution of exercise and results with other studies could
prove problematic since this study used a free barbell bench press, whereas other studies
have used both smith machines and free weights, as well as other exercises such as the
squat. The force curve and muscle action (eccentric followed by concentric) of the squat
is, however, similar to the bench press, which is why they were included. Studies using
other exercises with resistance bands were discarded though.
Study strengths The authors managed to standardize the execution of the bench press exercise as well as
the set-up with the resistance bands, providing similar conditions for every subject at all
occasions during the study. There was sufficient time for recovery between the three
trials, allowing the participants to perform optimally. The linear encoder by MuscleLab
used in this study is a previously validated and reliable tool for measuring the desired
qualities (Ravier, 2011; Hansen, Cronin & Newton, 2011).
14
Practical applications It has been suggested that there is not necessarily a single optimal load for the
development of power, and that monotonous training at the same intensity would be
subpar compared to varying the load, i.e. periodization of the power training (Kawamori
& Haff, 2004).
A way of applying this information practically in training could be varying both the load
and the amount of band tension in cycles, while the total load constantly remains in the
suggested power zone of 30-50% of 1RM (Castillo et al, 2011; Newton et al, 1997;
Thomas et al, 2007; Stock et al, 2010; Jandacka et al, 2011; Siegel et al, 2002).
Furthermore, based on the results of this study where more band tension was correlated
with higher power, an argument could be made for using large amounts of band tension
when training for power in the bench press.
Conclusion The results of this study showed that the use of accommodating resistance in the bench
press augments power output during submaximal explosive lifting, compared to using bar
weight only when absolute load is matched. The results indicate that more band tension
was correlated with higher power output. The hypothesis that the 20:80 condition would
demonstrate the highest peak power of the band condition was not confirmed, as the
20:80 condition was in fact the only one not to show a significant increase over using bar
weight only.
15
References 1. Komi, P.V. Strength and power in sports, 2nd ed., Oxford, UK, Blackwell Science Ltd,
2003.
2. McArdle, W.D., Katch, F.I., Katch, V.L, Exercise Physiology 7th
ed, Lippincott
Williams&Wilkins, Philadelphia, 2010.
3. Zatsiorsky, V.M. Science and Practice of Strength Training. Champaign, IL. Human
Kinetics, 1995.
4. Simmons, L.P. The Westside barbell book of methods 1st edition. Action Printing, 2007
(PDF).
5. IPF Technical Rules Book (2013), http://www.powerlifting-
ipf.com/fileadmin/data/Technical_Rules/2013_Technical_Rules_english.pdf. [Accessed
2013-05-20]
6. Anderson, C.E., Sforzo, G.A., Sigg, J.A. (2008) The effects of combining elastic and
free weight resistance on strength and power in athletes. Journal of Strength and
Conditioning Research, Vol. 22, Iss. 2, Pp. 567-574.
7. Aşçi, A., Açikada C. (2007) Power production among different sports with similar
maximum strength. Journal of Strength and Conditioning Research, Vol. 21, Iss. 1, Pp.
10-16.
8. Bellar, D.M., Muller, M.D., Barkley, J.E., Kim, C-H., Ida, K., Ryan, E.J., Bliss, M.V.
(2011) The Effects of Combined Elastic and Free-Weight Tension Vs. Free-Weight
Tension on One-Repetition Maximum Strength in the Bench Press. Journal of Strength
and Conditioning Research, Vol. 25, Iss. 2, Pp. 459-463.
9. Castillo, F., Valverde, T., Morales, A., Pérez-Guerra, A., de León, F., García-Manso,
J.M. (2009) Maximum power, optimal load and optimal power spectrum for power
training in upper-body (bench press): a review. Revista Andaluza de Medicina del
Deporte, Vol. 2, Iss. 4, Pp. 18-27.
10. Clark, R.A., Bryant, A.L., Humphries, B. (2008) A comparison of force curve profiles
between the bench press and ballistic bench throws. Journal of Strength and Conditioning
Research, Vol. 22, Iss. 6, Pp. 1755-1759.
11. Cronin, J.B., McNair, P.J., Marshall, R.N. (2003) Force-velocity analysis of strength
training techniques and load: Implications for training strategy and research. Journal of
Strength and Conditioning Research, Vol. 17, Pp. 148–155.
12. Ebben, W.P., Jensen, R.L. (2002) Electromyopgraphic and kinetic analysis of
traditional, chain and elastic band squats. Journal of Strength and Conditioning
Research, Vol. 16, Iss. 4, Pp. 457-550.
16
13. Elliott, B.C., Wilson, G.J., Kerr, G.K. (1989) A biomechanical analysis of the sticking
region in the bench press. Medicine and science in sports and exercise, Vol. 21, Iss. 4,
Pp.450-462.
14. Hansen, K.T., Cronin, J.B., Newton, M.J. (2011) The reliability of linear position
transducer and force plate measurement of explosive force-time variables during a
loaded jump squat in elite athletes. Journal of Strength and Conditioning Research, Vol.
25, Iss. 4, Pp. 1447-1456.
15. Henneman, E., Somjen, G., Carpenter, D.O. (1965) Excitability and inhibitibility of
motoneurons of different sizes. Journal of Neurophysiology, Vol. 28, Pp. 599-620.
16. Jandacka, D., Uchytil, J. (2011) Optimal load maximizes the mean mechanical power
output during upper extremity exercise in highly trained soccer players. Journal of
Strength and Conditioning Research, Vol. 25, Iss. 10, Pp. 2764-2772.
17. Kaneko, M., Fuchimoto, T., Toji, H., Suei, K. (1983) Training effect of different loads
on the force-velocity relationship and mechanical power output in human muscle.
Scandinavian Journal of Sports Science, Vol. 5, Iss. 2, Pp. 50-55.
18. Kawamori, N., Haff, G.G. (2004) The optimal training load for the development of
muscular power. Journal of Strength and Conditioning Research, Vol. 18, Iss. 3, Pp.675-
684.
19. McBride, J.M., Triplett-McBride, T., Davie, A., Newton, R.U. (2002) The effect of
heavy- vs. light-load jump squats on the development of strength, power, and speed.
Journal of Strength and Conditioning Research, Vol. 16, Iss. 1, Pp. 75-82.
20. Mookerjee, S., Ratamess, N. (1999) Comparison of strength differences and joint
action durations between full and partial range of motion bench press exercise. Journal
of Strength and Conditioning Research, Vol. 13, Iss. 1, Pp. 76-81.
21. Moss, B.M., Refsnes, P.E., Abildgaard, A., Nicolaysen, K., Jensen, J. (1997) Effects
of maximal effort strength training with different loads on dynamic strength, cross-
sectional area, load-power and load-velocity relationships. European Journal of Applied
Physiology and Occupational Physiology, Vol.75, Iss.3, Pp.193-199.
22. Newton, R.U., Kraemer, W.J., Häkkinen, K., Humphries, B.J., Murphy, A.J. (1996)
Kinematics, kinetics, and muscle activation during explosive upper body movements.
Journal of Applied Biomechanics, Vol. 12, Pp. 31–43.
23. Newton, R.U., Murphy, A.J., Humphries, B.J., Wilson, G.J., Kraemer, W.J.,
Häkkinen, K. (1997) Influence of load and stretch shortening cycle on the kinematics,
kinetics and muscle activation that occurs during explosive upper-body movements.
European Journal of Applied Physiology and Occupational Physiology, Vol. 75, Iss. 4,
Pp. 333-342.
17
24. Peterson, M.D., Alvar, B.A., Rhea, M.R. (2006) The contribution of maximal force
production to explosive movement among young collegiate athletes. Journal of Strength
and Conditioning Research, Vol. 20, Iss. 4, Pp. 867-73.
25. Ravier, G. (2011) Reliability and reproducibility of two different inertial
dynamometers for determining muscular profile. Computer Methods in Biomechanics
and Biomedical Engineering, Vol. 14, Iss.1, Pp. 211-213.
26. Shoepe, T.C., Ramirez, D.A., Almstedt, H.C. (2010) Elastic band prediction
equations for combined free-weight and elastic band bench presses and squats. Journal of
Strength and Conditioning Research,Vol. 24, Iss. 1, Pp. 195-200.
27. Sigel, J.A., Gilders, R.M., Staron, R.S., Hagerman, F.C. (2002) Human Muscle Power
Output During Upper and Lower-Body Exercises. Journal of Strength and Conditioning
Research, Vol. 16, Iss. 2, Pp. 173–178.
28. Smilios, I., Sotiropoulos, K., Christou, M., Douda, H., Spaias, A., Tokimadis, S.P.
(2013) Maximum power training load determination and its effects on load-power
relationship, maximum strength, and vertical jump performance. Journal of Strength and
Conditioning Research, Vol. 27, Iss. 5, Pp. 1223-1233.
29. Stock, M.S., Beck, T.W., Defreitas, J.M., Dillon, M.A. (2010) Relationships among
peak power output, peak bar velocity, and mechanomyographic amplitude during the
free-weight bench press exercise. Journal of Sports Sciences, Vol. 28, Iss. 12, Pp. 1309-
1317.
30. Swinton, P.A., Lloyd, R., Aqouris, I., Stewart, A. (2009) Contemporary training
practices in elite British powerlifters: survey results from an international competition.
Journal of Strength and Conditioning Research, Vol. 23, Iss. 2, Pp. 380-384.
31. Thomas, G.A., Kraemer, W.J., Spiering, B.A., Volek, J.S., Anderson, J.M., Maresh,
C.M. (2007) Maximal power at different percentages of one repetition maximum:
influence of resistance and gender. Journal of Strength and Conditioning Research, Vol.
21, Iss. 2, Pp. 336-342.
32. van der Tillaar R., Ettema, G. (2010) The “sticking period” in a maximum bench
press. Journal of Sports Sciences, Vol. 28, Iss. 5, Pp. 529–535.
33. van den Tillaar, R., Saeterbakken, A.H. & Ettema, G. (2012) Is the occurrence of the
sticking region the result of diminishing potentiation in bench press. Journal of Sports
Science, Vol. 30, Iss. 6, Pp. 591-599.
34. Wallace, B.J., Winchester, J.B., McGuigan, M.R. (2006) Effects of elastic bands on
force and power characteristics during the back squat exercise. Journal of Strength and
Conditioning Research, Vol. 20, Iss. 2, Pp. 268-272.
18
35. Walshe, A.D., Wilson, G.J., & Ettema, G. (1998). Stretch-shorten cycle as compared
to isometric preload: Contributions to enhanced muscular performance. Journal of
Applied Physiology, Vol. 84, Pp. 97–106.
36. Wilson, G.J., Elliott, B.C., Wood, G.A. (1991) The effect of performance of imposing
a delay during a stretch-shorten cycle movement. Medicine and Science in Sports and
Exercise, Vol. 23, Iss. 3, Pp. 364-370.
37. Wilson, G.J., Newton, R.U., Murphy, A.J., Humphries, B.J. (1993) The optimal
training load for the development of dynamic athletic performance. Medicine and
Science in Sports and Exercise. Vol. 25, Iss. 11, Pp.1279-1286.
38. Wilson, J.M., Duncan, N.M., Marin, P.J., Brown, L.E., Loenneke, J.P., Wilson, M.C.,
Jo, E., Lowery, R.P., Ungrinowitsch, C. (Published Ahead of Print) Meta-Analysis of Post
Activation Potentiation and Power: Effects of Conditioning Acitivity, Volume, Gender,
Rest Periods and Training Status. Journal of Strength and Conditioning Research.
39. Simmons, L.P. Chains and bands. Powerlifting USA. Vol. 22, Iss. 6, Pp. 26–27. 1999.
19
Band calibration results (tension in kg = band length in cm)
Green 7=60 10=70
Black 10=60 12=65 14=70 18,5=85 21=93 23,5=105 26=115
Red 12=63 14=67 16,5=72 18,5=77 21=84 23,5=91 26=98 28,5=108
Orange 16,5=59 18,5=62 21=64 23,5=66 26=68 28,5=72 31=74 36=82 38,5=86,5 41=90 46=98 51=107
Raw DataMax W % kg distance Band length
Subject 1 600,9 40 46 41,28 82,56
Subject 2 418 40 28 51,95333 103,90666
Subject 3 556,2 50 52,5 41,94667 83,89334
Subject 4 732,2 50 62,5 51,58667 103,17334
Subject 5 392,6 50 47,5 37,69333 75,38666
Subject 6 392,4 30 25 32,1933 64,3866
Subject 7 652,2 50 50 44,86154 89,72308
Subject 8 473,6 40 38 37,9667 75,9334
Subject 9 614,9 40 45 42,913333 85,826666
Subject 10 477,8 60 57 47,82667 95,65334
Subject 11 672,4 50 62,5 42,56 85,12
Subject 12 610,7 40 44 46,49333 92,98666
Subject 13 674,5 50 62,5 42,4333 84,8666
Subject 14 594,4 40 42 43,56 87,12
band 20/80 band tension 20 80 band 30/70 band tension 30 70
Subject 1 Green 10 9,2 36,8 Black 18,5 13,8 32,2
Subject 2 Green 10 5,6 22,4 Green 10 8,4 19,6
Subject 3 Green 10 10,5 42 Black 18,5 15,75 36,75
Subject 4 Green 10 12,5 50 Black 18,5 18,75 43,75
Subject 5 Green 10 9,5 38 Black 14 14,25 33,25
Subject 6 Green 10 5 20 Green 10 7,5 17,5
Subject 7 Green 10 10 40 Black 21 15 35
Subject 8 Green 10 7,6 30,4 Green 10 11,4 26,6
Subject 9 Green 10 9 36 Green 10 13,5 31,5
Subject 10 Green 10 11,4 45,6 Black 21 17,1 39,9
Subject 11 Green 10 12,5 50 Black 18,5 18,75 43,75
Subject 12 Green 10 8,8 35,2 Black 21 13,2 30,8
Subject 13 Green 10 12,5 50 Red 21 18,75 43,75
Subject 14 Green 10 8,4 33,6 Green 10 12,6 29,4
band 40/60 band tension 40 60 band 50/50 band tension 50 50
Subject 1 Black 18,5 18,4 27,6 Red 21 23 23
Subject 2 Green 10 11,2 16,8 Green 10 14 14
Subject 3 Red 21 21 31,5 Red 21 26,25 26,25
Subject 4 Red 28,5 25 37,5 Red 28,5 31,25 31,25
Subject 5 Red 18,5 19 28,5 Orange 28 23,75 23,75
Subject 6 Green 10 10 15 Green 10 12,5 12,5
Subject 7 Black 21 20 30 Red 23,5 25 25
Subject 8 Black 14 15,2 22,8 Red 18,5 19 19
Subject 9 Black 18,5 18 27 Red 21 22,5 22,5
Subject 10 Black 21 22,8 34,2 Red 26 28,5 28,5
Subject 11 Red 21 25 37,5 Orange 36 31,25 31,25
Subject 12 Black 21 17,6 26,4 Red 23,5 22 22
Subject 13 Red 21 25 37,5 Orange 31 31,25 31,25
Subject 14 Black 18,5 16,8 25,2 Red 21 21 21
Appendix 1: Band calibration and Raw Data

HALMSTAD UNIVERSITY • PO Box 823 • SE-301 18 Halmstad, Sweden • www.hh.se