Embed Size (px)
Citation preview
Corporate Presentation November 2017
Kansai Nerolac Paints Limited
November 2017
CORPORATE OVERVIEW
November 2017
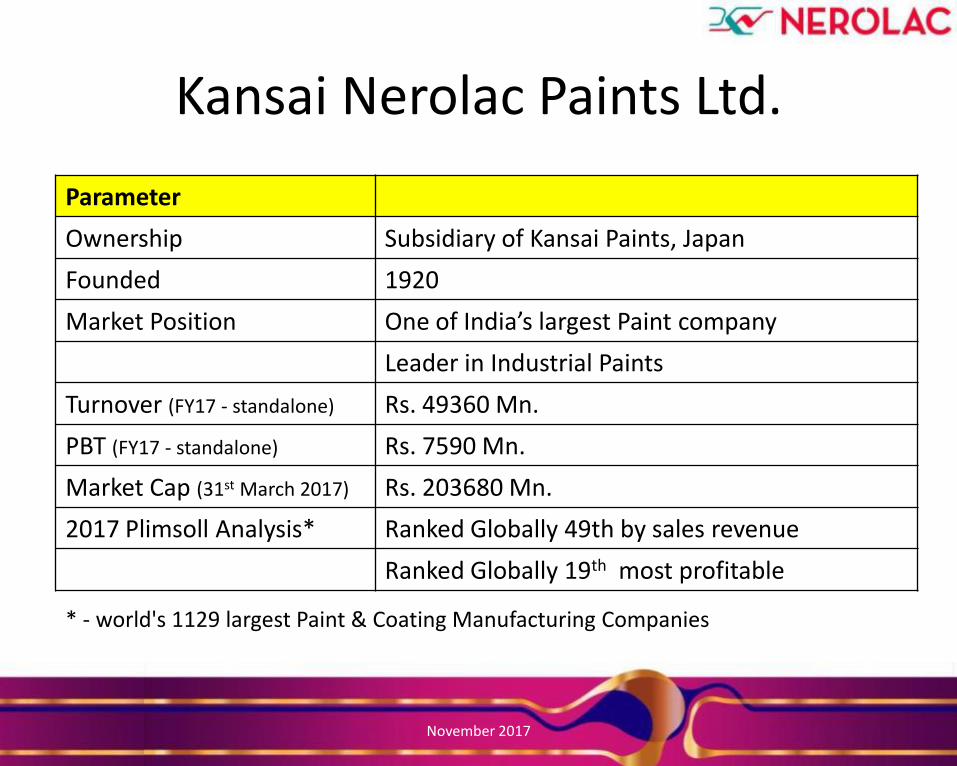
Kansai Nerolac Paints Ltd.
Parameter
Ownership Subsidiary of Kansai Paints, Japan
Founded 1920
Market Position One of India’s largest Paint company
Leader in Industrial Paints
Turnover (FY17 - standalone) Rs. 49360 Mn.
PBT (FY17 - standalone) Rs. 7590 Mn.
Market Cap (31st March 2017) Rs. 203680 Mn.
2017 Plimsoll Analysis* Ranked Globally 49th by sales revenue
Ranked Globally 19th most profitable
* - world's 1129 largest Paint & Coating Manufacturing Companies
November 2017
Company Vision
To leverage global technology, for serving our customers with superior coating systems built on innovative and superior products and world class solutions, to strengthen our leadership in Industrial coatings and propel for leadership in Architectural coatings, all to the delight of our stakeholders.
November 2017
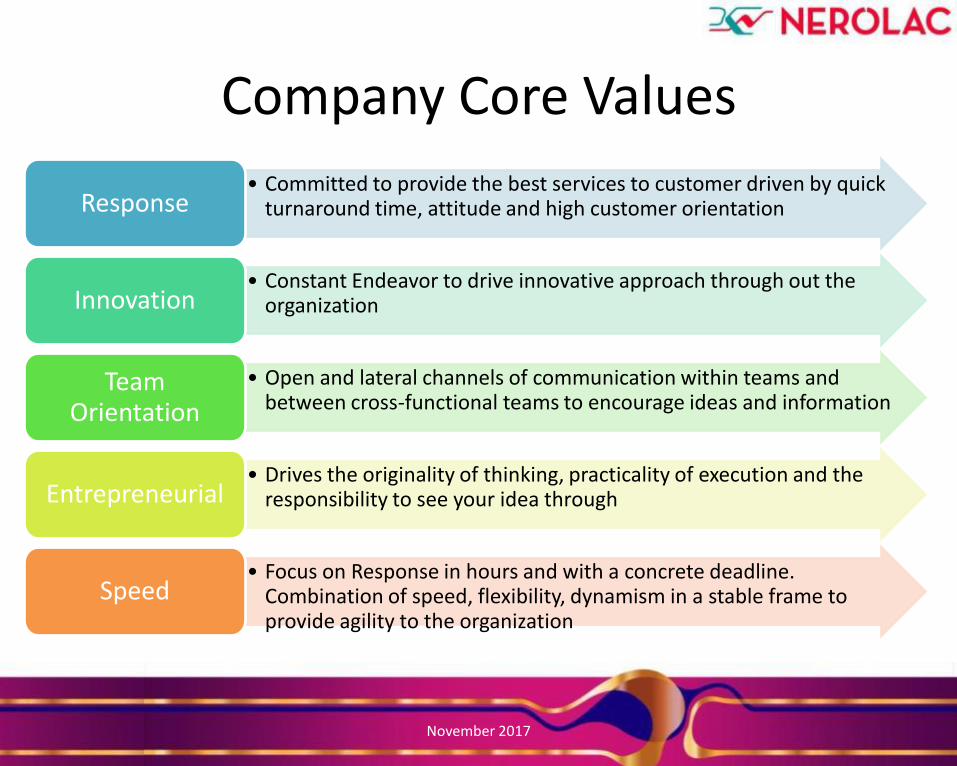
Company Core Values
• Committed to provide the best services to customer driven by quick turnaround time, attitude and high customer orientation Response
• Constant Endeavor to drive innovative approach through out the organization Innovation
• Open and lateral channels of communication within teams and between cross-functional teams to encourage ideas and information
Team Orientation
• Drives the originality of thinking, practicality of execution and the responsibility to see your idea through Entrepreneurial
• Focus on Response in hours and with a concrete deadline. Combination of speed, flexibility, dynamism in a stable frame to provide agility to the organization
Speed
November 2017
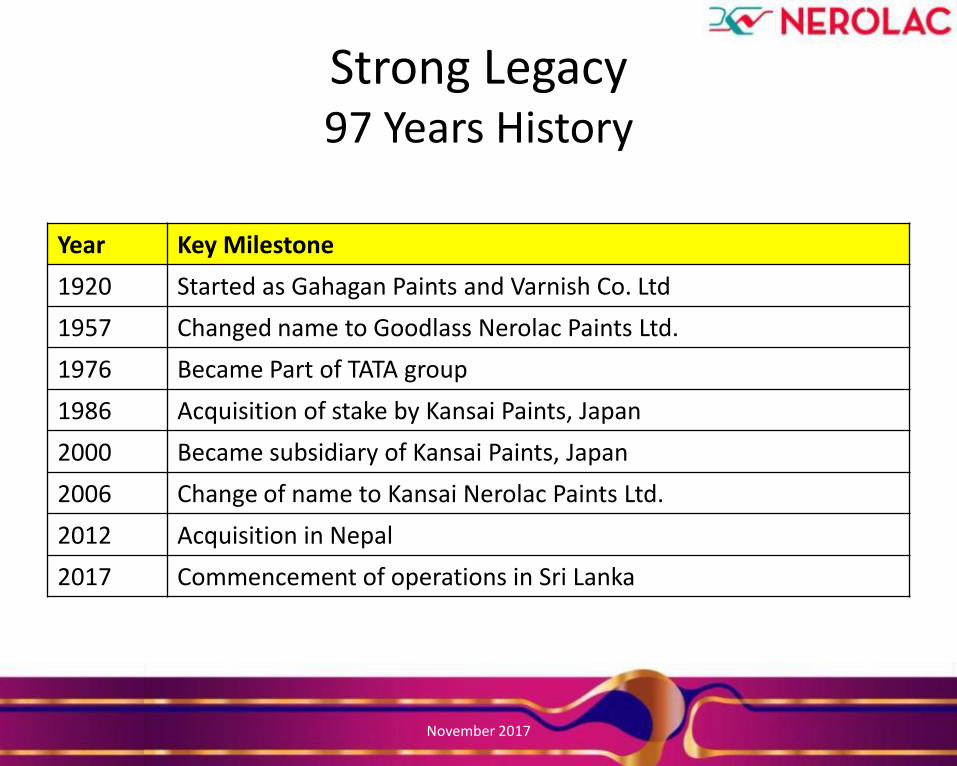
Strong Legacy 97 Years History
Year Key Milestone
1920 Started as Gahagan Paints and Varnish Co. Ltd
1957 Changed name to Goodlass Nerolac Paints Ltd.
1976 Became Part of TATA group
1986 Acquisition of stake by Kansai Paints, Japan
2000 Became subsidiary of Kansai Paints, Japan
2006 Change of name to Kansai Nerolac Paints Ltd.
2012 Acquisition in Nepal
2017 Commencement of operations in Sri Lanka
November 2017
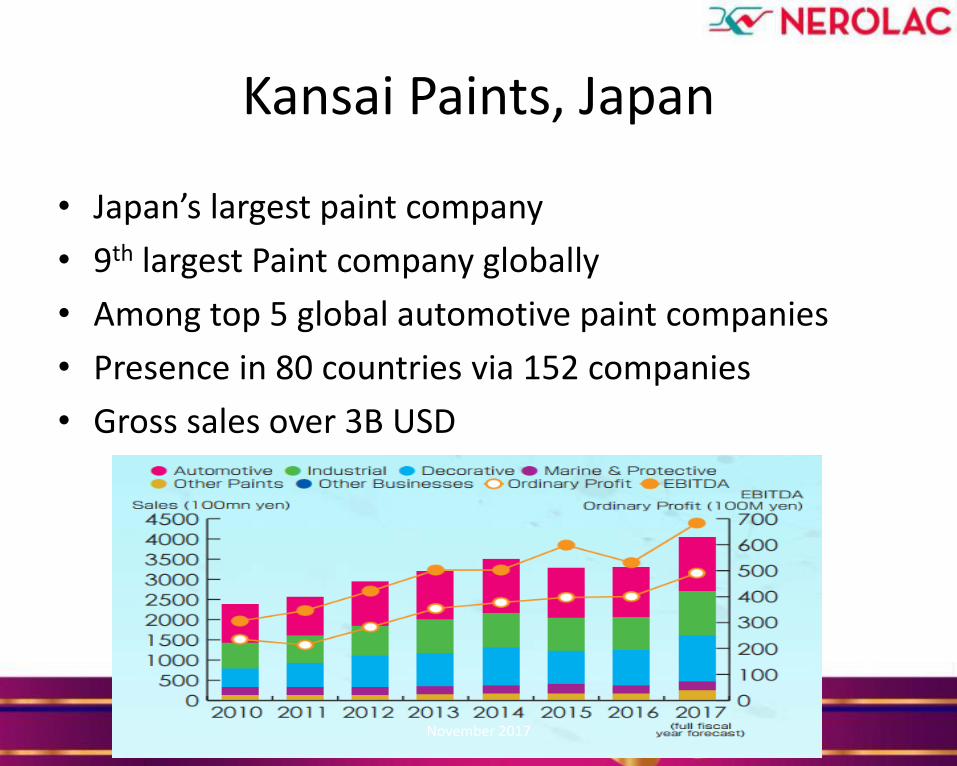
Kansai Paints, Japan
• Japan’s largest paint company
• 9th largest Paint company globally
• Among top 5 global automotive paint companies
• Presence in 80 countries via 152 companies
• Gross sales over 3B USD
November 2017
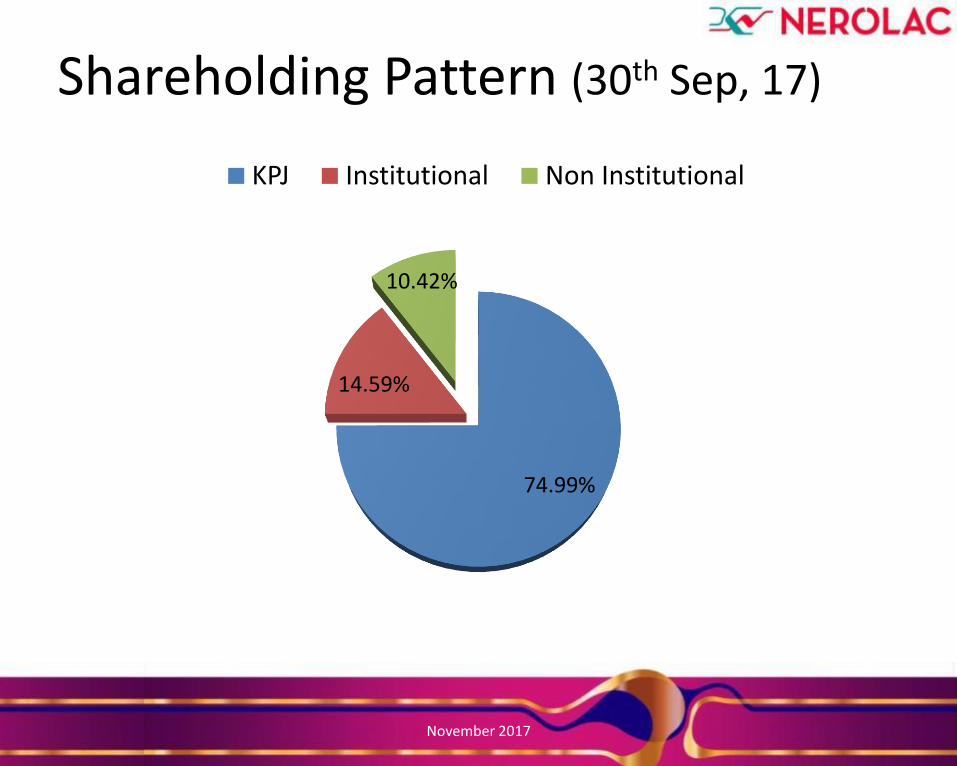
Shareholding Pattern (30th Sep, 17)
74.99%
14.59%
10.42%
KPJ Institutional Non Institutional
November 2017
INDUSTRY OVERVIEW
November 2017
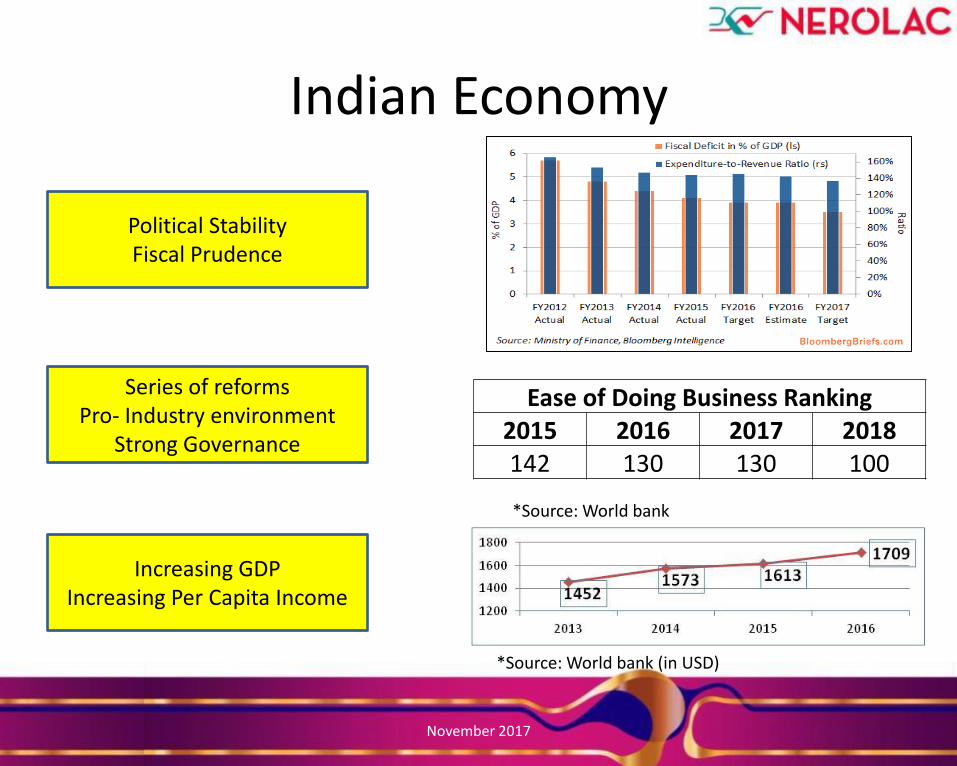
Indian Economy
Political Stability Fiscal Prudence
Series of reforms Pro- Industry environment
Strong Governance
Increasing GDP Increasing Per Capita Income
*Source: World bank (in USD)
Ease of Doing Business Ranking 2015 2016 2017 2018 142 130 130 100
*Source: World bank
November 2017
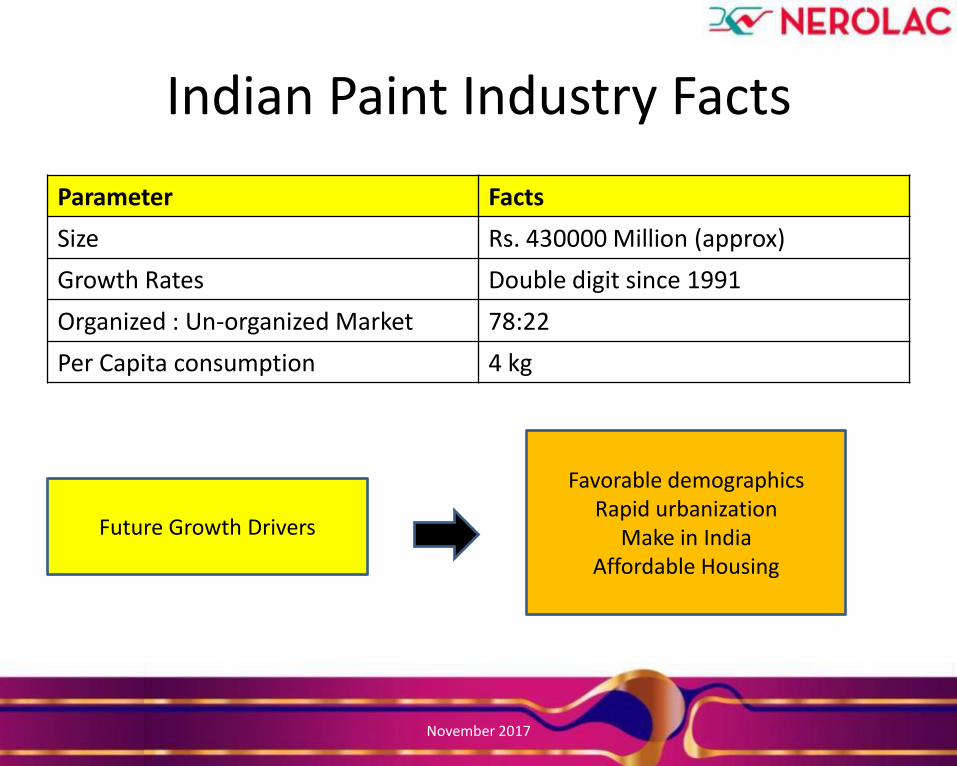
Indian Paint Industry Facts
Parameter Facts
Size Rs. 430000 Million (approx)
Growth Rates Double digit since 1991
Organized : Un-organized Market 78:22
Per Capita consumption 4 kg
Future Growth Drivers
Favorable demographics Rapid urbanization
Make in India Affordable Housing
November 2017
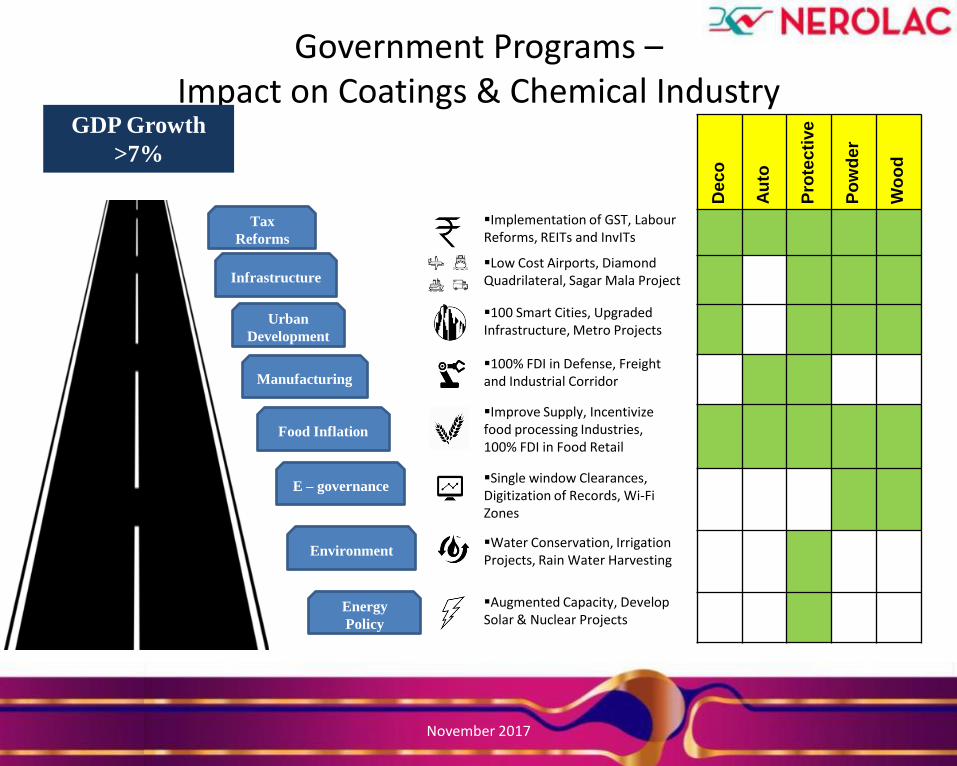
Government Programs – Impact on Coatings & Chemical Industry
GDP Growth
>7%
Tax
Reforms
Infrastructure
Urban
Development
Manufacturing
Food Inflation
E – governance
Environment
Energy
Policy
De
co
Au
to
Pro
tecti
ve
Po
wd
er
Wo
od
Implementation of GST, Labour Reforms, REITs and InvITs
Low Cost Airports, Diamond Quadrilateral, Sagar Mala Project
100 Smart Cities, Upgraded Infrastructure, Metro Projects
100% FDI in Defense, Freight and Industrial Corridor
Improve Supply, Incentivize food processing Industries, 100% FDI in Food Retail
Single window Clearances, Digitization of Records, Wi-Fi Zones
Water Conservation, Irrigation Projects, Rain Water Harvesting
Augmented Capacity, Develop Solar & Nuclear Projects
November 2017
KANSAI NEROLAC PAINTS LTD
November 2017
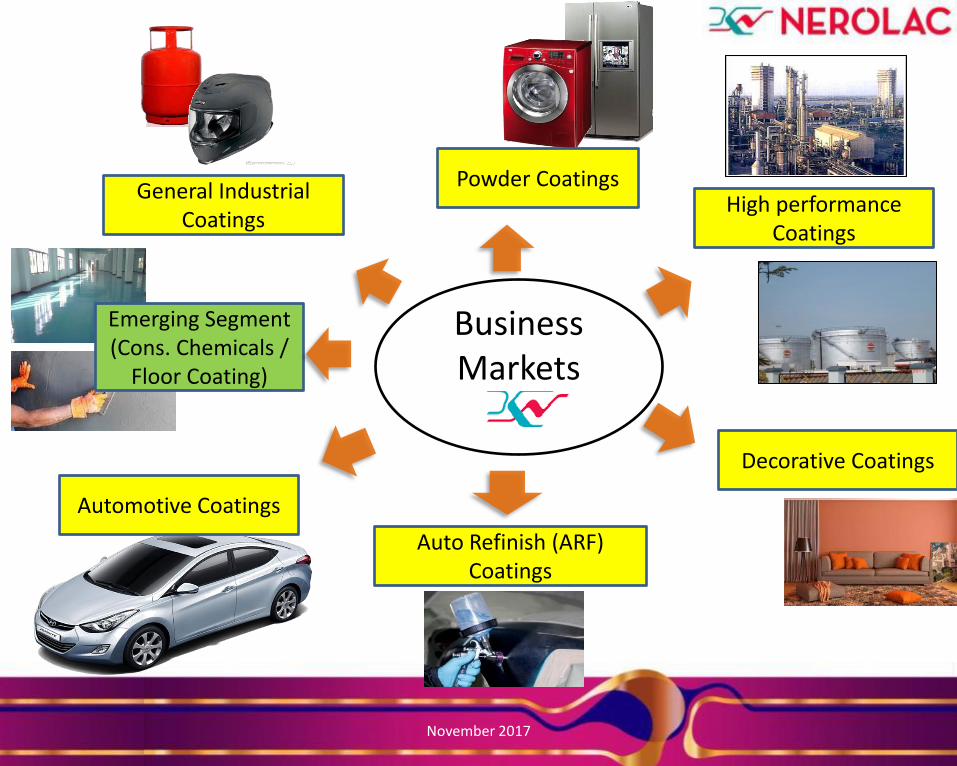
Business Markets
Automotive Coatings
General Industrial Coatings
Powder Coatings High performance
Coatings
Decorative Coatings
Auto Refinish (ARF) Coatings
Emerging Segment (Cons. Chemicals /
Floor Coating)
November 2017
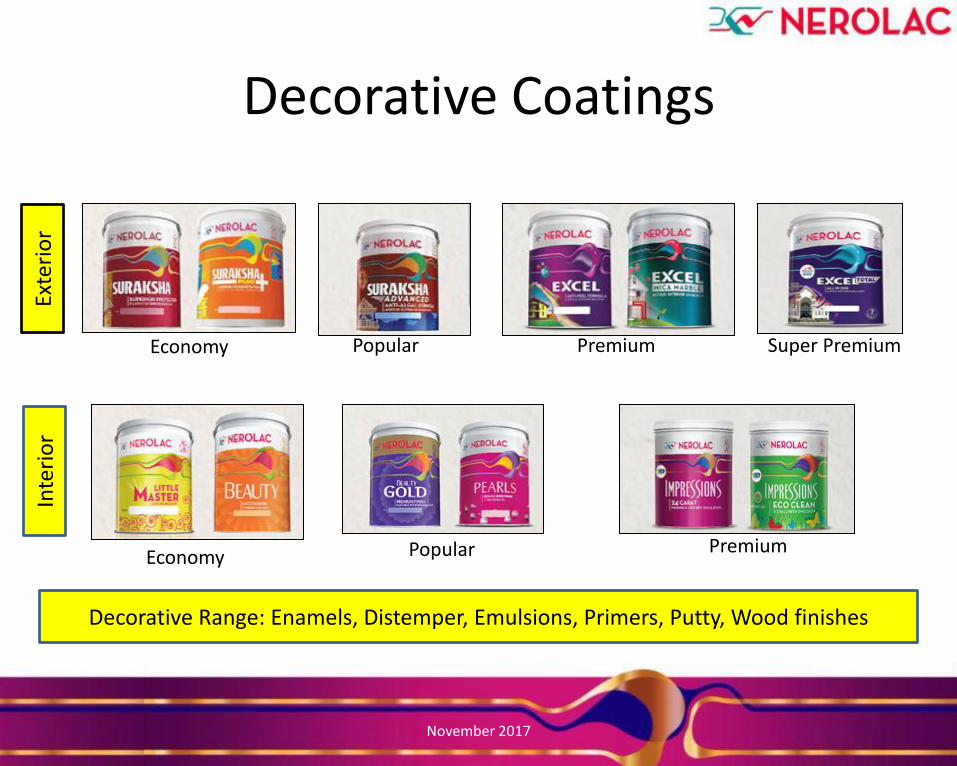
Decorative Coatings
Economy Popular Premium Super Premium
Economy Popular Premium
Decorative Range: Enamels, Distemper, Emulsions, Primers, Putty, Wood finishes
Exte
rio
r In
teri
or
November 2017
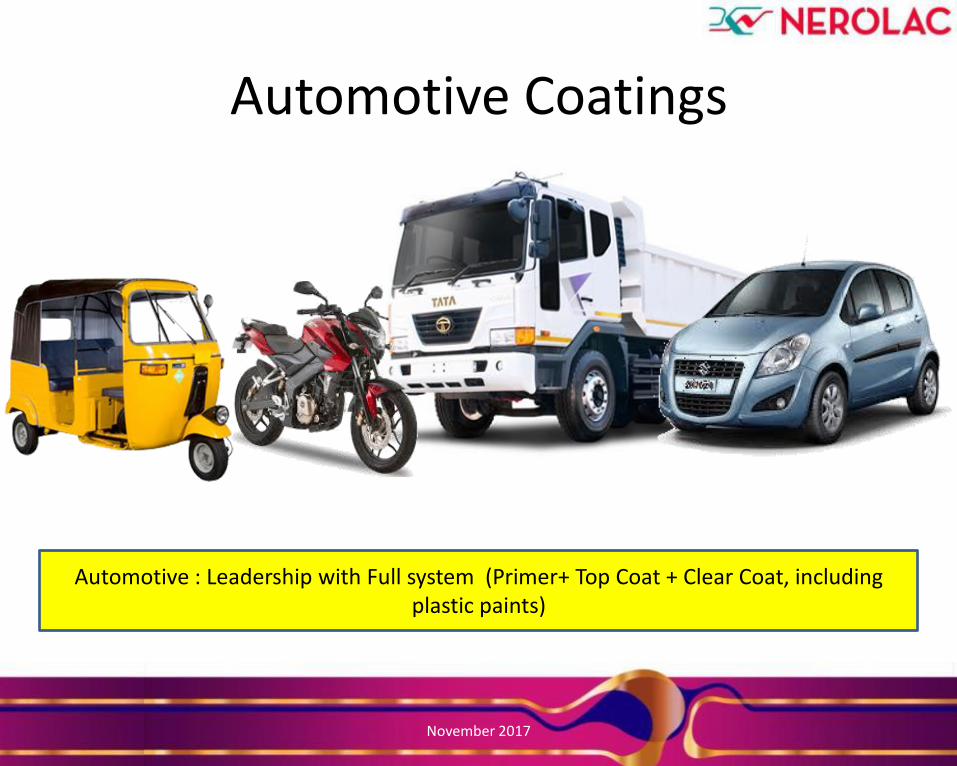
Automotive : Leadership with Full system (Primer+ Top Coat + Clear Coat, including plastic paints)
Automotive Coatings
November 2017
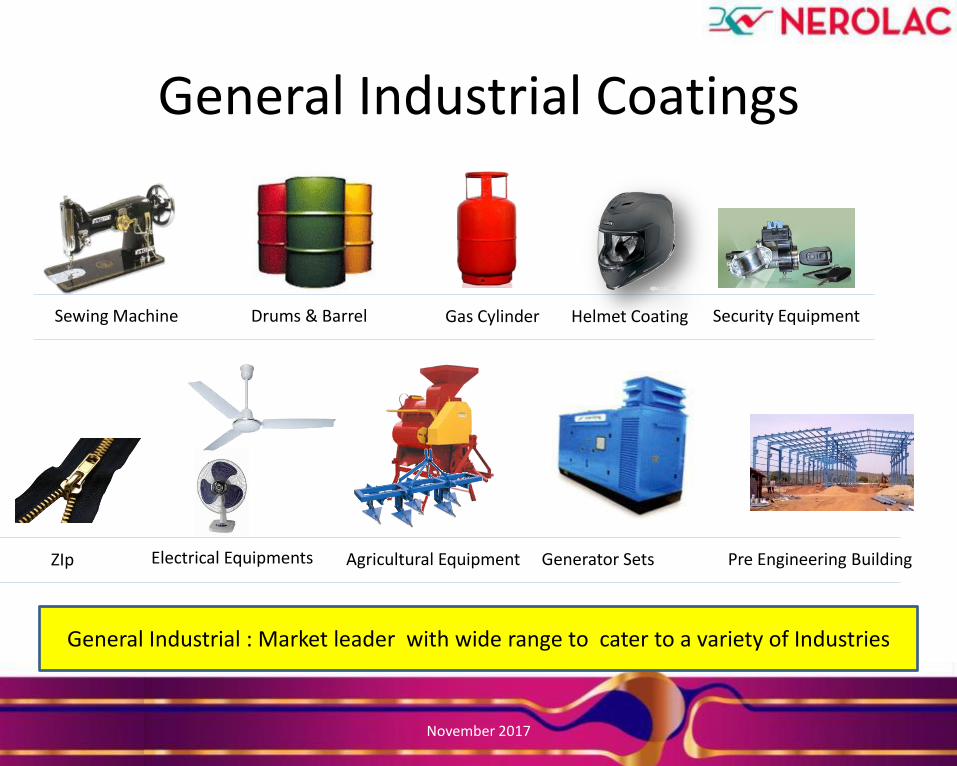
Drums & Barrel Gas Cylinder
Electrical Equipments
Helmet Coating
Agricultural Equipment
Sewing Machine
Generator Sets
Security Equipment
ZIp Pre Engineering Building
General Industrial Coatings
General Industrial : Market leader with wide range to cater to a variety of Industries
November 2017
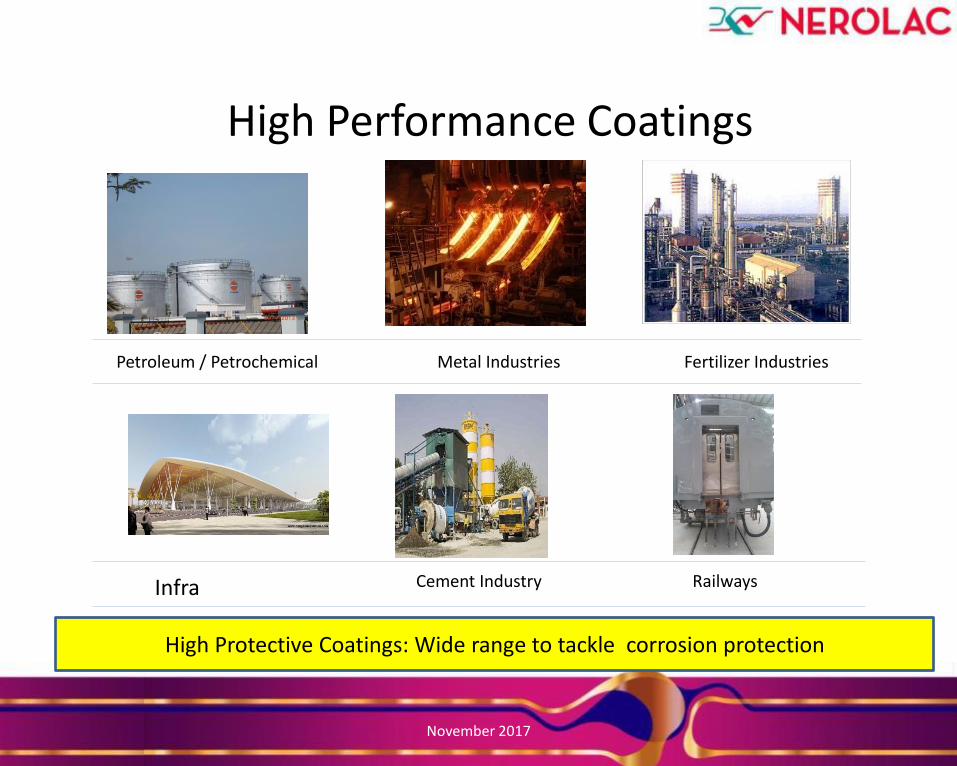
High Performance Coatings
Petroleum / Petrochemical Metal Industries
Railways
Fertilizer Industries
Cement Industry Infra
High Protective Coatings: Wide range to tackle corrosion protection
November 2017
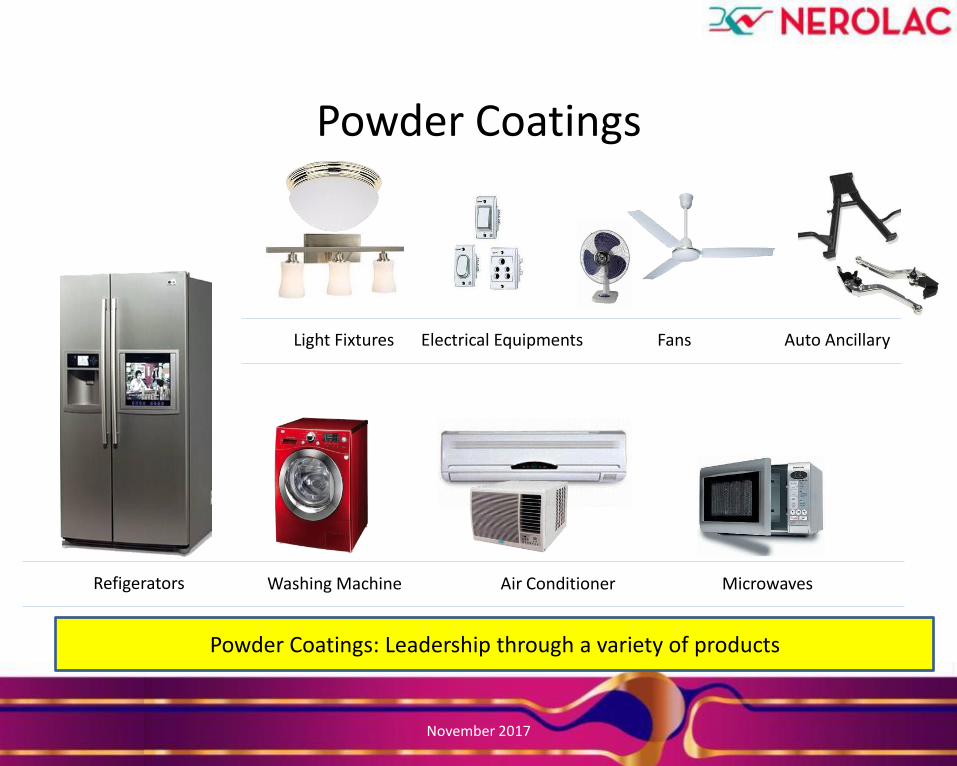
Powder Coatings
Electrical Equipments Light Fixtures Fans
Air Conditioner Washing Machine Microwaves Refigerators
Auto Ancillary
Powder Coatings: Leadership through a variety of products
November 2017
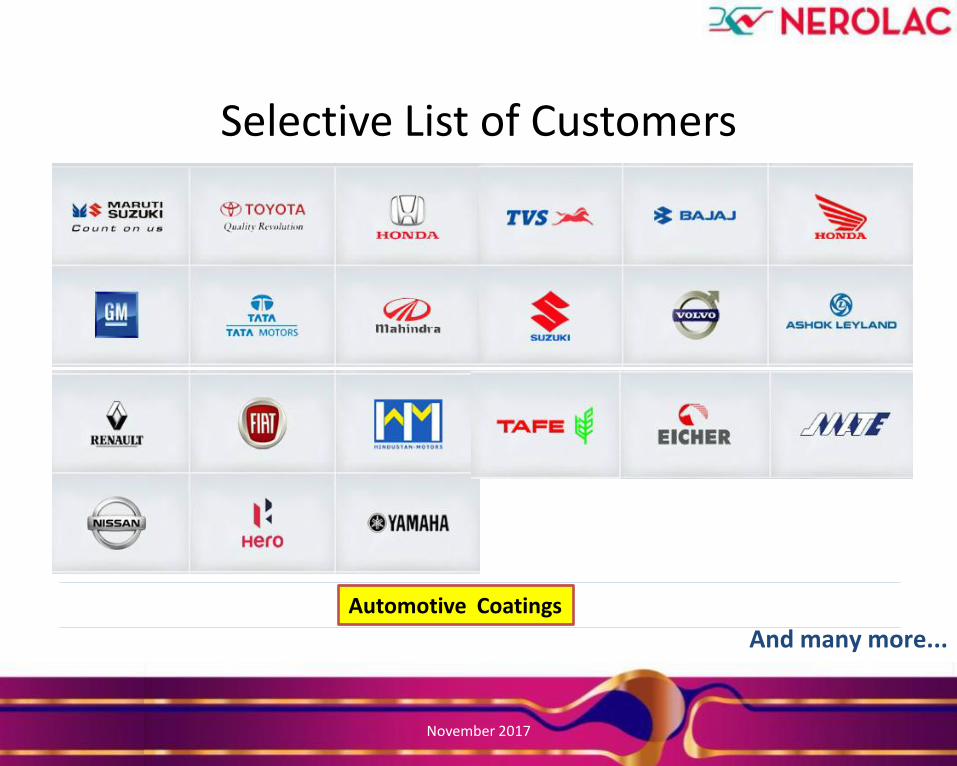
Selective List of Customers
And many more...
Automotive Coatings
November 2017
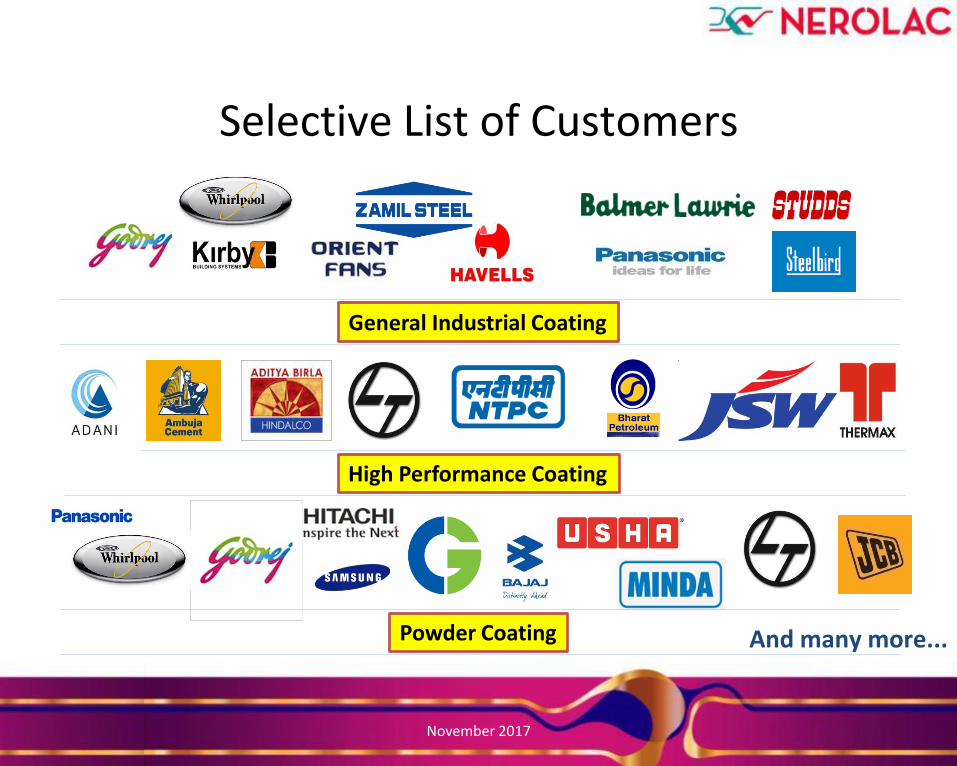
Selective List of Customers
And many more...
General Industrial Coating
High Performance Coating
Powder Coating
November 2017
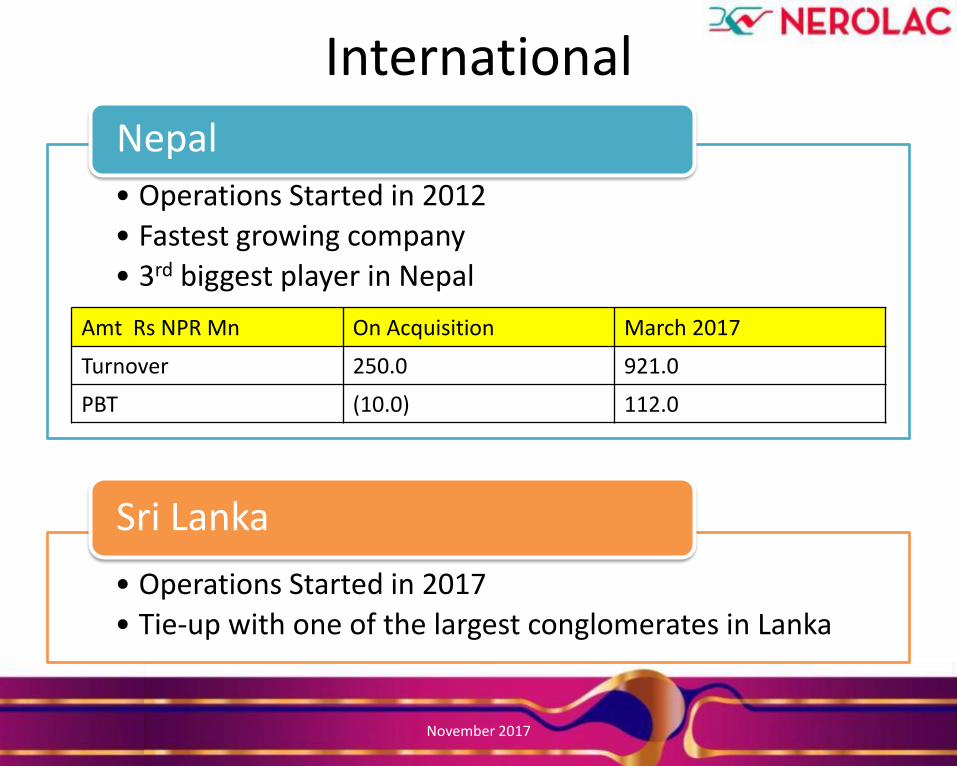
International
• Operations Started in 2012
• Fastest growing company
• 3rd biggest player in Nepal
Nepal
• Operations Started in 2017
• Tie-up with one of the largest conglomerates in Lanka
Sri Lanka
Amt Rs NPR Mn On Acquisition March 2017
Turnover 250.0 921.0
PBT (10.0) 112.0
November 2017
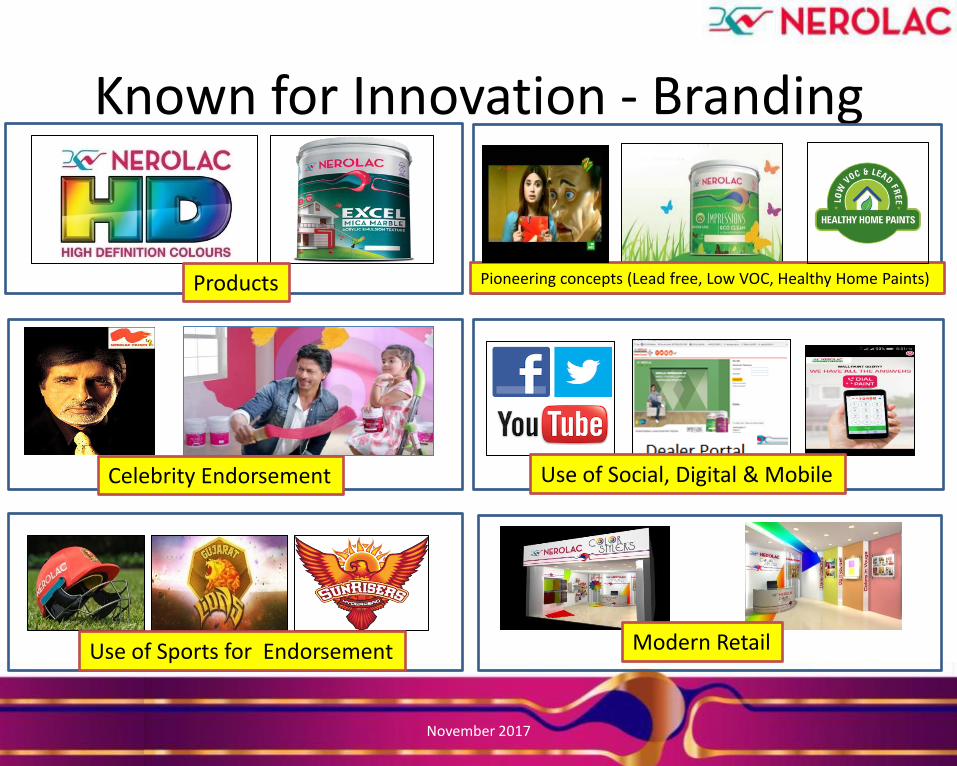
Known for Innovation - Branding
Products
Celebrity Endorsement
Use of Sports for Endorsement
Pioneering concepts (Lead free, Low VOC, Healthy Home Paints)
Modern Retail
Use of Social, Digital & Mobile
November 2017
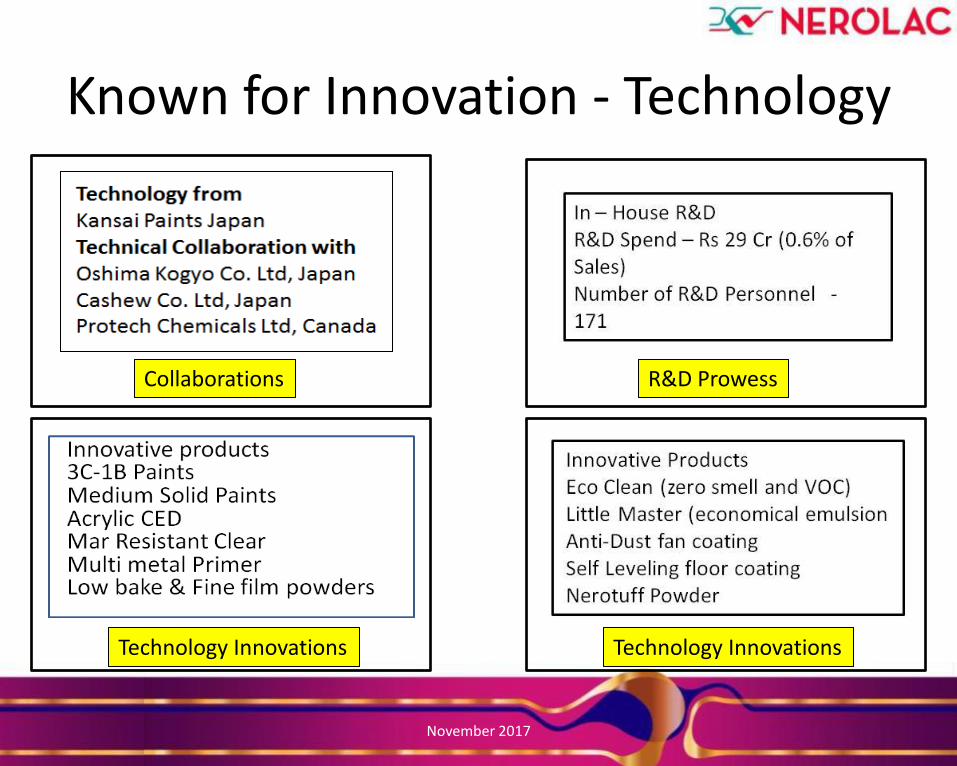
Known for Innovation - Technology
Collaborations R&D Prowess
Technology Innovations Technology Innovations
November 2017
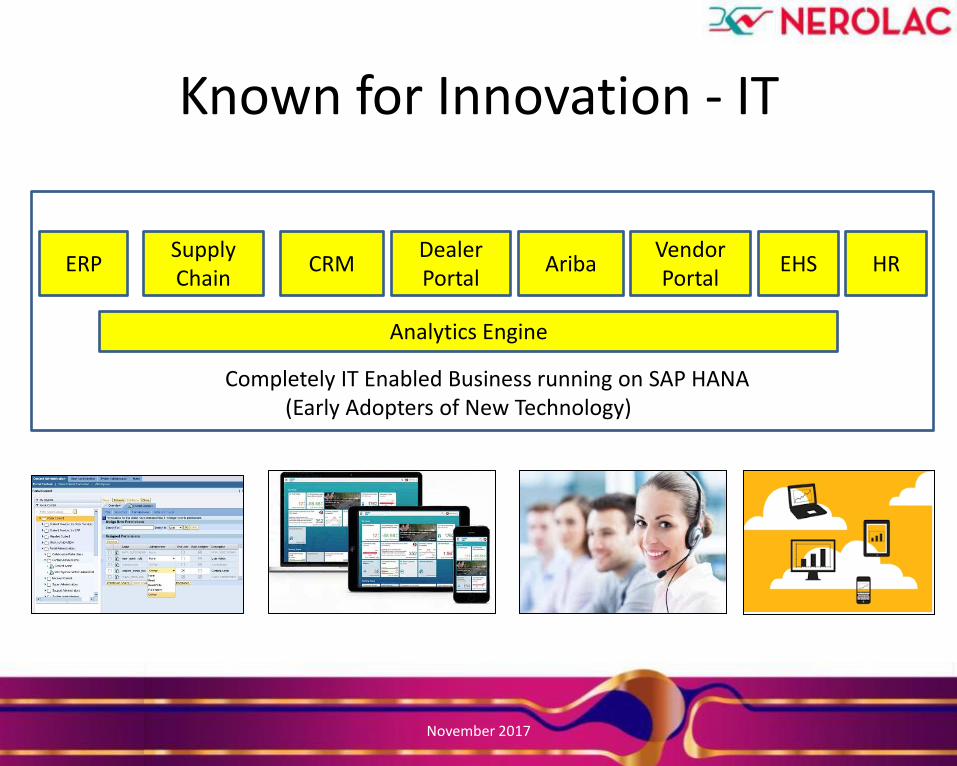
Known for Innovation - IT
ERP Supply Chain
CRM
Analytics Engine
Ariba Vendor Portal
EHS
Completely IT Enabled Business running on SAP HANA (Early Adopters of New Technology)
Dealer Portal
HR
November 2017
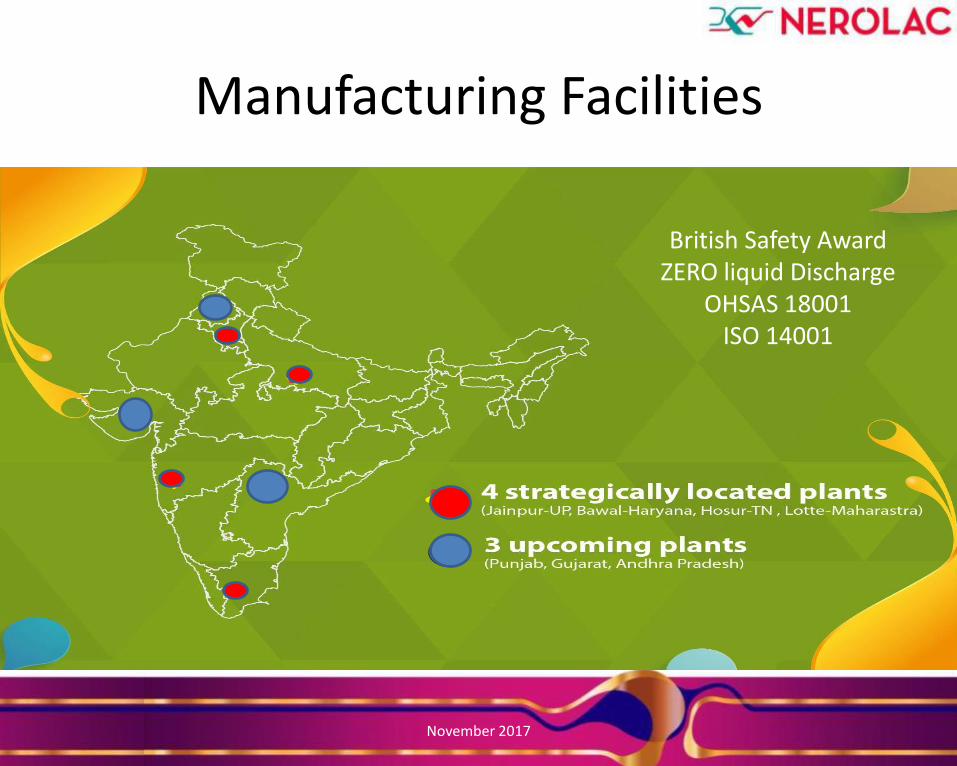
Manufacturing Facilities Manufacturing Facilities
Japanese Technology
British Safety Award
OHSAS 18001 ISO 14001
ZERO liquid Discharge
November 2017
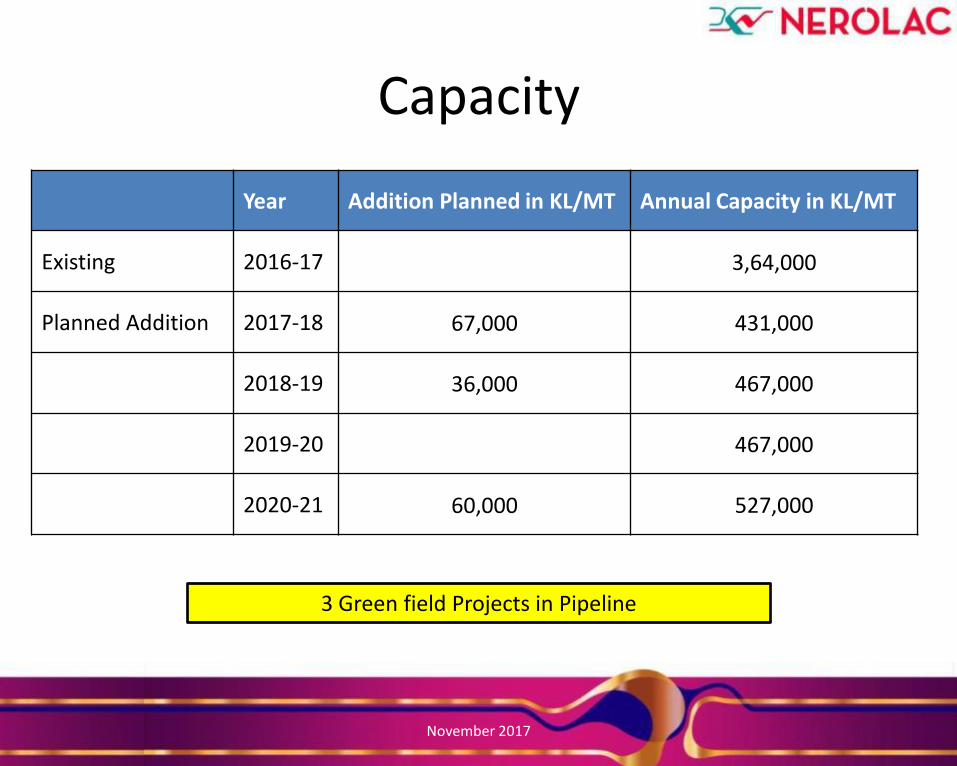
Capacity
Year Addition Planned in KL/MT Annual Capacity in KL/MT
Existing 2016-17 3,64,000
Planned Addition 2017-18 67,000 431,000
2018-19 36,000 467,000
2019-20 467,000
2020-21 60,000 527,000
November 2017
3 Green field Projects in Pipeline
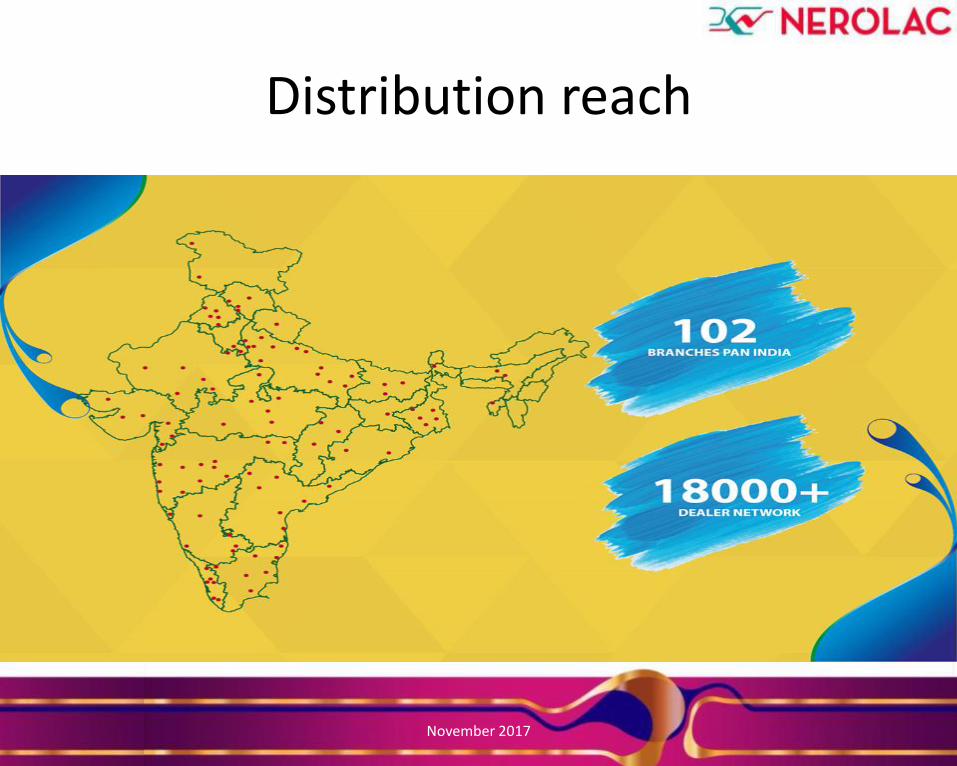
Distribution reach
November 2017
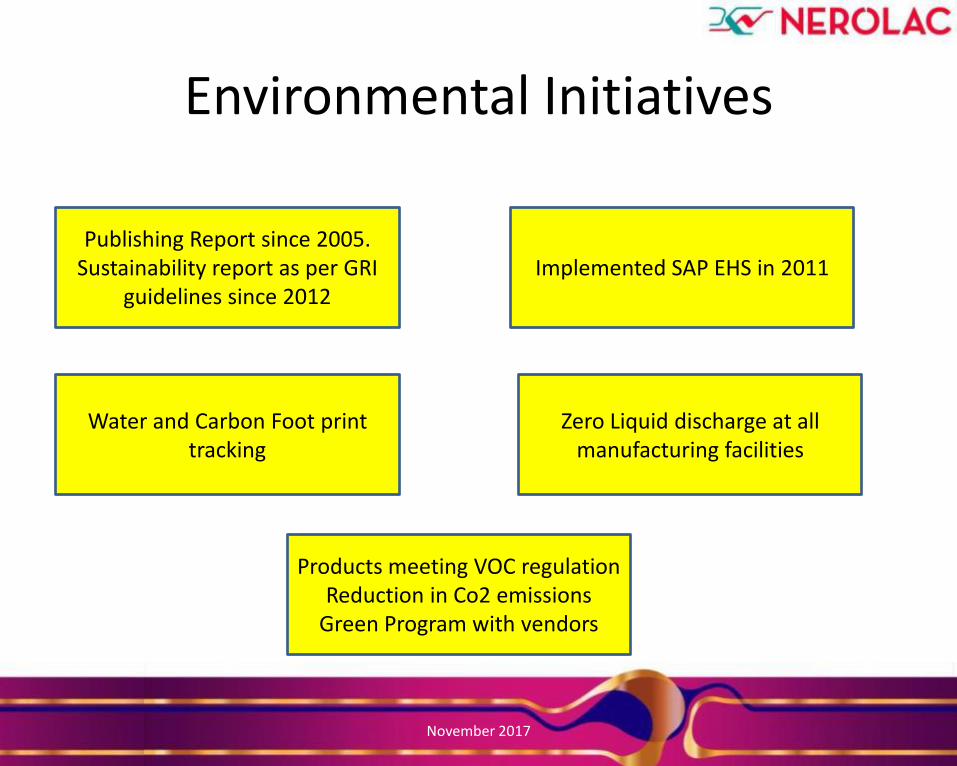
Environmental Initiatives
Publishing Report since 2005. Sustainability report as per GRI
guidelines since 2012 Implemented SAP EHS in 2011
Water and Carbon Foot print tracking
Zero Liquid discharge at all manufacturing facilities
Products meeting VOC regulation Reduction in Co2 emissions
Green Program with vendors
November 2017
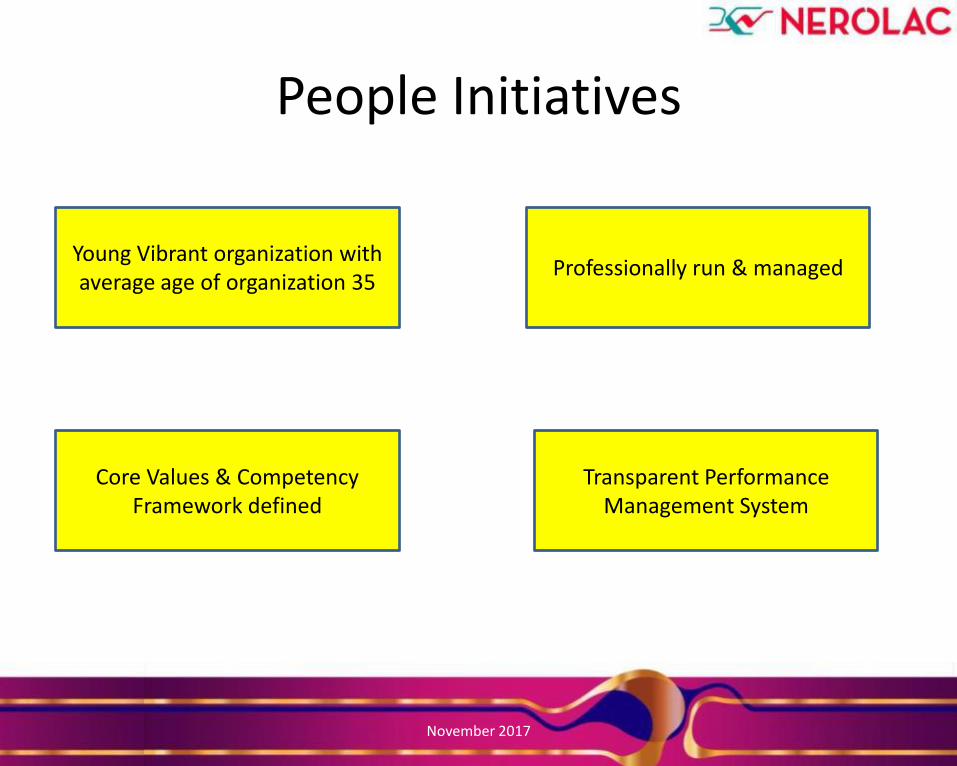
People Initiatives
Young Vibrant organization with average age of organization 35
Professionally run & managed
Core Values & Competency Framework defined
Transparent Performance Management System
November 2017
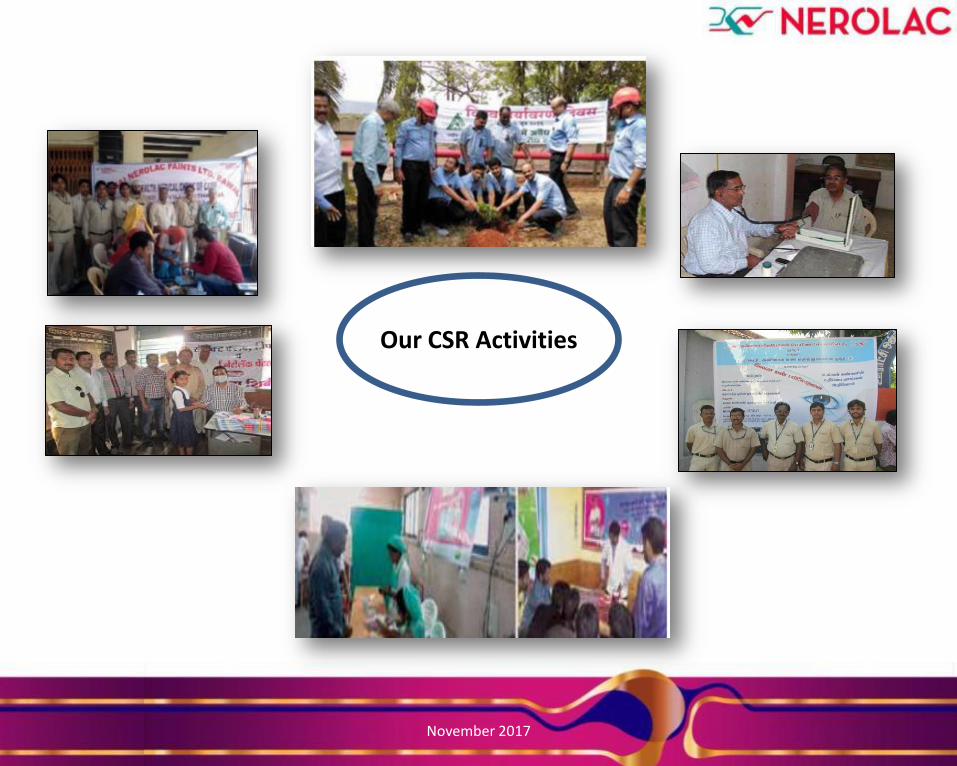
Our CSR Activities
November 2017
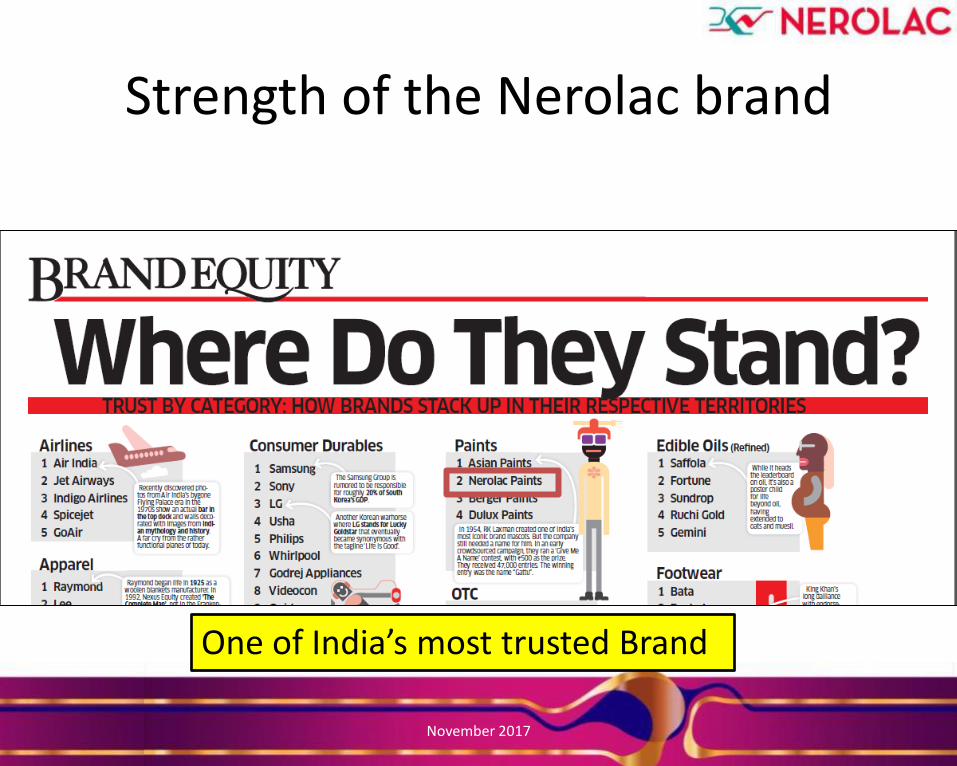
One of India’s most trusted Brand
Strength of the Nerolac brand
November 2017
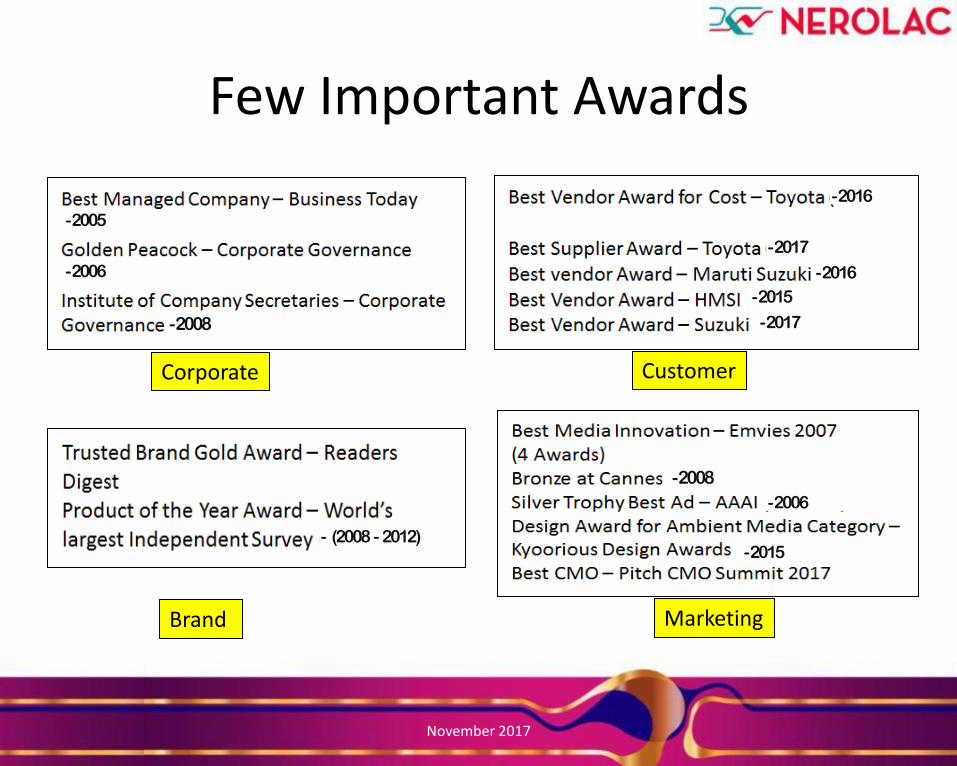
Few Important Awards
Corporate Customer
Brand Marketing
- 2005
- 2006
-2008
- 2017
- 2016
- 2017
- 2015
- 2016
-2008
- 2006
- 2015 - (2008 - 2012)
November 2017
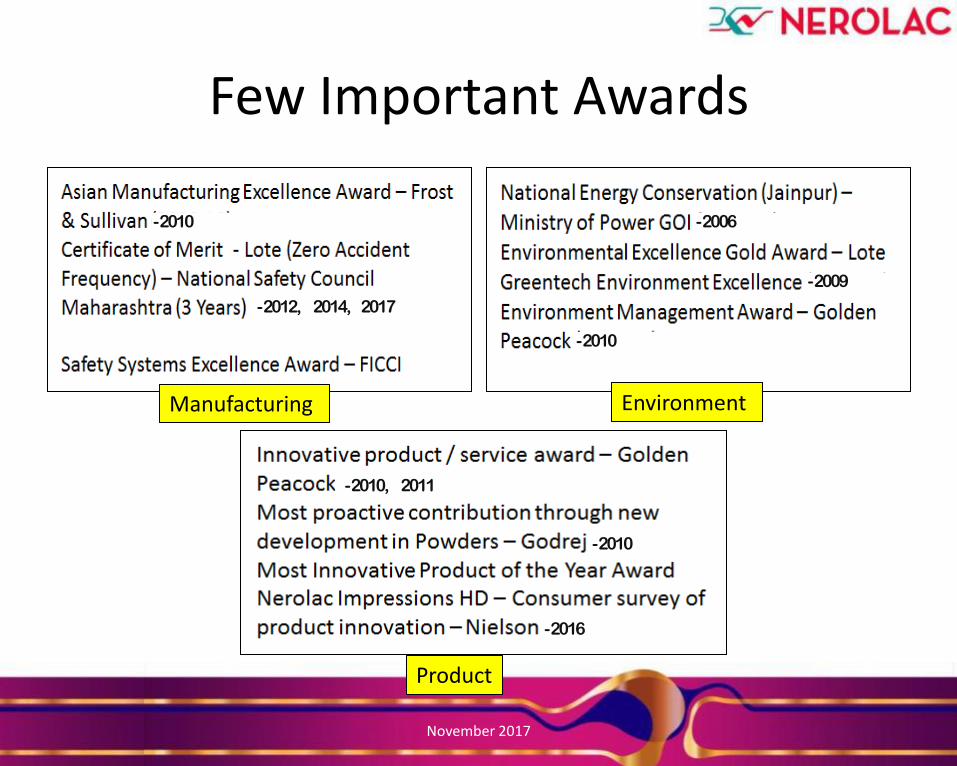
Few Important Awards
Manufacturing Environment
Product
- 2012, 2014, 2017
- 2010 - 2006
- 2009
- 2010
- 2010, 2011
- 2010
- 2016
November 2017
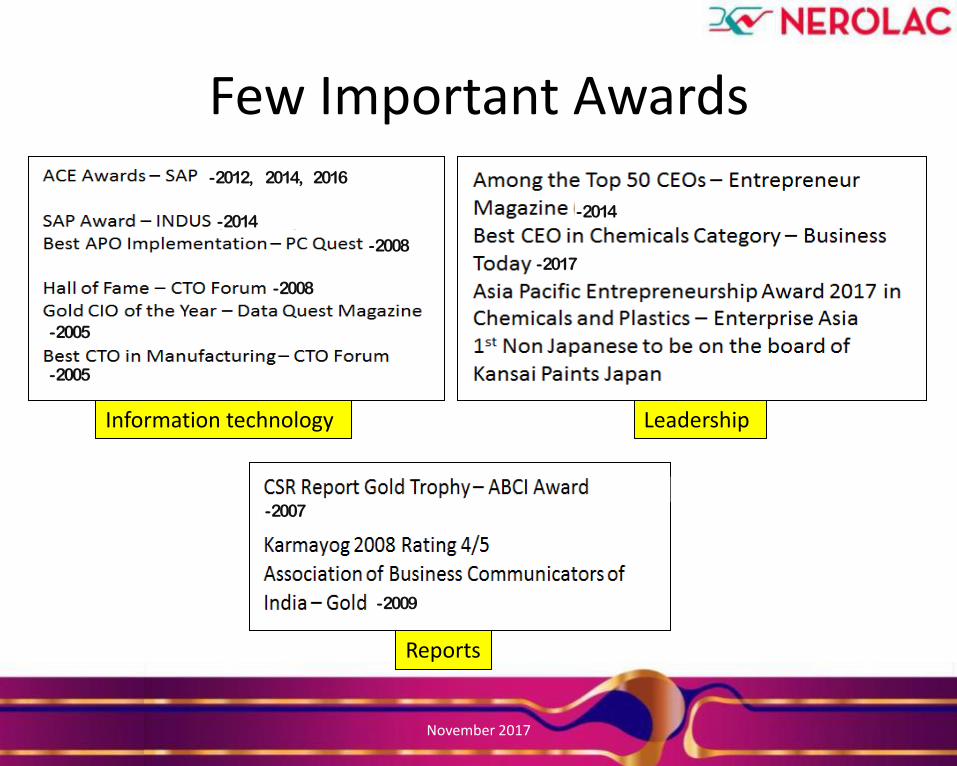
Few Important Awards
Information technology Leadership
Reports
- 2012, 2014, 2016
- 2014
- 2008
- 2008
- 2005
- 2005
- 2014
- 2017
- 2007
- 2009
November 2017
FINANCIALS
November 2017
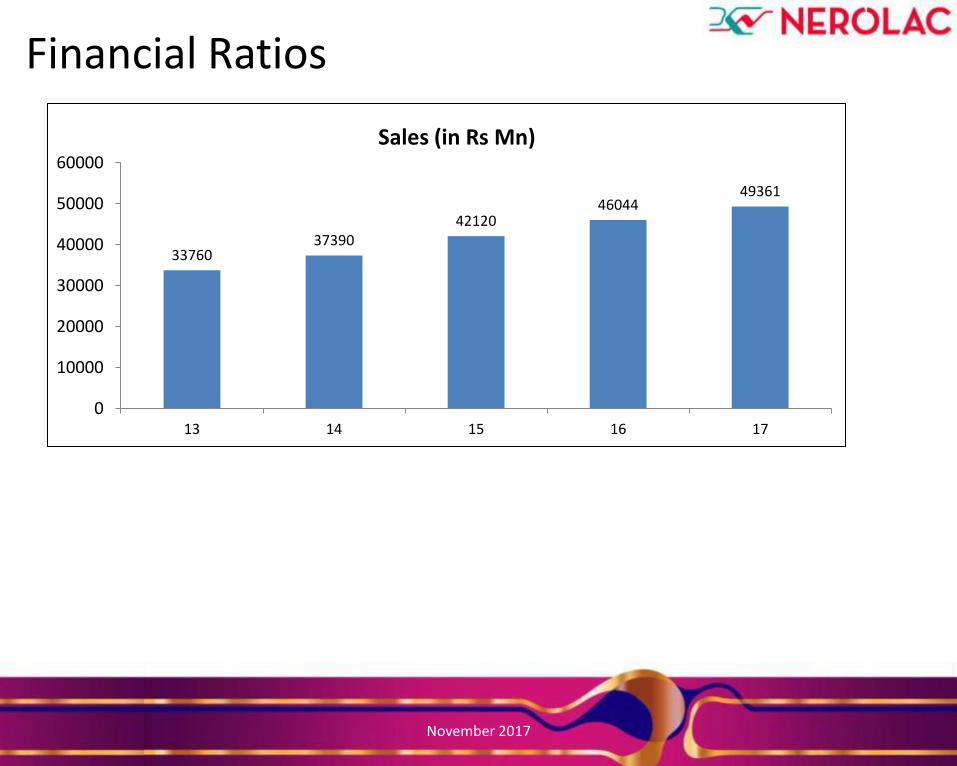
Financial Ratios
33760 37390
42120 46044
49361
0
10000
20000
30000
40000
50000
60000
13 14 15 16 17
Sales (in Rs Mn)
November 2017
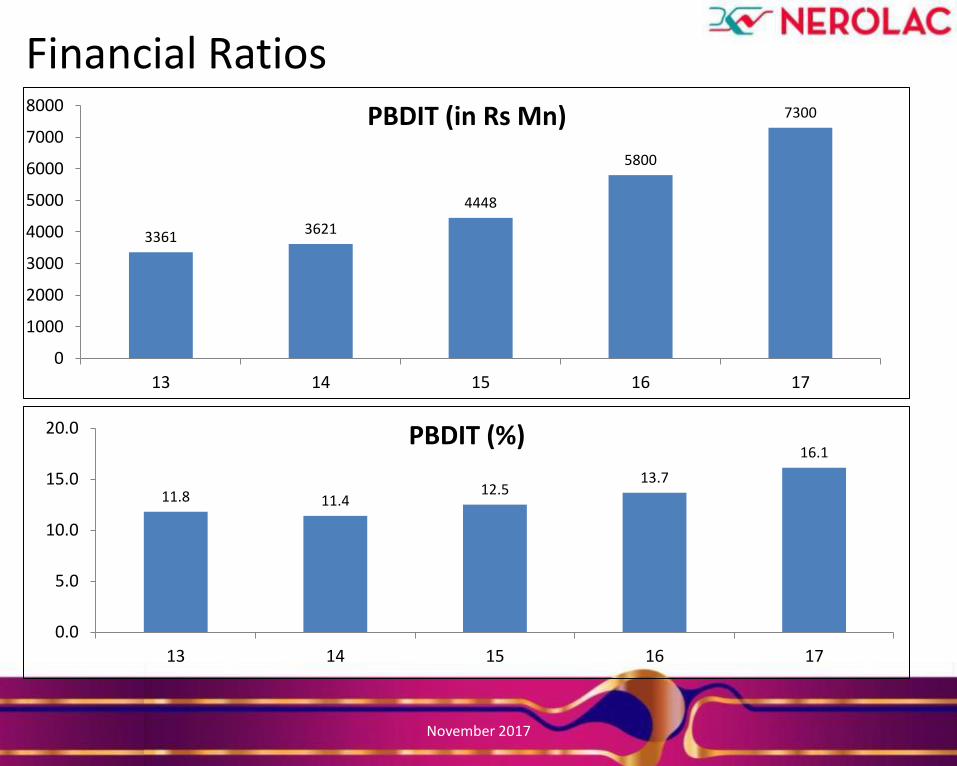
Financial Ratios
3361 3621
4448
5800
7300
0
1000
2000
3000
4000
5000
6000
7000
8000
13 14 15 16 17
PBDIT (in Rs Mn)
11.8 11.4 12.5
13.7
16.1
0.0
5.0
10.0
15.0
20.0
13 14 15 16 17
PBDIT (%)
November 2017
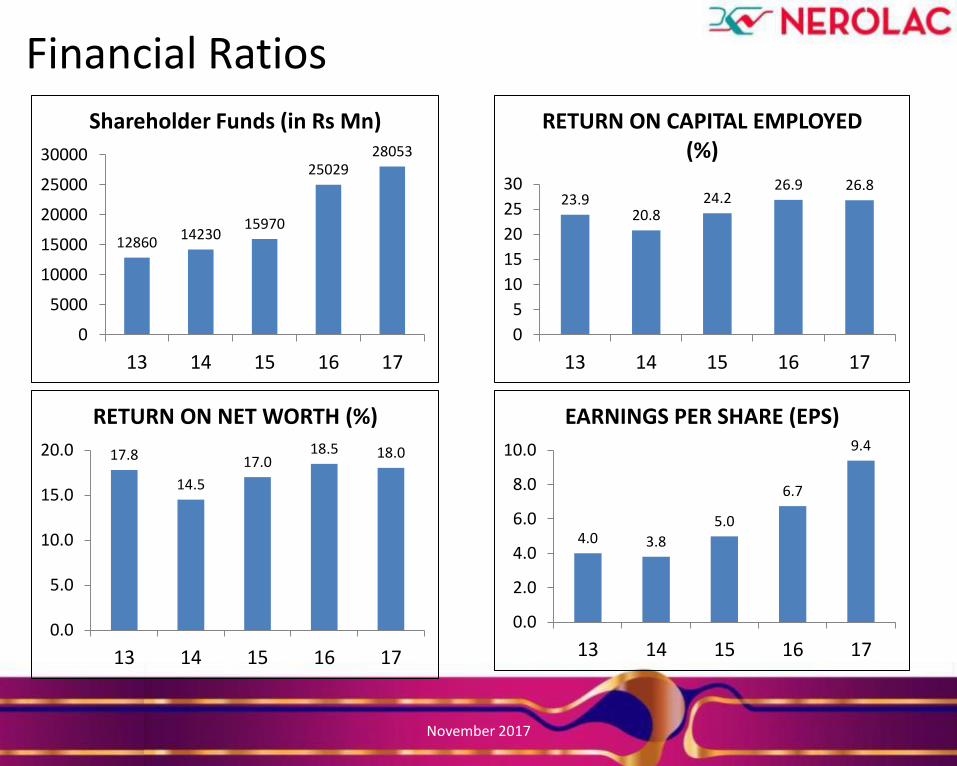
Financial Ratios
12860 14230
15970
25029 28053
0
5000
10000
15000
20000
25000
30000
13 14 15 16 17
Shareholder Funds (in Rs Mn)
23.9 20.8
24.2 26.9 26.8
0
5
10
15
20
25
30
13 14 15 16 17
RETURN ON CAPITAL EMPLOYED (%)
17.8
14.5
17.0 18.5 18.0
0.0
5.0
10.0
15.0
20.0
13 14 15 16 17
RETURN ON NET WORTH (%)
4.0 3.8
5.0
6.7
9.4
0.0
2.0
4.0
6.0
8.0
10.0
13 14 15 16 17
EARNINGS PER SHARE (EPS)
November 2017
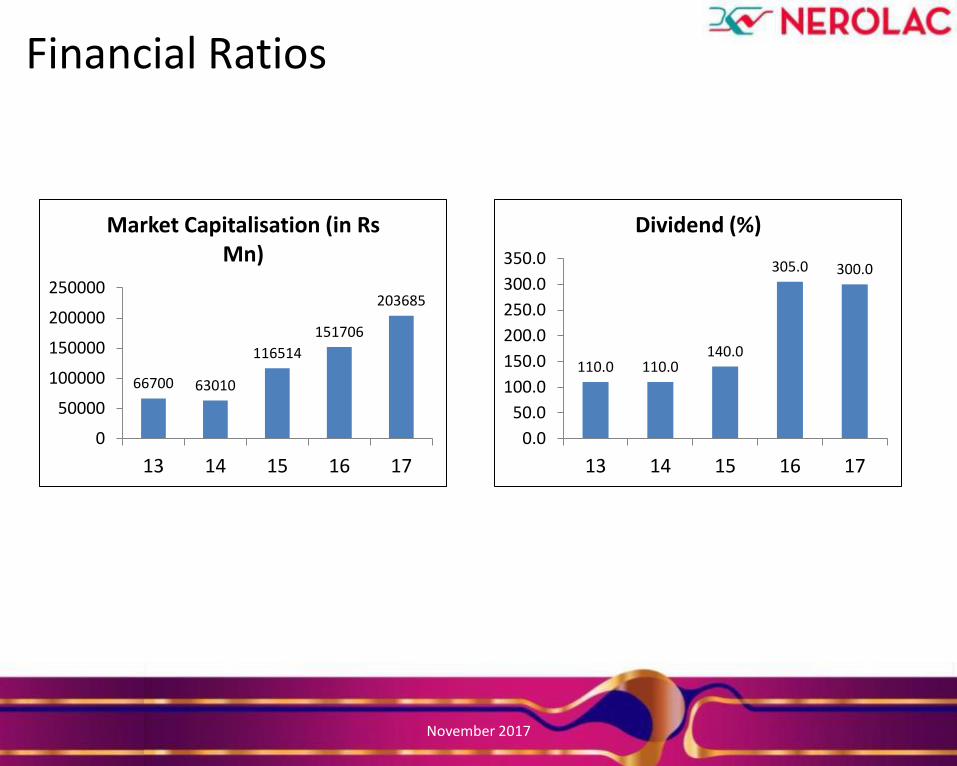
Financial Ratios
66700 63010
116514
151706
203685
0
50000
100000
150000
200000
250000
13 14 15 16 17
Market Capitalisation (in Rs Mn)
110.0 110.0 140.0
305.0 300.0
0.0
50.0
100.0
150.0
200.0
250.0
300.0
350.0
13 14 15 16 17
Dividend (%)
November 2017
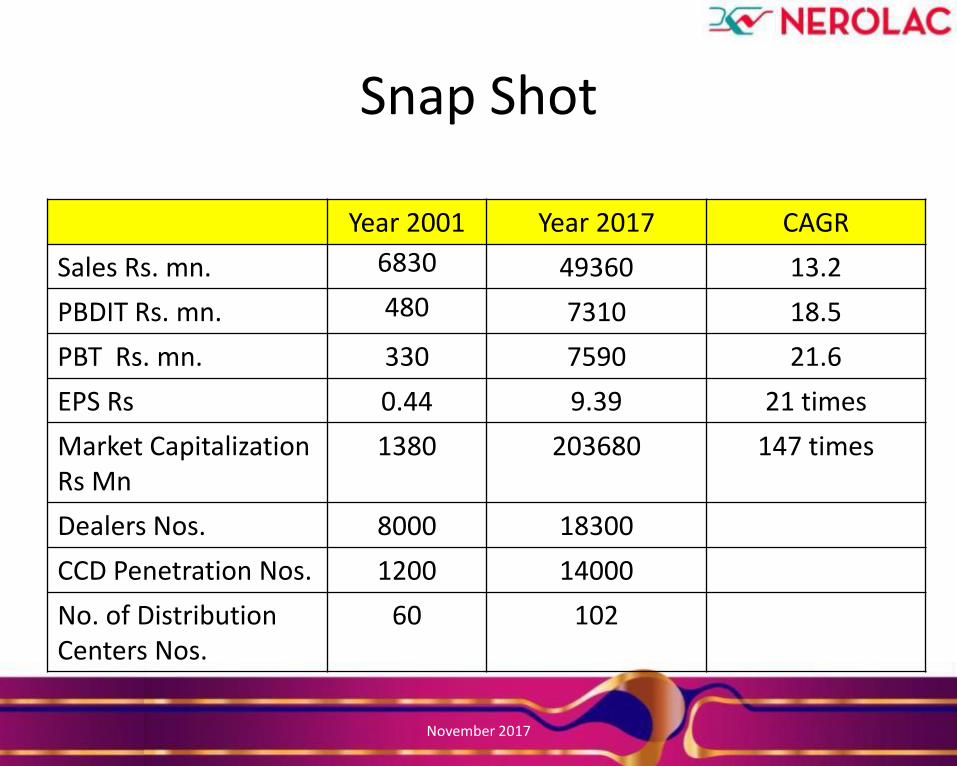
Snap Shot
Year 2001 Year 2017 CAGR
Sales Rs. mn. 6830 49360 13.2
PBDIT Rs. mn. 480 7310 18.5
PBT Rs. mn. 330 7590 21.6
EPS Rs 0.44 9.39 21 times
Market Capitalization Rs Mn
1380 203680 147 times
Dealers Nos. 8000 18300
CCD Penetration Nos. 1200 14000
No. of Distribution Centers Nos.
60 102
November 2017
Thank You
November 2017