Embed Size (px)
Citation preview

Kansas Casino Market StudyTask1 – Estimates of gaming revenues for a generic
casino to be located in each of the four gaming zones
Final Report
Prepared For:
Kansas Lottery Gaming Facility Review Board
May 26, 2008
Prepared By:
Wells Gaming Research
495 Apple Street, Suite 205
Reno, NV 89502
775-826-3232
http://www.wellsgaming.com

Kansas Casino Market Study & Gaming Revenue Projections
Wells Gaming Research
May 2008
Table of Contents
Page:
Section 1: Introduction & Executive Summary
Introduction 1-1
Research Methodology & Scope of Work 1-3
Map - Geographical Trade Areas for the Gaming Zones 1-4
Summary of the Research Results for Kansas 1-6
Limiting Conditions 1-11
Section 2: Northeast Gaming Zone
Summary of the Trade Area 2-1
Map - Northeast Trade Area 2-2
Detailed Report for the Northeast Gaming Zone Trade Area 2-7
Status Quo for the Northeast Trade Area 2-10
Status Quo Gaming Capacity 2-12
Analysis of Gaming Revenue Scenarios 2-13
Section 3: Southeast Gaming Zone
Summary for the Trade Area 3-1
Map - Southeast Trade Area 3-3
Detailed Analyses for the Trade Area for the Southeast Gaming Zone 3-8
2007 Status Quo for the Southeast Trade Area 3-12
Status Quo Casino Capacity 3-14
Scenario Results for the Southeast Casino Zone Trade Area (Revenue Forecasts) 3-16
Section 4: South Central Gaming Zone
Summary of the Trade Area 4-1
Map - South Central Trade Area 4-2
Detailed Analysis of the Trade Area for the South Central Gaming Zone 4-6
Status Quo for the South Central Trade Area 4-9
Current Casino Gaming Capacity for the South Central Trade Area 4-11
Analyses of the Gaming Revenue Scenarios 4-13
Section 5: Southwest Gaming Zone
Summary of the Trade Area 5-1
Map - Southwest Trade Area 5-2
Detailed Analyses for the Trade Area for the Southwest Gaming Zone 5-6
Status Quo Casino Revenues & Visitors for the Southwest Zone's Trade Area 5-8
Status Quo Estimates of Casino Revenue Flows 5-9
Status Quo Southwest Trade Area Capacity 5-10
Future Capacity with Casino Growth 5-10
Scenario Analyses for the Southwest Trade Area (Revenue Forecasts) 5-11
Section 6: Wells Gaming Research Company Information
Services Offered & Richard H. Wells, Experience & Qualifications 6-1

Kansas Casino Market Study & Gaming Revenue Projections
Wells Gaming Research
May 2008
Section 1
Kansas Casino Market Study & Gaming Revenue Projections
May 2008 Wells Gaming Research Page 1-1
Introduction
The State of Kansas has lost gaming revenues for many years to a number of surrounding
states, particularly to Missouri and Oklahoma. The recent development of numerous tribal
casinos in Oklahoma exacerbated the problem. In an effort to stem the flow of gaming
revenues and related taxes, Kansas’ legislators passed Senate Bill 66 (the Kansas Expanded
Lottery Act), which legalized casino gaming. SB 66 was signed by the governor in 2007.
Key Provisions of Senate Bill 66
Some key provisions of SB 66 that pertain to this study include:
1. Establishment of four casino gaming zones:
• Northeast (located in Wyandotte County)
• Southeast (located in Crawford and Cherokee Counties)
• South Central (located in Sumner and Sedgwick Counties)
• Southwest (located in Ford County)
2. Building one state owned casino in each of the four Kansas gaming zones listed above.
3. Permitting an aggregate of 2,800 slot machines to be installed at the three existing
racetracks.
Senate Bill 66 required the counties located within the four subject gaming zones to hold
referendum elections for the purpose of either approving or disapproving casino gaming, or
slot machines to be located at their respective racetracks. Three gaming zones have
racetracks (northeast, southeast, and south central). However, Sedgwick County, located in
the south central gaming zone, rejected gaming in their referendum election. As a result, slot
machines will be limited to two Kansas racetracks: Woodlands Race Track located in the
Kansas City, Kansas (northeast gaming zone), and Camptown Greyhound Park (closed since
November 2000) located near Frontenac, Kansas (southeast gaming zone).
The Kansas Lottery Commission has appointed an independent Lottery Gaming Facility
Review Board to review all of the gaming applications and select the best ones. The Board
has engaged a number of outside consulting firms to help with the reviewing process. To
date, six gaming applications have been received for the northeast zone, one for the southeast
zone, four for the south central zone, and two for the southwest zone. The applicants that are
selected will be contract managers of the gaming facilities acting on behalf of the Kansas
Lottery Commission. As planned, the state will own and/or control the gaming portion of
the facilities. However, the lottery will select a contract manager who will manage the
gaming. The contract managers that are selected will fund, build, and operate all of the
facilities under contract with the state lottery.
The contract managers will also be required to pay the following taxes that are all based on a
percentage of casino gaming revenues:

Kansas Casino Market Study & Gaming Revenue Projections
May 2008 Wells Gaming Research Page 1-2
• The lottery facility would pay a minimum of 22% of gaming revenues to the state
plus an additional 2% to fund programs for problem gamblers and gaming addictions
issues.
• If a lottery gaming facility were located in either the northeast or southwest gaming
zones, but not in a city, the gaming facility would be required to pay an additional 3%
of gaming revenues to the county where the gaming facility was located.
• If, on the other hand, the gaming facility were located in a city, the facility would pay
1.5% of gaming revenues to the city and 1.5% to the county.
• If the lottery gaming facility were located in either the southeast or the south central
gaming zone, but not in a city, the gaming facility would pay 2% of gaming revenues
to the county in which the facility were located, and an additional 1% to the other
county in the gaming zone (each gaming zone has two counties).
• If a gaming facility were located in a city, a combined tax equal to 3% of gaming
revenues would be paid to the city (1%), to the county in which the facility were
located (1%), and to the second county in the gaming zone (1%).
These state owned casinos are unique and will be the first state owned casinos in the US.
Assessment of the Kansas Gaming Revenue Potential
Before enactment of Senate Bill 66 (the Kansas Expanded Lottery Act), the Kansas Lottery
Commission engaged Christensen Capital to update their study addressing the gaming
revenue potential for the four Kansas gaming zones. The updated study was released in
March of 2008.
To verify the gaming revenue potential, the Kansas Lottery Gaming Facility Review Board
has engaged a team of casino gaming consultants including Wells Gaming Research (WGR)
and Cummings & Associates. Both WGR and Cummings were engaged to conduct
independent evaluations of the gaming revenue potential as stated in Task 1 of the work
assignment. In essence, Task 1 requires a market analysis of each of the gaming zones in
Kansas that have been authorized for casino gaming. This involved estimating the gross
gaming revenues potential for a generic casino (not associated with any of the proposals) to
be located in each of the gaming zones, and projecting the potential revenue generation for
the State of Kansas. The results of studies conducted by WGR and Cummings will be
compared with the Christensen Study that was commissioned by the Lottery.
In compliance with the Kansas Lottery Gaming Facility Review Board’s Task 1 assignment,
WGR has conducted an independent assessment of the gaming revenue potential of the four
gaming zones. WGR’s work has been conducted totally independent of the work performed
by either Cummings or Christensen.

Kansas Casino Market Study & Gaming Revenue Projections
May 2008 Wells Gaming Research Page 1-3
Research Methodology & Scope of Work
To assess the gaming revenue potential of the four Kansas gaming zones, Wells Gaming
Research utilized its proprietary gravity modeling system to developed gravity models for
each of the subject gaming zones. Each gravity model was customized to reflect the market
conditions of the respective gaming zone.
The geographical trade areas for the gaming zones are illustrated by the circles on the map on
page 1-4. The trade area boundaries for each of the gaming zones extend approximately 100
miles from the proposed casino sites. Some degree of overlap does occur between the
boundaries of the gaming zones. The casinos proposed for Kansas, together with the two
racetracks (the Woodlands in Wyandotte County, and Camptown Greyhound Park in
Crawford County) have been plotted on the map. Also shown are the existing casinos with
which the new Kansas gaming facilities will be competing.
Three key definitions used in the discussions include:
• Gaming Zone - includes the two counties where Kansas Senate Bill 66 has
authorized casinos for each zone.
• Trade Area – encompasses the area within an approximate 100-mile radius of the
generic casino sites. The trade areas for the casino sites can extend into the
neighboring states of Oklahoma, Arkansas, Missouri, and to a limited extend to
Nebraska and Texas.
• Competitive Market - includes the approximate 150-mile region surrounding a
casino site where competitor casinos vie for players living within a 150-mile radius.
Key elements WGR’s research and analyses included, but were not limited to, the following:
• Detailed population data was obtained from the Bureau of Business & Economic
Research, University of Nevada, Reno at the census tract level for 2000 through 2012.
• The casino gaming capacities and amenities for existing casinos, expansions, and
proposed/planned casinos located within a 150-mile radius of the four casino
development sites were incorporated into the respective gravity models for each casino
site.
• Size, scope, and location assumptions were developed for the each of the four proposed
casinos and the two racetracks.
• The status quo period is 2007. Thus, statistics from 2007 were used to develop a
baseline case for each of the four gaming zones.

Copyright © and (P) 1988–2006 Microsoft Corporation and/or its suppliers. All rights reserved. http://www.microsoft.com/mappoint/Portions © 1990–2005 InstallShield Software Corporation. All rights reserved. Certain mapping and direction data © 2005 NAVTEQ. All rights reserved. The Data for areas of Canada includes information taken with permission from Canadian authorities, including: © Her Majesty the Queen in Right of Canada, © Queen's Printer for Ontario. NAVTEQ and NAVTEQ ON BOARD are trademarks of NAVTEQ. © 2005 Tele Atlas North America, Inc. All rights reserved. Tele Atlas and Tele Atlas North America are trademarks of Tele Atlas, Inc.
Kansas Lottery Project
0 mi 50 100 150 200 250

Kansas Casino Market Study & Gaming Revenue Projections
May 2008 Wells Gaming Research Page 1-5
• Current gaming revenues were projected for each of the gaming zones (gaming
revenues as they existed before any new casinos or expansions were built). In addition
to the baseline cases, WGR developed three primary scenarios per zone to forecast
gaming revenues.
Scenario-1 projected gaming revenue for the new Kansas Lottery Casino facility
as if it were the only new casino to be built in the gaming zone.
Scenario-2 included scenario-1 plus any proposed/planned casino expansions for
the gaming zone.
Scenario-3 included scenario-2 plus any new casinos that were planned/proposed
for the gaming zone.
• Three gaming revenue projections (low, mid, and high cases) were developed for each
scenario for the 2008 through 2012 period. WGR believes that three projection cases
encompass a reasonable performance range for casino gaming revenues. WGR prefers
not to develop single point projections because forecasting casino revenues is far from
an exact science. Many factors both known and unknown can cause actual
performance to vary significantly from the projections.
By way of background, WGR has developed a custom, proprietary, gravity model for use in
estimating gaming revenues at casinos, as well as for evaluating the impacts of increased
competition on those revenues. WGR’s gravity modeling methodology has proven to be a
flexible and effective tool for estimating gaming revenues for casino projects where the
interplay with existing and/or proposed competing casinos could affect future gaming
revenues.
The concept of gravity modeling is not new to the business world. William J. Reilly first
advanced the concept of a gravity model in 1931 in his book entitled Law of Retail
Gravitation. Gravity models use the principal of Isaac Newton’s law of gravity, wherein the
attraction between two objects is proportional to their mass, and is inversely proportional to
the square of their respective distances. Newton’s law of gravity dealt with planets, the
amount of gravitational force that they exert on each other, and the effects that the forces of
gravity have on their trajectory. This concept of gravitational force, or pull, can be applied to
various types of problems, including business, retail, and traffic. Reilly applied the concept
to retail shopping center trade area and customer attraction analysis.

Kansas Casino Market Study & Gaming Revenue Projections
May 2008 Wells Gaming Research Page 1-6
Summary of the Research Results for Kansas
To complete the Task 1 assignment, WGR developed four custom gravity models, one for
each of the gaming zones in Kansas. The gravity models were specifically designed to
project the gaming revenues for the trade areas surrounding the gaming zones.
Population statistics were one of the key variables used in the gravity models to project the
potential casino gaming revenues for the gaming zones. Statistics were compiled for both the
total and adult segments of the population to determine the size of the respective trade areas
for each gaming zones. The population statistics included in this report are limited to those
counties located within the specific trade areas and are not representative of the entire state.
Due to the age restrictions on casino gaming, only the adult statistics were used in the gravity
model’s gaming revenue projections.
Exhibit 1-1 shows a comparison of both the total and the adult populations for 2007 (status
quo) relative to 2012. The data are presented by state and include the total population for
184 counties located within the trade areas of each of the four gaming zones. The total
population for 2007 was approximately 7.3 million, with 7.6 million forecasted for 2012.
This reflects an average compound growth rate (ACGR) of less than one percent (0.8%).
The adult population segment has been projected to increase at the same rate as the total
population, moving up from approximately 5.1 million in 2007 to nearly 5.3 million by 2012.
Exhibit 1-1 Total & Adult Population by State for the Gaming Zones
2007 2012 ACGR
State Counties Total Adult Total Adult Adult Pop
AR 8 557,719 386,322 633,954 439,056 2.6%
KS 87 2,686,247 1,842,821 2,753,442 1,888,940 0.5%
MO 51 2,432,987 1,709,651 2,522,479 1,772,325 0.7%
NE 3 18,630 13,311 18,267 13,051 -0.4%
OK 33 1,617,373 1,120,631 1,681,085 1,164,451 0.8%
TX 2 12,779 8,518 13,385 8,919 0.9%
Total 184 7,325,735 5,081,253 7,622,612 5,286,741 0.8%
Data Sources: Bureau of Business & Economic Research, UNR & Wells Gaming Research, May 2008.

Kansas Casino Market Study & Gaming Revenue Projections
May 2008 Wells Gaming Research Page 1-7
Gaming Capacity Outlook with Proposed Growth
If all of the proposed expansions and new casinos were built, the accompanying capacity
statistics would approximate those profiled in Exhibits 1-2.
Exhibit 1-2 Capacity by State Includes Existing, Proposed Expansions & New Casinos
Kansas Oklahoma Missouri Iowa Total
Existing Casinos
# of Casinos 4 65 6 1 76
# of Slots 2,790 33,178 9,748 1,100 46,816
# of Tables 65 543 300 25 933
Expansions 1 5 0 0 6 1
Proposed New Casinos
# of Casinos 7 11 2 0 20
# of Slots 9,350 13,771 2,500 0 25,621
# of Tables 210 324 71 0 605
Total (Existing, New Casinos & Expansions)
# of Casinos 11 76 8 1 96
# of Slots 12,140 46,949 12,248 1,100 72,437
# of Tables 275 867 371 25 1,538
Percentage Increases (Existing Versus New Casinos & Expansions)
# of Casinos 175% 17% 33% 0% 26%
# of Slots 335% 42% 26% 0% 55%
# of Tables 323% 60% 24% 0% 65%
Footnote (1): The six expansions have not been added into the total number of casinos.
Data Source: Wells Gaming Research, May 2008.
The top section of Exhibit 1-2 shows the current capacity for all of the casinos located within
an approximate 150-mile radius of the four Kansas gaming zones. Currently there are 76
casinos equipped with 46,816 slot machines and 933 table games.
If all of the proposed expansions and new casinos were built, and the two racetracks installed
a combined total of 1,400 slot machines (800 at the Woodlands and 600 at Camptown), the
gaming capacity picture would look like the total section of Exhibit 1-2. The data shows that
the number of casinos would go from 76 to 96, an increase of 20 casinos (26%). It is
important to note that the six expansions have not been added into the total number of
locations; however, the gaming capacity has been added. Overall, slot capacity would
increase by 25,621 machines, up from 46,816 to 72,437 (55%). The number of table games
would increase by 605, up from 933 to 1,538 (65%).

Kansas Casino Market Study & Gaming Revenue Projections
May 2008 Wells Gaming Research Page 1-8
Competition
Strong competition already exists for the four Kansas gaming zones. The northeast zone is
subject to intense competition from the Kansas City, Missouri casinos and from Tribal
casinos located north of the gaming zone. In addition to being subject to strong existing
competition, both the southeast and the south central zones are vulnerable to increasing
competition from Oklahoma Tribal casinos, which are located to the south.
Status Quo Gaming Revenue Summary
Exhibit 1-3 profiles WGR’s status quo gaming revenues for 2007 and 2012. The gaming
revenue estimates are limited to all existing casinos. None of the proposed casinos or
expansions has been added.
Exhibit 1-3 Status Quo Casino Gaming Revenues for 2007 & Projections for 2012(Stated in Millions of Dollars)
2007 2012
State
Coming
From %
Going
To % Dif
Coming
From %
Going
To % Dif
IA $0 0.0% $9 0.4% $9 $0 0.0% $9 0.4% $9
AR $194 7.8% $0 0.0% -$194 $220 8.6% $0 0.0% -$220
KS $841 34.1% $148 6.0% -$693 $865 33.7% $152 5.9% -$713
MO $839 34.0% $1,009 40.9% $170 $869 33.8% $1,044 40.6% $175
NE $7 0.3% $0 0.0% -$7 $7 0.3% $0 0.0% -$7
OK $583 23.6% $1,300 52.7% $717 $605 23.6% $1,364 53.1% $759
TX $3 0.1% $0 0.0% -$3 $3 0.1% $0 0.0% -$3
Total $2,467 100.0% $2,467 100.0% $0 $2,569 100.0% $2,569 100.0% $0
Data Source: Wells Gaming Research, May 2008.
The 2007 status quo gaming revenues are illustrated on the left hand side of Exhibit 1-3.
The data shows where the gaming revenues come from and where they go. Total gaming
revenues were approximately $2.5 billion in 2007. The majority (92%) was generated in
three states including Kansas ($841 million, 34.1%), Missouri ($839 million, 34.0%), and
Oklahoma ($583 million, 24%). Of the total $2.5 billion, approximately $9.0 million (0.4%)
went to Iowa, $148 million (6.0%) went to Kansas, $1.0 billion (41%) went to Missouri, and
$1.3 billion (53%) went to Oklahoma. Of particular interest are the differences between the
revenues that were generated in Kansas and Oklahoma versus the revenues that flowed back
to these two states. For example, Kansas generated $841 million in 2007 and only retained
$148 million, a negative difference of $693 million. On the other hand, Oklahoma generated
$583 million in 2007, while $1.3 billion flowed back to Oklahoma for a gain of $717 million.

Kansas Casino Market Study & Gaming Revenue Projections
May 2008 Wells Gaming Research Page 1-9
The right hand side of Exhibit 1-3 shows that without the addition of new casinos or
expansions within any of the states referenced, the 2012 outlook is similar to that of 2007.
Total gaming revenues have been estimated at $2.6 billion (an increase of $102 million over
2007). Oklahoma has been forecasted to be the big winner generating $605 million in
gaming revenues (24% of the total), while receiving $1.4 billion (53%). Kansas has been
forecasted to generate $865 million (34% of the total), while retaining $152 million, for a
negative difference of $713 million. Missouri has been estimated to generate $869 million
(34.0%), with $1 billion flowing back to Missouri, a gain of $175 million.
Gaming Revenue Projections
With Casino Expansions & New Casinos
For purposes of estimating gaming revenues for our statewide gravity model, WGR
identified the competitor facilities (all known and existing casinos, together with all proposed
expansions and new casinos) that were located within the 150-mile trade area of each of the
four gaming zones. The results are summarized in Exhibit 1-4. The status quo gaming
revenues (2007) are shown, as well as the gaming revenue forecasts for 2012. The 2012
forecasts reflect the gaming revenue levels that could be achieved if all of the proposed
casino expansions and new casinos were built and were operational.
Exhibit 1-4 Casino Revenue Projections w/ New Casinos & Expansions(Stated in Millions of Dollars)
2007 2012
State
Coming
From %
Going
To % Dif
Coming
From %
Going
To % Dif
IA $0 0% $9 0% $9 $0 0% $6 0% $6
AR $194 8% $0 0% -$194 $225 8% $0 0% -$225
KS $841 34% $148 6% -$693 $936 35% $621 23% -$316
MO $839 34% $1,009 41% $170 $905 34% $837 31% -$68
NE $7 0% $0 0% -$7 $7 0% $0 0% -$7
OK $583 24% $1,300 53% $717 $609 23% $1,221 45% $612
TX $3 0% $0 0% -$3 $3 0% $0 0% -$3
Total $2,467 100% $2,467 100% $0 $2,684 100% $2,684 100% $0
Data Source: Wells Gaming Research, May 2008.
The 2007 statistics and results are the same as those presented in Exhibit 1-3, page 10.
WGR’s forecasts of the flow of casino gaming revenues for 2012 are summarized on the
right hand side of Exhibit 1-4. The major states of origin for 2012 continue to be Kansas
($936 million, 35%), Missouri ($905 million, 34%), and Oklahoma ($609 million, 23%).

Kansas Casino Market Study & Gaming Revenue Projections
May 2008 Wells Gaming Research Page 1-10
Oklahoma would continue to be the biggest recipient of gaming revenues with an estimated
$1.2 billion (45% of the total) flowing back. Missouri ranks second with $837 million
(31%), and Kansas ranks third with $621 million (23% of the total) staying in Kansas.
The detailed analyses and results are presented in the following sections of this report for
each of the four gaming zones:
• Section 2 – Northeast Trade Area & Gaming Zone
• Section 3 – Southeast Trade Area & Gaming Zone
• Section 4 – South Central Trade Area & Gaming Zone
• Section 5 – Southwest Trade Area & Gaming Zone

Kansas Casino Market Study & Gaming Revenue Projections
May 2008 Wells Gaming Research Page 1-11
Limiting Conditions
Wells Gaming Research, subject to the following conditions, presents the results of the
Kansas Casino Market Study & Gaming Revenue Projections to the Kansas Lottery
Gaming Facility Review Board.
Limit of Liability
The liability of Wells Gaming Research, a Nevada corporation, (hereinafter referred to as
WGR) and its employees, is limited to the named Client only. No obligation or liability to
any third party is foreseen. If this report is disseminated to anyone other than the Client, the
Client shall make each party aware of all of the limiting conditions, assumptions, and related
discussions of the assignment. If any of this data are used for limited partnerships,
syndication offerings, stock offerings, or debt offerings, the Client agrees that if any legal
action (including arbitration) is initiated by any lender, partner, part owner in any form of
ownership, tenant, or any other person or entity against WGR or its employees, then the
Client shall hold WGR and its employees completely harmless in any such action from any
and all awards or settlements of any type (including but not limited to the attorney's fees and
costs), regardless of the outcome(s).
Litigation Expenses
In the event that Wells Gaming Research (WGR), Richard H Wells, or any WGR staff
members are named as parties to a law suit or are compelled by a court to provide testimony
and documents relating to WGR’s work for the Kansas Lottery Gaming Facility Review
Board, Client agrees to reimburse WGR for all out-of-pocket expenses including attorney
fees, deposition expenses, travel, and document production expenses required to comply with
a court order or other litigation requirements. If WGR is compelled to be a witness in
litigation arising from this assignment, Client will reimburse WGR at one-half (1/2) WGR’s
customary billing rate for staff time required to comply with the court order.
Copies, Publication, Distribution, & Use of Report
Possession of this report or any copy thereof does not carry with it the right of publication,
nor may it be used for other than its intended limited purpose. The physical report(s) remain
the property of WGR for use by the Client. The fee, which the Client has paid, was only for
the Kansas Casino Market Study & Gaming Revenue Projections, the accompanying
analytical services, and the project reporting that was provided.
This report is to be used only in its entirety. No part is to be used or displayed without the
whole report.

Kansas Casino Market Study & Gaming Revenue Projections
May 2008 Wells Gaming Research Page 1-12
Except as hereinafter provided, the Client may only distribute copies of this report in its
entirety to such third parties as he may select on the conditions stated herein. Selected
portions of this report shall not be given to third parties without the prior written consent of
WGR. Neither this report nor any part of this report may be disseminated to the public by
the use of the advertising media, public relations, news, sales, or other media for public
communication without the prior written consent of WGR.
Information Used
No warranty is made for the accuracy of information furnished by others, the Client, his
designee, or public records. The data relied upon in this report has been confirmed and/or
sources thought reliable have been used. All sources and data are considered appropriate for
inclusion to the best of our factual judgment and knowledge. An impractical and
uneconomic expenditure of time would be required in attempting to furnish unimpeachable
verification of all data in all instances.
ACCEPTANCE AND/OR USE OF THE RESULTS AND ANALYSES CONTAINED
IN THIS REPORT BY THE CLIENT OR ANY THIRD PARTY CONSTITUTES
ACCEPTANCE OF THE ABOVE CONDITIONS. WGR'S LIABILITY EXTENDS
ONLY TO THE STATED CLIENT AND NOT TO SUBSEQUENT PARTIES OR
USERS. THESE STUDY RESULTS AND ANALYSES ARE NOT
REPRESENTATIONS OR GUARANTEES OF ANY SPECIFIC LEVEL OF
PERFORMANCE THAT MIGHT RESULT FROM THE ADDITION OR
EXPANSION OF CASINOS IN THE KANSAS GAMING MARKET.

Kansas Casino Market Study & Gaming Revenue Projections
Wells Gaming Research
May 2008
Section 2

Kansas Casino Market Study & Gaming Revenue Projections
May 2008 Wells Gaming Research Page 2-1
Summary of the Trade Area
for the Northeast Gaming Zone
Highlights of the market for the northeast trade area follow (refer to pages 2-7 through 2-32
for the corresponding detailed analyses and discussions).
Trade Area
The northeast trade area covers the approximate 100-mile radius surrounding Kansas City.
The boundaries extend to the Iowa border on the north; to Crawford County, Kansas and
Vernon County, Missouri on the south; Riley County, Kansas on the west; and Saline and
Cooper Counties, Missouri on the east (refer to the map on page 2-2).
Demographic Statistics
The population and median household income statistics included in this report are limited to
those counties included in the northeast gaming zone trade area and are not representative of
the entire states of Kansas, Missouri, and Nebraska.
Exhibit 2-1 shows that the trade area for the northeast zone includes 71 counties (32 in
Kansas, 36 in Missouri, and three in Nebraska). In 2007, these counties had an adult
population of approximately 2.17 million. Median household incomes (MHI) ranged from a
little over $40 thousand in Nebraska, to $48 thousand in Kansas, and approximately $50
thousand in Missouri.
Exhibit 2-1 Adult Population & Median Household Income (MHI)
2007 2007 2012 ACGR
State# of
CountiesAdult
Population MHIAdult
Population MHI
Adult Population
07 to 12MHI
07 to 12
KS 32 1,014,311 $47,985 1,051,085 $56,417 0.71% 3.29%
MO 36 1,146,430 $49,660 1,174,840 $56,720 0.49% 2.69%
NE 3 13,311 $40,160 13,051 $49,079 -0.39% 4.09%
Total 71 2,174,051 NA 2,238,976 NA 0.59% NA
Data Sources: Bureau of Business & Economic Research, UNR & Wells Gaming Research, May 2008.
The adult population forecasts increase from 2.17 million in 2007 to 2.24 million by 2012, or
by approximately 70 thousand. The average compound growth rate for the adult population
was 0.59% between 2007 and 2012. The average compound growth rate for adult population
ranged from a negative 0.39% (three small counties) in Nebraska, to 0.49% in Missouri, and
0.71% in Kansas.
The median household income levels for 2012 have been forecasted at a little over $49
thousand for Nebraska, $56.4 thousand for Kansas, and $56.7 thousand in Missouri.

Copyright © and (P) 1988–2006 Microsoft Corporation and/or its suppliers. All rights reserved. http://www.microsoft.com/mappoint/Portions © 1990–2005 InstallShield Software Corporation. All rights reserved. Certain mapping and direction data © 2005 NAVTEQ. All rights reserved. The Data for areas of Canada includes information taken with permission from Canadian authorities, including: © Her Majesty the Queen in Right of Canada, © Queen's Printer for Ontario. NAVTEQ and NAVTEQ ON BOARD are trademarks of NAVTEQ. © 2005 Tele Atlas North America, Inc. All rights reserved. Tele Atlas and Tele Atlas North America are trademarks of Tele Atlas, Inc.
Northeast Kansas Zone
0 mi 50 100 150

Kansas Casino Market Study & Gaming Revenue Projections
May 2008 Wells Gaming Research Page 2-3
Between 2007 and 2012, the average compound growth rate for median household incomes
ranged 2.69% in Missouri, to 3.29% in Kansas, to 4.09% in Nebraska.
Primary Market
The primary market for the northeast trade area of Kansas is made-up of the six counties
surrounding the casino in Wyandotte County. Exhibit 2-2 shows that the adult population
was approximately 1.2 million in 2007, 55% of the total adult population in the subject trade
area. Combined, the six counties located in the primary market have been projected to have
an average compound growth rate of 0.7% between 2007 and 2012.
The total adult population has been forecasted at slightly over 2.2 million for 2012 (for yearly
adult population details, refer Exhibit 2-7, page 2-9).
Exhibit 2-2 Adult Population for the Primary Market
# of Counties List of Counties 2007 2012
ACGR 07 to 12 % 2012
Johnson County, Kansas 364,462 395,339 1.6% 32%
Leavenworth, County, Kansas 49,948 51,318 0.5% 4%
Wyandotte County, Kansas 101,401 98,159 -0.6% 8%
Clay County, Missouri 147,253 154,829 1.0% 13%
Jackson County Missouri 467,495 470,818 0.1% 38%
Platte County, Missouri 59,691 64,189 1.5% 5%
6 Total of Wyandotte & Surrounding Counties 1,190,250 1,234,652 0.7% 100%
29Total Kansas Counties - Excluding Counties Surrounding Wyandotte 498,500 506,269 0.3%
33Total Missouri Counties - Excluding Counties Surrounding Wyandotte 471,990 485,004 0.5%
3 Total Nebraska 13,311 13,051 -0.4%
71 Total Adult Population for Trade Area 2,174,051 2,238,976 0.6%
Data Sources: Bureau of Business & Economic Research, UNR & Wells Gaming Research, May 2008.

Kansas Casino Market Study & Gaming Revenue Projections
May 2008 Wells Gaming Research Page 2-4
Capacity Statistics & Competition
Capacity statistics are a key component of gaming competition. Exhibit 2-3 shows the
existing capacity, and illustrates the increases that are anticipated in the northeast trade area.
The current capacity includes 18 gaming locations equipped with 16,914 slot machines, 440
table games (pit and poker), and 718 thousand square feet of casino space. Other visitor
amenities include 107 thousand square feet of convention space, 1,331 hotel rooms, 52
restaurants, 17 entertainment venues, and 19,150 parking spaces.
Following is a profile of the casino capacity located within a 150-mile radius of the
Wyandotte County casino site.
Exhibit 2-3 Capacity Statistics for Casinos
Located within an Approximate 150 Miles Radius
Existing Expansions New (Proposed) Casinos Total % Change
Capacity Casinos KS KS OK MO Capacity Above Existing
# of Loc 18 1 5 1 1 25 1
39%
# of Slots 16,914 500 6,050 2,000 1,200 26,664 58%
# of Tables 440 0 140 45 30 655 49%
Casino S.F. 717,691 0 20,000 70,000 40,000 847,691 18%
Convention S.F. 106,520 0 110,000 10,000 12,000 238,520 124%
# of Rooms 1,331 0 750 240 200 2,521 89%
# of Restaurants 52 0 16 2 3 73 40%
Entertainment 17 0 7 0 2 26 53%
Parking 19,150 0 11,000 2,700 2,200 35,050 83%
Footnote (1): The total number of locations is 25 (one is an expansion at an existing casino).
Data Source: Wells Gaming Research, May 2008.
The statistics show that the combined impact of casino growth within a 150-mile radius will
result in a significant escalation in player capacity. Some key changes include a 44%
increase in the number of gaming locations, from 18 up to 25 (one is an expansion only).
The slot machine inventory will increase by 58%, from approximately 17 thousand to 27
thousand. The number of table games will increase by 49%, going from 440 to 655. The
supply of hotel rooms will surge by 89%, from 1,331 to 2521, and the number of restaurants
will increase by 40%, from 52 to 73.

Kansas Casino Market Study & Gaming Revenue Projections
May 2008 Wells Gaming Research Page 2-5
Gaming Revenues
Exhibit 2-4 profiles the revenue flows corresponding to the current status (2007), as well as to
scenarios 1 through 3A (2012). These scenarios were developed to analyze the gaming
revenue impacts of the expansions and the new casinos. The column captions from and to
indicate the flow of gaming revenues. The current status reflects estimated total gaming
revenues of $923 million for the northeast trade area as of 2007. The net gaming revenue loss
for Kansas was $326 million. The majority, $275 million, went to Missouri, while $52
million went to Oklahoma.
The gaming revenues forecasted in scenarios 1 through 3A for 2012 were based on the
assumptions set forth in each scenario. The addition of the casino in Wyandotte County is the
key assumption of scenario 1. Total gaming revenues from Kansas increased from an
estimated $414 million (2007) to $445 million (2012). The net impact of adding Wyandotte
County increased the amount of gaming revenues retained by Kansas from $88 million to
$277 million, thereby reducing the Kansas gaming revenue deficit by $158 million.
Exhibit 2-4 Summary of the 2012 Flow of Gaming Revenues(Dollars in Millions)
Current 2007 S-1 2012 S-2 2012 S-3 2012 S-3-A 2012
ST From To Dif From To Dif From To Dif From To Dif From To Dif
IA $0 $3 $3 $0 $3 $3 $0 $3 $3 $0 $3 $3 $0 $3 $3
KS $414 $88 -$326 $445 $277 -$168 $445 $277 -$168 $458 $312 -$146 $458 $325 -$133
MO $504 $779 $275 $516 $641 $126 $516 $638 $123 $527 $621 $94 $523 $601 $79
NE $5 $0 -$5 $5 $0 -$5 $5 $0 -$5 $5 $0 -$5 $5 $0 -$5
OK $0 $52 $52 $0 $45 $45 $0 $48 $48 $0 $54 $54 $0 $57 $57
Total $923 $923 $0 $966 $966 $0 $966 $966 $0 $990 $990 $0 $985 $985 $0
Data Source: Wells Gaming Research, May 2008.
Scenario 2, shown above in Exhibit 2-4, includes the existing casinos, as well as the new
casino in Wyandotte County discussed in scenario 1. Scenario 2 also includes six casino
expansions: one at the Sac & Fox Casino in Powhattan, Kansas, tentatively scheduled to open
in March of 2008; and five expansions that are targeted to open at Oklahoma Tribal casinos
between 2008 and 2009. Included are the Creek Nation Casino in Tulsa, the Cherokee
Casino Resort in Catoosa, Kickapoo Casino in McLoud, the Osage Million Dollar Elm in
Ponca City, and the Cherokee Casino West Siloam Springs in Watts. These Oklahoma
casino expansions are too far away to trigger much change in gaming revenues for the trade
area of the northeast gaming zone. No changes are projected for the gaming revenues
coming from or going to Kansas. The net loss to Kansas remains at $168 million in scenario
2. However, the net gaming revenues flowing to Missouri decline by $3 million (down from
Kansas Casino Market Study & Gaming Revenue Projections
May 2008 Wells Gaming Research Page 2-6
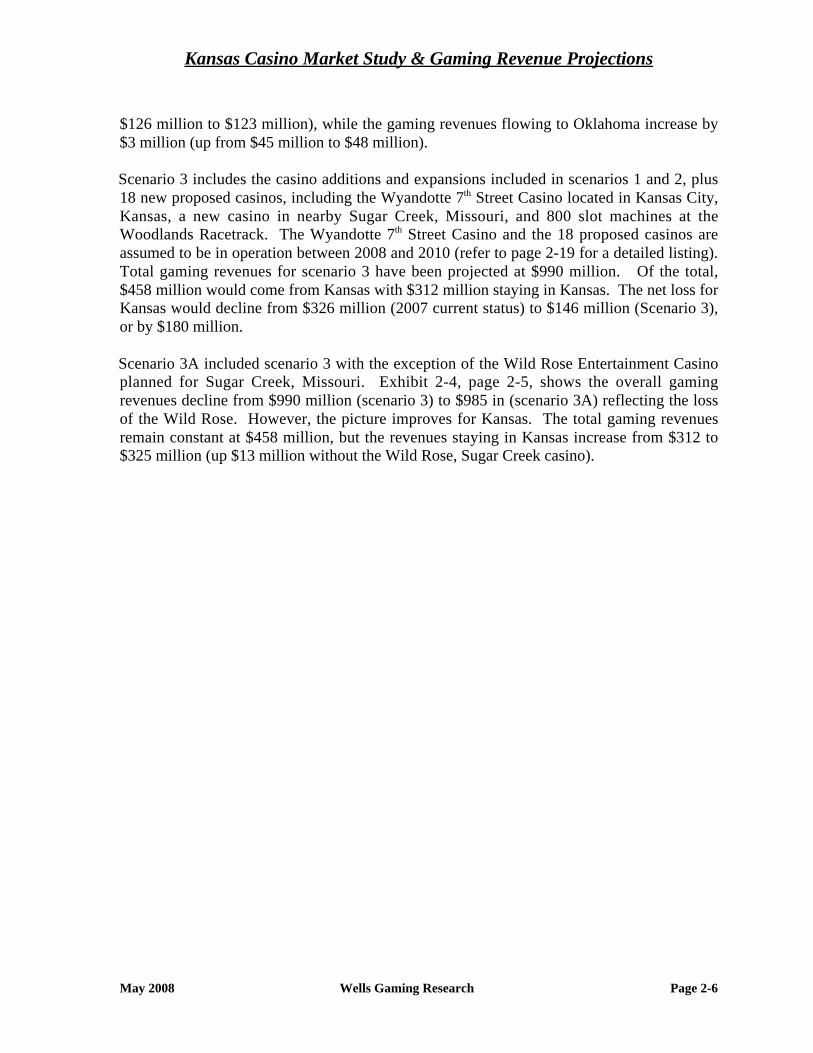
$126 million to $123 million), while the gaming revenues flowing to Oklahoma increase by
$3 million (up from $45 million to $48 million).
Scenario 3 includes the casino additions and expansions included in scenarios 1 and 2, plus
18 new proposed casinos, including the Wyandotte 7th Street Casino located in Kansas City,
Kansas, a new casino in nearby Sugar Creek, Missouri, and 800 slot machines at the
Woodlands Racetrack. The Wyandotte 7th Street Casino and the 18 proposed casinos are
assumed to be in operation between 2008 and 2010 (refer to page 2-19 for a detailed listing).
Total gaming revenues for scenario 3 have been projected at $990 million. Of the total,
$458 million would come from Kansas with $312 million staying in Kansas. The net loss for
Kansas would decline from $326 million (2007 current status) to $146 million (Scenario 3),
or by $180 million.
Scenario 3A included scenario 3 with the exception of the Wild Rose Entertainment Casino
planned for Sugar Creek, Missouri. Exhibit 2-4, page 2-5, shows the overall gaming
revenues decline from $990 million (scenario 3) to $985 in (scenario 3A) reflecting the loss
of the Wild Rose. However, the picture improves for Kansas. The total gaming revenues
remain constant at $458 million, but the revenues staying in Kansas increase from $312 to
$325 million (up $13 million without the Wild Rose, Sugar Creek casino).

Kansas Casino Market Study & Gaming Revenue Projections
May 2008 Wells Gaming Research Page 2-7
Detailed Report For
Northeast Gaming Zone Trade Area
Population statistics are one of the key variables used in WGR’s gravity model. WGR
compiled statistics for both the total and adult segments of the population for the northeast
trade area. However, due to the age restrictions on casino gaming, only the adult statistics
were used in the gravity model’s gaming revenue projections.
Total & Adult Population Statistics
Exhibit 2-5 shows that the total population for the northeast trade area was approximately 3
million in 2007. Of this, 2.2 million (69.6%) were adults. The statistics show 1.0 million
adults in Kansas (68.9% of the total), approximately 1.1 million in Missouri (70.3%), and
over 13 thousand adults in Nebraska (71.4% of the total population included in the northeast
trade area).
The total population is projected to be 3.2 million in 2012. Of the total, 2.2 million (69.6%)
are adults. The split between total and adult shows over 1.1 million adults in Kansas (69.0%
of the total), approximately 1.2 million in Missouri (70.2%), and over 13 thousand adults in
Nebraska (71.4%).
Exhibit 2-5 Total & Adult Population Statistics
2000 Total & Adult 2007 Total & Adult 2012 Total & Adult
ST
# of
CO Total Adult
Adult as a
% of
Total
Adult %
of Adult
Total Total Adult
Adult as
a % of
Total
Adult %
of Adult
Total Total Adult
Adult as
a % of
Total
Adult %
of Adult
Total
KS 32 1,389,813 957,425 68.9% 46.3% 1,471,327 1,014,311 68.9% 46.7% 1,524,101 1,051,085 69.0% 46.9%
MO 36 1,561,199 1,096,996 70.3% 53.0% 1,631,872 1,146,430 70.3% 52.7% 1,672,508 1,174,840 70.2% 52.5%
NE 3 20,194 14,433 71.5% 0.7% 18,630 13,311 71.4% 0.6% 18,267 13,051 71.4% 0.6%
TOT 71 2,971,206 2,068,854 69.6% 100.0% 3,121,829 2,174,051 69.6% 100.0% 3,214,876 2,238,976 69.6% 100.0%
Data Sources: Bureau of Business & Economics, University of Nevada, Reno & Wells Gaming Research.

Kansas Casino Market Study & Gaming Revenue Projections
May 2008 Wells Gaming Research Page 2-8
Exhibit 2-6 illustrates that the total population for the six counties surrounding the casino in
Wyandotte County was 1.7 million in 2007. Projections show an increase to approximately
1.8 million by 2012. Of the total, 32% would be located in Johnson County, Kansas, while
38% would be located in Jackson, Missouri. The trade area total for 2007 was 3.1 million
with projections for 3.2 million by 2012. Overall, the average compound growth rate has
been projected at 0.6% for the 2007 to 2012 period.
Exhibit 2-6 Total Population Statistics
# of
Co Counties 2000 2006 2007 2008 2009 2010 2011 2012
ACGR
07 to 12
% Pop/ Co
2012
Johnson KS 451,086 514,020 522,451 531,013 539,727 548,578 557,579 566,720 1.6% 32%
Leavenworth KS 68,691 71,413 71,803 72,193 72,585 72,979 73,378 73,775 0.5% 4%
Wyandotte KS 157,882 152,385 151,399 150,413 149,441 148,470 147,512 146,556 -0.6% 8%
Clay MO 184,006 206,957 209,136 211,339 213,564 215,813 217,845 219,896 1.0% 12%
Jackson MO 654,880 664,078 664,994 665,910 666,828 667,748 668,733 669,720 0.1% 38%
Platte MO 73,781 83,061 84,340 85,638 86,956 88,295 89,488 90,696 1.5% 5%
6 Total Surrounding Counties 1,590,326 1,691,914 1,704,123 1,716,506 1,729,101 1,741,883 1,754,535 1,767,363 0.7% 100%
29
Total Kansas Counties -
Excluding Surrounding
Counties 712,154 723,577 725,674 727,822 730,024 732,308 734,645 737,050 0.3%
33
Total Missouri Counties -
Excluding Surrounding
Counties 648,532 669,632 673,402 677,228 681,107 685,048 688,599 692,196 0.6%
3 Total Nebraska 20,194 18,707 18,630 18,553 18,477 18,401 18,334 18,267 -0.4%
71 Total Trade Area Pop 2,971,206 3,103,830 3,121,829 3,140,109 3,158,709 3,177,640 3,196,113 3,214,876 0.6%
Data Sources: Bureau of Business & Economics, University of Nevada, Reno & Wells Gaming Research.

Kansas Casino Market Study & Gaming Revenue Projections
May 2008 Wells Gaming Research Page 2-9
The adult population was approximately 1.2 million in 2007 for the counties surrounding the
casino in Wyandotte County (refer to Exhibit 2-7). Projections for 2012 indicate a minor
increase to 1.23 million with 38% in Jackson County Missouri and 32% in Johnson County,
Kansas. The total adult population of 2.2 million in 2007 is expected to increase to 2.24
million by 2012. Overall, the average compound growth rate has been projected at 0.6%
between 2007 and 2012.
Exhibit 2-7 Adult Population Statistics
# of
Co Counties 2000 2006 2007 2008 2009 2010 2011 2012
ACGR
07 to 12
% Pop/
Co 2012
Johnson KS 314,676 358,581 364,462 370,431 376,520 382,689 388,966 395,339 1.6% 32%
Leavenworth KS 47,782 49,676 49,948 50,217 50,490 50,764 51,042 51,318 0.5% 4%
Wyandotte KS 105,745 102,067 101,401 100,741 100,090 99,447 98,798 98,159 -0.6% 8%
Clay MO 129,559 145,719 147,253 148,804 150,371 151,954 153,385 154,829 1.0% 13%
Jackson MO 460,385 466,851 467,495 468,139 468,784 469,431 470,124 470,818 0.1% 38%
Platte MO 52,218 58,786 59,691 60,610 61,543 62,490 63,335 64,189 1.5% 5%
6 Total Surrounding Counties 1,110,365 1,181,680 1,190,250 1,198,942 1,207,798 1,216,776 1,225,649 1,234,652 0.7% 100%
29
Total Kansas Counties -
Excluding Surrounding
Counties 489,222 497,072 498,500 499,970 501,471 503,032 504,631 506,269 0.3%
33
Total Missouri Counties -
Excluding Surrounding
Counties 454,834 469,377 471,990 474,642 477,330 480,061 482,516 485,004 0.5%
3 Total Nebraska 14,433 13,366 13,311 13,256 13,201 13,146 13,098 13,051 -0.4%
71 Total Trade Area Population 2,068,854 2,161,496 2,174,051 2,186,809 2,199,800 2,213,015 2,225,895 2,238,976 0.6%
Data Sources: Bureau of Business & Economics, University of Nevada, Reno & Wells Gaming Research.
Average Median Household Income
Exhibit 2-8 shows that average median household income statistics for 2007 show
approximately $48 thousand for Kansas, $50 thousand for Missouri, and $40 thousand for
Nebraska. The median household income projections for 2012 include approximately $56
thousand for Kansas (ACGR of 3.3%), $57 thousand for Missouri (ACGR of 2.7%), and $49
thousand for Nebraska (ACGR of 4.1%).
Exhibit 2-8 Average Median Household Income Statistics
# of Co State 2000 2006 2007 2008 2009 2010 2011 2012
ACGR 07 to 12
32 KS $38,336 $46,466 $47,985 $49,557 $51,184 $52,868 $54,612 $56,417 3.3%
36 MO $41,111 $48,359 $49,660 $50,998 $52,372 $53,783 $55,232 $56,720 2.7%
3 NE $30,331 $38,586 $40,160 $41,801 $43,510 $45,290 $47,145 $49,079 4.1%
Data Sources: Bureau of Business & Economics, University of Nevada, Reno & Wells Gaming Research.

Kansas Casino Market Study & Gaming Revenue Projections
May 2008 Wells Gaming Research Page 2-10
Status Quo
for the Northeast Trade Area
Status Quo Casino Revenues
Exhibit 2-9 shows that the status quo casino gaming revenues were $923 million for 2007
($759 million within a 50 mile radius and approximately $164 million for other competing
casinos). Without any casino expansions or additions, gaming revenues in the northeast trade
area could be expected to increase to approximately $940.5 million by 2010, and to $952.2
million by 2012.
Exhibit 2-9 Revenues – 2007 Status Quo Northeast trade area
Revenue 2007 2008 2009 2010 2011 2012
Casinos w/in 50 miles $759,348,000 $764,333,000 $769,402,000 $774,557,000 $779,590,000 $784,703,000
Other Casinos Competing w/in Trade Area $163,641,400 $164,384,900 $165,140,600 $165,919,200 $166,696,800 $167,492,500
Total $922,989,400 $928,717,900 $934,542,600 $940,476,200 $946,286,800 $952,195,500
Data Sources: Wells Gaming Research, April 2008.
Status Quo Visitors
Exhibit 2-10 illustrates that the status quo casino visitors for 2007 totaled approximately 14
million (11.8 million within a 50 mile radius, and approximately 2.2 million for other
competing casinos). Absent any casino expansions or additions, the casino visitor counts
could be expected to increase to approximately 14.4 million by 2012.
Exhibit 2-10 Casino Visitors – 2007 Status Quo Northeast trade area
Visitors 2007 2008 2009 2010 2011 2012
Casinos w/in 50 miles 11,782,925 11,858,085 11,934,550 12,012,280 12,088,190 12,165,341
Other Casinos 2,162,247 2,172,745 2,183,478 2,194,525 2,205,619 2,217,065
Total 13,945,172 14,030,830 14,118,028 14,206,805 14,293,809 14,382,406
Data Sources: Wells Gaming Research, April 2008.

Kansas Casino Market Study & Gaming Revenue Projections
May 2008 Wells Gaming Research Page 2-11
Status Quo Gaming Revenue Flows
The status quo flow of casino revenues showing what could be expected if no new casino
developments occurred are profiled in Exhibit 2-11. Focusing on 2007, an estimated $923
million in gaming revenues was generated in the northeast trade area. Of this amount, an
estimated $414 million came from Kansas; however, Kansas only retained $88 million, a loss
of $326 million.
If there were no casinos expansions or new casinos added, WGR estimates that $952 million
could be generated in the northeast trade area by 2012. Of this amount, $431 million would
come from Kansas. However, only an estimated $91 million would flow back to Kansas (a
loss of over $340 million).
Exhibit 2-11 2007 Status Quo Estimates of the Casino Revenue Flows, Northeast Trade Area
Illustrates Where the Gaming Revenues Originated & Where They Went
Revenues Coming From
State 2007 2008 2009 2010 2011 2012 ACGR % 2012 Total
KS $414,186,842 $417,457,538 $420,805,847 $424,221,045 $427,702,492 $431,254,327 0.81% 45%
MO $503,538,602 $506,015,208 $508,514,591 $511,053,330 $513,397,492 $515,774,822 0.48% 54%
NE $5,264,895 $5,243,332 $5,222,491 $5,200,061 $5,183,145 $5,165,162 -0.38% 1%
Total $922,990,339 $928,716,078 $934,542,929 $940,474,436 $946,283,129 $952,194,311 0.62% 100%
Revenues Going To
State 2007 2008 2009 2010 2011 2012 ACGR % Total
IA $3,431,000 $3,442,000 $3,452,000 $3,463,000 $3,473,000 $3,484,000 0.31% 0%
KS $88,459,000 $88,869,000 $89,294,000 $89,733,000 $90,185,000 $90,653,000 0.49% 10%
MO $778,840,000 $783,919,000 $789,082,000 $794,332,000 $799,456,000 $804,662,000 0.65% 85%
OK $52,259,400 $52,487,900 $52,714,600 $52,948,200 $53,172,800 $53,396,500 0.43% 6%
Total $922,989,400 $928,717,900 $934,542,600 $940,476,200 $946,286,800 $952,195,500 0.62% 100%
Data Sources: Wells Gaming Research, April 2008.

Kansas Casino Market Study & Gaming Revenue Projections
May 2008 Wells Gaming Research Page 2-12
Status Quo Gaming Capacity
Gaming Capacity
Exhibit 2-12 shows that 18 casinos are currently located within approximately 150 miles of
the proposed casino site for the northeast zone. The combined gaming capacities is 16,914
slot machines, 367 pit table games, 73 poker tables, 868 bingo seats, one race book, and
717,691 square feet of casino space. Other amenities located at existing casinos include
106,520 square feet of convention/meeting space, 1,331 hotel rooms, 52 restaurants, 17
entertainment venues, and 19,150 parking spaces.
Exhibit 2-12 Status Quo Casino Capacity Statistics
# of
Loc Casino# of
Slots
# of Pit
Tables
# of
Poker
Tables
# of
Total
Tables
# of
Bingo
Seats
Race
Book
Casino
S.F.
Con-
vention
S.F.
# of
Rooms
# of
Restau-
rants
Enter-
tain-
ment
Park-
ing
Iowa:
1 Terrible's Lakeside Casino 1,100 22 3 25 0 0 37,480 8,000 60 2 2 1,500
Subtotal of Iowa 1,100 22 3 25 0 0 37,480 8,000 60 2 2 1,500
Kansas:
1 Casino White Cloud 350 6 3 9 500 0 21,000 0 0 1 0 500
2 Golden Eagle Casino 786 13 6 19 368 0 45,000 15,000 0 2 1 700
3 Prairie Band Casino & Resort 1,154 26 4 30 0 0 34,878 12,000 297 3 1 1,000
4 Sac & Fox Casino 500 7 0 7 0 0 53,000 0 0 4 0 400
Subtotal of Kansas 2,790 52 13 65 868 0 153,878 27,000 297 10 2 2,600
Missouri:
1 Ameristar Casino Hotel - Kansas City 3,016 90 15 105 0 0 140,000 14,520 184 11 3 2,660
2 Argosy Riverside Casino Hotel & Spa 1,924 39 8 47 0 0 62,000 18,000 258 5 3 2,700
3 Harrah's North Kansas City Casino & Hotel 1,793 60 12 72 0 0 60,133 10,000 392 6 1 3,122
4 Isle of Capri Casino - Boonville 905 27 6 33 0 0 28,000 12,000 140 3 1 1,102
5 Isle of Capri Casino - Kansas City 1,525 26 6 32 0 0 40,000 0 0 5 1 1,618
6 Terrible's St. Jo Frontier Casino 585 11 0 11 0 0 32,000 7,000 0 1 2 663
Subtotal of Missouri 9,748 253 47 300 0 0 362,133 61,520 974 31 11 11,865
Oklahoma:
1 Buffalo Run Casino 1,300 20 9 29 0 0 70,000 10,000 0 3 1 1,300
2 Eastern Shawnee Travel Plaza 186 0 0 0 0 0 3,000 0 0 0 0 150
3 High Winds Casino 500 8 0 8 0 0 35,000 0 0 2 0 450
4 Miami Tribe Entertainment 107 0 0 0 0 0 0 0 0 0 0 75
5 Peoria Gaming Center 200 0 0 0 0 0 4,200 0 0 1 0 250
6 Quapaw Casino 483 8 1 9 0 0 27,000 0 0 1 1 700
7 The Stables Casino 500 4 0 4 0 1 25,000 0 0 2 0 260
Subtotal of Oklahoma 3,276 40 10 50 0 1 164,200 10,000 0 9 2 3,185
18 Totals for Existing 18 Casinos 16,914 367 73 440 868 1 717,691 106,520 1,331 52 17 19,150
Data Sources: Wells Gaming Research, April 2008.

Kansas Casino Market Study & Gaming Revenue Projections
May 2008 Wells Gaming Research Page 2-13
Analyses of the Gaming Revenue Scenarios
WGR developed six scenarios for the northeast trade area. To project a range of potential
gaming revenue outcomes, WGR developed three cases (low, mid, and high) for each
scenario. The focus of the discussions that follow is on WGR’s mid case results. The mid
case was selected because it represents the most likely outcome.
Scenario 1
Scenario 1 includes the casinos currently competing for business within the northeast trade
area, together with the addition of the proposed generic casino to be located in Wyandotte
County.
The Wyandotte Casino has been projected to start operations in 2010 with a gaming capacity
that includes 3,000 slot machines and 100 table games. Other assumed amenities include
100,000 square feet of convention/meeting space, 500 hotel rooms, six restaurants, and five
entertainment venues (three small and two large).
Revenue Projections
The gaming revenue projections shown in Exhibit 2-13 include WGR’s low, mid, and high
case forecasts for 2010, and 2012. The mid case projections show casino gaming revenues of
$954 million for 2010, increasing to $966 million by 2012. The percentage increases in
gaming revenues over 2007 is 3.36% for 2010 and 4.7% for 2012. The mid case gaming
revenue projections for Wyandotte County are $198 million for 2010 increasing to $201
million for 2012.
Exhibit 2-13 Revenues for Scenario 1
Includes all Existing Casinos + Wyandotte County Proposed for 2010
Current Low Case Mid Case High Case
2007 2010 2012 2010 2012 2010 2012
*Wyandotte County Proposed $0 $156,720,000 $159,175,000 $198,369,000 $201,491,000 $262,328,000 $266,433,000
Casinos w/in 50 miles $759,348,000 $650,898,000 $659,018,000 $615,982,000 $623,502,000 $562,857,000 $569,496,000
All Other Casinos $163,641,400 $146,440,700 $147,815,700 $139,713,600 $141,015,600 $128,879,600 $130,082,700
Total Scenario 1 $922,989,400 $954,058,700 $966,008,700 $954,064,600 $966,008,600 $954,064,600 $966,011,700
Data Sources: Wells Gaming Research, April 2008.

Kansas Casino Market Study & Gaming Revenue Projections
May 2008 Wells Gaming Research Page 2-14
Gaming Revenue Impacts
Exhibit 2-14 shows that the major gaming revenue impact of adding Wyandotte County
would be a $159 million reduction in the category captioned casinos located within 50 miles.
WGR anticipates that this impact could increase to more than $161 million by 2012.
Exhibit 2-14 Revenue Impacts for Scenario 1
Includes all Existing Casinos + the Casino in Wyandotte County Proposed for 2010
Current Low Case Mid Case High Case
2007 2010 2012 2010 2012 2010 2012
*Wyandotte County Proposed $0 $156,720,000 $159,175,000 $198,369,000 $201,491,000 $262,328,000 $266,433,000
Casinos w/in 50 miles $0 -$123,659,000 -$125,685,000 -$158,575,000 -$161,201,000 -$211,700,000 -$215,207,000
All Other Casinos $0 -$19,478,500 -$19,676,800 -$26,205,600 -$26,476,900 -$37,039,600 -$37,409,800
Total Scenario 1 $0 $13,582,500 $13,813,200 $13,588,400 $13,813,100 $13,588,400 $13,816,200
Data Sources: Wells Gaming Research, April 2008.

Kansas Casino Market Study & Gaming Revenue Projections
May 2008 Wells Gaming Research Page 2-15
Forecasted Flow Funds
Scenario 1 shows that the northeast trade area generated an estimated $923 million in gaming
revenues in 2007 (refer to the first section of Exhibit 2-15 captioned Scenario 1 Revenues
Coming From). Of this amount, more than $414 million was generated in Kansas. Of the
$414 million, an estimated $88.5 million stayed in Kansas (a loss of $326 million). Refer to
the third section of Exhibit 2-15 captioned Scenario 1 Mid Case - Revenues Going To.
Conversely, $504 million of the $923 million was generated in Missouri in 2007, while $779
million went to Missouri (a $275 million gain).
WGR’s projections of the anticipated shifts in casino revenue flows indicate that of the $438
million projected to be generated in Kansas in 2010, $273 million would stay in Kansas. The
net loss would decline from the 2007 level of $326 million to $165 million by 2010.
Exhibit 2-15 Flows of Gaming Revenue Funds for Scenario 1
Illustrates Where the Gaming Revenues Originated & Where They Went
Scenario 1 Revenues Coming From
State 2007 % 2007 2008 2009 2010 % 2010 2011 2012 % 2012
KS $414,186,842 44.9% $417,457,538 $420,805,847 $437,796,175 45.9% $441,390,943 $445,057,329 46.1%
MO $503,538,602 54.6% $506,015,208 $508,514,591 $511,064,763 53.6% $513,409,080 $515,786,564 53.4%
NE $5,264,895 0.6% $5,243,332 $5,222,491 $5,200,061 0.5% $5,183,145 $5,165,162 0.5%
Total $922,990,339 100.0% $928,716,078 $934,542,929 $954,060,999 100.0% $959,983,168 $966,009,055 100.0%
Scenario 1 Low Case - Revenues Going To
State 2007 % 2007 2008 2009 2010 % 2010 2011 2012 % 2012
IA $3,431,000 0.4% $3,442,000 $3,452,000 $3,033,000 0.3% $3,042,000 $3,050,000 0.3%
KS $88,459,000 9.6% $88,869,000 $89,294,000 $235,128,000 24.6% $236,747,000 $238,403,000 24.7%
MO $778,840,000 84.4% $783,919,000 $789,082,000 $669,200,000 70.1% $673,311,000 $677,488,000 70.1%
OK $52,259,400 5.7% $52,487,900 $52,714,600 $46,697,700 4.9% $46,883,200 $47,067,700 4.9%
Total $922,989,400 100.0% $928,717,900 $934,542,600 $954,058,700 100.0% $959,983,200 $966,008,700 100.0%
Scenario 1 Mid Case - Revenues Going To
State 2007 % 2007 2008 2009 2010 % 2010 2011 2012 % 2012
IA $3,431,000 0.4% $3,442,000 $3,452,000 $2,888,000 0.3% $2,895,000 $2,903,000 0.3%
KS $88,459,000 9.6% $88,869,000 $89,294,000 $272,905,000 28.6% $274,838,000 $276,813,000 28.7%
MO $778,840,000 84.4% $783,919,000 $789,082,000 $633,767,000 66.4% $637,578,000 $641,449,000 66.4%
OK $52,259,400 5.7% $52,487,900 $52,714,600 $44,504,600 4.7% $44,671,900 $44,843,600 4.6%
Total $922,989,400 100.0% $928,717,900 $934,542,600 $954,064,600 100.0% $959,982,900 $966,008,600 100.0%
Scenario 1 High Case - Revenues Going To
State 2007 % 2007 2008 2009 2010 % 2010 2011 2012 % 2012
IA $3,431,000 0.4% $3,442,000 $3,452,000 $2,651,000 0.3% $2,658,000 $2,665,000 0.3%
KS $88,459,000 9.6% $88,869,000 $89,294,000 $330,654,000 34.7% $333,050,000 $335,494,000 34.7%
MO $778,840,000 84.4% $783,919,000 $789,082,000 $579,773,000 60.8% $583,143,000 $586,565,000 60.7%
OK $52,259,400 5.7% $52,487,900 $52,714,600 $40,986,600 4.3% $41,133,300 $41,287,700 4.3%
Total $922,989,400 100.0% $928,717,900 $934,542,600 $954,064,600 100.0% $959,984,300 $966,011,700 100.0%
Data Source: Wells Gaming Research, April 2008.

Kansas Casino Market Study & Gaming Revenue Projections
May 2008 Wells Gaming Research Page 2-16
Scenario 2
Scenario 2 incorporates scenario 1 and the following casino expansions:
Kansas
1. Sac & Fox Casino in Powhattan, KS (March 2008)
Oklahoma
1. Creek Nation Casino in Tulsa, OK (September 2008)
2. Cherokee Casino Resort in Catoosa, OK (January 2009)
3. Cherokee Casino West Siloam Springs in Watts, OK (July 2009)
4. Kickapoo Casino in McLoud, OK (January 2009)
5. Osage Million Dollar Elm in Ponca City, OK (January 2009)
Revenue Forecasts
Exhibit 2-16 shows total gaming revenue projections of $954 million for scenario 2 for the
2010 mid case. Included were $197 flowing to Wyandotte County, $613 million going to
other casinos located within a 50-miles, and $144 million going to all other casinos located
in the northeast trade area. Total gaming revenue projections for the mid-case are close to
the forecasts developed for scenario 1. However, with the expansions listed above, gaming
revenues for Wyandotte County are expected to decrease from $198.4 million to $197.1 (a
$1.3 million decline) in 2010, and from $201.5 million to $200.2 million in 2012 (a $1.3
million decrease).
Exhibit 2-16 Revenues for Scenario 2
Includes Scenario 1 + the Expansions Listed Above
Current Low Case Mid Case High Case
2007 2010 2012 2010 2012 2010 2012
*Wyandotte County Proposed $0 $155,714,000 $158,159,000 $197,138,000 $200,247,000 $260,796,000 $264,885,000
Casinos w/in 50 miles $759,348,000 $647,663,000 $655,753,000 $613,087,000 $620,580,000 $560,453,000 $567,069,000
All Other Casinos $163,641,400 $150,686,600 $152,095,700 $143,836,700 $145,180,600 $132,812,900 $134,053,100
Total Scenario 2 $922,989,400 $954,063,600 $966,007,700 $954,061,700 $966,007,600 $954,061,900 $966,007,100
Data Sources: Wells Gaming Research, April 2008.

Kansas Casino Market Study & Gaming Revenue Projections
May 2008 Wells Gaming Research Page 2-17
Revenue Impacts
Exhibit 2-17 illustrates that the gaming revenue impacts triggered by the casino expansions
proposed in scenario 2 could result in the following revenue shifts when scenario 2 is
compared with scenario 1. Shown are a loss of $1.2 million in 2010 for Wyandotte County,
and a loss of $2.9 million for casinos located within a 50-miles. The all other casinos
category could expect an approximate gain of $4.1 million.
Exhibit 2-17 Includes the Revenue Impacts for Scenario 2
Scenario 2 Includes Scenario 1 + the Expansions
Current Low Case Mid Case High Case
2007 2010 2012 2010 2012 2010 2012
*Wyandotte County Proposed $0 -$1,006,000 -$1,016,000 -$1,231,000 -$1,244,000 -$1,532,000 -$1,548,000
Casinos w/in 50 miles $0 -$3,235,000 -$3,265,000 -$2,895,000 -$2,922,000 -$2,404,000 -$2,427,000
All Other Casinos $0 $4,245,900 $4,280,000 $4,123,100 $4,165,000 $3,933,300 $3,970,400
Total Scenario 2 $0 $4,900 -$1,000 -$2,900 -$1,000 -$2,700 -$4,600
Data Sources: Wells Gaming Research, April 2008.

Kansas Casino Market Study & Gaming Revenue Projections
May 2008 Wells Gaming Research Page 2-18
Revenue Flows
The addition of Wyandotte County (scenario 1), together with the expansions at the casinos
listed on page 2-16 (scenario 2), trigger the shifts in casino revenue flows that are shown in
Exhibit 2-18. Out of the $438 million generated in Kansas in 2010 (refer to the first section
of Exhibit 2-18 captioned Scenario 2 Revenues Coming From), an estimated $273 million
would stay in Kansas in the 2010 mid case (refer to the third section of Exhibit 2-18
captioned Scenario 2 Mid Case - Revenues Going To). With the addition of the casino in
Wyandotte County and the casino expansions included in scenario 2, the net loss would
decline from $326 million (2007) to $165 million (2010).
Given the scenario 2 assumptions, Missouri would continue to be the biggest recipient of the
gaming revenues generated in the northeast trade area. The net difference between what
could be generated in Missouri and what could flow back to Missouri (scenario 2 mid case)
has been estimated at $120 million.
Exhibit 2-18 Flows of Gaming Revenue Funds for Scenario 2
Illustrates Where the Gaming Revenues Originated & Where They Went
Scenario 2 Revenues Coming From
State 2007 % 2007 2008 2009 2010 % 2010 2011 2012 % 2012
KS $414,186,842 44.9% $417,457,538 $420,805,847 $437,796,175 45.9% $441,390,943 $445,057,329 46.1%
MO $503,538,602 54.6% $506,015,208 $508,514,591 $511,064,763 53.6% $513,409,080 $515,786,564 53.4%
NE $5,264,895 0.6% $5,243,332 $5,222,491 $5,200,061 0.5% $5,183,145 $5,165,162 0.5%
Total $922,990,339 100.0% $928,716,078 $934,542,929 $954,060,999 100.0% $959,983,168 $966,009,055 100.0%
Scenario 2 Low Case - Revenues Going To
State 2007 % 2007 2008 2009 2010 % 2010 2011 2012 % 2012
IA $3,431,000 0.4% $3,395,000 $3,379,000 $2,974,000 0.3% $2,982,000 $2,991,000 0.3%
KS $88,459,000 9.6% $91,076,000 $90,919,000 $235,742,000 24.7% $237,364,000 $239,021,000 24.7%
MO $778,840,000 84.4% $781,122,000 $784,324,000 $665,741,000 69.8% $669,834,000 $673,996,000 69.8%
OK $52,259,400 5.7% $53,121,900 $55,920,800 $49,606,600 5.2% $49,805,100 $49,999,700 5.2%
Total $922,989,400 100.0% $928,714,900 $934,542,800 $954,063,600 100.0% $959,985,100 $966,007,700 100.0%
Scenario 2 Mid Case - Revenues Going To
State 2007 % 2007 2008 2009 2010 % 2010 2011 2012 % 2012
IA $3,431,000 0.4% $3,395,000 $3,379,000 $2,833,000 0.3% $2,841,000 $2,849,000 0.3%
KS $88,459,000 9.6% $91,076,000 $90,919,000 $273,277,000 28.6% $275,212,000 $277,186,000 28.7%
MO $778,840,000 84.4% $781,122,000 $784,324,000 $630,663,000 66.1% $634,460,000 $638,316,000 66.1%
OK $52,259,400 5.7% $53,121,900 $55,920,800 $47,288,700 5.0% $47,472,200 $47,656,600 4.9%
Total $922,989,400 100.0% $928,714,900 $934,542,800 $954,061,700 100.0% $959,985,200 $966,007,600 100.0%
Scenario 2 High Case - Revenues Going To
State 2007 % 2007 2008 2009 2010 % 2010 2011 2012 % 2012
IA $3,431,000 0.4% $3,395,000 $3,379,000 $2,604,000 0.3% $2,611,000 $2,618,000 0.3%
KS $88,459,000 9.6% $91,076,000 $90,919,000 $330,696,000 34.7% $333,089,000 $335,533,000 34.7%
MO $778,840,000 84.4% $781,122,000 $784,324,000 $577,184,000 60.5% $580,540,000 $583,951,000 60.4%
OK $52,259,400 5.7% $53,121,900 $55,920,800 $43,577,900 4.6% $43,743,600 $43,905,100 4.5%
Total $922,989,400 100.0% $928,714,900 $934,542,800 $954,061,900 100.0% $959,983,600 $966,007,100 100.0%
Data Source: Wells Gaming Research, April 2008.

Kansas Casino Market Study & Gaming Revenue Projections
May 2008 Wells Gaming Research Page 2-19
Scenario 3
Scenario 3 includes scenario 2, plus the other proposed casinos listed below:
Kansas
1. Wyandotte 7th Street Casino in Kansas City, KS (January 2008)
2. The Woodlands in Kansas City, KS (January 2009)
3. Camptown Greyhound Park planned for in Frontenac, KS (January 2009)
4. Cherokee County planned in Baxter Springs, KS (January 2010)
5. Sumner County planned in Wellington, KS (January 2010)
Missouri
1. Barden Development, Inc. planned in Branson, MO (targeted for 2010)
2. Wild Rose Entertainment casino planned for Sugar Creek, MO (January 2010)
Oklahoma
1. Downstream Casino Resort in Ottawa, OK (July 2008)
2. First Council Casino in for Newkirk, OK (March 2008)
3. Seneca-Cayuga Tribes of Oklahoma planned in Grove, OK (July 2008)
4. Ioway Casino Resort in Lincoln, OK (January 2009)
5. Muscogee Creek Nation planned in Eufaula, OK (planned for 2010)
6. Pawnee Nation Planned in Chilocco, OK (targeted or 2010)
7. Ponca Tribe Oklahoma planned in Ponca City, OK (proposed for 2010)
8. Poteau Travel and Smoke Shop in Poteau, OK (planned for 2010)
9. Shawnee Tribe Oklahoma planned in Oklahoma City, OK (targeted for 2010)
10. Wichita & Affiliated Tribes planned in Hinton, OK (proposed for 2010)
11. Wilburton Travel and Smoke Shop in Wilburton, OK (planned for 2010)
Kansas Casino Market Study & Gaming Revenue Projections
May 2008 Wells Gaming Research Page 2-20
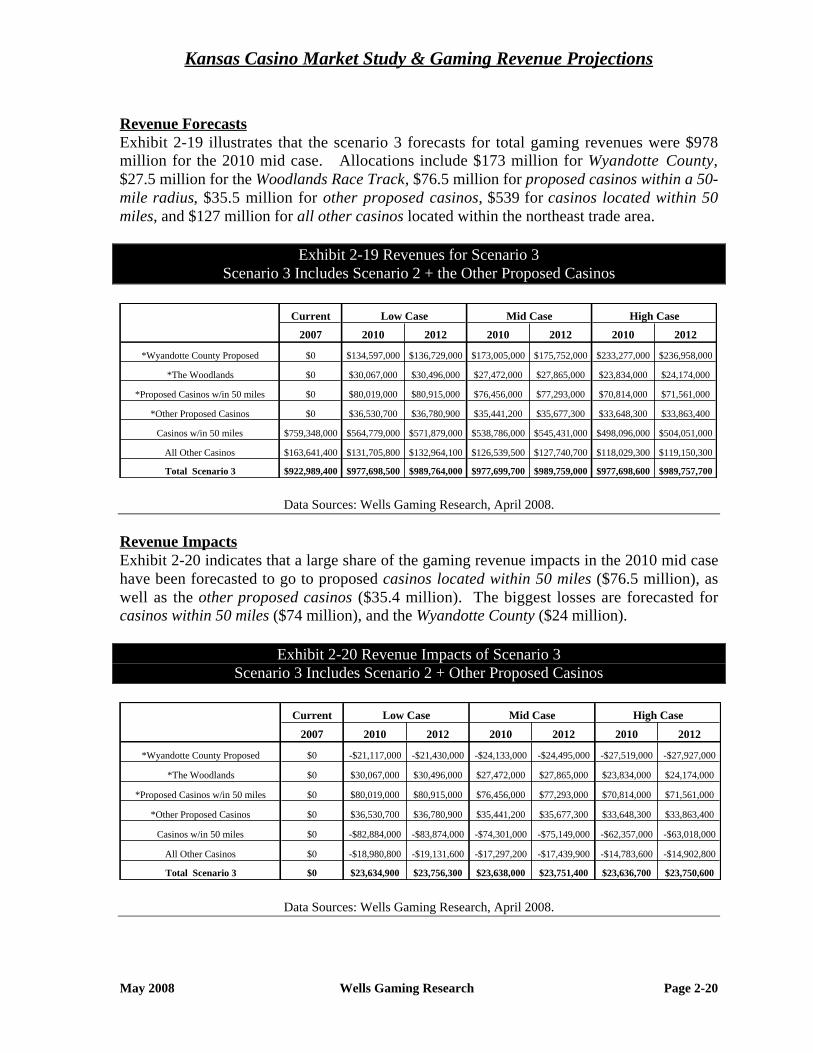
Revenue Forecasts
Exhibit 2-19 illustrates that the scenario 3 forecasts for total gaming revenues were $978
million for the 2010 mid case. Allocations include $173 million for Wyandotte County,
$27.5 million for the Woodlands Race Track, $76.5 million for proposed casinos within a 50-
mile radius, $35.5 million for other proposed casinos, $539 for casinos located within 50
miles, and $127 million for all other casinos located within the northeast trade area.
Exhibit 2-19 Revenues for Scenario 3
Scenario 3 Includes Scenario 2 + the Other Proposed Casinos
Current Low Case Mid Case High Case
2007 2010 2012 2010 2012 2010 2012
*Wyandotte County Proposed $0 $134,597,000 $136,729,000 $173,005,000 $175,752,000 $233,277,000 $236,958,000
*The Woodlands $0 $30,067,000 $30,496,000 $27,472,000 $27,865,000 $23,834,000 $24,174,000
*Proposed Casinos w/in 50 miles $0 $80,019,000 $80,915,000 $76,456,000 $77,293,000 $70,814,000 $71,561,000
*Other Proposed Casinos $0 $36,530,700 $36,780,900 $35,441,200 $35,677,300 $33,648,300 $33,863,400
Casinos w/in 50 miles $759,348,000 $564,779,000 $571,879,000 $538,786,000 $545,431,000 $498,096,000 $504,051,000
All Other Casinos $163,641,400 $131,705,800 $132,964,100 $126,539,500 $127,740,700 $118,029,300 $119,150,300
Total Scenario 3 $922,989,400 $977,698,500 $989,764,000 $977,699,700 $989,759,000 $977,698,600 $989,757,700
Data Sources: Wells Gaming Research, April 2008.
Revenue Impacts
Exhibit 2-20 indicates that a large share of the gaming revenue impacts in the 2010 mid case
have been forecasted to go to proposed casinos located within 50 miles ($76.5 million), as
well as the other proposed casinos ($35.4 million). The biggest losses are forecasted for
casinos within 50 miles ($74 million), and the Wyandotte County ($24 million).
Exhibit 2-20 Revenue Impacts of Scenario 3
Scenario 3 Includes Scenario 2 + Other Proposed Casinos
Current Low Case Mid Case High Case
2007 2010 2012 2010 2012 2010 2012
*Wyandotte County Proposed $0 -$21,117,000 -$21,430,000 -$24,133,000 -$24,495,000 -$27,519,000 -$27,927,000
*The Woodlands $0 $30,067,000 $30,496,000 $27,472,000 $27,865,000 $23,834,000 $24,174,000
*Proposed Casinos w/in 50 miles $0 $80,019,000 $80,915,000 $76,456,000 $77,293,000 $70,814,000 $71,561,000
*Other Proposed Casinos $0 $36,530,700 $36,780,900 $35,441,200 $35,677,300 $33,648,300 $33,863,400
Casinos w/in 50 miles $0 -$82,884,000 -$83,874,000 -$74,301,000 -$75,149,000 -$62,357,000 -$63,018,000
All Other Casinos $0 -$18,980,800 -$19,131,600 -$17,297,200 -$17,439,900 -$14,783,600 -$14,902,800
Total Scenario 3 $0 $23,634,900 $23,756,300 $23,638,000 $23,751,400 $23,636,700 $23,750,600
Data Sources: Wells Gaming Research, April 2008.

Kansas Casino Market Study & Gaming Revenue Projections
May 2008 Wells Gaming Research Page 2-21
Revenue Flows
Exhibit 2-21 illustrates the impact of the proposed casinos in Kansas, Missouri, and
Oklahoma listed under scenario 3. Kansas would generate $450 million in gaming revenues
for 2010 in scenario 3 (refer to the first section of Exhibit 2-21 captioned Scenario 3
Revenues Coming From). Of this amount, the mid case shows that $308 million would stay
in Kansas. The net loss would be $142 million (refer to the third section of Exhibit 2-21
captioned Scenario 3 Mid Case - Revenues Going To). This compares with the net loss
sustained in 2007 of $326 million without the casino additions or expansions.
Given the scenario 3 assumptions, Missouri could generate $522 million in the 2010. Of this
amount, $614 million should stay in Missouri for an estimated gain of $92 million in the
2010 mid case.
Exhibit 2-21 Flow of Gaming Revenue Funds for Scenario 3
Illustrates Where the Gaming Revenues Originated & Where They Went
Scenario 3 Revenues Coming From
State 2007 % 2007 2008 2009 2010 % 2010 2011 2012 % 2012
KS $414,186,842 44.9% $423,652,322 $443,800,724 $450,309,623 46.1% $453,908,437 $457,579,439 46.2%
MO $503,538,602 54.6% $507,231,917 $515,228,137 $522,188,007 53.4% $524,584,410 $527,014,529 53.2%
NE $5,264,895 0.6% $5,243,332 $5,222,491 $5,200,061 0.5% $5,183,145 $5,165,162 0.5%
Total $922,990,339 100.0% $936,127,571 $964,251,352 $977,697,691 100.0% $983,675,992 $989,759,130 100.0%
Scenario 3 Low Case - Revenues Going To
State 2007 % 2007 2008 2009 2010 % 2010 2011 2012 % 2012
IA $3,431,000 0.4% $3,288,000 $3,184,000 $2,592,000 0.3% $2,599,000 $2,606,000 0.3%
KS $88,459,000 9.6% $115,665,000 $169,575,000 $276,469,000 28.3% $278,278,000 $280,127,000 28.3%
MO $778,840,000 84.4% $755,543,000 $726,933,000 $642,410,000 65.7% $646,357,000 $650,365,000 65.7%
OK $52,259,400 5.7% $61,628,400 $64,557,700 $56,227,500 5.8% $56,445,200 $56,666,000 5.7%
Total $922,989,400 100.0% $936,124,400 $964,249,700 $977,698,500 100.0% $983,679,200 $989,764,000 100.0%
Scenario 3 Mid Case - Revenues Going To
State 2007 % 2007 2008 2009 2010 % 2010 2011 2012 % 2012
IA $3,431,000 0.4% $3,288,000 $3,184,000 $2,487,000 0.3% $2,493,000 $2,500,000 0.3%
KS $88,459,000 9.6% $115,665,000 $169,575,000 $307,684,000 31.5% $309,754,000 $311,871,000 31.5%
MO $778,840,000 84.4% $755,543,000 $726,933,000 $613,558,000 62.8% $617,256,000 $621,013,000 62.7%
OK $52,259,400 5.7% $61,628,400 $64,557,700 $53,970,700 5.5% $54,171,400 $54,375,000 5.5%
Total $922,989,400 100.0% $936,124,400 $964,249,700 $977,699,700 100.0% $983,674,400 $989,759,000 100.0%
Scenario 3 High Case - Revenues Going To
State 2007 % 2007 2008 2009 2010 % 2010 2011 2012 % 2012
IA $3,431,000 0.4% $3,288,000 $3,184,000 $2,312,000 0.2% $2,318,000 $2,324,000 0.2%
KS $88,459,000 9.6% $115,665,000 $169,575,000 $356,873,000 36.5% $359,345,000 $361,864,000 36.6%
MO $778,840,000 84.4% $755,543,000 $726,933,000 $568,240,000 58.1% $571,560,000 $574,933,000 58.1%
OK $52,259,400 5.7% $61,628,400 $64,557,700 $50,273,600 5.1% $50,455,200 $50,636,700 5.1%
Total $922,989,400 100.0% $936,124,400 $964,249,700 $977,698,600 100.0% $983,678,200 $989,757,700 100.0%
Data Source: Wells Gaming Research, April 2008.

Kansas Casino Market Study & Gaming Revenue Projections
May 2008 Wells Gaming Research Page 2-22
Scenario 3A
The data shown in Exhibit 2-22 for scenario 3A is the same as scenario 3, but without the
Wild Rose Entertainment Casino that is planned for Sugar Creek, Missouri.
Revenue Forecasts
Overall, the mid case revenue projections for scenario 3A for 2010 are $5 million lower than
in scenario 3 ($978 versus $973). The biggest difference would be for proposed casinos
located within a 50-mile radius. The scenario 3 total was $76.5 million. In scenario 3A,
revenues for this group slip to $20 million reflecting, in part, the loss of the Wild Rose.
Exhibit 2-22 Revenues for Scenario 3A
Scenario 3A Includes Scenario 3 w/o the Wild Rose Sugar Creek Casino
Current Low Case Mid Case High Case
2007 2010 2012 2010 2012 2010 2012
*Wyandotte County Proposed $0 $141,099,000 $143,341,000 $180,935,000 $183,813,000 $243,089,000 $246,923,000
*The Woodlands $0 $31,529,000 $31,980,000 $28,742,000 $29,155,000 $24,850,000 $25,205,000
*Proposed Casinos w/in 50 miles $0 $21,049,000 $21,265,000 $19,818,000 $20,014,000 $17,934,000 $18,102,000
*Other Proposed Casinos $0 $37,669,300 $37,928,500 $36,479,700 $36,725,900 $34,534,800 $34,758,900
Existing Casinos w/in 50 miles $759,348,000 $605,441,000 $612,987,000 $576,408,000 $583,448,000 $531,134,000 $537,416,000
All Other Existing Casinos $163,641,400 $136,522,300 $137,816,600 $130,925,500 $132,165,600 $121,762,300 $122,918,500
Total Scenario 3A $922,989,400 $973,309,600 $985,318,100 $973,308,200 $985,321,500 $973,304,100 $985,323,400
Data Sources: Wells Gaming Research, April 2008.
Revenue Impacts
The gaming revenue impacts linked to scenario 3A show an overall net gain of $19 million
(refer to Exhibit 2-23). The major gains are in the category captioned other proposed casinos
($36.5 million) and the Woodlands ($29 million). The casinos located within 50 miles ($37
million) and Wyandotte County ($16 million) are the most likely to sustain the major losses.
Exhibit 2-23 Revenue Impacts for Scenario 3A
Scenario 3A Includes Scenario 3 w/o the Wild Rose Sugar Creek Casino
Current Low Case Mid Case High Case
2007 2010 2012 2010 2012 2010 2012
*Wyandotte County Proposed $0 -$14,615,000 -$14,818,000 -$16,203,000 -$16,434,000 -$17,707,000 -$17,962,000
*The Woodlands $0 $31,529,000 $31,980,000 $28,742,000 $29,155,000 $24,850,000 $25,205,000
*Proposed Casinos w/in 50 miles $0 $21,049,000 $21,265,000 $19,818,000 $20,014,000 $17,934,000 $18,102,000
*Other Proposed Casinos $0 $37,669,300 $37,928,500 $36,479,700 $36,725,900 $34,534,800 $34,758,900
Existing Casinos w/in 50 miles $0 -$42,222,000 -$42,766,000 -$36,679,000 -$37,132,000 -$29,319,000 -$29,653,000
All Other Existing Casinos $0 -$14,164,300 -$14,279,100 -$12,911,200 -$13,015,000 -$11,050,600 -$11,134,600
Total Scenario 3A $0 $19,246,000 $19,310,400 $19,246,500 $19,313,900 $19,242,200 $19,316,300
Data Sources: Wells Gaming Research, April 2008.

Kansas Casino Market Study & Gaming Revenue Projections
May 2008 Wells Gaming Research Page 2-23
Revenue Flows
Exhibit 2-24 shows the gaming revenue flows for scenario 3A (excludes the Wild Rose).
Kansas has been projected to generate more than $450 million in gaming revenues in 2010
(refer to the first section of Exhibit 2-24 captioned Scenario 3A Revenues Coming From).
Approximately $320 would go to Kansas in the mid case, a net loss of $130 million (refer to
the third section of Exhibit 2-24 captioned Scenario 3A Mid Case - Revenues Going To).
Missouri has been forecasted to generate $518 million in gaming revenues in 2010. In the
2010 mid case, $594 million has been projected to stay in Missouri (a net gain of $76
million). This compares with scenario 3 (includes the Wild Rose), wherein Missouri
generated $522 million in gaming revenues and retained approximately $614 million (a net
gain of $92 million).
Exhibit 2-24 Flows of Gaming Revenue Funds for Scenario 3A
Illustrates Where the Gaming Revenues Originated & Where They Went
Scenario 3A Revenues Coming From
State 2007 % 2007 2008 2009 2010 % 2010 2011 2012 % 2012
KS $414,186,842 44.9% $423,652,322 $443,800,724 $450,309,623 46.3% $453,908,437 $457,579,439 46.4%
MO $503,538,602 54.6% $507,231,917 $515,228,137 $517,799,515 53.2% $520,172,606 $522,579,323 53.0%
NE $5,264,895 0.6% $5,243,332 $5,222,491 $5,200,061 0.5% $5,183,145 $5,165,162 0.5%
Total $922,990,339 100.0% $936,127,571 $964,251,352 $973,309,199 100.0% $979,264,188 $985,323,924 100.0%
Scenario 3A Low Case - Revenues Going To
State 2007 % 2007 2008 2009 2010 % 2010 2011 2012 % 2012
IA $3,431,000 0.4% $3,288,000 $3,184,000 $2,724,000 0.3% $2,731,000 $2,739,000 0.3%
KS $88,459,000 9.6% $115,665,000 $169,575,000 $288,238,000 29.6% $290,128,000 $292,063,000 29.6%
MO $778,840,000 84.4% $755,543,000 $726,933,000 $623,778,000 64.1% $627,608,000 $631,492,000 64.1%
OK $52,259,400 5.7% $61,628,400 $64,557,700 $58,569,600 6.0% $58,794,100 $59,024,100 6.0%
Total $922,989,400 100.0% $936,124,400 $964,249,700 $973,309,600 100.0% $979,261,100 $985,318,100 100.0%
Scenario 3A Mid Case - Revenues Going To
State 2007 % 2007 2008 2009 2010 % 2010 2011 2012 % 2012
IA $3,431,000 0.4% $3,288,000 $3,184,000 $2,607,000 0.3% $2,614,000 $2,621,000 0.3%
KS $88,459,000 9.6% $115,665,000 $169,575,000 $320,330,000 32.9% $322,491,000 $324,699,000 33.0%
MO $778,840,000 84.4% $755,543,000 $726,933,000 $594,273,000 61.1% $597,846,000 $601,475,000 61.0%
OK $52,259,400 5.7% $61,628,400 $64,557,700 $56,098,200 5.8% $56,308,700 $56,526,500 5.7%
Total $922,989,400 100.0% $936,124,400 $964,249,700 $973,308,200 100.0% $979,259,700 $985,321,500 100.0%
Scenario 3A High Case - Revenues Going To
State 2007 % 2007 2008 2009 2010 % 2010 2011 2012 % 2012
IA $3,431,000 0.4% $3,288,000 $3,184,000 $2,415,000 0.2% $2,421,000 $2,427,000 0.2%
KS $88,459,000 9.6% $115,665,000 $169,575,000 $370,617,000 38.1% $373,183,000 $375,801,000 38.1%
MO $778,840,000 84.4% $755,543,000 $726,933,000 $548,197,000 56.3% $551,389,000 $554,634,000 56.3%
OK $52,259,400 5.7% $61,628,400 $64,557,700 $52,075,100 5.4% $52,270,700 $52,461,400 5.3%
Total $922,989,400 100.0% $936,124,400 $964,249,700 $973,304,100 100.0% $979,263,700 $985,323,400 100.0%
Data Sources: Wells Gaming Research, April 2008.

Kansas Casino Market Study & Gaming Revenue Projections
May 2008 Wells Gaming Research Page 2-24
Scenario 4
Scenario 4 was developed to evaluate the impact of the Woodlands Race Track on the
gaming revenue forecasts.
Scenario 4 includes the casinos currently in operation (same as in scenario 1), and the mid
case for the Woodlands Race Track. The gaming capacity additions are limited to the
Woodlands Racetrack and include approximately 800 slot machines and a race book. Other
amenities proposed for the Woodlands Race Track include four restaurants.
Revenue Forecasts
The total gaming revenues profiled in Exhibit 2-25 are within $3 million of scenario 1, $954
million for scenario 1 versus $951 million for scenario 4 with the Woodlands Race Track.
The allocation of projected gaming revenues would be approximately $47 million for the
category captioned the Woodlands, $741 million for casinos located within 50 miles, and
$162 million for all other casinos.
Exhibit 2-25 Revenues for Scenario 4
Scenario 4 Includes the Current Casinos + the Woodlands Race Track
Current Low Case Mid Case High Case
2007 2010 2012 2010 2012 2010 2012
*The Woodlands $0 $25,878,000 $26,179,000 $47,329,000 $47,934,000 $66,491,000 $67,384,000
Casinos w/in 50 Miles $759,348,000 $759,991,000 $769,988,000 $741,444,000 $751,167,000 $724,998,000 $734,461,000
All Other Casinos $163,641,400 $164,709,400 $166,271,700 $161,806,700 $163,341,900 $159,091,300 $160,596,300
Total Scenario 4 $922,989,400 $950,578,400 $962,438,700 $950,579,700 $962,442,900 $950,580,300 $962,441,300
Data Sources: Wells Gaming Research, April 2008.
Revenue Impacts
Exhibit 2-26 illustrates the changes in gaming revenue allocations that may be expected
when the Woodlands Race Track is added to the current situation without any other casino
additions or expansions.
Exhibit 2-26 Revenue Impacts for Scenario 4
Scenario 4 Includes the Current Casinos + the Woodlands Race Track
Current Low Case Mid Case High Case
2007 2010 2012 2010 2012 2010 2012
*The Woodlands $0 $25,878,000 $26,179,000 $47,329,000 $47,934,000 $66,491,000 $67,384,000
Casinos w/in 50 Miles $0 -$14,566,000 -$14,715,000 -$33,113,000 -$33,536,000 -$49,559,000 -$50,242,000
All Other Casinos $0 -$1,209,800 -$1,220,800 -$4,112,500 -$4,150,600 -$6,827,900 -$6,896,200
Total Scenario 4 $0 $10,102,200 $10,243,200 $10,103,500 $10,247,400 $10,104,100 $10,245,800
Data Sources: Wells Gaming Research, April 2008.

Kansas Casino Market Study & Gaming Revenue Projections
May 2008 Wells Gaming Research Page 2-25
Revenue Flows
Exhibit 2-27 shows the scenario 4 forecasts with the Woodlands Race Track. The anticipated
shifts in casino revenue flows indicate that $434 million was projected to be generated in
Kansas in the 2010 (refer to the first section of Exhibit 2-27 captioned Scenario 4 Revenues
Coming From). An estimated $135 million would stay in Kansas (refer to the third section
of Exhibit 2-27 captioned Scenario 4 Mid - Revenues Going To). The net loss to Kansas
would be $299 million.
Given the scenario 4 assumptions, Missouri would generate $511 million in 2010. In the
2010 mid case forecasts, $761 million in gaming revenue has been forecasted to stay in
Missouri, for a gain of $250 million.
Exhibit 2-27 Flows of Gaming Revenue Funds for Scenario 4
Illustrates Where the Gaming Revenues Originated & Where They Went
Scenario 4 Revenues Coming From
State 2007 % 2007 2008 2009 2010 % 2007 2011 2012 % 2012
KS $414,186,842 44.9% $417,457,538 $430,761,089 $434,246,063 47.0% $437,798,317 $441,421,637 45.9%
MO $503,538,602 54.6% $506,015,208 $508,591,673 $511,131,612 55.4% $513,476,830 $515,855,222 53.6%
NE $5,264,895 0.6% $5,243,332 $5,222,491 $5,200,061 0.6% $5,183,145 $5,165,162 0.5%
Total $922,990,339 100.0% $928,716,078 $944,575,253 $950,577,736 103.0% $956,458,292 $962,442,021 100.0%
Scenario 4 Low - Revenues Going To
State 2007 % 2007 2008 2009 2010 % 2007 2011 2012 % 2012
IA $3,431,000 0.4% $3,442,000 $3,415,000 $3,426,000 0.4% $3,436,000 $3,446,000 0.4%
KS $88,459,000 9.6% $88,869,000 $114,299,000 $114,886,000 12.4% $115,486,000 $116,105,000 12.1%
MO $778,840,000 84.4% $783,919,000 $774,438,000 $779,612,000 84.5% $784,662,000 $789,791,000 82.1%
OK $52,259,400 5.7% $52,487,900 $52,420,600 $52,654,400 5.7% $52,875,000 $53,096,700 5.5%
Total $922,989,400 100.0% $928,717,900 $944,572,600 $950,578,400 103.0% $956,459,000 $962,438,700 100.0%
Scenario 4 Mid - Revenues Going To
State 2007 % 2007 2008 2009 2010 % 2007 2011 2012 % 2012
IA $3,431,000 0.4% $3,442,000 $3,352,000 $3,362,000 0.4% $3,372,000 $3,382,000 0.4%
KS $88,459,000 9.6% $88,869,000 $133,912,000 $134,645,000 14.6% $135,388,000 $136,152,000 14.1%
MO $778,840,000 84.4% $783,919,000 $755,827,000 $760,863,000 82.4% $765,775,000 $770,766,000 80.1%
OK $52,259,400 5.7% $52,487,900 $51,488,200 $51,709,700 5.6% $51,923,200 $52,142,900 5.4%
Total $922,989,400 100.0% $928,717,900 $944,579,200 $950,579,700 103.0% $956,458,200 $962,442,900 100.0%
Scenario 4 - High Revenues Going To
State 2007 % 2007 2008 2009 2010 % 2007 2011 2012 % 2012
IA $3,431,000 0.4% $3,442,000 $3,293,000 $3,303,000 0.4% $3,312,000 $3,322,000 0.3%
KS $88,459,000 9.6% $88,869,000 $151,355,000 $152,225,000 16.5% $153,104,000 $154,007,000 16.0%
MO $778,840,000 84.4% $783,919,000 $739,320,000 $744,224,000 80.6% $749,005,000 $753,864,000 78.3%
OK $52,259,400 5.7% $52,487,900 $50,603,600 $50,828,300 5.5% $51,037,800 $51,248,300 5.3%
Total $922,989,400 100.0% $928,717,900 $944,571,600 $950,580,300 103.0% $956,458,800 $962,441,300 100.0%
Data Sources: Wells Gaming Research, April 2008.
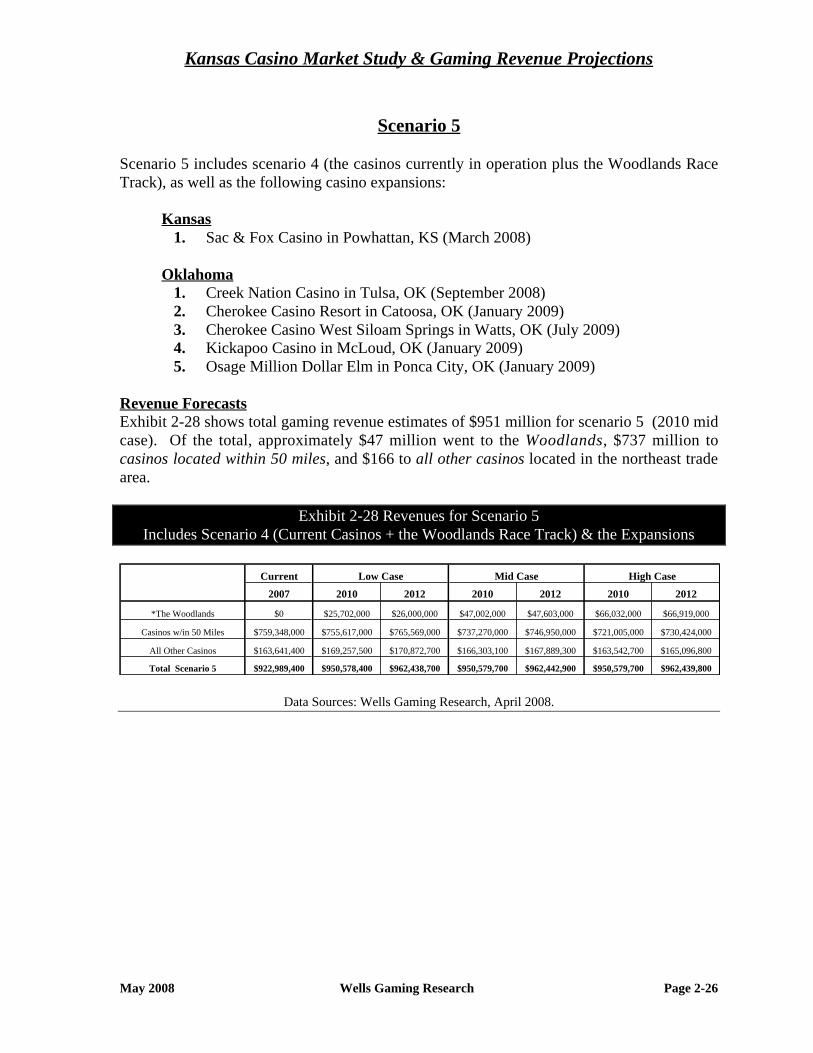
Kansas Casino Market Study & Gaming Revenue Projections
May 2008 Wells Gaming Research Page 2-26
Scenario 5
Scenario 5 includes scenario 4 (the casinos currently in operation plus the Woodlands Race
Track), as well as the following casino expansions:
Kansas
1. Sac & Fox Casino in Powhattan, KS (March 2008)
Oklahoma
1. Creek Nation Casino in Tulsa, OK (September 2008)
2. Cherokee Casino Resort in Catoosa, OK (January 2009)
3. Cherokee Casino West Siloam Springs in Watts, OK (July 2009)
4. Kickapoo Casino in McLoud, OK (January 2009)
5. Osage Million Dollar Elm in Ponca City, OK (January 2009)
Revenue Forecasts
Exhibit 2-28 shows total gaming revenue estimates of $951 million for scenario 5 (2010 mid
case). Of the total, approximately $47 million went to the Woodlands, $737 million to
casinos located within 50 miles, and $166 to all other casinos located in the northeast trade
area.
Exhibit 2-28 Revenues for Scenario 5
Includes Scenario 4 (Current Casinos + the Woodlands Race Track) & the Expansions
Current Low Case Mid Case High Case
2007 2010 2012 2010 2012 2010 2012
*The Woodlands $0 $25,702,000 $26,000,000 $47,002,000 $47,603,000 $66,032,000 $66,919,000
Casinos w/in 50 Miles $759,348,000 $755,617,000 $765,569,000 $737,270,000 $746,950,000 $721,005,000 $730,424,000
All Other Casinos $163,641,400 $169,257,500 $170,872,700 $166,303,100 $167,889,300 $163,542,700 $165,096,800
Total Scenario 5 $922,989,400 $950,578,400 $962,438,700 $950,579,700 $962,442,900 $950,579,700 $962,439,800
Data Sources: Wells Gaming Research, April 2008.

Kansas Casino Market Study & Gaming Revenue Projections
May 2008 Wells Gaming Research Page 2-27
Revenue Impacts
The total revenue impacts show a negligible decrease of $4,600 in overall gaming revenues
for the 2010 mid case of the scenario 5 (refer to Exhibit 2-29). The category referred to as all
other casinos is the only one showing a gain ($4.5 million). Negative impacts have been
projected for the Woodlands ($327 thousand) and for casinos located within 50 miles ($4.2
million).
Exhibit 2-29 Revenue Impacts for Scenario 5
Includes Scenario 4 (Current Casinos + the Woodlands Race Track) & the Expansions
Current Low Case Mid Case High Case
2007 2010 2012 2010 2012 2010 2012
*The Woodlands $0 -$176,000 -$179,000 -$327,000 -$331,000 -$459,000 -$465,000
Casinos w/in 50 Miles $0 -$4,374,000 -$4,419,000 -$4,174,000 -$4,217,000 -$3,993,000 -$4,037,000
All Other Casinos $0 $4,548,100 $4,601,000 $4,496,400 $4,547,400 $4,451,400 $4,500,500
Total Scenario 5 $0 -$1,900 $3,000 -$4,600 -$600 -$600 -$1,500
Data Sources: Wells Gaming Research, April 2008.

Kansas Casino Market Study & Gaming Revenue Projections
May 2008 Wells Gaming Research Page 2-28
Revenue Flows
Exhibit 2-30 shows 2010 gaming revenues of $951 million (refer to the first section of
Exhibit 2-30 captioned Scenario 5 Revenues Coming From). These revenues have been
estimated to have been generated in Kansas ($434 million), Missouri ($511 million), and
Nebraska ($5 million).
The 2010 mid case allocations of the $951 million show Iowa ($3.3 million), Kansas ($136
million), Missouri ($756 million), and Oklahoma ($55 million). Refer to the third section of
Exhibit 2-30 captioned Scenario 5 Mid - Revenues Going To. The difference for Kansas
between the $434 million projected to be generated in 2010 and the $136 million expected to
be retained in Kansas (2010 mid case) is an outflow of $298 million. Missouri, on the other
hand, has been estimated to produce $511 million in 2010 and enjoy inflows of $756 million
for a positive difference of $245 million in the 2010 mid case. Inflows to Oklahoma from the
Tribal casino additions have been estimated at $55 million in the 2010 mid case.
Exhibit 2-30 Flow of Gaming Revenue Funds for Scenario 5
Illustrates Where the Gaming Revenues Originated & Were They Went
Scenario 5 Revenues Coming From
State 2007 % 2007 2008 2009 2010 % 2007 2011 2012 % 2012
KS $414,186,842 44.9% $417,457,538 $430,761,089 $434,246,063 47.0% $437,798,317 $441,421,637 45.9%
MO $503,538,602 54.6% $506,015,208 $508,591,673 $511,131,612 55.4% $513,476,830 $515,855,222 53.6%
NE $5,264,895 0.6% $5,243,332 $5,222,491 $5,200,061 0.6% $5,183,145 $5,165,162 0.5%
Total $922,990,339 100.0% $928,716,078 $944,575,253 $950,577,736 103.0% $956,458,292 $962,442,021 100.0%
Scenario 5 Low - Revenues Going To
State 2007 % 2007 2008 2009 2010 % 2007 2011 2012 % 2012
IA $3,431,000 0.4% $3,395,000 $3,343,000 $3,354,000 0.4% $3,363,000 $3,374,000 0.4%
KS $88,459,000 9.6% $91,076,000 $115,775,000 $116,369,000 12.6% $116,976,000 $117,602,000 12.2%
MO $778,840,000 84.4% $781,122,000 $769,827,000 $774,973,000 84.0% $779,999,000 $785,105,000 81.6%
OK $52,259,400 5.7% $53,121,900 $55,632,000 $55,880,500 6.1% $56,116,200 $56,360,700 5.9%
Total $922,989,400 100.0% $928,714,900 $944,577,000 $950,576,500 103.0% $956,454,200 $962,441,700 100.0%
Scenario 5 Mid - Revenues Going To
State 2007 % 2007 2008 2009 2010 % 2007 2011 2012 % 2012
IA $3,431,000 0.4% $3,395,000 $3,282,000 $3,292,000 0.4% $3,302,000 $3,312,000 0.3%
KS $88,459,000 9.6% $91,076,000 $135,230,000 $135,970,000 14.7% $136,718,000 $137,489,000 14.3%
MO $778,840,000 84.4% $781,122,000 $751,421,000 $756,430,000 82.0% $761,321,000 $766,288,000 79.6%
OK $52,259,400 5.7% $53,121,900 $54,639,500 $54,883,100 5.9% $55,117,600 $55,353,300 5.8%
Total $922,989,400 100.0% $928,714,900 $944,572,500 $950,575,100 103.0% $956,458,600 $962,442,300 100.0%
Scenario 5 High - Revenues Going To
State 2007 % 2007 2008 2009 2010 % 2007 2011 2012 % 2012
IA $3,431,000 0.4% $3,395,000 $3,225,000 $3,235,000 0.4% $3,244,000 $3,254,000 0.3%
KS $88,459,000 9.6% $91,076,000 $152,537,000 $153,411,000 16.6% $154,296,000 $155,204,000 16.1%
MO $778,840,000 84.4% $781,122,000 $735,096,000 $739,978,000 80.2% $744,738,000 $749,573,000 77.9%
OK $52,259,400 5.7% $53,121,900 $53,715,000 $53,955,700 5.8% $54,180,200 $54,408,800 5.7%
Total $922,989,400 100.0% $928,714,900 $944,573,000 $950,579,700 103.0% $956,458,200 $962,439,800 100.0%
Data Sources: Wells Gaming Research, April 2008.

Kansas Casino Market Study & Gaming Revenue Projections
May 2008 Wells Gaming Research Page 2-29
Scenario 6
Results for scenario 6 are equal to scenario 5 plus the following other proposed casinos:
Kansas
1. Camptown Greyhound Park in Frontenac, KS (January 2009)
2. Cherokee County planned in Baxter Springs, KS (January 2010)
3. Wyandotte 7th Street Casino in Kansas City, KS (January 2008)
4. Wyandotte County planned in Kansas City, KS (January 2010)
5. Sumner County planned in Wellington, KS (January 2010)
Missouri
1. Barden Development, Inc. planned in Branson, MO
2. Wild Rose Entertainment planned in Sugar Creek, MO (January 2010)
Oklahoma
1. Downstream Casino Resort in Ottawa, OK (July 2008)
2. First Council Casino in Newkirk, OK (March 2008)
3. Iowa Casino Resort in Lincoln, OK
4. Muscogee Creek Nation planned in Eufaula, OK
5. Pawnee Nation planned in Chilocco, OK
6. Ponca Tribe Oklahoma planned in Ponca City, OK
7. Poteau Travel and Smoke Shop in Poteau, OK
8. Seneca-Cayuga Tribes of Oklahoma planned in Grove, OK (July 2008)
9. Shawnee Tribe Oklahoma planned in Oklahoma City, OK
10. Wichita & Affiliated Tribes planned in Hinton, OK
11. Wilburton Travel and Smoke Shop in Wilburton, OK
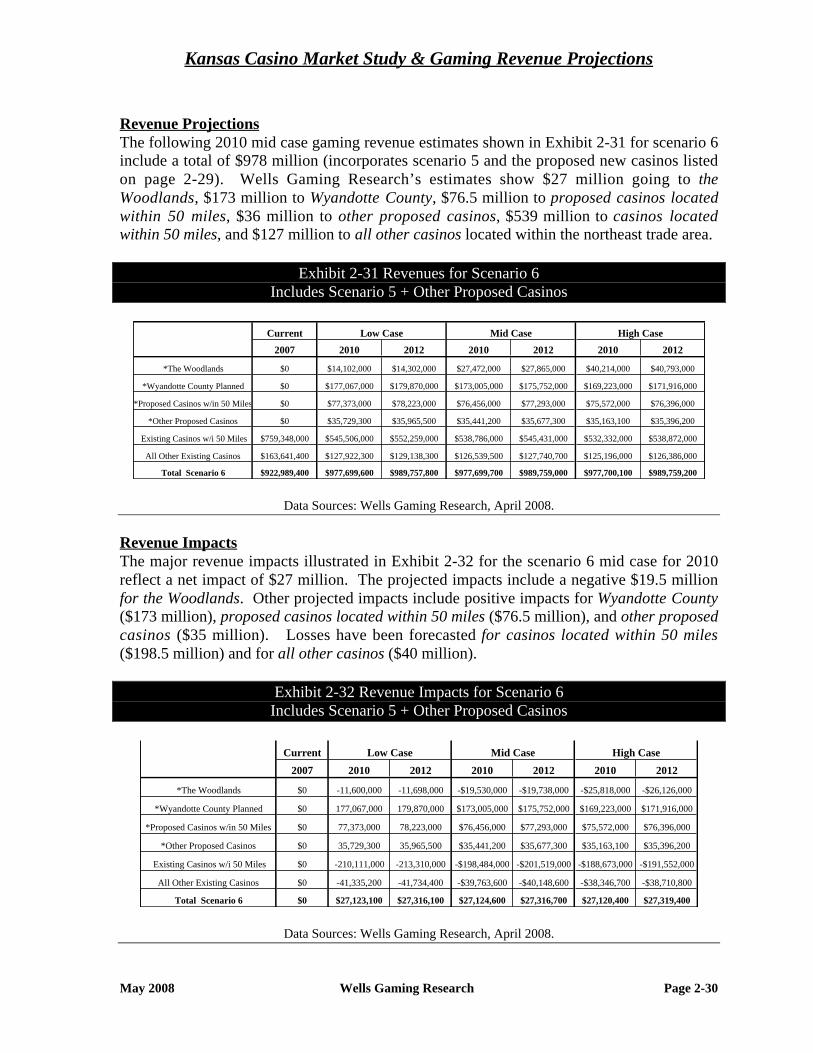
Kansas Casino Market Study & Gaming Revenue Projections
May 2008 Wells Gaming Research Page 2-30
Revenue Projections
The following 2010 mid case gaming revenue estimates shown in Exhibit 2-31 for scenario 6
include a total of $978 million (incorporates scenario 5 and the proposed new casinos listed
on page 2-29). Wells Gaming Research’s estimates show $27 million going to the
Woodlands, $173 million to Wyandotte County, $76.5 million to proposed casinos located
within 50 miles, $36 million to other proposed casinos, $539 million to casinos located
within 50 miles, and $127 million to all other casinos located within the northeast trade area.
Exhibit 2-31 Revenues for Scenario 6
Includes Scenario 5 + Other Proposed Casinos
Current Low Case Mid Case High Case
2007 2010 2012 2010 2012 2010 2012
*The Woodlands $0 $14,102,000 $14,302,000 $27,472,000 $27,865,000 $40,214,000 $40,793,000
*Wyandotte County Planned $0 $177,067,000 $179,870,000 $173,005,000 $175,752,000 $169,223,000 $171,916,000
*Proposed Casinos w/in 50 Miles $0 $77,373,000 $78,223,000 $76,456,000 $77,293,000 $75,572,000 $76,396,000
*Other Proposed Casinos $0 $35,729,300 $35,965,500 $35,441,200 $35,677,300 $35,163,100 $35,396,200
Existing Casinos w/i 50 Miles $759,348,000 $545,506,000 $552,259,000 $538,786,000 $545,431,000 $532,332,000 $538,872,000
All Other Existing Casinos $163,641,400 $127,922,300 $129,138,300 $126,539,500 $127,740,700 $125,196,000 $126,386,000
Total Scenario 6 $922,989,400 $977,699,600 $989,757,800 $977,699,700 $989,759,000 $977,700,100 $989,759,200
Data Sources: Wells Gaming Research, April 2008.
Revenue Impacts
The major revenue impacts illustrated in Exhibit 2-32 for the scenario 6 mid case for 2010
reflect a net impact of $27 million. The projected impacts include a negative $19.5 million
for the Woodlands. Other projected impacts include positive impacts for Wyandotte County
($173 million), proposed casinos located within 50 miles ($76.5 million), and other proposed
casinos ($35 million). Losses have been forecasted for casinos located within 50 miles
($198.5 million) and for all other casinos ($40 million).
Exhibit 2-32 Revenue Impacts for Scenario 6
Includes Scenario 5 + Other Proposed Casinos
Current Low Case Mid Case High Case
2007 2010 2012 2010 2012 2010 2012
*The Woodlands $0 -11,600,000 -11,698,000 -$19,530,000 -$19,738,000 -$25,818,000 -$26,126,000
*Wyandotte County Planned $0 177,067,000 179,870,000 $173,005,000 $175,752,000 $169,223,000 $171,916,000
*Proposed Casinos w/in 50 Miles $0 77,373,000 78,223,000 $76,456,000 $77,293,000 $75,572,000 $76,396,000
*Other Proposed Casinos $0 35,729,300 35,965,500 $35,441,200 $35,677,300 $35,163,100 $35,396,200
Existing Casinos w/i 50 Miles $0 -210,111,000 -213,310,000 -$198,484,000 -$201,519,000 -$188,673,000 -$191,552,000
All Other Existing Casinos $0 -41,335,200 -41,734,400 -$39,763,600 -$40,148,600 -$38,346,700 -$38,710,800
Total Scenario 6 $0 $27,123,100 $27,316,100 $27,124,600 $27,316,700 $27,120,400 $27,319,400
Data Sources: Wells Gaming Research, April 2008.

Kansas Casino Market Study & Gaming Revenue Projections
May 2008 Wells Gaming Research Page 2-31
Flow of Revenues
Exhibit 2-33 shows that the $978 million in total gaming revenues would come from Kansas
($450 million), Missouri ($522 million), and Nebraska ($5.2 million) in scenario 6 the 2010
(refer to the first section of Exhibit 2-33 captioned Scenario 6 Revenues Coming From). The
$978 million in gaming revenues forecasted to be generated in the 2010 scenario 6 mid case
has been allocated to Iowa ($2.5 million), Kansas ($308 million), Missouri ($614 million),
and Oklahoma ($54 million) in the 2010 mid case. The net result for Kansas would be a loss
of $142 million. The net loss for Kansas would be approximately $143 million (refer to the
third section of Exhibit 2-33 captioned Scenario 6 Mid - Revenues Going To).
Exhibit 2-33 Flows of Gaming Revenue Funds for Scenario 6
Illustrates Where the Gaming Revenues Originated & Where They Went
Scenario 6 Revenues Coming From
State 2007 % 2007 2008 2009 2010 % 2010 2011 2012 % 2012
KS $414,186,842 44.9% $423,652,322 $443,800,724 $450,309,623 46.1% $453,908,437 $457,579,439 46.2%
MO $503,538,602 54.6% $507,231,917 $515,228,137 $522,188,007 53.4% $524,584,410 $527,014,529 53.2%
NE $5,264,895 0.6% $5,243,332 $5,222,491 $5,200,061 0.5% $5,183,145 $5,165,162 0.5%
Total $922,990,339 100.0% $936,127,571 $964,251,352 $977,697,691 100.0% $983,675,992 $989,759,130 100.0%
Scenario 6 Low - Revenues Going To
State 2007 % 2007 2008 2009 2010 % 2010 2011 2012 % 2012
IA $3,431,000 0.4% $3,288,000 $3,241,000 $2,516,000 0.3% $2,522,000 $2,529,000 0.3%
KS $88,459,000 9.6% $115,665,000 $151,483,000 $299,591,000 30.6% $301,599,000 $303,651,000 30.7%
MO $778,840,000 84.4% $755,543,000 $743,857,000 $621,030,000 63.5% $624,787,000 $628,603,000 63.5%
OK $52,259,400 5.7% $61,628,400 $65,672,900 $54,562,600 5.6% $54,764,200 $54,974,800 5.6%
Total $922,989,400 100.0% $936,124,400 $964,253,900 $977,699,600 100.0% $983,672,200 $989,757,800 100.0%
Scenario 6 Mid - Revenues Going To
State 2007 % 2007 2008 2009 2010 % 2010 2011 2012 % 2012
IA $3,431,000 0.4% $3,288,000 $3,184,000 $2,487,000 0.3% $2,493,000 $2,500,000 0.3%
KS $88,459,000 9.6% $115,665,000 $169,575,000 $307,684,000 31.5% $309,754,000 $311,871,000 31.5%
MO $778,840,000 84.4% $755,543,000 $726,933,000 $613,558,000 62.8% $617,256,000 $621,013,000 62.7%
OK $52,259,400 5.7% $61,628,400 $64,557,700 $53,970,700 5.5% $54,171,400 $54,375,000 5.5%
Total $922,989,400 100.0% $936,124,400 $964,249,700 $977,699,700 100.0% $983,674,400 $989,759,000 100.0%
Scenario 6 High - Revenues Going To
State 2007 % 2007 2008 2009 2010 % 2010 2011 2012 % 2012
IA $3,431,000 0.4% $3,288,000 $3,131,000 $2,458,000 0.3% $2,465,000 $2,471,000 0.2%
KS $88,459,000 9.6% $115,665,000 $185,730,000 $315,469,000 32.3% $317,600,000 $319,775,000 32.3%
MO $778,840,000 84.4% $755,543,000 $711,872,000 $606,377,000 62.0% $610,019,000 $613,716,000 62.0%
OK $52,259,400 5.7% $61,628,400 $63,514,300 $53,396,100 5.5% $53,592,700 $53,797,200 5.4%
Total $922,989,400 100.0% $936,124,400 $964,247,300 $977,700,100 100.0% $983,676,700 $989,759,200 100.0%
Data Sources: Wells Gaming Research, April 2008.

Kansas Casino Market Study & Gaming Revenue Projections
May 2008 Wells Gaming Research Page 2-32
Gaming Capacity with Casino Growth
A casino capacity recap showing the impact of the proposed casino expansions and the
additions of new casinos is listed in Exhibit 2-34. The bottom line illustrates that slot
machines would increase by 58%, pit table games by 54%, poker tables by 21%, total tables
by 49%, race book by 200%, and casino square footage by 18%. Other amenities including
convention/meeting space would go up by 124%, the number of hotel rooms by 89%, the
number of restaurants by 40%, entertainment venues by 53%, and parking capacity by 83%.
Exhibit 2-34 Capacity Listing w/ Casino Growth (Includes the 6 Scenarios)
# of
Loc Casinos# of
Slots
# of
Pit
Tables
# of
Poker
Tables
# of
Total
Tables
# of
Bingo
Seats
Race
Book
Casino
S.F.
Con-
vention
S.F.
# of
Rooms
# of
Restau-
rants
Enter-
tain-
ment
Park-
ing
Capacities for the Existing 18 Casinos 16,914 367 73 440 868 1 717,691 106,520 1,331 52 17 19,150
Scenario 1 - Wyandotte County Proposed
1 Wyandotte County Proposed 3,000 100 0 100 0 0 0 100,000 500 6 5 7,000
Subtotal of Scenario 1 3,000 100 0 100 0 0 0 100,000 500 6 5 7,000
Scenario 2 - Expansions
1 Sac & Fox Casino 500 0 0 0 0 0 0 0 0 0 0 0
Subtotal of Scenario 2 500 0 0 0 0 0 0 0 0 0 0 0
Scenario 3 - Other Proposed
1 Camptown Greyhound Park 600 0 0 0 0 1 0 0 0 2 0 700
2 Cherokee County Planned 1,200 40 0 0 0 0 0 10,000 250 3 2 2,500
3 Downstream Casino Resort 2,000 30 15 45 0 0 70,000 10,000 240 2 0 2,700
4 The Woodlands 800 0 0 0 0 1 0 0 0 4 0 700
5 Wild Rose Entertainment - Sugar Creek 1,200 30 0 30 0 0 40,000 12,000 200 3 2 2,200
6 Wyandotte 7th Street Casino 450 0 0 0 0 0 20,000 0 0 1 0 100
Subtotal of Scenario 3 6,250 100 15 75 0 2 130,000 32,000 690 15 4 8,900
Total Expansions & New Casinos 9,750 200 15 175 0 2 130,000 132,000 1,190 21 9 15,900
Total Existing, Expansions & New 26,664 567 88 615 868 3 847,691 238,520 2,521 73 26 35,050
Scenario 4 - The Woodlands
1 The Woodlands 800 0 0 0 0 1 0 0 0 4 0 700
Subtotal of Scenario 4 800 0 0 0 0 1 0 0 0 4 0 700
Scenario 5 - Expansions
1 Sac & Fox Casino 500 0 0 0 0 0 0 0 0 0 0 0
Subtotal of Scenario 5 500 0 0 0 0 0 0 0 0 0 0 0
Scenario 6 - Other Proposed
1 Camptown Greyhound Park 600 0 0 0 0 1 0 0 0 2 0 700
2 Cherokee County Planned 1,200 40 0 0 0 0 0 10,000 250 3 2 2,500
3 Downstream Casino Resort 2,000 30 15 45 0 0 70,000 10,000 240 2 0 2,700
4 Wild Rose Entertainment - Sugar Creek 1,200 30 0 30 0 0 40,000 12,000 200 3 2 2,200
5 Wyandotte 7th Street Casino 450 0 0 0 0 0 20,000 0 0 1 0 100
6 Wyandotte County Proposed 3,000 100 0 100 0 0 0 100,000 500 6 5 7,000
Subtotal of Scenario 6 8,450 200 15 215 0 1 130,000 132,000 1,190 17 9 15,200
Total Expansions & New Casinos 9,750 200 15 215 0 2 130,000 132,000 1,190 21 9 15,900
16 Total Existing, Expansions & New 26,664 567 88 655 868 3 847,691 238,520 2,521 73 26 35,050
Percent Change Over Current 58% 54% 21% 49% 0% 200% 18% 124% 89% 40% 53% 83%
Data Sources: Wells Gaming Research, April 2008.

Kansas Casino Market Study & Gaming Revenue Projections
Wells Gaming Research
May 2008
Section 3

Kansas Casino Market Study & Gaming Revenue Projections
May 2008 Wells Gaming Research Page 3-1
Summary for the Trade Area
For the Southeast Gaming Zone
Highlights of the gaming market for the southeast trade area follow (refer to pages 3-8
through 3-32 for the corresponding detailed analyses and discussions).
Trade Area
The southeast trade area includes the approximate 100-mile radius of the intersection of
Kansas, Missouri, and Oklahoma. Included are 65 counties located in southeast Kansas,
southwest Missouri, northeast Oklahoma, and northwest Arkansas. The boundaries extend
from Miami County, Kansas on the north; to Sequoyah County, Oklahoma on the south; to
Osage County, Oklahoma on the west; and to Douglas County, Missouri on the east (refer to
the map on page 3-3).
Demographic Statistics
The population and median household income statistics that are included in this report are
limited to those counties within the gaming zone’s specific trade area, and not for the entire
state.
Exhibit 3-1 shows that the southeast trade area includes 65 counties (18 in Kansas, 24 in
Missouri, 15 in Oklahoma, and eight in Arkansas). In 2007, these counties had a total adult
population of 2.1 million. Median household incomes (MHI) for 2007 ranged from a low of
$42.5 thousand in Oklahoma to a high of $47.1 thousand in Arkansas. Kansas came in at
$43.1 thousand.
Exhibit 3-1 Adult Population & Median Household Income (MHI)
2007 2007 2012 ACGR
State
# of
Counties
Adult
Population MHI 2012 MHI
Adult
Population
07 to 12
MHI
07 to 12
KS 18 190,263 $43,094 189,538 $51,650 -0.1% 3.7%
MO 24 704,244 $42,508 746,615 $49,083 1.2% 2.9%
OK 15 797,857 $47,008 829,285 $54,558 0.8% 3.0%
AR 8 380,290 $47,140 432,831 $57,492 2.6% 4.1%
Totals 65 2,072,654 NA 2,198,269 NA 1.2% NA
Data Sources: Bureau of Business & Economic Research, UNR & Wells Gaming Research, May 2008.
The adult population forecast shows an increase from 2.1 million in 2007 to 2.2 million in
2012, an increase of approximately 124 thousand. The resulting average compound growth
rate is 1.2%.

Kansas Casino Market Study & Gaming Revenue Projections
May 2008 Wells Gaming Research Page 3-2
The average median household income levels for 2012 are forecasted to range from a low of
$49.1 thousand in Missouri to a high of $57.5 thousand in Arkansas. The corresponding
average compound growth rates range from a low of 2.9% in Missouri to a high of 4.1% in
Arkansas for the 2007 to 2012 period. The average median household income for Kansas
was forecasted to average $51.7 thousand, reflecting a 3.7% average compound growth rate.

Copyright © and (P) 1988–2006 Microsoft Corporation and/or its suppliers. All rights reserved. http://www.microsoft.com/mappoint/Portions © 1990–2005 InstallShield Software Corporation. All rights reserved. Certain mapping and direction data © 2005 NAVTEQ. All rights reserved. The Data for areas of Canada includes information taken with permission from Canadian authorities, including: © Her Majesty the Queen in Right of Canada, © Queen's Printer for Ontario. NAVTEQ and NAVTEQ ON BOARD are trademarks of NAVTEQ. © 2005 Tele Atlas North America, Inc. All rights reserved. Tele Atlas and Tele Atlas North America are trademarks of Tele Atlas, Inc.
Southeast Kansas Zone
0 mi 50 100 150

Kansas Casino Market Study & Gaming Revenue Projections
May 2008 Wells Gaming Research Page 3-4
Primary Market
Exhibit 3-2 shows that the southeast trade area is made up of 65 counties. The combined
adult population was 2.1 million in 2007. Projections for 2012 show an increase to 2.2
million, with an average compound growth rate of 1.2%.
The primary segment of the southeast trade area is comprised of 11 counties that are
contiguous with the intersection of the states of Kansas, Missouri, and Oklahoma. The adult
population in the primary market was approximately 255 thousand in 2007 (12% of the total
adult population of 2.1 million). By 2012, the adult population for the primary market should
reach approximately 262 thousand and continue to represent 12% of the total adult
population of 2.2 million. As a group, the 11 counties in the primary market are projected to
have an average compound growth rate of 0.5% between 2007 and 2012.
Exhibit 3-2 Adult Population for Primary Market
# of Counties List of Counties 2007 2012
ACGR 07 to 12
% Pop/ Co 2012
Bourbon KS 10,509 10,472 -0.1% 4%
Cherokee KS 14,770 14,553 -0.3% 6%
Crawford KS 26,803 27,117 0.2% 10%
Labette KS 15,482 15,396 -0.1% 6%
Neosho KS 10,971 10,560 -0.8% 4%
Barton MO 8,972 9,285 0.7% 4%
Jasper MO 78,643 82,187 0.9% 31%
Newton MO 39,270 41,064 0.9% 16%
Vernon MO 14,058 14,260 0.3% 5%
Craig OK 11,622 12,213 1.0% 5%
Ottawa OK 23,768 24,399 0.5% 9%
11 Total Contiguous Counties 254,869 261,506 0.5% 100%
13
Total Kansas Counties - Excluding Contiguous
Counties 111,728 111,440 -0.1%
20
Total Missouri Counties - Excluding Contiguous
Counties 563,300 599,818 1.3%
13
Total Oklahoma Counties - Excluding Contiguous
Counties 762,467 792,673 0.8%
8 Total Arkansas Counties 380,290 432,831 2.6%
65 Total Trade Area Population 2,072,654 2,198,269 1.2%
Data Sources: Bureau of Business & Economic Research, UNR & Wells Gaming Research, May 2008.

Kansas Casino Market Study & Gaming Revenue Projections
May 2008 Wells Gaming Research Page 3-5
Capacity Statistics & Gaming Competition
Following in Exhibit 3-3 is a profile of the casino capacity located within a 150-mile radius
of the southeast casino site. The existing capacity includes 53 gaming locations equipped
with 30,846 slot machines, 591 table games (pit and poker) and 1.4 million square feet of
casino space. Other amenities include 75 thousand square feet of convention space, 1,619
hotel rooms, 87 restaurants, 21 entertainment venues, and 35,573 parking spaces.
Exhibit 3-3 Capacity Statistics for 150-Mile Radius from Southeast Zone Casino
Existing Expansions New (Proposed) Casinos Total % Change
Capacity Casinos OK KA OK MO Capacity Above Existing
# of Loc 53 4 5 9 2 69 1
30%
# of Slots 30,846 2,774 7,600 7,740 2,500 51,460 67%
# of Tables 591 44 190 169 71 1,065 80%
Casino S.F. 1,401,874 10,000 0 260,000 97,000 1,768,874 26%
Convention S.F. 74,620 20,000 140,000 30,000 12,000 276,620 271%
# of Rooms 1,619 140 1,025 865 200 3,849 138%
# of Restaurants 87 2 19 16 5 129 48%
Entertainment 21 1 10 5 2 39 86%
Parking 35,573 0 14,600 11,074 3,400 64,647 82%
Footnote 1. The four expansions in Oklahoma have not been added into the total number of locations.
Data Sources: Bureau of Business & Economic Research, UNR & Wells Gaming Research, May 2008.
The statistics show that the impact of casino growth within a 150-mile radius will result in a
significant escalation in player capacity. Some key capacity changes include the number of
gaming locations, up from 53 to 69 (30%). The slot inventory will surge from approximately
31 thousand to 51.5 thousand (67%). The number of table games will increase from 591 to
1,065 (80%). The supply of hotel rooms will go from 1,619 to 3,849 (138%), and the
number of restaurants will increase from 87 to 129 (48%).

Kansas Casino Market Study & Gaming Revenue Projections
May 2008 Wells Gaming Research Page 3-6
Gaming Revenues
Exhibit 3-4 shows a summary of the revenue flows that correspond to the current status, as
well as with three of WGR’s scenarios developed to analyze the potential impacts of the
proposed new casinos and expansions on gaming revenues in the southeast trade area. Shown
are the states indicating where the gaming revenues come from and where they go. The
current status reflects a net loss of $60 million in gaming revenues that flowed out of Kansas
into neighboring states in 2007.
Scenarios 1 through 3 illustrate the gaming revenues that have been forecasted for 2012 based
on the assumptions set forth in each scenario. The key assumption of scenario 1 is the addition
of the Cherokee County Casino. The gaming revenue shows that the Cherokee County Casino
has been projected to stem the flow of gaming revenues from Kansas and replace the $60
million loss experienced in 2007 with an $8 million gain.
Exhibit 3-4 Summary of the 2012 Flow of Gaming Revenues(Dollars in Millions)
Current Status 2007 Scenario-1 2012 Scenario-2 2012 Scenario-3 2012
StateComing From
Going To Dif
Coming From
Going To Dif
Coming From
Going To Dif
Coming From
Going To Dif
AR $172 $0 -$172 $196 $0 -$196 $196 $0 -$196 $207 $0 -$207
IA $0 $1 $1 $0 $1 $1 $0 $1 $1 $0 $1 $1
KA $72 $12 -$60 $73 $81 $8 $73 $77 $4 $80 $112 $31
MO $219 $96 -$122 $238 $96 -$141 $238 $92 -$146 $324 $142 -$182
OK $418 $771 $352 $435 $762 $328 $435 $771 $337 $435 $792 $357
Total $880 $880 $0 $941 $941 $0 $941 $941 $0 $1,046 $1,046 $0
Data Source: Wells Gaming Research, May 2008.
Scenario 2 includes the existing casinos, plus the new Cherokee County Casino discussed in
scenario 1 (refer to Exhibit 3-4). In addition, scenario 2 includes six casino expansions: one
at the Sac & Fox Casino in Powhattan, Kansas, tentatively scheduled to open in March of
2008; and five expansions that are targeted to open at Oklahoma Tribal casinos between 2008
and 2009. Included are the Creek Nation Casino in Tulsa, Cherokee Casino Resort in
Catoosa, Kickapoo Casino in McLoud, Osage Million Dollar Elm in Ponca City, and the
Cherokee Casino West Siloam Springs in Watts. Combined, these casino expansions have
been forecasted to reduce the difference between the gaming revenues coming from Kansas
versus those going to Kansas by $4 million (down from $8 million in Scenario 1 to $4 in
Scenario 2).
Scenario 3 includes the casino additions and expansions included in both scenarios 1 and 2,
plus 18 new proposed casinos, including the Wyandotte County casino in Kansas City,
Kansas and the Sumner County casino south of Wichita. The 18 other proposed casinos have
been assumed to be in operation between 2008 and 2010. The gaming revenue estimates
developed in scenario 3, based on 2012 mid cases, show that the addition of the Sumner and

Kansas Casino Market Study & Gaming Revenue Projections
May 2008 Wells Gaming Research Page 3-7
Wyandotte County casinos plus the other proposed casinos could increase the net flow of
gaming revenues into Kansas by approximately $31 million (an estimated $80 million would
come from Kansas while $112 million should stay in Kansas).
Oklahoma is projected to gain revenues in scenario 3 due to the large number of new casinos
under construction or planned. Even though Oklahoma’s net gains of $328 million and $337
million in scenarios 1 and 2, respectively, would lag behind the 2007 level of $352 million,
the net would increase to $357 million in scenario 3 for a $5 million gain over 2007.
However, gaming revenues remaining in Oklahoma would increase by $21 million from
$771 in scenario 2 to $792 million in scenario 3.

Kansas Casino Market Study & Gaming Revenue Projections
May 2008 Wells Gaming Research Page 3-8
Detailed Analyses for the Trade Area
For the Southeast Gaming Zone
Population statistics were one of the key variables used in the gross gaming revenue
projections developed by WGR’s gravity model. The population projections summarized in
Exhibit 3-5 show both the total and the adult statistics for the southeast gaming zone.
Exhibit 3-5 Total & Adult Population Statistics
2000 Total & Adult 2007 Total & Adult 2012 Total & Adult
ST
# of
CO Total Adult
Adult as
a % of
Total
Adult %
of Adult
Total Total Adult
Adult as
a % of
Total
Adult %
of Adult
Total Total Adult
Adult as
a % of
Total
Adult %
of Adult
Total
KS 18 275,788 192,501 69.8% 10.1% 272,691 190,263 69.8% 9.2% 271,725 189,538 69.8% 8.6%
MO 24 909,201 639,536 70.3% 33.6% 1,001,878 704,244 70.3% 34.0% 1,062,383 746,615 70.3% 34.0%
OK 15 1,091,005 755,367 69.2% 39.7% 1,152,626 797,857 69.2% 38.5% 1,198,196 829,285 69.2% 37.7%
AR 8 455,687 315,597 69.3% 16.6% 549,285 380,290 69.2% 18.3% 625,250 432,831 69.2% 19.7%
TOT 65 2,731,681 1,903,001 69.7% 100.0% 2,976,480 2,072,654 69.6% 100.0% 3,157,554 2,198,269 69.6% 100.0%
Data Sources: Bureau of Business & Economics, University of Nevada, Reno & Wells Gaming Research, May 2008
In 2007, the total population for the southeast trade area was approximately 3.0 million. Of
this amount, 2.1 million (69.6%) were adults. State-by-state the adult statistics show 190
thousand for Kansas (9.2% of the adult total), 704 thousand (34.0%) for Missouri, 798
thousand for Oklahoma (38.5%), and 380 thousand for Arkansas (18.3%).
By 2012, the total adult population for the southeast trade area has been forecasted to
increase to 2.2 million, approximately 300 thousand above the 2007 level. The statistics
show a slight decline in adult population for Kansas, down from 190.3 thousand in 2007 to
189.5 thousand in 2012. Adult population increases between 2007 and 2012 for the other
states located within the trade area include Missouri, up from 704 thousand to 736 thousand;
Oklahoma, up from 798 thousand to 829 thousand; and Arkansas, up from 380 thousand to
433 thousand.
Due to the age restrictions on casino gaming, only the adult population statistics were used in
developing the gross gaming revenue projections in WGR’s gravity model.

Kansas Casino Market Study & Gaming Revenue Projections
May 2008 Wells Gaming Research Page 3-9
Total Population for Surrounding Counties
Exhibit 3-6 shows that, as a group, the counties surrounding the southeast casino site had a
total population 367 thousand in 2007. Projections for 2012 show an increase to
approximately 377 thousand. Jasper County, Missouri had the highest population (114
thousand in 2007, with projections for 119 thousand by 2012). The average compound
growth rate for population within the surrounding counties is 0.5%.
The total population for the southeast trade area was approximately 3 million in 2007 with
forecasted increases to 3.2 million by 2012. This reflects an average compound growth rate
of 1.2%.
Exhibit 3-6 Total Population Statistics
# of
Co Counties 2000 2006 2007 2008 2009 2010 2011 2012
ACGR
07 to 12
% Pop/
Co 2012
Bourbon KS 15,379 15,234 15,222 15,211 15,201 15,189 15,180 15,169 -0.1% 4%
Cherokee KS 22,605 21,320 21,257 21,194 21,130 21,067 21,005 20,942 -0.3% 6%
Crawford KS 38,242 38,470 38,559 38,649 38,738 38,832 38,920 39,010 0.2% 10%
Labette KS 22,835 22,199 22,175 22,148 22,123 22,099 22,075 22,050 -0.1% 6%
Neosho KS 16,997 15,905 15,784 15,665 15,544 15,426 15,311 15,193 -0.8% 4%
Barton MO 12,541 13,015 13,107 13,199 13,291 13,385 13,474 13,564 0.7% 4%
Jasper MO 104,686 112,505 113,538 114,580 115,631 116,693 117,669 118,654 0.9% 32%
Newton MO 52,636 56,047 56,560 57,077 57,599 58,126 58,632 59,143 0.9% 16%
Vernon MO 20,454 20,455 20,515 20,576 20,636 20,697 20,754 20,810 0.3% 6%
Craig OK 14,950 15,856 16,016 16,176 16,338 16,500 16,665 16,832 1.0% 4%
Ottawa OK 33,194 34,177 34,356 34,537 34,719 34,900 35,084 35,267 0.5% 9%
11 Total Surrounding Counties 354,519 365,183 367,089 369,012 370,950 372,914 374,769 376,634 0.5% 100%
13
Total Kansas Counties -
Excluding Surrounding
Counties 159,730 159,794 159,694 159,601 159,519 159,458 159,403 159,361 0.0%
20
Total Missouri Counties -
Excluding Surrounding
Counties 718,884 787,633 798,158 808,872 819,769 830,864 840,466 850,212 1.3%
13
Total Oklahoma Counties -
Excluding Surrounding
Counties 1,042,861 1,093,736 1,102,254 1,110,848 1,119,538 1,128,298 1,137,161 1,146,097 0.8%
8 Total Arkansas Counties 455,687 535,413 549,285 563,576 578,307 593,478 609,126 625,250 2.6%
65 Total Trade Area Population 2,731,681 2,941,759 2,976,480 3,011,909 3,048,083 3,085,012 3,120,925 3,157,554 1.2%
Data Sources: Bureau of Business & Economics, University of Nevada, Reno & Wells Gaming Research, May 2008.

Kansas Casino Market Study & Gaming Revenue Projections
May 2008 Wells Gaming Research Page 3-10
Adult Population for Surrounding Counties
Exhibit 3-7 shows that in 2007 the adult population was 255 thousand for the counties
surrounding the casino site. Projections for 2012 indicate an increase to approximately 262
thousand. Jasper County, Missouri, had the highest adult population for a nearby county (79
thousand in 2007 with projections for 82 thousand by 2012). The average compound growth
rate for population within the surrounding counties as a group is 0.5%.
Overall, the adult population for the southeast trade area was approximately 2 million for
2007 with projections for 2.2 million by 2012. The resulting average compound growth rate
is 1.2%.
Exhibit 3-7 Adult Population Statistics
# of
Co Counties 2000 2006 2007 2008 2009 2010 2011 2012
ACGR
07 to 12
% Pop/
Co 2012
Bourbon KS 10,617 10,516 10,509 10,501 10,495 10,486 10,479 10,472 -0.1% 4%
Cherokee KS 15,708 14,815 14,770 14,729 14,683 14,640 14,595 14,553 -0.3% 6%
Crawford KS 26,583 26,741 26,803 26,868 26,927 26,993 27,054 27,117 0.2% 10%
Labette KS 15,943 15,497 15,482 15,464 15,445 15,430 15,413 15,396 -0.1% 6%
Neosho KS 11,814 11,055 10,971 10,887 10,804 10,722 10,643 10,560 -0.8% 4%
Barton MO 8,585 8,909 8,972 9,035 9,098 9,163 9,224 9,285 0.7% 4%
Jasper MO 72,512 77,928 78,643 79,365 80,093 80,829 81,505 82,187 0.9% 31%
Newton MO 36,546 38,914 39,270 39,629 39,992 40,358 40,709 41,064 0.9% 16%
Vernon MO 14,016 14,017 14,058 14,100 14,141 14,183 14,222 14,260 0.3% 5%
Craig OK 10,848 11,505 11,622 11,737 11,855 11,973 12,091 12,213 1.0% 5%
Ottawa OK 22,965 23,644 23,768 23,895 24,020 24,146 24,272 24,399 0.5% 9%
11 Total Surrounding Counties 246,137 253,541 254,869 256,211 257,553 258,922 260,206 261,506 0.5% 100%
13
Total Kansas Counties -
Excluding Surrounding
Counties 111,836 111,808 111,728 111,653 111,585 111,529 111,485 111,440 -0.1%
20
Total Missouri Counties -
Excluding Surrounding
Counties 507,877 555,911 563,300 570,821 578,470 586,258 592,988 599,818 1.3%
13
Total Oklahoma Counties -
Excluding Surrounding
Counties 721,554 756,598 762,467 768,379 774,374 780,394 786,508 792,673 0.8%
8 Total Arkansas Counties 315,597 370,689 380,290 390,175 400,370 410,853 421,680 432,831 2.6%
65 Total Trade Area Population 1,903,001 2,048,547 2,072,654 2,097,239 2,122,352 2,147,956 2,172,867 2,198,269 1.2%
Data Sources: Bureau of Business & Economics, University of Nevada, Reno & Wells Gaming Research, May 2008.

Kansas Casino Market Study & Gaming Revenue Projections
May 2008 Wells Gaming Research Page 3-11
Average Median Household Income
Exhibit 3-8 shows the average median household income (AMHI) statistics for the southeast
trade area. State-by-state, the 2007 statistics show $43 thousand for Kansas, $42.5 thousand
for Missouri, $47 thousand for Oklahoma, and $47 thousand for Arkansas. Assuming an
average compound growth rate of 3.7% for Kansas, the average median household income
would increase to approximately $52 thousand by 2012. The average median household
income for Missouri would increase to $49 thousand with an average compound growth rate
of 2.9%, Oklahoma would move up to $55 thousand with an average compound growth rate
of 3.0%, and Arkansas would go up to $57.5 thousand with an average compound growth
rate of 4.1%.
Exhibit 3-8 Average Median Household Income Statistics
# of
Co State 2000 2006 2007 2008 2009 2010 2011 2012
ACGR
07 to 12
18 Kansas $33,525 $41,572 $43,094 $44,676 $46,319 $48,028 $49,804 $51,650 3.7%
24 Missouri $34,628 $41,304 $42,508 $43,748 $45,024 $46,338 $47,691 $49,083 2.9%
15 Oklahoma $38,298 $45,640 $47,008 $48,420 $49,880 $51,388 $52,947 $54,558 3.0%
8 Arkansas $35,686 $45,304 $47,140 $49,049 $51,036 $53,103 $55,254 $57,492 4.1%
Data Sources: Bureau of Business & Economics, University of Nevada, Reno & Wells Gaming Research, May 2008.
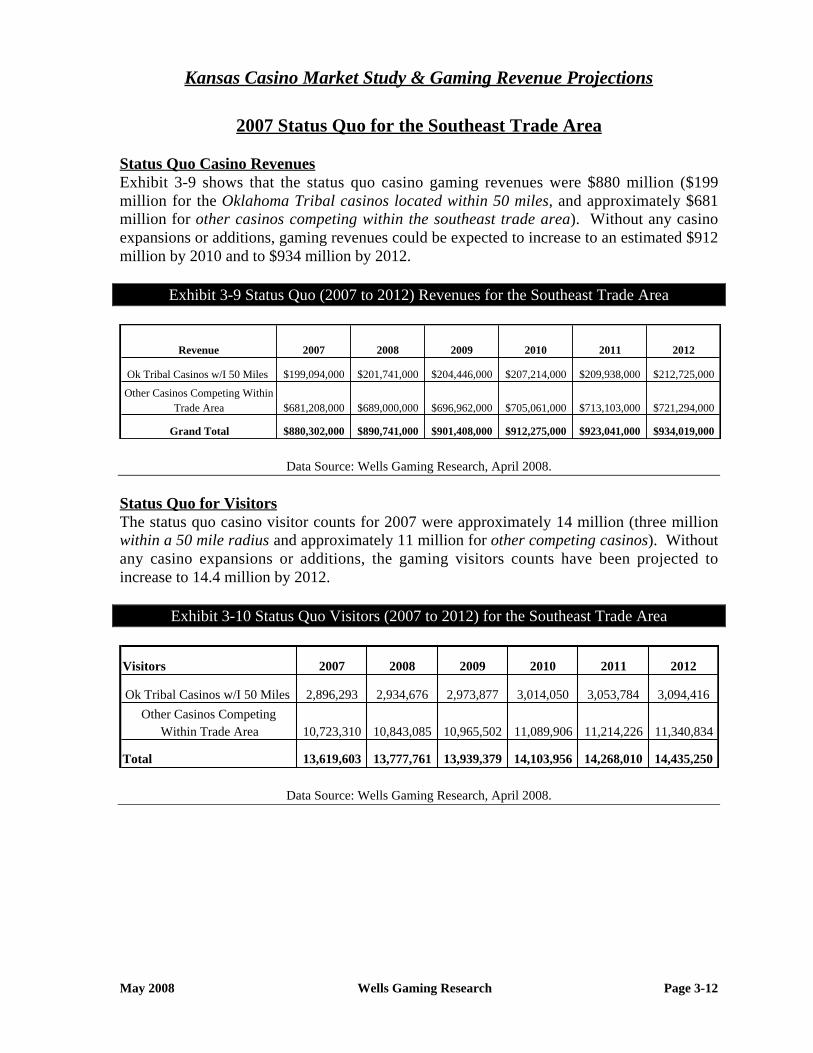
Kansas Casino Market Study & Gaming Revenue Projections
May 2008 Wells Gaming Research Page 3-12
2007 Status Quo for the Southeast Trade Area
Status Quo Casino Revenues
Exhibit 3-9 shows that the status quo casino gaming revenues were $880 million ($199
million for the Oklahoma Tribal casinos located within 50 miles, and approximately $681
million for other casinos competing within the southeast trade area). Without any casino
expansions or additions, gaming revenues could be expected to increase to an estimated $912
million by 2010 and to $934 million by 2012.
Exhibit 3-9 Status Quo (2007 to 2012) Revenues for the Southeast Trade Area
Revenue 2007 2008 2009 2010 2011 2012
Ok Tribal Casinos w/I 50 Miles $199,094,000 $201,741,000 $204,446,000 $207,214,000 $209,938,000 $212,725,000
Other Casinos Competing Within
Trade Area $681,208,000 $689,000,000 $696,962,000 $705,061,000 $713,103,000 $721,294,000
Grand Total $880,302,000 $890,741,000 $901,408,000 $912,275,000 $923,041,000 $934,019,000
Data Source: Wells Gaming Research, April 2008.
Status Quo for Visitors
The status quo casino visitor counts for 2007 were approximately 14 million (three million
within a 50 mile radius and approximately 11 million for other competing casinos). Without
any casino expansions or additions, the gaming visitors counts have been projected to
increase to 14.4 million by 2012.
Exhibit 3-10 Status Quo Visitors (2007 to 2012) for the Southeast Trade Area
Visitors 2007 2008 2009 2010 2011 2012
Ok Tribal Casinos w/I 50 Miles 2,896,293 2,934,676 2,973,877 3,014,050 3,053,784 3,094,416
Other Casinos Competing
Within Trade Area 10,723,310 10,843,085 10,965,502 11,089,906 11,214,226 11,340,834
Total 13,619,603 13,777,761 13,939,379 14,103,956 14,268,010 14,435,250
Data Source: Wells Gaming Research, April 2008.

Kansas Casino Market Study & Gaming Revenue Projections
May 2008 Wells Gaming Research Page 3-13
Status Quo Gaming Revenue Flows
Exhibit 3-11, upper section, profiles where the $880 million in gaming revenues for 2007
was generated. Included were $172 million for Arkansas, $72 million for Kansas, $219
million for Missouri, and $418 million for Oklahoma.
Of the $880 million total, an estimated $1.4 million went to Iowa, $11.9 million to Kansas,
$96 million to Missouri, and $771 million to Oklahoma Tribal casinos (refer to the lower
section of Exhibit 3-11).
Exhibit 3-11 Status Quo (2007 to 2012) Revenue Flows for the Southeast Trade Area
Current Scenario Revenues Coming From
State 2007 2008 2009 2010 2011 2012
AR $171,607,994 $176,210,374 $180,958,899 $185,844,546 $190,891,448 $196,093,017
KS $71,888,705 $71,834,865 $71,779,428 $71,734,110 $71,691,363 $71,649,578
MO $218,630,803 $221,308,664 $224,026,905 $226,787,792 $229,230,335 $231,699,727
OK $418,175,692 $421,387,294 $424,642,871 $427,911,797 $431,229,530 $434,576,446
Total $880,303,194 $890,741,197 $901,408,103 $912,278,245 $923,042,676 $934,018,768
Current Scenario Revenues Going To
State 2007 2008 2009 2010 2011 2012
IA $1,427,000 $1,444,000 $1,461,000 $1,479,000 $1,496,000 $1,513,000
KS $11,943,000 $12,064,000 $12,187,000 $12,313,000 $12,431,000 $12,550,000
MO $96,292,000 $97,464,000 $98,656,000 $99,870,000 $100,977,000 $102,100,000
OK $770,640,000 $779,769,000 $789,104,000 $798,613,000 $808,137,000 $817,856,000
Total $880,302,000 $890,741,000 $901,408,000 $912,275,000 $923,041,000 $934,019,000
Data Source: Wells Gaming Research, April 2008.
Without any new casino development in Kansas, the current trends are likely to continue.
The status quo flow for casino revenue for 2012 shows what could be expected. Of the $72
million in gaming revenues forecasted for the southeast Kansas trade area, only $12 million
would stay in Kansas, resulting in a $60 million net loss.

Kansas Casino Market Study & Gaming Revenue Projections
May 2008 Wells Gaming Research Page 3-14
Status Quo Casino Capacity
Exhibit 3-12 shows that 53 casinos are currently located within approximately 150 miles of
the southeast zone casino site. Total gaming capacity includes 30,846 slots, 409 pit table
games, 182 poker tables, 3,180 bingo seats, 6 race books, and 1,401,874 square feet of casino
space. Other amenities include 74,620 square feet of convention/meeting space, 1,619 hotel
rooms, 87 restaurants, 21 entertainment venues, and 35,573 parking spaces.
Exhibit 3-12 Status Quo (2007) Casino Capacity Statistics
# of
Loc Casino# of
Slots
# of Pit
Tables
# of
Poker
Tables
# of
Total
Tables
# of
Bingo
Seats
Race
Book
Casino
S.F.
Con-
vention
S.F.
# of
Rooms
# of
Restau-
rants
Enter-
tain-
ment
Park-
ing
Missouri:
1 Ameristar Casino Hotel - Kansas City 3,016 90 15 105 0 0 140,000 14,520 184 11 3 2,660
2 Argosy Riverside Casino Hotel & Spa 1,924 39 8 47 0 0 62,000 18,000 258 5 3 2,700
3 Harrah's North Kansas City Casino & Hotel 1,793 60 12 72 0 0 60,133 10,000 392 6 1 3,122
4 Isle of Capri Casino - Kansas City 1,525 26 6 32 0 0 40,000 0 0 5 1 1,618
Subtotal of Missouri 8,258 215 41 256 0 0 302,133 42,520 834 27 8 10,100
Oklahoma:
1 7 Clans Paradise Casino 700 8 6 14 0 0 30,000 0 0 2 0 500
2 Blue Ribbon Downs 250 0 0 0 0 1 7,150 2,000 0 1 1 1,640
3 Blue Star Gaming and Casino 228 0 0 0 300 0 20,000 0 0 1 0 500
4 Bordertown Bingo & Casino 886 11 10 21 650 1 73,000 0 0 2 0 400
5 Buffalo Run Casino 1,300 20 9 29 0 0 70,000 10,000 0 3 1 1,300
6 Catoosa Smoke Shop 75 0 0 0 0 0 1,728 0 0 0 0 42
7 Checotah Indian Community Bingo 158 0 0 0 400 0 9,000 0 0 1 0 250
8 Cherokee Casino - Fort Gibson 295 0 0 0 0 0 7,430 0 0 0 0 182
9 Cherokee Casino - Roland 614 6 6 12 0 0 34,375 0 44 1 0 594
10 Cherokee Casino - Sallisaw 251 4 2 6 0 0 27,500 0 0 1 1 250
11 Cherokee Casino - Tahlequah 405 6 3 9 0 0 20,000 0 0 1 0 433
12 Cherokee Casino - West Siloam Springs 1,014 12 12 24 0 0 50,000 0 0 2 1 1,174
13 Cherokee Casino - Will Rogers Downs 250 0 0 0 0 1 18,277 11,000 450 1 1 150
14 Cherokee Casino Resort 1,522 37 35 72 0 0 95,000 7,500 263 8 3 3,100
15 Choctaw Casino - Pocola 1,152 9 0 9 0 1 87,573 0 0 3 1 890
16 Cimarron Bingo Casino 363 0 0 0 0 1 9,600 0 0 1 0 400
17 Creek Nation Casino Eufaula 240 0 0 0 0 0 7,400 0 0 0 0 200
18 Creek Nation Casino Muscogee 584 7 10 17 300 0 30,000 0 0 1 1 800
19 Creek Nation Casino Okemah 132 0 3 3 110 0 1,800 0 0 0 0 200
20 Creek Nation Casino Okmulgee 334 2 3 5 0 0 11,000 0 0 1 0 600
21 Creek Nation Casino Tulsa 1,512 11 11 0 0 38,000 0 0 1 0 2,000
22 Creek Nation Travel Plaza 43 0 0 0 0 0 920 0 0 1 0 50
23 Duck Creek Casino 268 0 0 0 120 0 5,000 0 0 1 0 300
24 Eastern Shawnee Travel Plaza 186 0 0 0 0 0 3,000 0 0 0 0 150
25 Golden Pony Casino 400 0 0 0 0 0 10,000 0 0 1 0 500
26 Grand Lake Casino 879 10 6 16 0 0 45,000 0 0 1 1 1,000
27 High Winds Casino 500 8 0 8 0 0 35,000 0 0 2 0 450
28 Kaw Southwind Casino 1,078 3 4 7 700 0 55,000 0 0 2 0 1,000
29 Keetoowah Cherokee Casino 500 0 0 0 0 0 18,000 0 0 1 0 300
30 Lucky Turtle Casino 101 0 0 0 0 0 3,000 0 0 1 0 200
31 Miami Tribe Entertainment 107 0 0 0 0 0 0 0 0 0 0 75
32 Muscogee Travel Plaza 129 0 0 0 0 0 3,000 0 0 0 0 50
33 Native Lights Casino 612 6 0 6 0 0 22,500 0 0 2 0 405
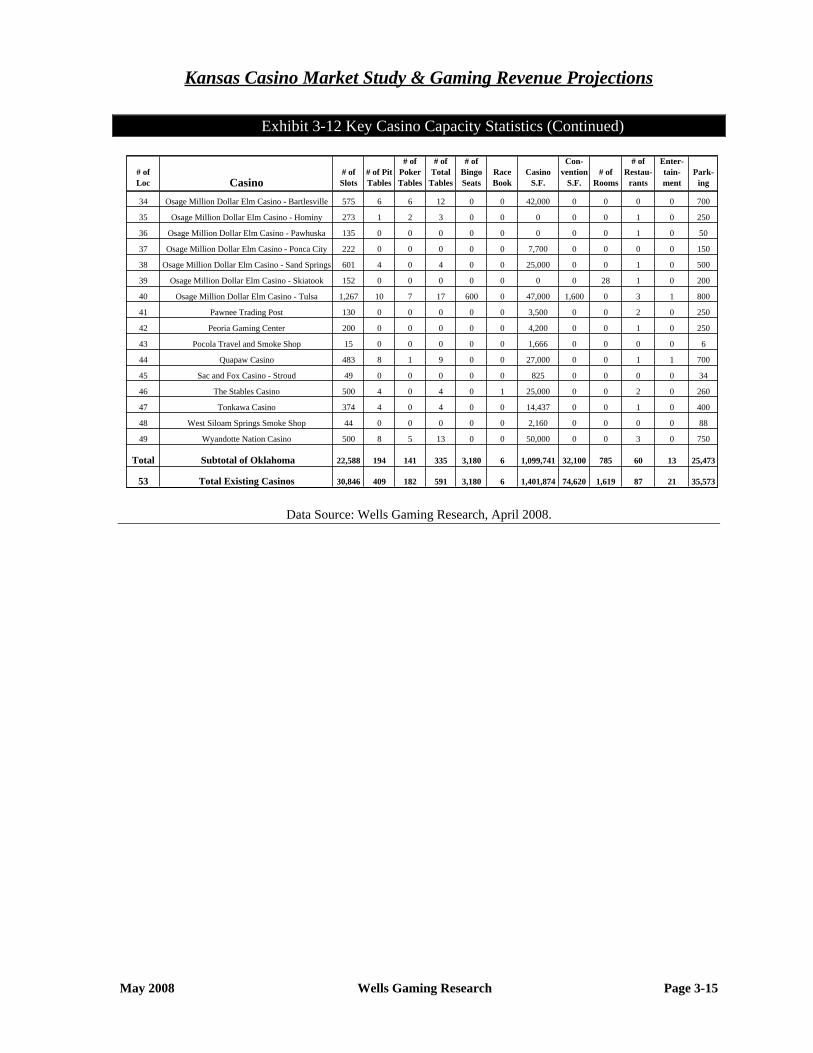
Kansas Casino Market Study & Gaming Revenue Projections
May 2008 Wells Gaming Research Page 3-15
Exhibit 3-12 Key Casino Capacity Statistics (Continued)
# of
Loc Casino# of
Slots
# of Pit
Tables
# of
Poker
Tables
# of
Total
Tables
# of
Bingo
Seats
Race
Book
Casino
S.F.
Con-
vention
S.F.
# of
Rooms
# of
Restau-
rants
Enter-
tain-
ment
Park-
ing
34 Osage Million Dollar Elm Casino - Bartlesville 575 6 6 12 0 0 42,000 0 0 0 0 700
35 Osage Million Dollar Elm Casino - Hominy 273 1 2 3 0 0 0 0 0 1 0 250
36 Osage Million Dollar Elm Casino - Pawhuska 135 0 0 0 0 0 0 0 0 1 0 50
37 Osage Million Dollar Elm Casino - Ponca City 222 0 0 0 0 0 7,700 0 0 0 0 150
38 Osage Million Dollar Elm Casino - Sand Springs 601 4 0 4 0 0 25,000 0 0 1 0 500
39 Osage Million Dollar Elm Casino - Skiatook 152 0 0 0 0 0 0 0 28 1 0 200
40 Osage Million Dollar Elm Casino - Tulsa 1,267 10 7 17 600 0 47,000 1,600 0 3 1 800
41 Pawnee Trading Post 130 0 0 0 0 0 3,500 0 0 2 0 250
42 Peoria Gaming Center 200 0 0 0 0 0 4,200 0 0 1 0 250
43 Pocola Travel and Smoke Shop 15 0 0 0 0 0 1,666 0 0 0 0 6
44 Quapaw Casino 483 8 1 9 0 0 27,000 0 0 1 1 700
45 Sac and Fox Casino - Stroud 49 0 0 0 0 0 825 0 0 0 0 34
46 The Stables Casino 500 4 0 4 0 1 25,000 0 0 2 0 260
47 Tonkawa Casino 374 4 0 4 0 0 14,437 0 0 1 0 400
48 West Siloam Springs Smoke Shop 44 0 0 0 0 0 2,160 0 0 0 0 88
49 Wyandotte Nation Casino 500 8 5 13 0 0 50,000 0 0 3 0 750
Total Subtotal of Oklahoma 22,588 194 141 335 3,180 6 1,099,741 32,100 785 60 13 25,473
53 Total Existing Casinos 30,846 409 182 591 3,180 6 1,401,874 74,620 1,619 87 21 35,573
Data Source: Wells Gaming Research, April 2008.

Kansas Casino Market Study & Gaming Revenue Projections
May 2008 Wells Gaming Research Page 3-16
Scenario Results for the Southeast Casino Zone Trade Area
WGR developed six scenarios for the southeast trade area. Summaries of the components of
the scenarios, together with the results of WGR’s research and analyses follow.
Scenario 1
Scenario 1 includes the existing casinos in the southeast trade area, together with the
proposed generic casino located in Cherokee County that is proposed to commence
operations in January of 2010. As proposed, key gaming capacity assumptions for the
Cherokee County mid case scenario include 1,200 slot machines and 40 table games. Other
amenities include 10,000 square feet of convention/meeting space, 250 hotel rooms, three
restaurants, and two entertainment venues (one small and one large). This scenario assumes
that no new casino competition in the form of expanded or new casinos will come online,
including the slot machines at Camptown Race Track.
Revenue Projections
The casino gaming revenue projections shown in Exhibit 3-13 include WGR’s low, mid, and
high case forecasts for 2010 and 2012. The mid case projections show total gaming revenues
of $919.5 million in 2010 increasing to $941 million by 2012. The Cherokee Casino Resort
has been estimated to attract $68 million in gaming revenues in the 2010 mid case, and
approximately $69.5 million in the 2012 mid case. Low case estimates are in the $41 to $42
million range while high case estimates are in the $89 to $91 million range.
Exhibit 3-13 Scenario 1 Revenues
Scenario 1 Includes Existing Casinos + Other OK + Cherokee County Proposed for 2009
Current Low Case Mid Case High Case
2007 2010 2012 2010 2012 2010 2012
*Cherokee County (Proposed) $0 $41,117,000 $41,940,000 $67,962,000 $69,404,000 $89,316,000 $91,283,000
Oklahoma Tribal Casinos w/i 50 Miles $199,094,000 $186,017,000 $191,146,000 $172,159,000 $177,006,000 $162,019,000 $166,646,000
All Other Casinos $681,208,000 $692,335,000 $708,210,000 $679,348,000 $694,889,000 $668,135,000 $683,371,000
Total Scenario 1 $880,302,000 $919,469,000 $941,296,000 $919,469,000 $941,299,000 $919,470,000 $941,300,000
Data Source: Wells Gaming Research, April 2008.

Kansas Casino Market Study & Gaming Revenue Projections
May 2008 Wells Gaming Research Page 3-17
Revenue Impacts
Exhibit 3-14 profiles the casino gaming revenue impacts anticipated from adding the
Cherokee to the southeast trade area. The category captioned Cherokee County Proposed
could generate $68 million in 2010 gaming revenues and $69.4 million in 2012. The offset
would be felt by other Oklahoma casinos ($35 million in the 2010 mid case), and all other
existing casinos (approximately $26 million in 2010). The net gain to the southeast trade
area has been estimated at $7.2 million.
Exhibit 3-14 Scenario 1 Revenue Impacts
Includes Existing Casinos + Other OK + Cherokee County Proposed for 2009
Current Low Case Mid Case High Case
2007 2010 2012 2010 2012 2010 2012
*Cherokee County (Proposed) $0 $41,117,000 $41,940,000 $67,962,000 $69,404,000 $89,316,000 $91,283,000
Oklahoma Tribal Casinos w/i 50 Miles $0 -$21,197,000 -$21,579,000 -$35,055,000 -$35,719,000 -$45,195,000 -$46,079,000
All Other Casinos $0 -$12,726,000 -$13,084,000 -$25,713,000 -$26,405,000 -$36,926,000 -$37,923,000
Total Scenario 1 $0 $7,194,000 $7,277,000 $7,194,000 $7,280,000 $7,195,000 $7,281,000
Data Source: Wells Gaming Research, April 2008.

Kansas Casino Market Study & Gaming Revenue Projections
May 2008 Wells Gaming Research Page 3-18
Forecasted Flow Funds
The southeast trade area produced $880 million in gaming revenues in 2007 (refer to the first
section of Exhibit 3-15 captioned Scenario 1 Revenues Coming From). Of this amount, an
estimated $72 million was generated in Kansas, while only $12 million stayed in Kansas.
This represents a loss of $60 million (refer to the third section of Exhibit 3-15 captioned
Scenario 1 Mid – Revenues Going To). Oklahoma generated $418 million in 2007; however,
$771 million flowed back to Oklahoma for a net gain of $353 million. WGR’s 2010 mid
case projections for scenario 1 show that the addition of Cherokee County could increase the
flow of gaming revenues for Kansas to $79 million, or $67 million over 2007. Even though
Oklahoma’s gaming revenues would decrease from $789 million to $744.5 million (mid case
2009 versus 2010), Oklahoma would continue to be the big winner, generating $428 million
in 2010 with $744 million flowing to Oklahoma in the mid case, for a net gain $316 million.
Exhibit 3-15 Flows of Gaming Revenue Funds – Coming From & Going To
Scenario 1 Revenues Coming From
State 2007 % 2007 2008 2009 2010 % 2010 2011 2012 % 2012
AR $171,607,994 19.5% $176,210,374 $180,958,899 $185,844,546 20.2% $190,891,448 $196,093,017 20.8%
KS $71,888,705 8.2% $71,834,865 $71,779,428 $72,877,762 7.9% $72,835,751 $72,794,759 7.7%
MO $218,630,803 24.8% $221,308,664 $224,026,905 $232,833,198 25.3% $235,320,506 $237,835,066 25.3%
OK $418,175,692 47.5% $421,387,294 $424,642,871 $427,911,797 46.5% $431,229,530 $434,576,446 46.2%
Total $880,303,194 100.0% $890,741,197 $901,408,103 $919,467,303 100.0% $930,277,235 $941,299,288 100.0%
Scenario 1 Low - Revenues Going To
State 2007 % 2007 2008 2009 2010 % 2010 2011 2012 % 2012
IA $1,427,000 0.2% $1,444,000 $1,461,000 $1,425,000 0.2% $1,441,000 $1,457,000 0.2%
KS $11,943,000 1.4% $12,064,000 $12,187,000 $53,003,000 5.8% $53,524,000 $54,055,000 5.7%
MO $96,292,000 10.9% $97,464,000 $98,656,000 $97,450,000 10.6% $98,533,000 $99,630,000 10.6%
OK $770,640,000 87.5% $779,769,000 $789,104,000 $767,591,000 83.5% $776,780,000 $786,154,000 83.5%
Total $880,302,000 100.0% $890,741,000 $901,408,000 $919,469,000 100.0% $930,278,000 $941,296,000 100.0%
Scenario 1 Mid - Revenues Going To
State 2007 % 2007 2008 2009 2010 % 2010 2011 2012 % 2012
IA $1,427,000 0.2% $1,444,000 $1,461,000 $1,358,000 0.1% $1,374,000 $1,389,000 0.1%
KS $11,943,000 1.4% $12,064,000 $12,187,000 $79,343,000 8.6% $80,165,000 $81,006,000 8.6%
MO $96,292,000 10.9% $97,464,000 $98,656,000 $94,290,000 10.3% $95,343,000 $96,412,000 10.2%
OK $770,640,000 87.5% $779,769,000 $789,104,000 $744,478,000 81.0% $753,398,000 $762,492,000 81.0%
Total $880,302,000 100.0% $890,741,000 $901,408,000 $919,469,000 100.0% $930,280,000 $941,299,000 100.0%
Scenario 1 High - Revenues Going To
State 2007 % 2007 2008 2009 2010 % 2010 2011 2012 % 2012
IA $1,427,000 0.2% $1,444,000 $1,461,000 $1,302,000 0.1% $1,316,000 $1,331,000 0.1%
KS $11,943,000 1.4% $12,064,000 $12,187,000 $100,270,000 10.9% $101,349,000 $102,450,000 10.9%
MO $96,292,000 10.9% $97,464,000 $98,656,000 $91,585,000 10.0% $92,614,000 $93,658,000 9.9%
OK $770,640,000 87.5% $779,769,000 $789,104,000 $726,313,000 79.0% $734,997,000 $743,861,000 79.0%
Total $880,302,000 100.0% $890,741,000 $901,408,000 $919,470,000 100.0% $930,276,000 $941,300,000 100.0%
Data Source: Wells Gaming Research, April 2008.

Kansas Casino Market Study & Gaming Revenue Projections
May 2008 Wells Gaming Research Page 3-19
Scenario 2
Scenario 2 includes scenario 1, and the proposed expansions at the following casinos located
in Kansas and Oklahoma (southeast trade area). The projected start-up dates for the casino
expansions are also shown:
Kansas
1. Sac & Fox Casino in Powhattan, KS (March 2008)
Oklahoma
1. Creek Nation Casino in Tulsa, OK (September 2008)
2. Cherokee Casino Resort in Catoosa, OK (January 2009)
3. Kickapoo Casino in McLoud, OK (January 2009)
4. Osage Million Dollar Elm in Ponca City, OK (January 2009)
5. Cherokee Casino West Siloam Springs in Watts, OK (July 2009)
Revenue Projections
Exhibit 3-16 shows casino gaming revenue projections for WGR’s low, mid, and high case
forecasts for 2010 and 2012. The mid case projections reflect total gaming revenues of
$919.5 million in 2010, increasing to $941.3 million by 2012.
Exhibit 3-16 Scenario 2 Revenues Include Scenario 1 + the Expansions
Current Low Case Mid Case High Case
2007 2010 2012 2010 2012 2010 2012
*Cherokee County Proposed $0 $38,832,000 $39,578,000 $64,069,000 $65,372,000 $84,107,000 $85,882,000
Oklahoma Tribal Casinos w/i 50 Miles $199,094,000 $170,250,000 $174,731,000 $157,697,000 $161,942,000 $148,585,000 $152,648,000
All Other Casinos $681,208,000 $710,381,000 $726,986,000 $697,699,000 $713,985,000 $686,775,000 $702,772,000
Total Scenario 2 $880,302,000 $919,463,000 $941,295,000 $919,465,000 $941,299,000 $919,467,000 $941,302,000
Data Source: Wells Gaming Research, April 2008.

Kansas Casino Market Study & Gaming Revenue Projections
May 2008 Wells Gaming Research Page 3-20
Revenue Impacts
Overall, the casino gaming revenue impacts to Cherokee County caused by adding
expansions at the competing casinos listed on page 3-18 would be limited to a loss of
approximately $4 million in the Scenario 2 mid case. The category captioned other existing
casinos would most likely pick up approximately $18 to $19 million between 2010 and 2012.
The majority of the estimated losses ($14 to $15 million in the mid-case for 2010 and 2012)
would be sustained by other Oklahoma casinos and by Oklahoma Tribal casinos
(approximately $4 million in both of the subject years).
Exhibit 3-17 Scenario 2 Revenue Impacts include Scenario 1 + Expansions
Current Low Case Mid Case High Case
2007 2010 2012 2010 2012 2010 2012
*Cherokee County Proposed $0 -$2,285,000 -$2,362,000 -$3,893,000 -$4,032,000 -$5,209,000 -$5,401,000
Oklahoma Tribal Casinos w/i 50 Miles $0 -$15,767,000 -$16,415,000 -$14,462,000 -$15,064,000 -$13,434,000 -$13,998,000
All Other Casinos $0 $18,046,000 $18,776,000 $18,351,000 $19,096,000 $18,640,000 $19,401,000
Total Scenario 2 $0 -$6,000 -$1,000 -$4,000 $0 -$3,000 $2,000
Data Source: Wells Gaming Research, April 2008.

Kansas Casino Market Study & Gaming Revenue Projections
May 2008 Wells Gaming Research Page 3-21
Forecasted Flow Funds
Exhibit 3-18 shows WGR’s projections for the 2010 shifts in casino revenue flows. The
results indicate that Kansas would generate $73 million (refer to the first section captioned
Scenario 2 Revenues Coming From). However, $75 million could flow back to Kansas for a
net gain of approximately $2 million in the 2010 (refer to the third section of Exhibit 3-18
captioned Scenario 2 Mid - Revenues Going To).
Oklahoma would remain the big winner after the addition of Cherokee County. Oklahoma is
estimated to generate $428 million, but receive $753 million in gaming revenues.
Exhibit 3-18 Flows of Gaming Revenue Funds for Scenario 2
Illustrates Where the Gaming Revenues Originated & Where They Went
Scenario 2 Revenues Coming From
State 2007 % 2007 2008 2009 2010 % 2010 2011 2012 % 2012
AR $171,607,994 19.5% $176,210,374 $180,958,899 $185,844,546 20.2% $190,891,448 $196,093,017 20.8%
KS $71,888,705 8.2% $71,834,865 $71,779,428 $72,877,762 7.9% $72,835,751 $72,794,759 7.7%
MO $218,630,803 24.8% $221,308,664 $224,026,905 $232,833,198 25.3% $235,320,506 $237,835,066 25.3%
OK $418,175,692 47.5% $421,387,294 $424,642,871 $427,911,797 46.5% $431,229,530 $434,576,446 46.2%
Total $880,303,194 100.0% $890,741,197 $901,408,103 $919,467,303 100.0% $930,277,235 $941,299,288 100.0%
Scenario 2 Low - Revenues Going To
State 2007 % 2007 2008 2009 2010 % 2010 2011 2012 % 2012
IA $1,427,000 0.2% $1,417,000 $1,345,000 $1,315,000 0.1% $1,330,000 $1,344,000 0.1%
KS $11,943,000 1.4% $12,573,000 $12,028,000 $50,594,000 5.5% $51,072,000 $51,560,000 5.5%
MO $96,292,000 10.9% $96,200,000 $93,737,000 $92,812,000 10.1% $93,831,000 $94,864,000 10.1%
OK $770,640,000 87.5% $780,553,000 $794,296,000 $774,742,000 84.3% $784,040,000 $793,527,000 84.3%
Total $880,302,000 100.0% $890,743,000 $901,406,000 $919,463,000 100.0% $930,273,000 $941,295,000 100.0%
Scenario 2 Mid - Revenues Going To
State 2007 % 2007 2008 2009 2010 % 2010 2011 2012 % 2012
IA $1,427,000 0.2% $1,417,000 $1,345,000 $1,257,000 0.1% $1,271,000 $1,285,000 0.1%
KS $11,943,000 1.4% $12,573,000 $12,028,000 $75,358,000 8.2% $76,108,000 $76,872,000 8.2%
MO $96,292,000 10.9% $96,200,000 $93,737,000 $89,995,000 9.8% $90,990,000 $91,999,000 9.8%
OK $770,640,000 87.5% $780,553,000 $794,296,000 $752,855,000 81.9% $761,907,000 $771,143,000 81.9%
Total $880,302,000 100.0% $890,743,000 $901,406,000 $919,465,000 100.0% $930,276,000 $941,299,000 100.0%
Scenario 2 High - Revenues Going To
State 2007 % 2007 2008 2009 2010 % 2010 2011 2012 % 2012
IA $1,427,000 0.2% $1,417,000 $1,345,000 $1,207,000 0.1% $1,221,000 $1,234,000 0.1%
KS $11,943,000 1.4% $12,573,000 $12,028,000 $94,994,000 10.3% $95,975,000 $96,975,000 10.3%
MO $96,292,000 10.9% $96,200,000 $93,737,000 $87,578,000 9.5% $88,552,000 $89,540,000 9.5%
OK $770,640,000 87.5% $780,553,000 $794,296,000 $735,688,000 80.0% $744,531,000 $753,553,000 80.1%
Total $880,302,000 100.0% $890,743,000 $901,406,000 $919,467,000 100.0% $930,279,000 $941,302,000 100.0%
Data Source: Wells Gaming Research, May 2008.

Kansas Casino Market Study & Gaming Revenue Projections
May 2008 Wells Gaming Research Page 3-22
Scenario 3Scenario 3 includes Scenario 2, as well as the 18 other proposed casinos listed below:
Kansas
1. Camptown Greyhound Park in Frontenac, KS (Jan 2009)
2. The Woodlands in Kansas City, KS (Jan 2009)
3. Sumner County planned in Wellington, KS (Jan 2010)
4. Wyandotte 7th Street Casino in Kansas City, KS (Jan 2008)
5. Wyandotte County planned in Kansas City, KS (Jan 2010)
Missouri
1. Barden Development, Inc. planned in Branson, MO
Oklahoma
1. Downstream Casino Resort in Ottawa, OK (July 2008)
2. First Council Casino in Newkirk, OK (March 2008)
3. Seneca-Cayuga Tribes of Oklahoma planned in Grove, OK (July 2008)
4. Ioway Casino Resort in Lincoln, OK (January 2009)
5. Wild Rose Entertainment planned in Sugar Creek, MO (proposed for January
2010)
6. Muscogee Creek Nation planned in Eufaula, OK (proposed for 2010)
7. Pawnee Nation planned in Chilocco, OK (planned for 2010)
8. Ponca Tribe Oklahoma planned in Ponca City, OK (planned for 2010)
9. Poteau Travel and Smoke Shop in Poteau, OK (planned for 2010)
10. Shawnee Tribe Oklahoma planned in Oklahoma City, OK (planned for 2010)
11. Wichita & Affiliated Tribes planned in Hinton, OK (planned for 2010)
12. Wilburton Travel and Smoke Shop in Wilburton, OK (planned for 2010)

Kansas Casino Market Study & Gaming Revenue Projections
May 2008 Wells Gaming Research Page 3-23
Revenue Projections
WGR’s mid case casino gaming revenue projections for scenario 3 are profiled in Exhibit 3-
19. Total gaming revenues for 2010 are forecasted at approximately $1.0 billion with minor
increases through 2012.
Exhibit 3-19 Scenario 3 Revenues Include Scenario 2 + Other Proposed Casinos
Current Low Case Mid Case High Case
2007 2010 2012 2010 2012 2010 2012
*Cherokee County Proposed $0 $26,031,000 $26,567,000 $46,957,000 $47,955,000 $64,926,000 $66,338,000
*Camptown Greyhound Park $0 $18,453,000 $18,655,000 $17,768,000 $17,962,000 $17,171,000 $17,358,000
*Proposed Casinos w/i 50 Miles $0 $79,488,000 $81,547,000 $74,230,000 $76,194,000 $70,208,000 $72,096,000
*All Other Proposed Casinos $0 $127,169,300 $130,418,700 $124,552,300 $127,740,700 $122,133,400 $125,265,800
Oklahoma Tribal Casinos w/i 50 Miles $199,094,000 $131,980,000 $135,525,000 $126,520,000 $129,951,000 $121,968,000 $125,299,000
All Other Casinos $681,208,000 $638,647,000 $653,158,000 $631,745,000 $646,062,000 $625,369,000 $639,505,000
Total Scenario 3 $880,302,000 $1,021,768,300 $1,045,870,700 $1,021,772,300 $1,045,864,700 $1,021,775,400 $1,045,861,800
Data Source: Wells Gaming Research, April 2008.
Revenue Impacts
Scenario 3 incorporates the addition of the new casino in Cherokee County (scenario 1), the
casino expansions (scenario 2), and the 18 new casinos listed in scenario 3 that include slot
machines at the Camptown Race Track. The result is a $102 million addition in gaming
revenue projections for the southeast trade area. The $125 million in positive impacts
flowing to the category called all other proposed casinos is by far the most significant. The
proposed new casinos have been estimated to reduce annual gaming revenues at Cherokee
County by amounts ranging from $13 million in the low case, to $17 million in the mid case,
and $19 million in the high case.
Exhibit 3-20 Scenario 3 Revenue Impacts Include Scenario 2 + Other Proposed Casinos
Current Low Case Mid Case High Case
2007 2010 2012 2010 2012 2010 2012
*Cherokee County Proposed $0 -$12,801,000 -$13,011,000 -$17,112,000 -$17,417,000 -$19,181,000 -$19,544,000
*Camptown Greyhound Park $0 $18,453,000 $18,655,000 $17,768,000 $17,962,000 $17,171,000 $17,358,000
*Proposed Casinos w/i 50 Miles $0 $79,488,000 $81,547,000 $74,230,000 $76,194,000 $70,208,000 $72,096,000
*All Other Proposed Casinos $0 $127,169,300 $130,418,700 $124,552,300 $127,740,700 $122,133,400 $125,265,800
Oklahoma Tribal Casinos w/i 50 Miles $0 -$38,270,000 -$39,206,000 -$31,177,000 -$31,991,000 -$26,617,000 -$27,349,000
All Other Casinos $0 -$71,734,000 -$73,828,000 -$65,954,000 -$67,923,000 -$61,406,000 -$63,267,000
Total Scenario 3 $0 $102,305,300 $104,575,700 $102,307,300 $104,565,700 $102,308,400 $104,559,800
Data Source: Wells Gaming Research, April 2008.

Kansas Casino Market Study & Gaming Revenue Projections
May 2008 Wells Gaming Research Page 3-24
Forecasted Flow of Funds
Exhibit 3-21 shows that the mid case projections for Kansas include the generation of $80
million in gaming revenues for 2010 (refer to the first section captioned Scenario 3 Revenues
Coming From). However, due to the expanded gaming activity, as much as $109.5 million
could flow back to Kansas (refer to the third section captioned Scenario 3 Mid - Revenues
Going To). The result would be a net gain of approximately $29.5 million. Nonetheless,
Oklahoma casinos would continue to be the big winner. The Oklahoma portion of the trade
area has been projected to generate an estimated $428 million, while Oklahoma casinos
receive $773 million in revenues flowing back from the southeast trade area.
Exhibit 3-21 Flows of Gaming Revenue Funds for Scenario 3
Illustrate Where the Gaming Revenues Originated & Where They Went
Scenario 3 Revenues Coming From
State 2007 % 2007 2008 2009 2010 % 2010 2011 2012 % 2012
AR $171,607,994 19.5% $176,210,374 $180,958,899 $196,942,472 19.3% $202,113,354 $207,439,752 19.8%
KS $71,888,705 8.2% $73,069,960 $79,814,361 $80,258,196 7.9% $80,208,273 $80,159,359 7.7%
MO $218,630,803 24.8% $226,164,686 $235,119,161 $316,601,315 31.0% $320,093,085 $323,627,194 30.9%
OK $418,175,692 47.5% $421,447,526 $424,703,647 $427,973,116 41.9% $431,291,392 $434,638,878 41.6%
Total $880,303,194 100.0% $896,892,546 $920,596,068 $1,021,775,099 100.0% $1,033,706,104 $1,045,865,183 100.0%
Scenario 3 Low - Revenues Going To
State 2007 % 2007 2008 2009 2010 % 2010 2011 2012 % 2012
IA $1,427,000 0.2% $1,221,000 $1,149,000 $1,129,000 0.1% $1,141,000 $1,154,000 0.1%
KS $11,943,000 1.4% $13,207,000 $36,838,000 $90,207,000 8.8% $91,026,000 $91,860,000 8.8%
MO $96,292,000 10.9% $86,540,000 $83,026,000 $140,856,000 13.8% $142,640,000 $144,450,000 13.8%
OK $770,640,000 87.5% $795,926,000 $799,585,000 $789,576,300 77.3% $798,897,000 $808,406,700 77.3%
Total $880,302,000 100.0% $896,894,000 $920,598,000 $1,021,768,300 100.0% $1,033,704,000 $1,045,870,700 100.0%
Scenario 3 Mid - Revenues Going To
State 2007 % 2007 2008 2009 2010 % 2010 2011 2012 % 2012
IA $1,427,000 0.2% $1,221,000 $1,149,000 $1,098,000 0.1% $1,110,000 $1,123,000 0.1%
KS $11,943,000 1.4% $13,207,000 $36,838,000 $109,471,000 10.7% $110,507,000 $111,560,000 10.7%
MO $96,292,000 10.9% $86,540,000 $83,026,000 $138,047,000 13.5% $139,796,000 $141,578,000 13.5%
OK $770,640,000 87.5% $795,926,000 $799,585,000 $773,156,300 75.7% $782,294,000 $791,603,700 75.7%
Total $880,302,000 100.0% $896,894,000 $920,598,000 $1,021,772,300 100.0% $1,033,707,000 $1,045,864,700 100.0%
Scenario 3 - High Revenues Going To
State 2007 % 2007 2008 2009 2010 % 2010 2011 2012 % 2012
IA $1,427,000 0.2% $1,221,000 $1,149,000 $1,071,000 0.1% $1,082,000 $1,094,000 0.1%
KS $11,943,000 1.4% $13,207,000 $36,838,000 $125,949,000 12.3% $127,179,000 $128,429,000 12.3%
MO $96,292,000 10.9% $86,540,000 $83,026,000 $135,441,000 13.3% $137,167,000 $138,917,000 13.3%
OK $770,640,000 87.5% $795,926,000 $799,585,000 $759,314,400 74.3% $768,276,100 $777,421,800 74.3%
Total $880,302,000 100.0% $896,894,000 $920,598,000 $1,021,775,400 100.0% $1,033,704,100 $1,045,861,800 100.0%
Data Source: Wells Gaming Research, April 2008.
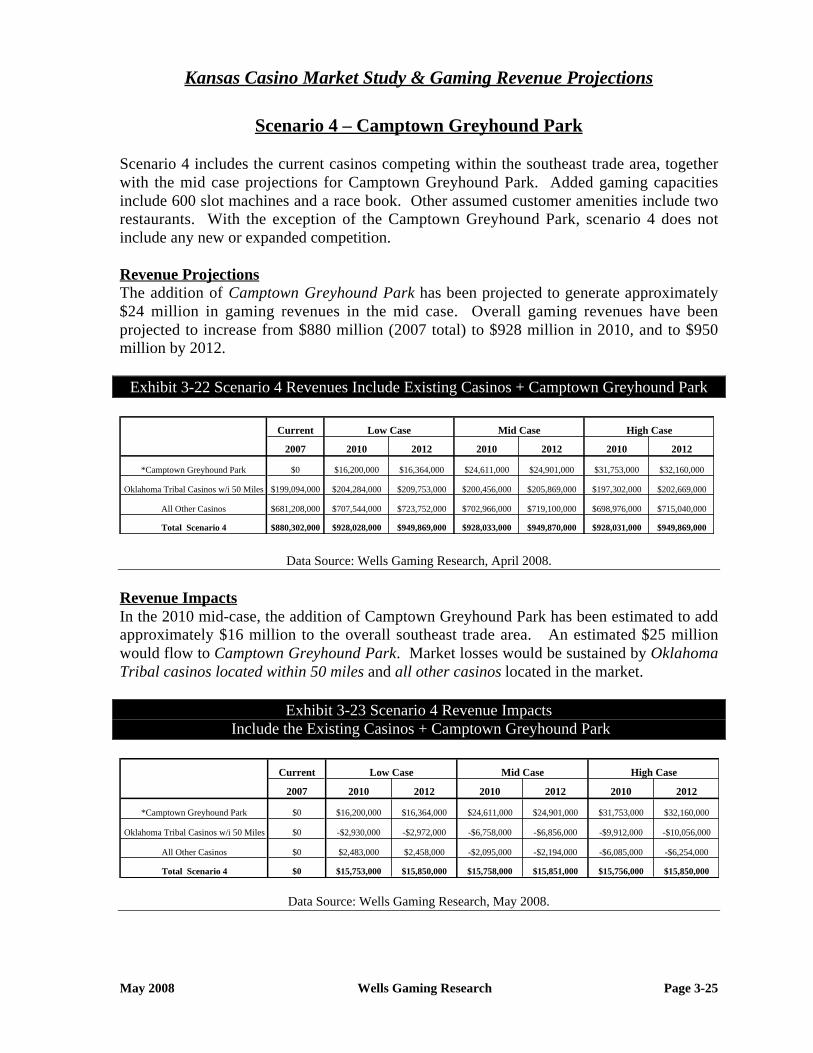
Kansas Casino Market Study & Gaming Revenue Projections
May 2008 Wells Gaming Research Page 3-25
Scenario 4 – Camptown Greyhound Park
Scenario 4 includes the current casinos competing within the southeast trade area, together
with the mid case projections for Camptown Greyhound Park. Added gaming capacities
include 600 slot machines and a race book. Other assumed customer amenities include two
restaurants. With the exception of the Camptown Greyhound Park, scenario 4 does not
include any new or expanded competition.
Revenue Projections
The addition of Camptown Greyhound Park has been projected to generate approximately
$24 million in gaming revenues in the mid case. Overall gaming revenues have been
projected to increase from $880 million (2007 total) to $928 million in 2010, and to $950
million by 2012.
Exhibit 3-22 Scenario 4 Revenues Include Existing Casinos + Camptown Greyhound Park
Current Low Case Mid Case High Case
2007 2010 2012 2010 2012 2010 2012
*Camptown Greyhound Park $0 $16,200,000 $16,364,000 $24,611,000 $24,901,000 $31,753,000 $32,160,000
Oklahoma Tribal Casinos w/i 50 Miles $199,094,000 $204,284,000 $209,753,000 $200,456,000 $205,869,000 $197,302,000 $202,669,000
All Other Casinos $681,208,000 $707,544,000 $723,752,000 $702,966,000 $719,100,000 $698,976,000 $715,040,000
Total Scenario 4 $880,302,000 $928,028,000 $949,869,000 $928,033,000 $949,870,000 $928,031,000 $949,869,000
Data Source: Wells Gaming Research, April 2008.
Revenue Impacts
In the 2010 mid-case, the addition of Camptown Greyhound Park has been estimated to add
approximately $16 million to the overall southeast trade area. An estimated $25 million
would flow to Camptown Greyhound Park. Market losses would be sustained by Oklahoma
Tribal casinos located within 50 miles and all other casinos located in the market.
Exhibit 3-23 Scenario 4 Revenue Impacts
Include the Existing Casinos + Camptown Greyhound Park
Current Low Case Mid Case High Case
2007 2010 2012 2010 2012 2010 2012
*Camptown Greyhound Park $0 $16,200,000 $16,364,000 $24,611,000 $24,901,000 $31,753,000 $32,160,000
Oklahoma Tribal Casinos w/i 50 Miles $0 -$2,930,000 -$2,972,000 -$6,758,000 -$6,856,000 -$9,912,000 -$10,056,000
All Other Casinos $0 $2,483,000 $2,458,000 -$2,095,000 -$2,194,000 -$6,085,000 -$6,254,000
Total Scenario 4 $0 $15,753,000 $15,850,000 $15,758,000 $15,851,000 $15,756,000 $15,850,000
Data Source: Wells Gaming Research, May 2008.

Kansas Casino Market Study & Gaming Revenue Projections
May 2008 Wells Gaming Research Page 3-26
Forecasted Flow Funds
Exhibit 3-24 illustrates potential revenue flows for scenario 4. The statistics show that
Kansas could produce $79 million in gaming revenues (refer to the first section captioned
Scenario 4 Revenues Coming From). However, gaming revenue flowing back to Kansas
would be limited to approximately $37 million in 2010 (refer to the third section of Exhibit
3-24 captioned Scenario 4 Mid - Revenues Going To). Revenue flows with Camptown
Greyhound Park being the only addition to the market would remain relatively proportional
for the other states between 2007 and 2010.
Exhibit 3-24 Flows of Gaming Revenue Funds for Scenario 4
Illustrate Where the Gaming Revenues Originated & Where They Went
Scenario 4 Revenues Coming From
State 2007 % 2007 2008 2009 2010 % 2010 2011 2012 % 2010
AR $171,607,994 19.5% $176,210,374 $180,958,899 $185,844,546 20.0% $190,891,448 $196,093,017 20.6%
KS $71,888,705 8.2% $71,834,865 $78,858,604 $78,803,487 8.5% $78,750,400 $78,698,535 8.3%
MO $218,630,803 24.8% $221,308,664 $232,640,653 $235,468,603 25.4% $237,970,967 $240,500,783 25.3%
OK $418,175,692 47.5% $421,387,294 $424,642,871 $427,911,797 46.1% $431,229,530 $434,576,446 45.8%
Total $880,303,194 100.0% $890,741,197 $917,101,027 $928,028,433 100.0% $938,842,345 $949,868,781 100.0%
Scenario 4 Low - Revenues Going To
State 2007 % 2007 2008 2009 2010 % 2010 2011 2012 % 2010
IA $1,427,000 0.2% $1,444,000 $1,494,000 $1,512,000 0.2% $1,529,000 $1,546,000 0.2%
KS $11,943,000 1.4% $12,064,000 $28,623,000 $28,835,000 3.1% $29,034,000 $29,237,000 3.1%
MO $96,292,000 10.9% $97,464,000 $101,036,000 $102,258,000 11.0% $103,368,000 $104,498,000 11.0%
OK $770,640,000 87.5% $779,769,000 $785,951,000 $795,423,000 85.7% $804,908,000 $814,588,000 85.8%
Total $880,302,000 100.0% $890,741,000 $917,104,000 $928,028,000 100.0% $938,839,000 $949,869,000 100.0%
Scenario 4 Mid - Revenues Going To
State 2007 % 2007 2008 2009 2010 % 2010 2011 2012 % 2010
IA $1,427,000 0.2% $1,444,000 $1,466,000 $1,484,000 0.2% $1,501,000 $1,518,000 0.2%
KS $11,943,000 1.4% $12,064,000 $36,723,000 $37,002,000 4.0% $37,263,000 $37,527,000 4.0%
MO $96,292,000 10.9% $97,464,000 $99,475,000 $100,687,000 10.8% $101,787,000 $102,910,000 10.8%
OK $770,640,000 87.5% $779,769,000 $779,433,000 $788,860,000 85.0% $798,286,000 $807,915,000 85.1%
Total $880,302,000 100.0% $890,741,000 $917,097,000 $928,033,000 100.0% $938,837,000 $949,870,000 100.0%
Scenario 4 - High Revenues Going To
State 2007 % 2007 2008 2009 2010 % 2010 2011 2012 % 2010
IA $1,427,000 0.2% $1,444,000 $1,442,000 $1,460,000 0.2% $1,476,000 $1,493,000 0.2%
KS $11,943,000 1.4% $12,064,000 $43,597,000 $43,936,000 4.7% $44,254,000 $44,578,000 4.7%
MO $96,292,000 10.9% $97,464,000 $98,127,000 $99,330,000 10.7% $100,424,000 $101,536,000 10.7%
OK $770,640,000 87.5% $779,769,000 $773,929,000 $783,305,000 84.4% $792,687,000 $802,262,000 84.5%
Total $880,302,000 100.0% $890,741,000 $917,095,000 $928,031,000 100.0% $938,841,000 $949,869,000 100.0%
Data Source: Wells Gaming Research, April 2008.

Kansas Casino Market Study & Gaming Revenue Projections
May 2008 Wells Gaming Research Page 3-27
Scenario 5 – Camptown + Expansions
Scenario 5 includes the scenario 4 plus expansions at the following casinos:
Kansas
1. Sac & Fox Casino in Powhattan, KS (Mar 2008)
Oklahoma
1. Cherokee Casino Resort in Catoosa, OK (January 2009)
2. Kickapoo Casino in McLoud, OK (January 2009)
3. Osage Million Dollar Elm in Ponca City, OK (January 2009)
4. Cherokee Casino West Siloam Springs in Watts, OK (July 2009)
5. Creek Nation Casino in Tulsa, OK (September 2008)
Revenue Projections
Exhibit 3-25 profiles gaming revenue projections for scenario 5. Included is scenario 4 plus
the casino expansions listed above. WGR’s mid case forecasts show that total gaming
revenues for the southeast trade area are projected at $928 million and $950 million in 2010
and 2012, respectively. This compares with an estimated $880 million in 2007.
Exhibit 3-25 Scenario 5 Gaming Revenues Include Scenario 4 + the Expansions
Current Low Case Mid Case High Case
2007 2010 2012 2010 2012 2010 2012
*Camptown Greyhound Park $0 $15,585,000 $15,736,000 $23,576,000 $23,841,000 $30,331,000 $30,701,000
Oklahoma Tribal Casinos w/i 50 Miles $199,094,000 $187,005,000 $191,778,000 $183,534,000 $188,263,000 $180,693,000 $185,382,000
All Other Casinos $681,208,000 $725,441,000 $742,353,000 $720,919,000 $737,765,000 $717,004,000 $733,787,000
Total Scenario 5 $880,302,000 $928,031,000 $949,867,000 $928,029,000 $949,869,000 $928,028,000 $949,870,000
Data Source: Wells Gaming Research, April 2008.
Revenue Impacts
Exhibit 2-26 illustrates that the scenario 5 mid case for 2010 results in a minor negative
change of $4 thousand. Camptown Greyhound Park shows a loss of $1 million, while
Oklahoma Tribal casinos located within 50 miles reflect projected losses of $17 million. All
other casinos have been forecasted to pick up approximately $18 million in gaming revenues.
Exhibit 3-26 Scenario 5 Gaming Revenues Include Scenario 4 + the Expansions
Current Low Case Mid Case High Case
2007 2010 2012 2010 2012 2010 2012
*Camptown Greyhound Park $0 -$615,000 -$628,000 -$1,035,000 -$1,060,000 -$1,422,000 -$1,459,000
Oklahoma Tribal Casinos w/i 50 Miles $0 -$17,279,000 -$17,975,000 -$16,922,000 -$17,606,000 -$16,609,000 -$17,287,000
All Other Casinos $0 $17,897,000 $18,601,000 $17,953,000 $18,665,000 $18,028,000 $18,747,000
Total Scenario 5 $0 $3,000 -$2,000 -$4,000 -$1,000 -$3,000 $1,000
Data Source: Wells Gaming Research, April 2008.

Kansas Casino Market Study & Gaming Revenue Projections
May 2008 Wells Gaming Research Page 3-28
Forecasted Flow of Funds
Exhibit 3-27 summarizes the gaming revenue flows for scenario 5. The data shows that
Kansas could produce $79 million in gaming revenues (refer to the first section captioned
Scenario 5 Revenues Coming From). However, only $36 million is likely to flow back to
Kansas (refer to the third section captioned Scenario 5 Mid - Revenues Going To). Even
though the forecasted losses to Kansas are substantial, the Scenario 5 results do represent an
estimated improvement of approximately $24 million over 2007. In general, revenue flows
for scenario 5 remain relatively proportional for the other states between 2007 and 2010.
Exhibit 3-27 Flow of Gaming Revenue Funds for Scenario 5
Illustrates Where the Gaming Revenues Originated & Where They Went
Scenario 5 Revenues Coming From
State 2007 % 2007 2008 2009 2010 % 2010 2011 2012 % 2010
AR $171,607,994 19.5% $176,210,374 $180,958,899 $185,844,546 20.0% $190,891,448 $196,093,017 21.1%
KS $71,888,705 8.2% $71,834,865 $78,858,604 $78,803,487 8.5% $78,750,400 $78,698,535 8.5%
MO $218,630,803 24.8% $221,308,664 $232,640,653 $235,468,603 25.4% $237,970,967 $240,500,783 25.9%
OK $418,175,692 47.5% $421,387,294 $424,642,871 $427,911,797 46.1% $431,229,530 $434,576,446 46.8%
Total $880,303,194 100.0% $890,741,197 $917,101,027 $928,028,433 100.0% $938,842,345 $949,868,781 102.4%
Scenario 5 Low - Revenues Going To
State 2007 % 2007 2008 2009 2010 % 2010 2011 2012 % 2010
IA $1,427,000 0.2% $1,417,000 $1,378,000 $1,395,000 0.2% $1,410,000 $1,425,000 0.2%
KS $11,943,000 1.4% $12,573,000 $27,874,000 $28,076,000 3.0% $28,263,000 $28,454,000 3.1%
MO $96,292,000 10.9% $96,200,000 $96,091,000 $97,241,000 10.5% $98,287,000 $99,347,000 10.7%
OK $770,640,000 87.5% $780,553,000 $791,759,000 $801,319,000 86.3% $810,881,000 $820,641,000 88.4%
Total $880,302,000 100.0% $890,743,000 $917,102,000 $928,031,000 100.0% $938,841,000 $949,867,000 102.4%
Scenario 5 Mid - Revenues Going To
State 2007 % 2007 2008 2009 2010 % 2010 2011 2012 % 2010
IA $1,427,000 0.2% $1,417,000 $1,353,000 $1,369,000 0.1% $1,384,000 $1,399,000 0.2%
KS $11,943,000 1.4% $12,573,000 $35,572,000 $35,832,000 3.9% $36,076,000 $36,322,000 3.9%
MO $96,292,000 10.9% $96,200,000 $94,671,000 $95,813,000 10.3% $96,850,000 $97,902,000 10.5%
OK $770,640,000 87.5% $780,553,000 $785,505,000 $795,015,000 85.7% $804,531,000 $814,246,000 87.7%
Total $880,302,000 100.0% $890,743,000 $917,101,000 $928,029,000 100.0% $938,841,000 $949,869,000 102.4%
Scenario 5 - High Revenues Going To
State 2007 % 2007 2008 2009 2010 % 2010 2011 2012 % 2010
IA $1,427,000 0.2% $1,417,000 $1,331,000 $1,347,000 0.1% $1,362,000 $1,377,000 0.1%
KS $11,943,000 1.4% $12,573,000 $42,072,000 $42,389,000 4.6% $42,682,000 $42,981,000 4.6%
MO $96,292,000 10.9% $96,200,000 $93,447,000 $94,579,000 10.2% $95,609,000 $96,654,000 10.4%
OK $770,640,000 87.5% $780,553,000 $780,249,000 $789,713,000 85.1% $799,187,000 $808,858,000 87.2%
Total $880,302,000 100.0% $890,743,000 $917,099,000 $928,028,000 100.0% $938,840,000 $949,870,000 102.4%
Data Source: Wells Gaming Research, April 2008.

Kansas Casino Market Study & Gaming Revenue Projections
May 2008 Wells Gaming Research Page 3-29
Scenario 6 – Camptown + Expansions + New Casinos
Scenario 6 includes scenario 3 and scenario 5, as well as the following other proposed
casinos:
Kansas
1. The Woodlands in Kansas City, KS (January 2009)
2. Cherokee County Planned in Baxter Springs, KS (January 2010)
3. Sumner County Planned in Wellington, KS (January 2010)
Missouri
1. Barden Development, Inc. planned in Branson, MO (planned for 2010)
Oklahoma
1. Downstream Casino Resort in Ottawa, OK (July 2008)
2. First Council Casino in Newkirk, OK (March 2008)
3. Ioway Casino Resort in Lincoln, OK (planned for 2910)
4. Muscogee Creek Nation planned in Eufaula, OK (planned for 2010)
5. Pawnee Nation Planned in Chilocco, OK (planned for 2010)
6. Ponca Tribe Oklahoma planned in Ponca City, OK (planned for 2010)
7. Poteau Travel and Smoke Shop in Poteau, OK (planned or 2010)
8. Seneca-Cayuga Tribes of Oklahoma planned in Grove, OK (July 2008)
9. Shawnee Tribe Oklahoma planned in Oklahoma City, OK
10. Wichita & Affiliated Tribes planned in Hinton, OK
11. Wilburton Travel and Smoke Shop in Wilburton, OK
12. Wild Rose Entertainment planned in Sugar Creek, MO (January 2010)
13. Wyandotte 7th Street Casino in Kansas City, KS (January 2008)
14. Wyandotte County planned in Kansas City, KS (January 2010)

Kansas Casino Market Study & Gaming Revenue Projections
May 2008 Wells Gaming Research Page 3-30
Revenue Projections
Exhibit 3-28 profiles the gaming revenue projections for scenario 6. The 2010 and 2012 mid
case projections show overall gaming revenue estimates of over $1.0 billion. This represents
an increase of approximately $120 million over the 2007 level of $880 million.
Exhibit 3-28 Scenario 6 Revenues Include Scenario 5 + the Other Proposed
Current Low Case Mid Case High Case
2007 2010 2012 2010 2012 2010 2012
*Camptown Greyhound Park $0 $11,626,000 $11,736,000 $17,768,000 $17,962,000 $22,917,000 $23,190,000
*Cherokee County Proposed $0 $47,701,000 $48,706,000 $46,957,000 $47,955,000 $46,380,000 $47,371,000
*Proposed Casinos w/i 50 Miles $0 $75,156,000 $77,131,000 $74,230,000 $76,194,000 $73,493,000 $75,446,000
*All Other Proposed Casinos $0 $125,461,600 $128,664,000 $124,552,300 $127,740,700 $123,740,100 $126,915,400
Oklahoma Tribal Casinos w/i 50 Miles $199,094,000 $127,902,000 $131,349,000 $126,520,000 $129,951,000 $125,418,000 $128,833,000
All Other Casinos $681,208,000 $633,930,000 $648,278,000 $631,745,000 $646,062,000 $629,830,000 $644,109,000
Total Scenario 6 $880,302,000 $1,021,776,600 $1,045,864,000 $1,021,772,300 $1,045,864,700 $1,021,778,100 $1,045,864,400
Data Source: Wells Gaming Research, April 2008.
Revenue Impacts
Exhibit 3-29 shows the casino gaming revenue impacts anticipated with the casino additions
included in scenario 6. Of the $1.0 billion in total gross gaming revenues projected for 2010,
the major distributions would go to the categories captioned all other proposed casinos
($124.6 million) and proposed casinos located within 50 miles ($74 million). Losses of $5.8
million to $5.9 million have been estimated for Camptown Greyhound Park for 2010 and
2012 in the mid case.
Exhibit 3-29 Scenario 6 Revenue Impacts Include Scenario 5 + Other Proposed
Current Low Case Mid Case High Case
2007 2010 2012 2010 2012 2010 2012
*Camptown Greyhound Park $0 -$3,959,000 -$4,000,000 -$5,808,000 -$5,879,000 -$7,414,000 -$7,511,000
*Cherokee County Proposed $0 $47,701,000 $48,706,000 $46,957,000 $47,955,000 $46,380,000 $47,371,000
*Proposed Casinos w/i 50 Miles $0 $75,156,000 $77,131,000 $74,230,000 $76,194,000 $73,493,000 $75,446,000
*All Other Proposed Casinos $0 $125,461,600 $128,664,000 $124,552,300 $127,740,700 $123,740,100 $126,915,400
Oklahoma Tribal Casinos w/i 50 Miles $0 -$59,103,000 -$60,429,000 -$57,014,000 -$58,312,000 -$55,275,000 -$56,549,000
All Other Casinos $0 -$91,511,000 -$94,075,000 -$89,174,000 -$91,703,000 -$87,174,000 -$89,678,000
Total Scenario 6 $0 $93,745,600 $95,997,000 $93,743,300 $95,995,700 $93,750,100 $95,994,400
Data Source: Wells Gaming Research, April 2008.

Kansas Casino Market Study & Gaming Revenue Projections
May 2008 Wells Gaming Research Page 3-31
Forecasted Flow Funds
Exhibit 3-30 profiles the flow of gaming revenues for scenario 6. Projections for 2010 show
that Kansas could produce $80 million in gaming revenues (refer to the first section
captioned Scenario 6 Revenues Coming From). An estimated $109.5 million could flow
backs in the 2010 mid case for a gain of approximately $30 million (refer to the third section
captioned Scenario 6 Mid - Revenues Going To). The $109.5 million in flow backs would be
approximately $98 million higher than the 2007 level of $12 million. Oklahoma has been
projected to generate $428 million in gaming revenues with flow backs of $773 million, a
positive difference of $345 million. Missouri has been forecasted to generate an estimated
$317 million in 2010 gaming revenues with flow backs limited to $138 million.
Exhibit 3-30 Flows of Gaming Revenue Funds for Scenario 6
Illustrates Where the Gaming Revenues Originated & Where They Went
Scenario 6 Revenues Coming From
State 2007 % 2007 2008 2009 2010 % 2010 2011 2012 % 2010
AR $171,607,994 19.5% $176,210,374 $180,958,899 $196,942,472 19.3% $202,113,354 $207,439,752 20.3%
KS $71,888,705 8.2% $73,069,960 $79,814,361 $80,258,196 7.9% $80,208,273 $80,159,359 7.8%
MO $218,630,803 24.8% $226,164,686 $235,119,161 $316,601,315 31.0% $320,093,085 $323,627,194 31.7%
OK $418,175,692 47.5% $421,447,526 $424,703,647 $427,973,116 41.9% $431,291,392 $434,638,878 42.5%
Total $880,303,194 100.0% $896,892,546 $920,596,068 $1,021,775,099 100.0% $1,033,706,104 $1,045,865,183 102.4%
Scenario 6 Low - Revenues Going To
State 2007 % 2007 2008 2009 2010 % 2010 2011 2012 % 2010
IA $1,427,000 0.2% $1,221,000 $1,167,000 $1,111,000 0.1% $1,123,000 $1,135,000 0.1%
KS $11,943,000 1.4% $13,207,000 $30,417,000 $104,531,000 10.2% $105,530,000 $106,547,000 10.4%
MO $96,292,000 10.9% $86,540,000 $84,020,000 $139,091,000 13.6% $140,850,000 $142,638,000 14.0%
OK $770,640,000 87.5% $795,926,000 $804,996,000 $777,043,600 76.0% $786,200,300 $795,544,000 77.9%
Total $880,302,000 100.0% $896,894,000 $920,600,000 $1,021,776,600 100.0% $1,033,703,300 $1,045,864,000 102.4%
Scenario 6 Mid - Revenues Going To
State 2007 % 2007 2008 2009 2010 % 2010 2011 2012 % 2010
IA $1,427,000 0.2% $1,221,000 $1,149,000 $1,098,000 0.1% $1,110,000 $1,123,000 0.1%
KS $11,943,000 1.4% $13,207,000 $36,838,000 $109,471,000 10.7% $110,507,000 $111,560,000 10.9%
MO $96,292,000 10.9% $86,540,000 $83,026,000 $138,047,000 13.5% $139,796,000 $141,578,000 13.9%
OK $770,640,000 87.5% $795,926,000 $799,585,000 $773,156,300 75.7% $782,294,000 $791,603,700 77.5%
Total $880,302,000 100.0% $896,894,000 $920,598,000 $1,021,772,300 100.0% $1,033,707,000 $1,045,864,700 102.4%
Scenario 6 High - Revenues Going To
State 2007 % 2007 2008 2009 2010 % 2010 2011 2012 % 2010
IA $1,427,000 0.2% $1,221,000 $1,135,000 $1,088,000 0.1% $1,100,000 $1,112,000 0.1%
KS $11,943,000 1.4% $13,207,000 $42,200,000 $113,650,000 11.1% $114,719,000 $115,806,000 11.3%
MO $96,292,000 10.9% $86,540,000 $82,158,000 $137,108,000 13.4% $138,852,000 $140,624,000 13.8%
OK $770,640,000 87.5% $795,926,000 $795,100,000 $769,932,100 75.4% $779,035,700 $788,322,400 77.2%
Total $880,302,000 100.0% $896,894,000 $920,593,000 $1,021,778,100 100.0% $1,033,706,700 $1,045,864,400 102.4%
Data Source: Wells Gaming Research, April 2008.

Kansas Casino Market Study & Gaming Revenue Projections
May 2008 Wells Gaming Research Page 3-32
Gaming Capacity with Casino Growth in the Southeast Trade Area
Exhibit 3-31 recaps the current capacity and shows the impacts of adding new casinos and
casino expansions. For ease of reference, the data has been categorized by state.
Exhibit 3-31 Casino Capacity Statistics with Growth
# of
Loc Casino# of
Slots
# of Pit
Tables
# of
Poker
Tables
# of
Total
Tables
# of
Bingo
Seats
Race
Book
Casino
S.F.
Con-
vention
S.F.
# of
Rooms
# of
Restau-
rants
Enter-
tain-
ment
Park-
ing
Current Capacity for Existing Casinos Current Capacity for Existing Casinos
Existing 53 Casinos 30,846 409 182 591 3,180 6 1,401,874 74,620 1,619 87 21 35,573
Casino Expansions in Oklahoma Casino Expansions in Oklahoma
1 Cherokee Casino- West Siloam Springs 486 10 0 10 0 0 10,000 20,000 140 1 1 0
2 Cherokee Nation Casino - Tulsa 1,788 34 0 34 0 0 0 0 0 0 0 0
3 Osage Million Dollar Elm - Ponca City 0 0 0 0 0 0 0 0 0 1 0 0
4 Sac & Fox Casino 500 0 0 0 0 0 0 0 0 0 0 0
Total Expansions 2,774 44 0 44 0 0 10,000 20,000 140 2 1 0
Kansas Proposed Casinos Missouri Proposed Casinos
1 Camptown Greyhound Park 600 0 0 0 0 1 0 0 0 2 0 700
2 Cherokee County Planned 1,200 40 0 40 0 0 10,000 250 3 2 2,500
3 Sumner County Planned 2,000 50 0 50 0 0 0 30,000 275 4 3 3,700
4 The Woodlands 800 0 0 0 0 1 0 0 0 4 0 700
5 Wyandotte County Planned 3,000 100 0 100 0 0 100,000 500 6 5 7,000
Total Kansas Proposed Casinos 7,600 190 0 190 0 2 0 140,000 1,025 19 10 14,600
Oklahoma Proposed Casinos
1 Downstream Casino Resort 2,000 30 15 45 0 0 70,000 10,000 240 2 0 2,700
2 First Council Casino 900 8 8 16 0 0 40,000 0 0 2 1 950
3 Ioway Casino Resort 1,500 50 0 50 0 0 0 0 250 3 2 2,500
4 Muscogee Creek Nation 400 6 0 6 0 0 0 0 0 1 0 400
5 Pawnee Nation Chilocco 1,200 24 0 24 0 0 0 0 150 3 1 1,500
6 Ponca Tribe Oklahoma Planned 500 10 0 10 0 0 50,000 20,000 100 2 0 1,200
7 Poteau Travel & Smoke Shop 20 0 0 0 0 0 0 0 0 0 0 12
8 Seneca-Cayuga Tribes of Oklahoma 1,200 18 0 18 0 0 100,000 0 125 3 1 1,800
9 Wilburton Travel & Smoke Shop 20 0 0 0 0 0 0 0 0 0 12
Total Oklahoma Proposed Casinos 7,740 146 23 169 0 0 260,000 30,000 865 16 5 11,074
Missouri Proposed Casinos
1 Barden Development 1,300 41 0 41 0 0 57,000 0 0 2 0 1,200
2 Wild Rose Entertainment - Sugar Creek 1,200 30 0 30 0 0 40,000 12,000 200 3 2 2,200
Total Missouri Proposed Casinos 2,500 71 0 71 0 0 97,000 12,000 200 5 2 3,400
Grand Total 51,460 860 205 1,065 3,180 8 1,768,874 276,620 3,849 129 39 64,647
Percent Increase Over Current 67% 110% 13% 80% 0% 33% 26% 271% 138% 48% 86% 82%
Data Source: Wells Gaming Research, April 2008.
The bottom line of Exhibit 3-31 shows that slot machines would increase by 67%, pit table
games by 110%, poker tables by 13%, number of total tables by 80%, race books by 33%,
casino square footage by 26%, convention/meeting space by 271%, the number of hotel
rooms by 138%, the number of restaurants by 48%, entertainment venues by 86%, and
parking capacity by 82%.

Kansas Casino Market Study & Gaming Revenue Projections
Wells Gaming Research
May 2008
Section 4

Kansas Casino Market Study & Gaming Revenue Projections
May 2008 Wells Gaming Research Page 4-1
Summary of the Trade Area
for the South Central Gaming Zone
Highlights of the market for the south central trade area follow (refer to pages 4-6 though 4-
22 for the corresponding detailed analyses and discussions).
Trade Area
The south central trade area covers portions of Kansas and Oklahoma located within the
approximate 100-mile radius surrounding Wellington, Kansas. The boundaries extend to
Saline and Dickinson Counties, Kansas on the North; Logan and Lincoln Counties,
Oklahoma on the South; Kiowa and Comanche Counties, Kansas on the West; and Labette
County, Kansas on the East (refer to the map on page 4-2).
Demographic Statistics
The population and median household income statistics included in this report section are
limited to those counties located in the south central trade area and do not include the entire
states of Kansas and Oklahoma.
Exhibit 4-1 shows that the south central trade area includes 53 counties (34 in Kansas and 19
in Oklahoma). In 2007, these counties had a total adult population of approximately 1.5
million. The corresponding median Household Income (MHI) was approximately $50
thousand in Kansas and $47 thousand in Oklahoma.
Exhibit 4-1 Adult Population & Median Household Income (MHI)
2007 2007 2012 ACGR
State
# of
Counties
Adult
Population MHI
Adult
Population MHI
Adult
Population
07 to 12
MHI
07 to 12
KS 34 729,120 $50,429 737,115 $58,998 0.22% 3.2%
OK 19 820,137 $47,237 847,642 $54,561 0.66% 2.9%
Total 53 1,549,257 N/A 1,584,757 N/A 0.45% N/A
Data Sources: Bureau of Business & Economics Research, UNR Reno & Wells Gaming Research, May 2008.
The adult population forecasts include a minor increase of approximately 35 thousand
between 2007 and 2012, up from 1.5 million to 1.6 million. The corresponding average
compound growth rate for the adult population would be 0.45% between 2007 and 2012.
The median household income levels for 2012 have been forecasted at approximately $59
thousand for Kansas and $55 thousand for Oklahoma. This reflects average compound
growth rates between 2007 and 2012 of 3.2% for Kansas and 2.9% for Oklahoma.

Copyright © and (P) 1988–2006 Microsoft Corporation and/or its suppliers. All rights reserved. http://www.microsoft.com/mappoint/Portions © 1990–2005 InstallShield Software Corporation. All rights reserved. Certain mapping and direction data © 2005 NAVTEQ. All rights reserved. The Data for areas of Canada includes information taken with permission from Canadian authorities, including: © Her Majesty the Queen in Right of Canada, © Queen's Printer for Ontario. NAVTEQ and NAVTEQ ON BOARD are trademarks of NAVTEQ. © 2005 Tele Atlas North America, Inc. All rights reserved. Tele Atlas and Tele Atlas North America are trademarks of Tele Atlas, Inc.
South Central Kansas Zone
0 mi 50 100 150

Kansas Casino Market Study & Gaming Revenue Projections
May 2008 Wells Gaming Research Page 4-3
Primary Market
The primary market for the south central trade area of Kansas is made up of 10 counties
surrounding the proposed casino site in Sumner County. Exhibit 4-2 shows adult population
of approximately 500 thousand for the primary market in 2007. The 10 counties combined
have been projected to have an average compound growth rate of 0.5% between 2007 and
2012. One-third of the south central zone trade area adult population lives within these ten
counties and within 50 miles or less from the assumed generic casino site.
The total adult population has been forecasted at slightly over 1.5 million for 2012 reflecting
an average compound growth rate of 0.1% (refer to Exhibit 4-7, page 4-8 for a detailed year
by year population statistic from 2006 through 2012).
Exhibit 4-2 Adult Population for the Primary Market
# of
Counties List of Counties 2007 2012
ACGR
07 to 12 % 2012
Butler KS 46,781 52,348 2.3% 3%
Cowley KS 24,502 23,838 -0.5% 2%
Harper KS 4,259 4,025 -1.1% 0%
Harvey KS 23,641 24,185 0.5% 2%
Kingman KS 5,848 5,811 -0.1% 0%
Reno KS 42,425 40,200 -1.1% 3%
Sedgwick KS 321,246 329,963 0.5% 22%
Sumner KS 17,169 16,964 -0.2% 1%
Grant OK 3,637 3,637 0.0% 0%
Kay OK 10,546 10,675 0.2% 1%
10 Total Surrounding Counties 500,054 511,646 0.5% 34%
26
Total Kansas Counties - Excluding
Surrounding Counties 243,249 239,781 -0.3% 16%
17
Total Oklahoma Counties - Excluding
Surrounding Counties 768,657 768,657 0.0% 51%
53 Total Trade Area Population 1,511,960 1,520,084 0.1% 100%
Data Sources: Bureau of Business & Economics Research, UNR Reno & Wells Gaming Research, May 2008.

Kansas Casino Market Study & Gaming Revenue Projections
May 2008 Wells Gaming Research Page 4-4
Capacity Statistics & Competition
Exhibit 4-3 shows the existing casino capacity and illustrates the increases that are
anticipated for the south central trade area. The current capacity includes 54 gaming
locations equipped with 28,532 slot machines, 467 table games (pit and poker) and 1.3
million square feet of casino space. Other amenities include 57 thousand square feet of
convention space, 741 hotel rooms, 79 restaurants, 15 entertainment venues, and 39,912
thousand parking spaces.
Capacity increases include the expansions at the Sac & Fox Casino in Kansas, and the five
casino expansions in Oklahoma. Also included are the 12 new casinos (four in Kansas and
eight in Oklahoma).
Exhibit 4-3 Capacity Statistics with Proposed Casino Growth
Existing Expansions New (Proposed) Casinos Total % Change
Capacity Casinos KS OK KS OK Capacity Above Existing
# of Loc 54 1 5 4 8 72 33%
# of Slots 28,532 500 3,681 4600 9,650 46,963 65%
# of Tables 467 0 75 110 243 895 92%
Casino S.F. 1,318,784 0 252,000 0 260,000 1,830,784 39%
Convention S.F. 57,350 0 20,000 45,000 30,000 152,350 166%
# of Rooms 741 0 140 625 1,265 2,771 274%
# of Restaurants 79 0 6 12 19 116 47%
Entertainment 15 0 3 8 11 37 147%
Parking 39,912 0 0 8,600 15,800 64,312 61%
Data Source: Wells Gaming Research, May 2008.
The combined impact of the proposed expansions at six casinos and the addition of 12 new
casinos will result in substantial increases in casino capacity in the south central trade area.
Notable capacity changes shown in Exhibit 4-3 include a 33% increase in the number of
gaming locations (up from 54 to 72), a 65% increase in the number of slot machines (up from
29 thousand to 47 thousand), and a 92% increase in the number of table games (up from 467
to 895). In addition, the number of hotel rooms are forecasted to increase by 274% (up from
741 to 2,771), the number of restaurant are estimated to increase by 47% (up from 79 to 116),
the number of entertainment venues have been projected to increase by 147% (up from 15 to
37), and parking capacity should increase by 61% (up from 39,912 spaces to 64,312).

Kansas Casino Market Study & Gaming Revenue Projections
May 2008 Wells Gaming Research Page 4-5
Gaming Revenues
Exhibit 4-4 shows the revenue flows that correspond to the current status (2007), as well as
to the 2012 projections for scenarios 1 through 3. The scenarios were developed to analyze
the impact of the expansions and new casinos. Exhibit 4-4 shows, by state, where the
revenues came from and where they went. The current status indicates that Kansas suffered a
net loss of $224 million in 2007. Of this amount, $1 million went to Iowa, $42 million to
Missouri, and $181 million to Oklahoma.
The key assumption of scenario 1 is the addition of Sumner County near the I-35 exit at
Wellington. No other new or expanded casinos have been assumed. With Sumner County
added in, the net loss for Kansas has been forecasted to decline from $224 million (2007) to
$153 million for scenario 1 in 2012. Out of the $153 million, $1 million has been forecasted
to go to Iowa, $34 million to Missouri, and $118 million to Oklahoma.
Exhibit 4-4 Summary of the 2012 Flow of Gaming Revenues(Dollars in Millions)
Current Status 2007 Scenario-1 2012 Scenario-2 2012 Scenario-3 2012
State
Coming
From
Going
To Dif
Coming
From
Going
To Dif
Coming
From
Going
To Dif
Coming
From
Going
To Dif
IA $0 $1 $1 $0 $1 $1 $0 $1 $1 $0 $1 $1
KS $242 $18 -$224 $294 $141 -$153 $294 $137 -$157 $299 $128 -$171
MO $0 $42 $42 $0 $34 $34 $0 $32 $32 $0 $28 $28
OK $424 $605 $181 $438 $556 $118 $438 $562 $124 $438 $580 $142
Total $666 $666 $0 $732 $732 $0 $732 $732 $0 $737 $737 $0
Data Source: Wells Gaming Research, May 2008.
Scenario 2 includes all existing casinos competing in the south central trade area, Sumner
County, plus six expansions. Five of these expansions are in Oklahoma (refer to page 4-16
for a list) and one is in Kansas (the Sac & Fox Casino). The Oklahoma expansions have
been projected to substantially overshadow the impact of the expansion at the Sac & Fox
Casino. As a result, the net loss for Kansas has been projected to be $157 million, $4 million
higher than the $153 million loss projected in scenario-1. In contrast, Oklahoma’s net gain is
expected to go up to $124 million, $6 million above the $118 million projected in scenario 1.
Scenario 3 includes all of the casino additions and expansions incorporated into scenarios 1
and 2, plus six new casinos proposed for Kansas, two for Missouri, and 11 for Oklahoma
(refer to page 4-19 for a list by state). With all of the projected growth in new casinos, the
net loss for Kansas has been projected to increase to $171 million in scenario 3, an increase
of $14 million in losses over scenario 2. Even so, the scenario 3 losses of $171 million are
$53 million less than the $224 million loss sustained in 2007. On the other hand,
Oklahoma’s net gain has been projected to increase to $18 million in scenario 3 by absorbing
$14 million from Kansas and another $4 million from Missouri.

Kansas Casino Market Study & Gaming Revenue Projections
May 2008 Wells Gaming Research Page 4-6
Detailed Analysis of the Trade Area
for the South Central Gaming Zone
Population statistics were one of the key variables used in the gross gaming revenue (GGR)
projections developed for the south central gravity model. WGR compiled statistics for the
total population, and for the adult population segment located within the 100-mile trade area
surrounding Sumner County. Because of the age restrictions on casino gaming, only the
adult population statistics were used in the Wells Gaming Research’s gravity model to
project gaming revenues.
Total & Adult Population Statistics
The total population for the south central trade area was 2.2 million in 2007, with 1.5 million
adults (69% of the total). This market included a total population of approximately 1.0
million in Kansas and 1.1 million in Oklahoma.
Exhibit 4-5 Total & Adult Population Statistics
2000 Total & Adult 2007 Total & Adult 2012 Total & Adult
ST
# of
CO Total Adult
Adult as a
% of Total
Adult %
of Adult
Total Total Adult
Adult as a
% of Total
Adult %
of Adult
Total Total Adult
Adult as a
% of Total
Adult %
of Adult
Total
KS 34 1,043,904 718,267 68.8% 47.9% 1,060,641 729,120 68.7% 47.1% 1,072,849 737,115 68.7% 46.5%
OK 19 1,127,204 782,730 69.4% 52.1% 1,181,390 820,137 69.4% 52.9% 1,221,225 847,642 69.4% 53.5%
TOT 53 2,171,108 1,500,997 69.1% 100.0% 2,242,031 1,549,257 69.1% 100.0% 2,294,074 1,584,757 69.1% 100.0%
Data Source: Wells Gaming Research, May 2008.
The adult population in the south central trade area has been projected to increase from 1.5
million in 2007 to 1.6 million by the year 2012, with 737 thousand adults (46.5%) living in
Kansas and 848 thousand (53.5%) in Oklahoma.
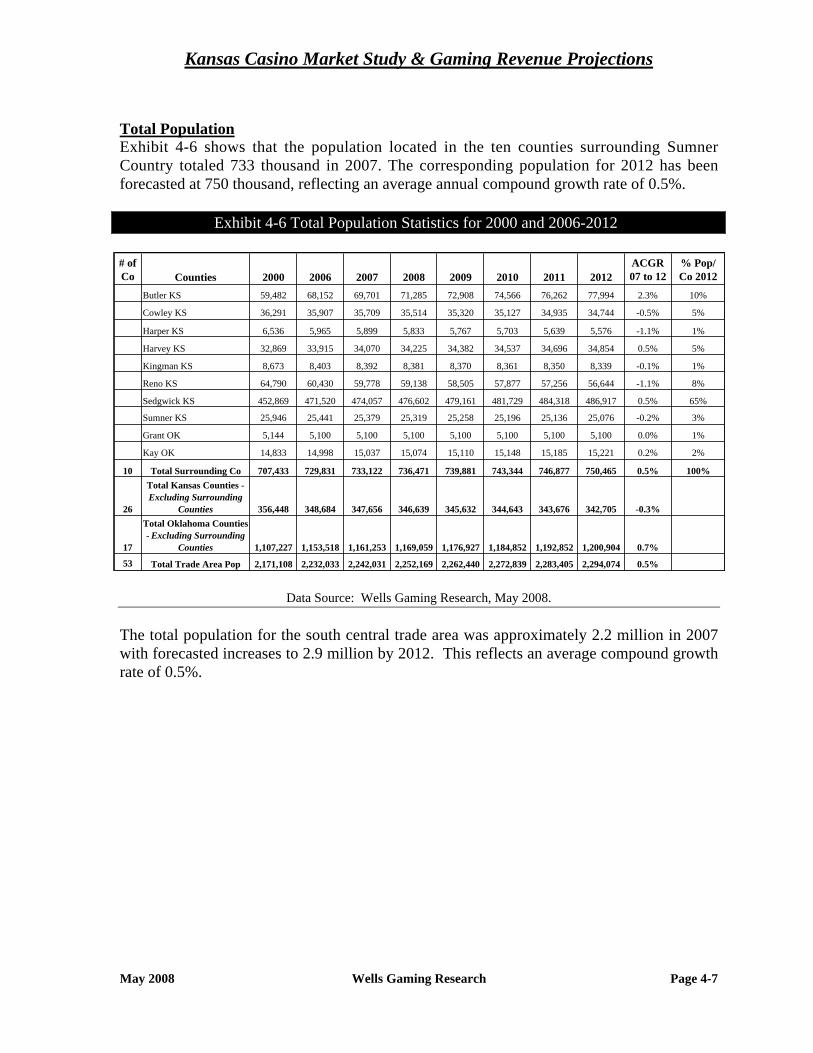
Kansas Casino Market Study & Gaming Revenue Projections
May 2008 Wells Gaming Research Page 4-7
Total Population
Exhibit 4-6 shows that the population located in the ten counties surrounding Sumner
Country totaled 733 thousand in 2007. The corresponding population for 2012 has been
forecasted at 750 thousand, reflecting an average annual compound growth rate of 0.5%.
Exhibit 4-6 Total Population Statistics for 2000 and 2006-2012
# of
Co Counties 2000 2006 2007 2008 2009 2010 2011 2012
ACGR
07 to 12
% Pop/
Co 2012
Butler KS 59,482 68,152 69,701 71,285 72,908 74,566 76,262 77,994 2.3% 10%
Cowley KS 36,291 35,907 35,709 35,514 35,320 35,127 34,935 34,744 -0.5% 5%
Harper KS 6,536 5,965 5,899 5,833 5,767 5,703 5,639 5,576 -1.1% 1%
Harvey KS 32,869 33,915 34,070 34,225 34,382 34,537 34,696 34,854 0.5% 5%
Kingman KS 8,673 8,403 8,392 8,381 8,370 8,361 8,350 8,339 -0.1% 1%
Reno KS 64,790 60,430 59,778 59,138 58,505 57,877 57,256 56,644 -1.1% 8%
Sedgwick KS 452,869 471,520 474,057 476,602 479,161 481,729 484,318 486,917 0.5% 65%
Sumner KS 25,946 25,441 25,379 25,319 25,258 25,196 25,136 25,076 -0.2% 3%
Grant OK 5,144 5,100 5,100 5,100 5,100 5,100 5,100 5,100 0.0% 1%
Kay OK 14,833 14,998 15,037 15,074 15,110 15,148 15,185 15,221 0.2% 2%
10 Total Surrounding Co 707,433 729,831 733,122 736,471 739,881 743,344 746,877 750,465 0.5% 100%
26
Total Kansas Counties -
Excluding Surrounding
Counties 356,448 348,684 347,656 346,639 345,632 344,643 343,676 342,705 -0.3%
17
Total Oklahoma Counties
- Excluding Surrounding
Counties 1,107,227 1,153,518 1,161,253 1,169,059 1,176,927 1,184,852 1,192,852 1,200,904 0.7%
53 Total Trade Area Pop 2,171,108 2,232,033 2,242,031 2,252,169 2,262,440 2,272,839 2,283,405 2,294,074 0.5%
Data Source: Wells Gaming Research, May 2008.
The total population for the south central trade area was approximately 2.2 million in 2007
with forecasted increases to 2.9 million by 2012. This reflects an average compound growth
rate of 0.5%.

Kansas Casino Market Study & Gaming Revenue Projections
May 2008 Wells Gaming Research Page 4-8
Adult Population
The adult population for the ten contiguous counties was 500,054 in 2007. Projections
indicate that the adult population could reach 511,646 by 2012, thereby reflecting an average
compound growth rate of 0.5% per year. The total adult population for the south central
trade area was 1.51 million in 2007. With an average compound growth rate of 0.1%, the
2012 adult population would be 1.52 million.
Exhibit 4-7Adult Population Statistics for 2000 and 2006 to 2012
# of
Co Counties 2000 2006 2007 2008 2009 2010 2011 2012
ACGR
07 to 12
% Pop/
Co 2012
Butler KS 39,923 45,743 46,781 47,844 48,936 50,048 51,185 52,348 2.3% 10%
Cowley KS 24,901 24,638 24,502 24,370 24,236 24,104 23,971 23,838 -0.5% 5%
Harper KS 4,719 4,307 4,259 4,211 4,164 4,118 4,071 4,025 -1.1% 1%
Harvey KS 22,808 23,534 23,641 23,749 23,858 23,965 24,076 24,185 0.5% 5%
Kingman KS 6,044 5,855 5,848 5,841 5,834 5,826 5,818 5,811 -0.1% 1%
Reno KS 45,980 42,885 42,425 41,970 41,519 41,074 40,634 40,200 -1.1% 8%
Sedgwick KS 306,890 319,528 321,246 322,973 324,706 326,445 328,201 329,963 0.5% 64%
Sumner KS 17,554 17,213 17,169 17,129 17,088 17,047 17,006 16,964 -0.2% 3%
Grant OK 3,669 3,637 3,637 3,637 3,637 3,637 3,637 3,637 0.0% 1%
Kay OK 10,404 10,520 10,546 10,574 10,598 10,625 10,651 10,675 0.2% 2%
10 Total Surrounding Counties 482,892 497,860 500,054 502,298 504,576 506,889 509,250 511,646 0.5% 100%
26
Total Kansas Counties -
Excluding Surrounding
Counties 249,448 243,966 243,249 242,533 241,828 241,138 240,465 239,781 -0.3%
17
Total Oklahoma Counties -
Excluding Surrounding
Counties 768,657 768,657 768,657 768,657 768,657 768,657 768,657 768,657 0.0%
53 Total Trade Area Population 1,500,997 1,510,483 1,511,960 1,513,488 1,515,061 1,516,684 1,518,372 1,520,084 0.1%
Data Source: Wells Gaming Research, May 2008.
Average Median Household Income
The average median household income statistics for 2007 show $50 thousand and $47
thousand, respectively, for counties located in Kansas and Oklahoma that fall within the
south central trade area. Based on an average compound growth rate of 3.2%, Kansas would
have an average median household income of $59 thousand in 2012. With an average
compound growth rate of 2.9%, Oklahoma would have an average median household income
of $55 thousand.
Exhibit 4-8 Average Median Household Income Statistics for 2000 and 2006 to 2012
# of
Co State 2000 2006 2007 2008 2009 2010 2011 2012
ACGR
07 to 12
34 KS $40,552 $48,880 $50,429 $52,031 $53,687 $55,398 $57,168 $58,998 3.2%
19 OK $38,736 $45,906 $47,237 $48,610 $50,028 $51,491 $53,002 $54,561 2.9%
Data Source: Wells Gaming Research, May 2008.

Kansas Casino Market Study & Gaming Revenue Projections
May 2008 Wells Gaming Research Page 4-9
Status Quo
for the South Central Trade Area
Gaming Revenues
The status quo assumes that there will not be any new casinos or casino expansions. The
status quo (2007) gaming revenues totaled approximately $666 million for the south central
trade area. Over $82 million of the total was generated by Oklahoma Tribal casinos located
within 50 miles. Without any casino expansions or additions in the south central trade area,
gaming revenues could increase to approximately $684 million by 2012, for a 2.7% change
over 2007.
Exhibit 4-9 2007 to 2012 Status Quo Revenues for the South Central Zone
Revenue 2007 2008 2009 2010 2011 2012
Oklahoma Tribal Casinos w/i 50 Miles $82,203,000 $82,497,000 $82,790,000 $83,090,000 $83,395,000 $83,702,000
All Other Casinos $583,803,000 $587,038,100 $590,322,200 $593,636,300 $596,995,400 $600,378,500
Total $666,006,000 $669,535,100 $673,112,200 $676,726,300 $680,390,400 $684,080,500
Data Source: Wells Gaming Research, May 2008.
Visitors
The status quo (2007) casino visitors totaled approximately 10.4 million. Absent any casino
expansions or additions, casino visitor counts could increase to approximately 10.7 million
by 2012, a 2.9% change over 2007.
Exhibit 4-10 2007 to 2012 Status Quo Visitors for the South Central Zone
Visitors 2007 2008 2009 2010 2011 2012
Oklahoma Tribal Casinos w/i 50 Miles 1,184,502 1,188,497 1,192,510 1,196,630 1,200,776 1,204,953
All Other Casinos 9,215,264 9,269,027 9,323,456 9,378,336 9,433,911 9,489,892
Total 10,399,766 10,457,524 10,515,966 10,574,966 10,634,687 10,694,845
Data Source: Wells Gaming Research, May 2008.

Kansas Casino Market Study & Gaming Revenue Projections
May 2008 Wells Gaming Research Page 4-10
Estimates of Casino Revenue Flows
The status quo for casino revenue shows what could be expected if no new casino
development occurred in the south central trade area. In 2007, an estimated $666 million
was generated in total gaming revenues. Of the $666 million, an estimated $242 million
(36%) was generated in Kansas and $424 million (64%) in Oklahoma. However, the vast
majority of the $666 million, approximately $605 million (91%), flowed back to Oklahoma
leaving $1.3 million (0.2%) for Iowa, $17.9 million (3%) for Kansas, $42.3 million (6%) for
Missouri.
Exhibit 4-11 Status Quo Flow of Gaming Revenue Funds
for the Southeast Trade Area for 2007 to 2012
Current Scenario Revenues Coming From
State 2007 2008 2009 2010 2011 2012
KS $242,053,193 $242,771,774 $243,508,022 $244,259,946 $245,031,932 $245,814,353
OK $423,949,380 $426,764,405 $429,605,224 $432,467,142 $435,357,292 $438,265,147
Total $666,002,573 $669,536,179 $673,113,246 $676,727,088 $680,389,224 $684,079,500
Current Scenarios Revenues Going To
State 2007 2008 2009 2010 2011 2012
IA $1,278,000 $1,282,000 $1,287,000 $1,292,000 $1,297,000 $1,302,000
KS $17,915,000 $17,978,000 $18,041,000 $18,106,000 $18,173,000 $18,240,000
MO $42,293,000 $42,439,000 $42,590,000 $42,744,000 $42,900,000 $43,058,000
OK $604,520,000 $607,836,100 $611,194,200 $614,584,300 $618,020,400 $621,480,500
Total $666,006,000 $669,535,100 $673,112,200 $676,726,300 $680,390,400 $684,080,500
Data Source: Wells Gaming Research, May 2008.
Total gaming revenues for the south central trade area have been projected to increase to
$677 million by 2010 and to $684 million by 2012, an approximate increase of $18 million
between 2007 and 2012. The projected allocations for 2010 and 2012 relative to 2007 show
that the distribution could be expected to remain fairly constant.

Kansas Casino Market Study & Gaming Revenue Projections
May 2008 Wells Gaming Research Page 4-11
Current Casino Gaming Capacity
For the South Central Trade Area
A compilation of the current casino gaming capacity located within approximately 150 miles
of the casino site in the south central zone is shown in Exhibit 4-12. The results indicate that
54 casinos are currently in operation. All are located in Oklahoma.
Exhibit 4-12 Status Quo Casino Capacity Statistics
# of
Loc Casino# of
Slots
# of Pit
Tables
# of
Poker
Tables
# of
Total
Tables
# of
Bingo
Seats
Race
Book Casino S.F.
Con-
vention
S.F.
# of
Rooms
# of
Restau-
rants
Enter-
tain-
ment
Park-
ing
Oklahoma:
1 7 Clans Paradise Casino 700 8 6 14 0 0 30,000 0 0 2 0 500
2 Blue Star Gaming and Casino 228 0 0 0 300 0 20,000 0 0 1 0 500
3 Bordertown Bingo & Casino 886 11 10 21 650 1 73,000 0 0 2 0 400
4 Buffalo Run Casino 1,300 20 9 29 0 0 70,000 10,000 0 3 1 1,300
5 Catoosa Smoke Shop 75 0 0 0 0 0 1,728 0 0 0 0 42
6 Cherokee Casino - Fort Gibson 295 0 0 0 0 0 7,430 0 0 0 0 182
7 Cherokee Casino - Will Rogers Downs 250 0 0 0 0 1 18,277 11,000 450 1 1 150
8 Cherokee Casino Resort 1,522 37 35 72 0 0 95,000 7,500 263 8 3 3,100
9 Cimarron Bingo Casino 363 0 0 0 0 1 9,600 0 0 1 0 400
10 Creek Nation Casino Muscogee 584 7 10 17 300 0 30,000 0 0 1 1 800
11 Creek Nation Casino Okemah 132 0 3 3 110 0 1,800 0 0 0 0 200
12 Creek Nation Casino Okmulgee 334 2 3 5 0 0 11,000 0 0 1 0 600
13 Creek Nation Casino Tulsa 1,512 0 11 11 0 0 38,000 0 0 1 0 2,000
14 Creek Nation Travel Plaza 43 0 0 0 0 0 920 0 0 1 0 50
15 Duck Creek Casino 268 0 0 0 120 0 5,000 0 0 1 0 300
16 Eastern Shawnee Travel Plaza 186 0 0 0 0 0 3,000 0 0 0 0 150
17 Feather Warrior Casino 89 0 0 0 0 0 2,200 0 0 0 0 59
18 FireLake Casino 800 7 2 9 500 0 50,000 5,000 0 3 0 800
19 FireLake Grand Casino 1,800 23 19 42 0 0 125,000 0 0 5 2 4,000
20 Golden Pony Casino 400 0 0 0 0 0 10,000 0 0 1 0 500
21 Goldsby Gaming Center 182 0 0 0 300 1 15,462 0 0 1 0 300
22 Grand Lake Casino 879 10 6 16 0 0 45,000 0 0 1 1 1,000
23 High Winds Casino 500 8 0 8 0 0 35,000 0 0 2 0 450
24 Kaw Southwind Casino 1,078 3 4 7 700 0 55,000 0 0 2 0 1,000
25 Kickapoo Casino 525 9 0 9 0 0 12,000 0 0 1 0 600
26 Kickapoo Conoco Station 52 0 0 0 0 0 900 0 0 0 0 30
27 Lucky Star Casino - Clinton 423 5 4 9 0 0 13,000 0 0 1 0 400
28 Lucky Star Casino - Concho 930 13 11 24 0 0 40,000 0 0 1 0 1,000
29 Lucky Turtle Casino 101 0 0 0 0 0 3,000 0 0 1 0 200
30 Miami Tribe Entertainment 107 0 0 0 0 0 0 0 0 0 0 75
31 Muscogee Travel Plaza 129 0 0 0 0 0 3,000 0 0 0 0 50
32 Mystic Winds Casino 354 0 0 0 0 0 0 0 0 0 0 50
33 Native Lights Casino 612 6 0 6 0 0 22,500 0 0 2 0 405
34 Newcastle Gaming Center I 1,199 0 0 0 0 0 10,452 0 0 1 0 900
35 Newcastle Gaming Center II 0 14 14 28 0 0 10,521 0 0 0 0 150
36 Osage Million Dollar Elm Casino - Bartlesville 575 6 6 12 0 0 42,000 0 0 0 0 700

Kansas Casino Market Study & Gaming Revenue Projections
May 2008 Wells Gaming Research Page 4-12
Exhibit 4-12 Status Quo Casino Capacity Statistics (Continued)
# of
Loc Casino# of
Slots
# of Pit
Tables
# of
Poker
Tables
# of
Total
Tables
# of
Bingo
Seats
Race
Book
Casino
S.F.
Con-
vention
S.F.
# of
Rooms
# of
Restau-
rants
Enter-
tain-
ment
Park-
ing
Oklahoma:
37 Osage Million Dollar Elm Casino - Hominy 273 1 2 3 0 0 0 0 0 1 0 250
38 Osage Million Dollar Elm Casino - Pawhuska 135 0 0 0 0 0 0 0 0 1 0 50
39 Osage Million Dollar Elm Casino - Ponca City 222 0 0 0 0 0 7,700 0 0 0 0 150
40 Osage Million Dollar Elm Casino - Sand Springs 601 4 0 4 0 0 25,000 0 0 1 0 500
41 Osage Million Dollar Elm Casino - Skiatook 152 0 0 0 0 0 0 0 28 1 0 200
42 Osage Million Dollar Elm Casino - Tulsa 1,267 10 7 17 600 0 47,000 1,600 0 3 1 800
43 Pawnee Trading Post 130 0 0 0 0 0 3,500 0 0 2 0 250
44 Peoria Gaming Center 200 0 0 0 0 0 4,200 0 0 1 0 250
45 Quapaw Casino 483 8 1 9 0 0 27,000 0 0 1 1 700
46 Remington Park 650 0 0 0 0 1 55,000 0 0 3 0 6,700
47 Riverwind Casino 2,317 32 21 53 0 1 76,308 14,000 0 10 3 4,000
48 Sac and Fox Casino - Shawnee 466 5 5 10 0 0 8,600 0 0 1 0 550
49 Sac and Fox Casino - Stroud 49 0 0 0 0 0 825 0 0 0 0 34
50 Seminole Nation Trading Post 200 0 0 0 0 0 3,424 0 0 0 0 125
51 The Stables Casino 500 4 0 4 0 1 25,000 0 0 2 0 260
52 Thunderbird Casino 600 6 2 8 0 1 61,000 8,250 0 3 1 600
53 Tonkawa Casino 374 4 0 4 0 0 14,437 0 0 1 0 400
54 Wyandotte Nation Casino 500 8 5 13 0 0 50,000 0 0 3 0 750
54 Total Existing Casinos 28,532 271 196 467 3,580 8 1,318,784 57,350 741 79 15 39,912
Data Source: Wells Gaming Research, May 2008.
The foregoing data shows that there are currently a total of 54 casinos located in the south
central trade area All are located in Oklahoma. Combined capacities for the 54 casinos
include 28,532 slot machines, 271 pit table games, and 196 poker tables (467 total table
games), 3,580 bingo seats, 8 race books, and 1.3 million square feet of gaming space. Other
amenities include over 57 thousand square feet of convention/meeting space, 741 hotel
rooms, 79 restaurants, 15 entertainment venues, and approximately 40 thousand parking
spaces.

Kansas Casino Market Study & Gaming Revenue Projections
May 2008 Wells Gaming Research Page 4-13
Analyses of the Gaming Revenue Scenarios
Scenario 1
Assumptions
Scenario 1 includes the existing casinos, as well as the generic casino proposed for Sumner
County. The mid case scenario for the proposed new Sumner County casino includes
projected gaming capacity of 2,000 slot machines and 50 table games. Other amenities
include 30,000 square feet of convention/meeting space, 275 hotel rooms, four restaurants,
and three entertainment venues (two small and one large). The location assumed for this
generic casino was near the I-35 exit at Wellington.
Revenue Projections for Scenario 1
Exhibit 4-13 shows the current gaming revenues (2007) for the south central trade area,
together with projections for WGR’s low, mid, and high case forecasts for scenario 1. Total
gaming revenues have been forecasted at $666 million for 2007. With Sumner County added
in, total gaming revenues in the mid case could increase to $724 million for 2010, and again to
$732 million for 2012. It should be noted that the same size casino located near the I-35 exit
at Mulvane would generate more revenue due to proximity to the more heavily populated
Wichita area.
WGR’s projected allocations include $126 million for 2010 and $127 million for 2012 for the
category captioned Summer County Proposed. Projections for the category Oklahoma casinoslocated within 50 miles of the proposed casino site are approximately $61 million in both
2010 and 2012. Projected allocations for all other casinos located in the south central trade
area are forecasted to generate approximately $538 million in 2010 increasing to $544 million
in 2012.
Exhibit 4-13 Scenario 1 Gaming Revenues
Includes Existing Casinos + Sumner County Proposed for 2008
Current Low Case Mid Case High Case
2007 2010 2012 2010 2012 2010 2012
*Sumner County Proposed $0 $84,285,000 $85,053,000 $125,566,000 $126,721,000 $152,419,000 $153,813,000
Oklahoma Tribal Casinos w/in 50 Miles $82,203,000 $70,919,000 $71,430,000 $60,809,000 $61,231,000 $54,436,000 $54,807,000
All Other Casinos $583,803,000 $568,981,500 $575,311,700 $537,810,200 $543,840,400 $517,326,800 $523,176,900
Total Scenario 1 $666,006,000 $724,185,500 $731,794,700 $724,185,200 $731,792,400 $724,181,800 $731,796,900
Data Source: Wells Gaming Research, May 2008.

Kansas Casino Market Study & Gaming Revenue Projections
May 2008 Wells Gaming Research Page 4-14
Revenue Impacts
The category captioned Sumner County Proposed has projected gaming revenue allocations
for 2010 of $126 million, increasing to $127 million by 2012. Projected decreases include
$22 million for Oklahoma Tribes located within 50 miles, and a $55.8 million decrease in
gaming revenues currently flowing to all other casinos located in the south central trade area.
Exhibit 4-14 Scenario 1 Revenue Impacts Includes the Existing Casinos
+ Sumner County Proposed for 2008
Current Low Case Mid Case High Case
2007 2010 2012 2010 2012 2010 2012
*Sumner County Proposed $0 $84,285,000 $85,053,000 $125,566,000 $126,721,000 $152,419,000 $153,813,000
Oklahoma Tribal Casinos w/in 50 Miles $0 -$12,171,000 -$12,272,000 -$22,281,000 -$22,471,000 -$28,654,000 -$28,895,000
All Other Casinos $0 -$24,654,800 -$25,066,800 -$55,826,100 -$56,538,100 -$76,309,500 -$77,201,600
Total Scenario 1 $0 $47,459,200 $47,714,200 $47,458,900 $47,711,900 $47,455,500 $47,716,400
Data Source: Wells Gaming Research, May 2008.

Kansas Casino Market Study & Gaming Revenue Projections
May 2008 Wells Gaming Research Page 4-15
Forecasted Flow Funds
Exhibit 4-15 shows that, of the total $666 million in gaming revenues for 2007, $242 million
(36.3%) was generated by people from Kansas who frequented Oklahoma Tribal casinos
located near the southern border of Kansas (refer to the first section of Exhibit 4-15
captioned Scenario 1 Revenues Coming From).
The scenario 1 mid case shows that in 2007 only $18 million of the $666 million stayed in
Kansas, $605 million went to Oklahoma Tribal casinos, $42.3 million went to Missouri, and
$1.3 million went to Iowa (refer to the mid section of Exhibit 4-15). Refer to the third
section of Exhibit 4-15 captioned Scenario 1 Mid - Revenues Going To.
The addition of Sumner County (scenario 1) in the 2010 mid case could result in an
important shift in the flow of casino revenues. Of the $292 million projected to be generated
in Kansas, $140 million could stay in Kansas. As forecasted, an estimated $550 million
would continue to flow to Oklahoma, $34 million to Missouri, and $1 million to Iowa.
Assuming no additional competition enters the market, this trend could be expected to
continue through 2012.
Exhibit 4-15 Flows of Gaming Revenue Funds for Scenario 1
Illustrates Where the Gaming Revenues Originated & Where They Went
Scenario 1 - Revenues Coming From
State 2007 % 2007 2008 2009 2010 % 2010 2011 2012 % 2012
KS $242,053,193 36.3% $242,771,774 $243,508,022 $291,715,359 40.3% $292,616,176 $293,530,157 40.1%
OK $423,949,380 63.7% $426,764,405 $429,605,224 $432,467,142 59.7% $435,357,292 $438,265,147 59.9%
Total $666,002,573 100.0% $669,536,179 $673,113,246 $724,182,501 100.0% $727,973,468 $731,795,304 100.0%
Scenario 1 Low - Revenues Going To
State 2007 % 2007 2008 2009 2010 % 2010 2011 2012 % 2012
IA $1,278,000 0.2% $1,282,000 $1,287,000 $1,195,000 0.2% $1,198,000 $1,202,000 0.2%
KS $17,915,000 2.7% $17,978,000 $18,041,000 $101,094,000 14.0% $101,526,000 $101,961,000 13.9%
MO $42,293,000 6.4% $42,439,000 $42,590,000 $39,223,000 5.4% $39,339,000 $39,459,000 5.4%
OK $604,520,000 90.8% $607,836,100 $611,194,200 $582,673,500 80.5% $585,905,600 $589,172,700 80.5%
Total $666,006,000 100.0% $669,535,100 $673,112,200 $724,185,500 100.0% $727,968,600 $731,794,700 100.0%
Scenario 1 Mid - Revenues Going To
State 2007 % 2007 2008 2009 2010 % 2010 2011 2012 % 2012
IA $1,278,000 0.2% $1,282,000 $1,287,000 $1,014,000 0.1% $1,017,000 $1,020,000 0.1%
KS $17,915,000 2.7% $17,978,000 $18,041,000 $139,943,000 19.3% $140,557,000 $141,176,000 19.3%
MO $42,293,000 6.4% $42,439,000 $42,590,000 $33,528,000 4.6% $33,618,000 $33,710,000 4.6%
OK $604,520,000 90.8% $607,836,100 $611,194,200 $549,700,200 75.9% $552,784,300 $555,886,400 76.0%
Total $666,006,000 100.0% $669,535,100 $673,112,200 $724,185,200 100.0% $727,976,300 $731,792,400 100.0%
Scenario 1 High - Revenues Going To
State 2007 % 2007 2008 2009 2010 % 2010 2011 2012 % 2012
IA $1,278,000 0.2% $1,282,000 $1,287,000 $897,000 0.1% $900,000 $902,000 0.1%
KS $17,915,000 2.7% $17,978,000 $18,041,000 $165,202,000 22.8% $165,927,000 $166,661,000 22.8%
MO $42,293,000 6.4% $42,439,000 $42,590,000 $29,835,000 4.1% $29,911,000 $29,988,000 4.1%
OK $604,520,000 90.8% $607,836,100 $611,194,200 $528,247,800 72.9% $531,236,800 $534,245,900 73.0%
Total $666,006,000 100.0% $669,535,100 $673,112,200 $724,181,800 100.0% $727,974,800 $731,796,900 100.0%
Data Source: Wells Gaming Research, May 2008.

Kansas Casino Market Study & Gaming Revenue Projections
May 2008 Wells Gaming Research Page 4-16
Scenario 2
Assumptions
Scenario 2 includes scenario 1 (existing casinos plus the new generic casino in Sumner
County), as well as expansions at the following casinos located in Kansas and Oklahoma:
Kansas
1. Sac & Fox Casino in Powhattan, KS (March 2008)
Oklahoma
1. Cherokee Casino Resort in Catoosa, OK (January 2009)
2. Kickapoo Casino in McLoud, OK (January 2009)
3. Osage Million Dollar Elm in Ponca City, OK (January 2009)
4. Cherokee Casino West Siloam Springs in Watts, OK (July 2009)
5. Creek Nation Casino in Tulsa, OK (September 2008)
Revenue Projections
The following casino revenue projections include WGR’s low, mid, and high case forecasts
for scenario 2 (includes the addition Sumner County plus the expansions listed in scenario 2).
Of the total $724 million forecasted in the mid case for 2010, an estimated $121.2 million
would go to the category captioned Sumner County Proposed, increasing slightly to $122.3
million by 2012; $59.4 million would likely go to Oklahoma casinos located within 50 miles;
and, $544 million would go to all of the other casinos located in the south central trade area.
The combined gaming revenues have been estimated to increase from an estimated $724
million in 2010 to $732 million by 2012, or by 1.1%.
Exhibit 4-16 Scenario 2 Gaming Revenues Include Scenario 1 + Expansions
Current Low Case Mid Case High Case
2007 2010 2012 2010 2012 2010 2012
*Sumner County Proposed $0 $80,747,000 $81,479,000 $121,210,000 $122,323,000 $147,766,000 $149,116,000
Oklahoma Tribal Casinos w/in 50 Miles $82,203,000 $68,964,000 $69,455,000 $59,447,000 $59,856,000 $53,378,000 $53,738,000
All Other Casinos $583,803,000 $574,473,800 $580,855,900 $543,525,700 $549,623,800 $523,035,300 $528,941,400
Total Scenario 2 $666,006,000 $724,184,800 $731,789,900 $724,182,700 $731,802,800 $724,179,300 $731,795,400
Data Source: Wells Gaming Research, May 2008.

Kansas Casino Market Study & Gaming Revenue Projections
May 2008 Wells Gaming Research Page 4-17
Revenue Impacts
The net gaming revenue impacts between scenarios 1 and 2 show losses for Sumner CountyProposed of $4.4 million and for Oklahoma tribes located within 50 miles of $1.4 million.
The all other casinos category has been forecasted to go up by an additional $5.7 million in
gaming revenues. The bottom line differences between scenarios 1 and 2 are minor, $2.5
thousand in 2010 and $10.4 thousand in 2012.
Exhibit 4-17 Revenue Impacts – Scenario 2 – Scenario 1 + Expansions
Current Low Case Mid Case High Case
2007 2010 2012 2010 2012 2010 2012
*Sumner County Proposed $0 -$3,538,000 -$3,574,000 -$4,356,000 -$4,398,000 -$4,653,000 -$4,697,000
Oklahoma Tribal Casinos w/in 50 Miles $0 -$1,955,000 -$1,975,000 -$1,362,000 -$1,375,000 -$1,058,000 -$1,069,000
All Other Casinos $0 $5,492,300 $5,544,200 $5,715,500 $5,783,400 $5,708,500 $5,764,500
Total Scenario 2 $0 -$700 -$4,800 -$2,500 $10,400 -$2,500 -$1,500
Data Source: Wells Gaming Research, May 2008.

Kansas Casino Market Study & Gaming Revenue Projections
May 2008 Wells Gaming Research Page 4-18
Forecasted Flow Funds
The addition of the scenario 2 casino expansions and Sumner County (scenario 1) could
trigger the following casino revenue flows. Kansas has been projected to generate $292
million in the 2010 (refer to the first section of Exhibit 4-18 captioned Scenario 2 RevenuesComing From). The mid case results show that an estimated $136 million has been
forecasted to stay in Kansas), while $556 million could flow to Oklahoma, $32 million to
Missouri, and $1 million to Iowa (refer to the third section of Exhibit 4-18 captioned
Scenario 2 Mid - Revenues Going To). Absent other market changes, this trend could
continue through 2012.
Exhibit 4-18 Flow of Gaming Revenue Funds for Scenario 2
Illustrates Where the Gaming Revenues Originated & Where They Went
Scenario 2 - Revenues Coming From
State 2007 % 2007 2008 2009 2010 % 2010 2011 2012 % 2012
KS $242,053,193 36.3% $242,771,774 $243,508,022 $291,715,359 40.3% $292,616,176 $293,530,157 40.1%
OK $423,949,380 63.7% $426,764,405 $429,605,224 $432,467,142 59.7% $435,357,292 $438,265,147 59.9%
Total $666,002,573 100.0% $669,536,179 $673,113,246 $724,182,501 100.0% $727,973,468 $731,795,304 100.0%
Scenario 2 Low - Revenues Going To
State 2007 % 2007 2008 2009 2010 % 2010 2011 2012 % 2012
IA $1,278,000 0.2% $1,246,000 $1,199,000 $1,127,000 0.2% $1,130,000 $1,134,000 0.2%
KS $17,915,000 2.7% $18,595,000 $17,940,000 $97,661,000 13.5% $98,074,000 $98,493,000 13.5%
MO $42,293,000 6.4% $41,245,000 $39,727,000 $37,013,000 5.1% $37,125,000 $37,236,000 5.1%
OK $604,520,000 90.8% $608,456,000 $614,251,100 $588,383,800 81.2% $591,647,800 $594,926,900 81.3%
Total $666,006,000 100.0% $669,542,000 $673,117,100 $724,184,800 100.0% $727,976,800 $731,789,900 100.0%
Scenario 2 Mid - Revenues Going To
State 2007 % 2007 2008 2009 2010 % 2010 2011 2012 % 2012
IA $1,278,000 0.2% $1,246,000 $1,199,000 $961,000 0.1% $964,000 $966,000 0.1%
KS $17,915,000 2.7% $18,595,000 $17,940,000 $135,746,000 18.7% $136,339,000 $136,938,000 18.7%
MO $42,293,000 6.4% $41,245,000 $39,727,000 $31,776,000 4.4% $31,863,000 $31,951,000 4.4%
OK $604,520,000 90.8% $608,456,000 $614,251,100 $555,699,700 76.7% $558,811,700 $561,947,800 76.8%
Total $666,006,000 100.0% $669,542,000 $673,117,100 $724,182,700 100.0% $727,977,700 $731,802,800 100.0%
Scenario 2 High - Revenues Going To
State 2007 % 2007 2008 2009 2010 % 2010 2011 2012 % 2012
IA $1,278,000 0.2% $1,246,000 $1,199,000 $852,000 0.1% $855,000 $857,000 0.1%
KS $17,915,000 2.7% $18,595,000 $17,940,000 $160,725,000 22.2% $161,430,000 $162,142,000 22.2%
MO $42,293,000 6.4% $41,245,000 $39,727,000 $28,343,000 3.9% $28,414,000 $28,486,000 3.9%
OK $604,520,000 90.8% $608,456,000 $614,251,100 $534,259,300 73.8% $537,274,400 $540,310,400 73.8%
Total $666,006,000 100.0% $669,542,000 $673,117,100 $724,179,300 100.0% $727,973,400 $731,795,400 100.0%
Data Source: Wells Gaming Research, May 2008.

Kansas Casino Market Study & Gaming Revenue Projections
May 2008 Wells Gaming Research Page 4-19
Scenario 3
Scenario 3 includes scenario 2 and the following new casinos that have been proposed for
Kansas, Missouri, and Oklahoma:
Kansas
1. Wyandotte 7th Street Casino in Kansas City, KS (January 2008)
2. Camptown Greyhound Park in Frontenac, KS (January 2009)
3. The Woodlands in Kansas City, KS (January 2009)
4. Cherokee County planned in Baxter Springs, KS (January 2010)
5. Wyandotte County planned in Kansas City, KS (January 2010)
6. Ford County planned in Dodge City, KS (proposed for 2010)
Missouri
1. Barden Development, Inc. planned in Branson, MO
2. Wild Rose Entertainment planned in Sugar Creek, MO (Jan 2010)
Oklahoma
1. First Council Casino in Newkirk, OK (March 2008)
2. Downstream Casino Resort in Ottawa, OK (July 2008)
3. Seneca-Cayuga Tribes of Oklahoma planned in Grove, OK (July 2008)
4. Ioway Casino Resort in Lincoln, OK (January 2009)
5. Muscogee Creek Nation planned in Eufaula, OK (proposed for 2010)
6. Pawnee Nation Planned in Chilocco, OK (proposed for 2010)
7. Ponca Tribe Oklahoma planned in Ponca City, OK (proposed for 2010
8. Poteau Travel and Smoke Shop in Poteau, OK (proposed for 2010)
9. Shawnee Tribe Oklahoma planned in Oklahoma City, OK (proposed for 2010)
10. Wichita & Affiliated Tribes planned in Hinton, OK (proposed for 2010)
11. Wilburton Travel and Smoke Shop in Wilburton, OK (proposed for 2010)
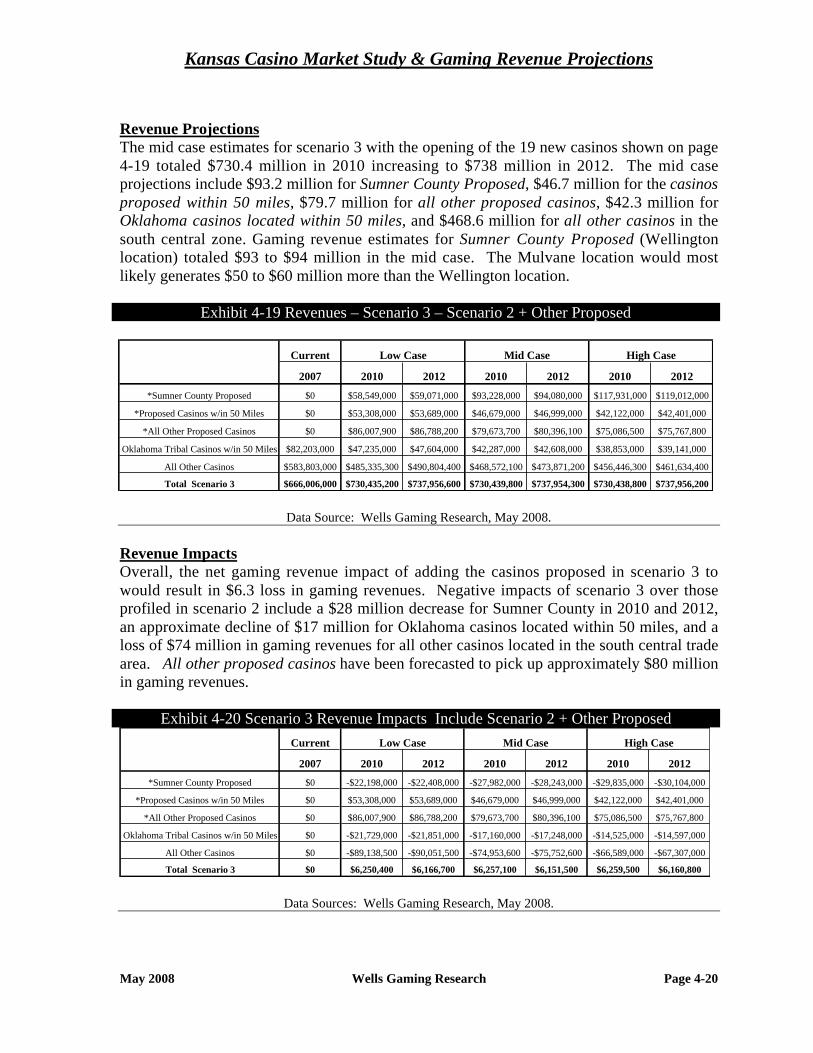
Kansas Casino Market Study & Gaming Revenue Projections
May 2008 Wells Gaming Research Page 4-20
Revenue Projections
The mid case estimates for scenario 3 with the opening of the 19 new casinos shown on page
4-19 totaled $730.4 million in 2010 increasing to $738 million in 2012. The mid case
projections include $93.2 million for Sumner County Proposed, $46.7 million for the casinosproposed within 50 miles, $79.7 million for all other proposed casinos, $42.3 million for
Oklahoma casinos located within 50 miles, and $468.6 million for all other casinos in the
south central zone. Gaming revenue estimates for Sumner County Proposed (Wellington
location) totaled $93 to $94 million in the mid case. The Mulvane location would most
likely generates $50 to $60 million more than the Wellington location.
Exhibit 4-19 Revenues – Scenario 3 – Scenario 2 + Other Proposed
Current Low Case Mid Case High Case
2007 2010 2012 2010 2012 2010 2012
*Sumner County Proposed $0 $58,549,000 $59,071,000 $93,228,000 $94,080,000 $117,931,000 $119,012,000
*Proposed Casinos w/in 50 Miles $0 $53,308,000 $53,689,000 $46,679,000 $46,999,000 $42,122,000 $42,401,000
*All Other Proposed Casinos $0 $86,007,900 $86,788,200 $79,673,700 $80,396,100 $75,086,500 $75,767,800
Oklahoma Tribal Casinos w/in 50 Miles $82,203,000 $47,235,000 $47,604,000 $42,287,000 $42,608,000 $38,853,000 $39,141,000
All Other Casinos $583,803,000 $485,335,300 $490,804,400 $468,572,100 $473,871,200 $456,446,300 $461,634,400
Total Scenario 3 $666,006,000 $730,435,200 $737,956,600 $730,439,800 $737,954,300 $730,438,800 $737,956,200
Data Source: Wells Gaming Research, May 2008.
Revenue Impacts
Overall, the net gaming revenue impact of adding the casinos proposed in scenario 3 to
would result in $6.3 loss in gaming revenues. Negative impacts of scenario 3 over those
profiled in scenario 2 include a $28 million decrease for Sumner County in 2010 and 2012,
an approximate decline of $17 million for Oklahoma casinos located within 50 miles, and a
loss of $74 million in gaming revenues for all other casinos located in the south central trade
area. All other proposed casinos have been forecasted to pick up approximately $80 million
in gaming revenues.
Exhibit 4-20 Scenario 3 Revenue Impacts Include Scenario 2 + Other Proposed
Current Low Case Mid Case High Case
2007 2010 2012 2010 2012 2010 2012
*Sumner County Proposed $0 -$22,198,000 -$22,408,000 -$27,982,000 -$28,243,000 -$29,835,000 -$30,104,000
*Proposed Casinos w/in 50 Miles $0 $53,308,000 $53,689,000 $46,679,000 $46,999,000 $42,122,000 $42,401,000
*All Other Proposed Casinos $0 $86,007,900 $86,788,200 $79,673,700 $80,396,100 $75,086,500 $75,767,800
Oklahoma Tribal Casinos w/in 50 Miles $0 -$21,729,000 -$21,851,000 -$17,160,000 -$17,248,000 -$14,525,000 -$14,597,000
All Other Casinos $0 -$89,138,500 -$90,051,500 -$74,953,600 -$75,752,600 -$66,589,000 -$67,307,000
Total Scenario 3 $0 $6,250,400 $6,166,700 $6,257,100 $6,151,500 $6,259,500 $6,160,800
Data Sources: Wells Gaming Research, May 2008.

Kansas Casino Market Study & Gaming Revenue Projections
May 2008 Wells Gaming Research Page 4-21
Forecasted Flow Funds
Exhibit 4-21 illustrates that the addition of the proposed casinos included in scenario 3
(incorporates the expansions and additions outlined in scenarios 1 and 2) resulted in the
following forecasted flow of casino revenues. Out of a total of $730 million in 2010, $298
million has been forecasted to be generated in Kansas and $433 million in Oklahoma (refer
to the first section of Exhibit 4-21 captioned Scenario 3 Revenues Coming From). The mid
case forecasts shows that only $129 million would stay in Kansas, while $573 million would
flow into Oklahoma (refer to the third section of Exhibit 4-21 captioned Scenario 3 Mid -Revenues Going To). Other mid case results include an estimated $28 million flowing to
Missouri, and $727 thousand to Iowa. Without any significant changes in the south central
trade area, this trend could continue through 2012.
Exhibit 4-21 Flow of Gaming Revenue Funds for Scenario 3
Illustrates Where the Gaming Revenues Came From & Where They Went
Scenario 3 - Revenues Coming From
State 2007 % 2007 2008 2009 2010 % 2010 2011 2012 % 2012
KS $242,053,193 36.3% $243,429,855 $244,971,726 $297,764,725 40.8% $298,616,770 $299,481,888 40.6%
OK $423,949,380 63.7% $426,764,405 $429,708,105 $432,672,430 59.2% $435,564,475 $438,474,269 59.4%
Total $666,002,573 100.0% $670,194,260 $674,679,831 $730,437,155 100.0% $734,181,245 $737,956,157 100.0%
Scenario 3 Low - Revenues Going To
State 2007 2008 2009 2010 % 2010 2011 2012 % 2012
IA $1,278,000 0.2% $1,107,000 $1,018,000 $817,000 0.1% $819,000 $821,000 0.1%
KS $17,915,000 2.7% $17,479,000 $21,279,000 $97,952,000 13.4% $98,302,000 $98,650,000 13.4%
MO $42,293,000 6.4% $36,592,000 $33,744,000 $31,106,000 4.3% $31,197,000 $31,287,000 4.2%
OK $604,520,000 90.8% $615,018,100 $618,643,400 $600,560,200 82.2% $603,864,400 $607,198,600 82.3%
Total $666,006,000 100.0% $670,196,100 $674,684,400 $730,435,200 100.0% $734,182,400 $737,956,600 100.0%
Scenario 3 Mid - Revenues Going To
State 2007 2008 2009 2010 % 2010 2011 2012 % 2012
IA $1,278,000 0.2% $1,107,000 $1,018,000 $727,000 0.1% $729,000 $731,000 0.1%
KS $17,915,000 2.7% $17,479,000 $21,279,000 $128,731,000 17.6% $129,224,000 $129,724,000 17.6%
MO $42,293,000 6.4% $36,592,000 $33,744,000 $27,816,000 3.8% $27,890,000 $27,965,000 3.8%
OK $604,520,000 90.8% $615,018,100 $618,643,400 $573,165,800 78.5% $576,340,100 $579,534,300 78.5%
Total $666,006,000 100.0% $670,196,100 $674,684,400 $730,439,800 100.0% $734,183,100 $737,954,300 100.0%
Scenario 3 High - Revenues Going To
State 2007 2008 2009 2010 % 2010 2011 2012 % 2012
IA $1,278,000 0.2% $1,107,000 $1,018,000 $662,000 0.1% $664,000 $666,000 0.1%
KS $17,915,000 2.7% $17,479,000 $21,279,000 $150,612,000 20.6% $151,207,000 $151,808,000 20.6%
MO $42,293,000 6.4% $36,592,000 $33,744,000 $25,453,000 3.5% $25,517,000 $25,581,000 3.5%
OK $604,520,000 90.8% $615,018,100 $618,643,400 $553,711,800 75.8% $556,789,000 $559,901,200 75.9%
Total $666,006,000 100.0% $670,196,100 $674,684,400 $730,438,800 100.0% $734,177,000 $737,956,200 100.0%
Data Source: Wells Gaming Research, May 2008.

Kansas Casino Market Study & Gaming Revenue Projections
May 2008 Wells Gaming Research Page 4-22
Current & Proposed Casino Capacity
Exhibit 4-22 recaps casino capacity and illustrates what could be expected with the proposed
casino additions and expansions.
Exhibit 4-22 Casino Capacity Including Proposed Growth
# Of
Loc Casinos# of
Slots
# of
Pit
Tables
# of
Poker
Tables
# of
Total
Tables
# of
Bingo
Seats
Race
Book
Casino
S.F.
Con-
vention
S.F.
# of
Rooms
# of
Restau-
rants
Enter-
tain-
ment
Park-
ing
Current Capacity for Existing Casinos
54 Existing Casinos 28,532 271 196 467 3,580 8 1,318,784 57,350 741 79 15 39,912
Casino Expansions in Kansas
1 Sac & Fox Casino - Powhattan 500 0 0 0 0 0 0 0 0 0 0 0
Total Kansas Expansions 500 0 0 0 0 0 0 0 0 0 0 0
Casino Expansions in Oklahoma
1 Cherokee Casino- West Siloam Springs 486 10 0 10 0 0 10,000 20,000 140 1 1 0
2 Cherokee Nation Casino - Tulsa 1,788 34 0 34 0 0 0 0 0 0 0 0
3 Kickapoo Casino - McLoud 675 31 0 31 0 0 0 0 0 2 0 0
4 Osage Million Dollar Elm - Ponca City 0 0 0 0 0 0 0 0 0 1 0 0
5 Cherokee Casino Resort-Catoosa 732 0 0 0 0 242,000 0 0 2 2 0
Total Oklahoma Expansions 3,681 75 0 75 0 0 252,000 20,000 140 6 3 0
Kansas Proposed Casinos
1 Sumner County Planned 2,000 50 0 50 0 0 0 30,000 275 4 3 3,700
2 Camptown Greyhound Park 600 0 0 0 0 1 0 0 0 2 0 700
3 Cherokee County Planned 1,200 40 0 40 0 0 0 10,000 250 3 2 2,500
4 Ford County Planned 800 20 0 20 0 0 5,000 100 3 3 1,700
Total Kansas Proposed Cassinos 4,600 110 0 110 0 1 0 45,000 625 12 8 8,600
Oklahoma Proposed Casinos
1 Downstream Casino Resort 2,000 30 15 45 0 0 70,000 10,000 240 2 0 2,700
2 First Council Casino 900 8 8 16 0 0 40,000 0 0 2 1 950
3 Ioway Casino Resort 1,500 50 0 50 0 0 0 0 250 3 2 2,500
4 Pawnee Nation Chilocco 1,200 24 0 24 0 0 0 0 150 3 1 1,500
5 Ponca Tribe Oklahoma Planned 500 10 0 10 0 0 50,000 20,000 100 2 0 1,200
6 Seneca-Cayuga Tribes of Oklahoma 1,200 18 0 18 0 0 100,000 0 125 3 1 1,800
7 Shawnee Tribe Oklahoma Planned 2,000 75 0 75 0 0 0 400 3 6 4,800
8 Wichita & Affiliated Tribes Planned 350 5 0 5 0 0 0 0 0 1 0 350
Total Kansas Proposed Cassinos 9,650 220 23 243 0 0 260,000 30,000 1,265 19 11 15,800
72 Grand Total 46,963 676 219 895 3,580 9 1,830,784 152,350 2,771 116 37 64,312
Percent Increase Over Current 65% 149% 12% 92% 0% 13% 39% 166% 274% 47% 147% 61%
Data Source: Wells Gaming Research, May 2008.
The grand total and the percent increase lines reflect the capacity increases that could be
anticipated if all of the proposed casino additions and expansions take place. The number of
casino locations would increase from 54 to 72. Key gaming capacity changes include a 65%
increase in slot machines, a 92% increase in the total number of table games, and a 39%
expansion in casino square footage. Other amenities include a 166% expansion in
convention/meeting space, a 274% escalation in hotel rooms, a 47 % increase in the number
of restaurants, a 147% increase in the number of entertainment venues, and a 61% increase in
parking capacity.

Kansas Casino Market Study & Gaming Revenue Projections
Wells Gaming Research
May 2008
Section 5

Kansas Casino Market Study & Gaming Revenue Projections
May 2008 Wells Gaming Research Page 5-1
Summary of the Trade Area
For the Southwest Gaming Zone
Highlights of WGR’s study on the southwest trade area (Ford County) are presented directly
below (refer to pages 5-6 through 5-17 for the corresponding detailed analyses and
discussions).
Trade Area
The southwest trade area includes an approximate 100-mile radius of Dodge City, Kansas. It
extends to Sheridan and Graham Counties, Kansas on the north; the Texas panhandle on the
south taking in parts of Ochiltree and Lipscomb Counties, Texas, as well as Ellis County,
Oklahoma on the south; Hamilton, Stanton, and Morton Counties in Kansas on the west (near
the Colorado border); and Reno County, Kansas on the east. (For reference, refer to the map
on page 5-2).
Demographic Statistics
The population and median household income statistics included in this report are limited to
those counties included in the southwest trade area and are not representative of the entire
states of Kansas, Oklahoma, or Texas.
Exhibit 5-1 shows that the southwest trade area includes 60 counties (51 in Kansas, seven in
Oklahoma, and two in Texas). In 2007, these counties had a total adult population of 343
thousand. Median household incomes (MHI) ranged from a little over $38 thousand in
Oklahoma, to approximately $44 thousand in Kansas, and $45 thousand in Texas.
Exhibit 5-1 Adult Population & Median Household Income (MHI)
2007 2007 2012 ACGR
State
# of
Counties
Adult
Population MHI
Adult
Population MHI
Adult
Population
07 to 12
MHI
07 to 12
KS 51 284,463 $43,822 280,482 $50,930 -0.3% 3.1%
OK 7 50,021 $38,196 52,359 $42,358 0.9% 2.1%
TX 2 8,518 $44,958 8,919 $52,000 0.9% 3.0%
Total 60 343,002 NA 341,760 NA -0.1% NA
Data Sources: Bureau of Business & Economic Research, UNR & Wells Gaming Research, May 2008.
Adult population forecasts for 2012 were slightly lower than 2007, approximately 342
thousand (the minor decline is expected in Kansas). The resulting average compound growth
rate (ACGR) for adult population is slightly negative (0.1%) for the 2007 and 2012 period.
The median household income levels for 2012 are forecasted at $42 thousand in Oklahoma,
$51 thousand in Kansas, and $52 thousand in Texas. The average compound growth rate for

Copyright © and (P) 1988–2006 Microsoft Corporation and/or its suppliers. All rights reserved. http://www.microsoft.com/mappoint/Portions © 1990–2005 InstallShield Software Corporation. All rights reserved. Certain mapping and direction data © 2005 NAVTEQ. All rights reserved. The Data for areas of Canada includes information taken with permission from Canadian authorities, including: © Her Majesty the Queen in Right of Canada, © Queen's Printer for Ontario. NAVTEQ and NAVTEQ ON BOARD are trademarks of NAVTEQ. © 2005 Tele Atlas North America, Inc. All rights reserved. Tele Atlas and Tele Atlas North America are trademarks of Tele Atlas, Inc.
Southwest Kansas Zone
0 mi 50 100 150

Kansas Casino Market Study & Gaming Revenue Projections
May 2008 Wells Gaming Research Page 5-3
median household income ranged from 2.1% in Oklahoma, 3.0% in Texas, and to 3.1% in
Kansas for the 2007 to 2012 period.
Primary Market
The primary market for the southwest trade area is made up of the eight counties surrounding
the proposed casino in Ford County. Exhibit 5-2 shows that the adult population for the
primary market was approximately 61 thousand in 2007, which represented 18% of the total
adult population in the subject trade area. This adult population segment has been forecasted
to be approximately 62 thousand by 2012. As a group, the eight counties making up the
primary market are projected to have an average compound growth rate of 0.5% between
2007 and 2012.
Exhibit 5-2 Adult Population for Counties Surrounding Ford County Casino
# of
Counties County Names 2007 2012
ACGR
07 to 12
% Pop/ Co
2012
Clark KS 1,723 1,760 0.4% 1%
Edwards KS 1,999 1,777 -2.3% 1%
Ford KS 20,948 21,370 0.4% 6%
Gray KS 4,413 4,904 2.1% 1%
Hodgeman KS 1,589 1,709 1.5% 1%
Kiowa KS 2,238 2,228 -0.1% 1%
Meade KS 3,047 3,014 -0.2% 1%
Finney KS 24,810 25,482 0.5% 7%
8 Total Surrounding Counties 60,767 62,244 0.5% 18%
43
Total Kansas Counties - Excluding
Surrounding Counties 223,696 218,238 -0.5% 64%
7 Total Oklahoma Counties 50,021 52,359 0.9% 15%
2 Total Texas Counties 8,518 8,919 0.9% 3%
60 Total Trade Area Population 343,002 341,760 -0.1% 100%
Data Sources: Bureau of Business & Economic Research, UNR & Wells Gaming Research, May 2008.

Kansas Casino Market Study & Gaming Revenue Projections
May 2008 Wells Gaming Research Page 5-4
Gaming Capacity & Competition
Casino gaming capacity for the approximate 150-mile radius of the Ford County casino site
is summarized in Exhibit 5-3. Currently, there is no gaming capacity within this area. The
casino proposed for Ford County (scenario 1 below) would introduce 800 slots and 20 table
games. Other amenities would include 100 hotel rooms.
Scenario 2 shows expansions that are planned at four northern Oklahoma casinos. These
expansions are located beyond the 150-mile radius. They would not be close enough to add
their capacity to the southwest trade area’s total. Nonetheless, the gaming facilities could
compete with casinos located in the southwest trade area for casino players.
Exhibit 5-3 Capacity Statistics for the Southwest Trade Area
Casinos# of Slots
# of Tables
# of Rooms Parking
Existing Capacity - Southwest Gaming Zone 0 0 0 0
Scenario 1 - Capacity for Ford County Casino (Planned) 800 20 100 1,700
Scenario 2 - Expansions in Northern Oklahoma 0 0 0 0
Scenario 3 - Other Proposed (11 Casinos including Sumner County) 2,000 50 275 3,700
Total Existing, Expansions, & New Casinos 2,800 70 375 5,400
Data Source: Wells Gaming Research, May 2008.
Eleven new casinos have been incorporated into scenario 3. However, gaming capacity
shown in this schedule reflects only the new Sumner County casino with 2,000 slot machines
and 50 table games. Assumed amenities include 275 hotel rooms and 3,700 parking spaces.
The remaining new casinos are beyond the 150-mile radius, but are in the gravity model and
compete to a limited extent for business within the southwest trade area.
The total casino capacities include 2,800 slot machines and 70 table games. Other amenities
include 375 hotel rooms and 5,400 parking spaces.

Kansas Casino Market Study & Gaming Revenue Projections
May 2008 Wells Gaming Research Page 5-5
Gaming Revenues
The forecasted gaming revenues that correspond with the foregoing scenarios are
summarized in Exhibit 5-4. The dollar flows shows where the gaming revenue came from
and where they went. The current status reflects a loss of $57 million that flowed out of
Kansas into Oklahoma. Texas also lost $3 million to Oklahoma. Scenarios 1 through 3
illustrate the gaming revenue that has been forecasted for 2012 given the assumptions of each
scenario.
Exhibit 5-4 Summary of the 2012 Flow of Gaming Revenues(Dollars in Millions)
Current Status 2007 Scenario-1 2012 Scenario-2 2012 Scenario-3 2012
StateComing From
Going To Dif
Coming From
Going To Dif
Coming From
Going To Dif
Coming From
Going To Dif
KS $57 $0 -$57 $102 $44 -$58 $102 $43 -$60 $106 $51 -$55
OK $18 $78 $60 $22 $83 $61 $22 $84 $63 $22 $80 $58
TX $3 $0 -$3 $3 $0 -$3 $3 $0 -$3 $3 $0 -$3
Total $78 $78 $0 $127 $127 $0 $127 $127 $0 $130 $130 $0
Data Source: Wells Gaming Research, May 2008.
The key assumption of scenario 1 is the addition of the new generic casino in Ford County,
which serves to increase the gaming revenues for Kansas from the current level of $57
million to $102 million. Given the competition, Kansas is only able to retain $44 million.
The revenues flowing into Oklahoma increase to $83 million.
Scenario 2 includes the new casino in Ford County and the expansions at Oklahoma casinos.
The revenue data shows that Kansas continues to generate $102 million, but only retains $43
million for a net loss of $59 million. Oklahoma continues to generate $22 million, but
receives $84 million for a net gain of $62 million. Thus, Oklahoma enjoys $60 million
flowing out from Kansas plus another $3 million flowing from Texas. The bottom line totals
for scenarios 1 and 2 are the same, suggesting that the casino expansions in Oklahoma had
very little impact on bottom line gaming revenues.
The casino is Sumner County, as well as other new casinos in Oklahoma, are added to the
mix in scenario 3. Overall, gaming revenues increase by $3 million, from $127 million to
$130 million. Total gaming revenues generated in Kansas increase to $106 million, up by $4
million. Revenues going to Kansas increased by $8 million, from $43 to $51, thereby cutting
the loss from $60 million to $55 million.

Kansas Casino Market Study & Gaming Revenue Projections
May 2008 Wells Gaming Research Page 5-6
Detailed Analyses for the Trade Area
For the Southwest Gaming Zone
Population Statistics
For background reference, WGR compiled both total and adult population statistics for the
100-mile trade area surrounding Ford County. However, due to the age restrictions on casino
gaming, only the adult population statistics were used to forecast gross gaming revenues.
The total population for the southwest trade area was 504,936 in 2007. Included were
420,547 in Kansas, 71,610 in Oklahoma, and 12,779 in Texas.
The corresponding adult population totaled 343,002 (68% of the total) in 2007. The adult
population has been projected to decline to 341,760 by 2012, reflecting a negative annual
growth rate of .04%.
Exhibit 5-5 Total & Adult Population Statistics
2000 Total & Adult 2007 Total & Adult 2012 Total & Adult
ST
# of
CO Total Adult
Adult
% of
Total
Adult
% of
Adult
Total Total Adult
Adult
% of
Total
Adult
% of
Adult
Total Total Adult
Adult
% of
Total
Adult
% of
Adult
Total
KS 51 435,574 295,274 67.8% 84.2% 420,547 284,463 67.6% 82.9% 415,219 280,482 67.6% 82.1%
OK 7 67,281 47,201 70.2% 13.5% 71,610 50,021 69.9% 14.6% 75,178 52,359 69.6% 15.3%
TX 2 12,063 8,045 66.7% 2.3% 12,779 8,518 66.7% 2.5% 13,385 8,919 66.6% 2.6%
TOT 60 514,918 350,520 68.1% 100.0% 504,936 343,002 67.9% 100.0% 503,782 341,760 67.8% 100.0%
Data Source: Wells Gaming Research, May 2008.
In 2007, the total population of the eight counties surrounding Ford County was 96,059. The
2012 projections increased to 98,219, reflecting an annual growth rate of 0.5%.
Exhibit 5-6 Total Population Statistics for 2000 and 2006-2012
# of CO Counties/Parishes 2000 2006 2007 2008 2009 2010 2011 2012
ACGR 07 to 12
% Pop/ Co 2012
Clark KS 2,390 2,430 2,441 2,451 2,462 2,472 2,483 2,493 0.5% 3%
Edwards KS 3,449 2,860 2,793 2,728 2,664 2,602 2,542 2,482 -2.8% 3%
Ford KS 32,458 32,666 32,797 32,928 33,059 33,191 33,322 33,456 0.5% 34%
Gray KS 5,904 6,669 6,810 6,956 7,104 7,255 7,410 7,567 2.6% 8%
Hodgeman KS 2,085 2,289 2,323 2,357 2,392 2,427 2,463 2,499 1.8% 3%
Kiowa KS 3,278 3,128 3,125 3,123 3,120 3,117 3,114 3,111 -0.1% 3%
Meade KS 4,631 4,536 4,526 4,516 4,505 4,496 4,486 4,476 -0.3% 5%
Finney KS 40,523 41,024 41,244 41,464 41,687 41,911 42,135 42,135 0.5% 43%
8 Total Surrounding Counties 94,718 95,602 96,059 96,523 96,993 97,471 97,955 98,219 0.5% 100%
43
Total Kansas Counties - Excluding Surrounding
Counties 340,856 326,077 324,488 322,917 321,356 319,810 318,279 317,000 -0.6%
7 Total Oklahoma Counties 67,281 70,946 71,610 72,293 72,987 73,701 74,431 75,178 1.2%
2 Total Texas Counties 12,063 12,664 12,779 12,896 13,014 13,132 13,257 13,385 1.1%
60 Total Trade Area Population 514,918 505,289 504,936 504,629 504,350 504,114 503,922 503,782 -0.1%
Data Sources: Bureau of Business & Economic Research, UNR & Wells Gaming Research, May 2008

Kansas Casino Market Study & Gaming Revenue Projections
May 2008 Wells Gaming Research Page 5-7
In 2007, the adult population in the eight surrounding counties was 60,767. The adult
population has been projected to grow at an average compound growth rate of 0.6% per year
to 62,244 by 2012.
Exhibit 5-7 Adult Population Statistics for 2000 and 2006-2012
# of CO Counties 2000 2006 2007 2008 2009 2010 2011 2012
ACGR 07 to 12
% Pop/ Co 2012
Clark KS 1,687 1,715 1,723 1,730 1,738 1,745 1,753 1,760 0.5% 3%
Edwards KS 2,469 2,047 1,999 1,953 1,907 1,863 1,820 1,777 -2.8% 3%
Ford KS 20,731 20,864 20,948 21,031 21,114 21,199 21,283 21,370 0.5% 34%
Gray KS 3,826 4,322 4,413 4,508 4,604 4,702 4,802 4,904 2.6% 8%
Hodgeman KS 1,426 1,566 1,589 1,612 1,636 1,660 1,685 1,709 1.8% 3%
Kiowa KS 2,348 2,241 2,238 2,237 2,235 2,233 2,231 2,228 -0.1% 4%
Meade KS 3,118 3,054 3,047 3,040 3,033 3,027 3,021 3,014 -0.3% 5%
Finney KS 24,507 24,679 24,810 24,944 25,077 25,211 25,346 25,482 0.6% 41%
8 Total Surrounding Counties 60,112 60,488 60,767 61,055 61,344 61,640 61,941 62,244 0.6% 100%
43
Total Kansas Counties - Excluding Surrounding
Counties 235,162 224,812 223,696 222,580 221,482 220,381 219,296 218,238 -0.6%
7 Total Oklahoma Counties 47,201 49,582 50,021 50,469 50,920 51,391 51,870 52,359 1.1%
2 Total Texas Counties 8,045 8,442 8,518 8,595 8,673 8,751 8,834 8,919 1.1%
60 Total Trade Area Population 350,520 343,324 343,002 342,699 342,419 342,163 341,941 341,760 -0.1%
Data Sources: Bureau of Business & Economic Research, UNR & Wells Gaming Research, May 2008
Average Median Household Income
The average median household income (AMHI) statistics in 2007 for counties located within
the three states in the southwest trade area were approximately $44,000 (Kansas), $38,000
(Oklahoma), and $45,000 (Texas). Based on the stated average compound growth rates for
2012, the median household incomes have been forecasted at approximately $51,000,
$42,000, and $52,000, respectively for the three states.
Exhibit 5-8 Average Median Household Income Statistics for 2000 and 2006-2012
# of CO State 2000 2006 2007 2008 2009 2010 2011 2012
ACGR
07 to 12
51 KS $35,628 $42,537 $43,822 $45,151 $46,524 $47,944 $49,412 $50,930 3.7%
7 OK $33,023 $37,413 $38,196 $38,995 $39,811 $40,643 $41,492 $42,358 2.5%
2 TX $36,765 $43,675 $44,958 $46,281 $47,646 $49,055 $50,505 $52,000 3.6%
Data Sources: Bureau of Business & Economic Research, UNR & Wells Gaming Research, May 2008

Kansas Casino Market Study & Gaming Revenue Projections
May 2008 Wells Gaming Research Page 5-8
Status Quo Casino Revenues & Visitors
for the Southwest Zone’s Trade Area
Status Quo Casino Revenues
The status quo (2007) gaming revenues totaled approximately $78.7 million for the
southwest trade area. Casino players from Kansas who visit Oklahoma Tribal casinos
located near the southern Kansas border generated over $58 million of this revenue. Without
any casino expansions or additions in the southwest trade area, gaming revenues would most
likely decline slightly to $77.97 million by 2012.
Exhibit 5-9 Status Quo Gaming Revenues (2007-2012) for the Southwest Trade Area
Revenue 2007 2008 2009 2010 2011 2012
All Existing Casinos $78,668,000 $78,512,000 $78,363,000 $78,224,000 $78,093,000 $77,966,000
Total $78,668,000 $78,512,000 $78,363,000 $78,224,000 $78,093,000 $77,966,000
Data Source: Wells Gaming Research, May 2008
Status Quo Visitors
The status quo casino visitors totaled approximately 912 thousand. Absent casino
expansions or additions, visitor counts could also be expected to decrease to approximately
902 thousand by 2012.
Exhibit 5-10 Status Quo Visitors for the Southwest Trade Area
Visitors 2007 2008 2009 2010 2011 2012
All Existing Casinos 911,608 909,430 907,306 905,290 903,368 901,512
Total 911,608 909,430 907,306 905,290 903,368 901,512
Data Source: Wells Gaming Research, May 2008

Kansas Casino Market Study & Gaming Revenue Projections
May 2008 Wells Gaming Research Page 5-9
Status Quo Estimates of Casino Revenue Flows
The status quo for casino revenue shows what could be expected if no new casino
development occurred in the southwest trade area. Focusing on 2007, the southwest trade
area generated an estimated $79 million in total gaming revenues. Of the total, an estimated
$58 million was generated by Kansas residents. Another $18 million came from Oklahoma,
and approximately $3 million flowed in from Texas. However, the total amount ($78.7
million) flowed back to Oklahoma.
Exhibit 5-11 Status Quo Casino Revenue Flows (2007-2012) for the Southwest Trade Area
Current Scenario Revenues Coming From
State 2007 2008 2009 2010 2011 2012
KS Total $58,101,210 $57,818,892 $57,540,952 $57,267,051 $56,998,266 $56,733,601
OK Total $17,727,675 $17,830,255 $17,932,721 $18,040,946 $18,149,847 $18,261,236
TX Total $2,840,656 $2,865,391 $2,891,123 $2,916,051 $2,943,580 $2,971,027
Total $78,669,541 $78,514,538 $78,364,796 $78,224,048 $78,091,693 $77,965,864
Current Scenario Revenues Going To
State 2007 2008 2009 2010 2011 2012
OK Total $78,668,000 $78,512,000 $78,363,000 $78,224,000 $78,093,000 $77,966,000
Total $78,668,000 $78,512,000 $78,363,000 $78,224,000 $78,093,000 $77,966,000
Data Source: Wells Gaming Research, May 2008

Kansas Casino Market Study & Gaming Revenue Projections
May 2008 Wells Gaming Research Page 5-10
Status Quo Southwest Trade Area Capacity
The following list of gaming capacity illustrates that there are currently no casinos (gaming
capacity) operating within approximately 150 miles of the casino site in the southwest zone.
Exhibit 5-12 Current Casino Capacity Statistics
Casinos# of
Slots
# of
Pit
Tables
# of
Poker
Tables
# of
Total
Tables
# of
Bingo
Seats
Race
Book
Casino
S.F.
Con-
vention
S.F.
# of
Rooms
# of
Restau-
rants
Enter
tain
ment
Park-
ing
Current Capacity for Existing Casinos Current Capacity for Existing Casinos
Existing Casinos 0 0 0 0 0 0 0 0 0 0 0 0
Scenario 1 - Ford County Proposed Scenario 1 - Ford County Proposed
Ford County Planned 800 20 0 20 0 0 10,000 100 3 3 1,700
Subtotal Of Scenario 1 800 20 0 20 0 0 0 10,000 100 3 3 1,700
Scenario 2 - Expansions
Subtotal of Scenario 2 0 0 0 0 0 0 0 0 0 0 0 0
Scenario 3 - Other Proposed
Sumner County Planned 2,000 50 0 50 0 0 30,000 275 4 3 3,700
Subtotal of Scenario 3 2,000 50 0 50 0 0 0 30,000 275 4 3 3,700
Total Expansions & New Casinos 2,800 70 0 70 0 0 0 40,000 375 7 6 5,400
Total Existing, Expansions & New 2,800 70 0 70 0 0 0 40,000 375 7 6 5,400
Data Source: Wells Gaming Research, May 2008
Future Capacity with Casino Growth
Casino capacity is being proposed for the future. Scenario 1, above, includes the new casino
to be located in Ford County, which will be equipped with 800 slot machines and 20 table
games. Other amenities will include 10,000 square feet of convention/meeting space, 100
hotel rooms, three restaurants, and three entertainment venues, and 1,700 parking spaces.
Even though scenario 2 includes expansions at four casinos located in northern Oklahoma,
the subject casinos are located beyond the 150-radius and are not included in this schedule.
Thus, scenario 2 has been acknowledged above, but does not add any new capacity to the
southwest trade area.
Scenario 3 includes the gaming capacity projected for a casino in Sumner County, which will
be equipped with 2,000 slot machines and 50 gaming tables. Other amenities include 30,000
square feet of convention/meeting space, 275 hotel rooms, four restaurants, and three
entertainment venues, and 3,700 parking spaces.
Combined, scenarios 1 through 3 would add 2,800 slot machines and 70 table games. Other
proposed amenities include 40,000 square feet of convention/meeting square footage, 375
hotel rooms, seven restaurants, six entertainment venues, and 5,400 parking spaces.

Kansas Casino Market Study & Gaming Revenue Projections
May 2008 Wells Gaming Research Page 5-11
Scenario Analyses for the Southwest Trade Area
Scenario 1
Assumptions
Scenario 1 includes the addition of a casino located at the western edge of Dodge City in Ford
County, Kansas. The mid case projections are for a casino equipped with 800 slot machines
and 20 table games. Other proposed amenities include 10,000 square feet of
convention/meeting space, three restaurants, 100 hotel rooms, three entertainment venues (two
small and one large), and 1,700 parking spaces.
Revenue Projections
The following gaming revenue projections include WGR’s 2010 and 2012 low, mid, and high
case forecasts for scenario 1. The mid case projections show casino gaming revenues of $127
million in 2010 and 2012. An estimated $44 million would come from the casino in FordCounty and $83 million would come from all existing casinos.
Exhibit 5-13 Revenue Forecasts for Scenario 1
Current Low Case Mid Case High Case
2007 2010 2012 2010 2012 2010 2012
*Ford County (Proposed) $0 $32,263,000 $32,464,000 $44,022,000 $44,239,000 $52,167,000 $52,385,000
All Existing Casinos $78,668,000 $94,991,000 $94,719,000 $83,233,000 $82,950,000 $75,088,000 $74,800,000
Total Scenario 1 $78,668,000 $127,254,000 $127,183,000 $127,255,000 $127,189,000 $127,255,000 $127,185,000
Data Source: Wells Gaming Research, May 2008
Revenue Impacts
Currently, there is no gaming activity in the southwest trade area of Kansas. The revenue
impacts for the mid case include a total of $49 million. Minor increases have been projected
for the 2012 gaming revenues.
Exhibit 5-14 Revenue Impacts for Scenario 1
Current Low Case Mid Case High Case
2007 2010 2012 2010 2012 2010 2012
*Ford County (Proposed) $0 $32,263,000 $32,464,000 $44,022,000 $44,239,000 $52,167,000 $52,385,000
All Existing Casinos $0 $16,767,000 $16,753,000 $5,009,000 $4,984,000 -$3,136,000 -$3,166,000
Total Scenario 1 $0 $49,030,000 $49,217,000 $49,031,000 $49,223,000 $49,031,000 $49,219,000
Data Source: Wells Gaming Research, May 2008

Kansas Casino Market Study & Gaming Revenue Projections
May 2008 Wells Gaming Research Page 5-12
Forecasted Flow of Funds
Scenario 1 shows that in 2007 the southwest trade area generated $79 million in total gaming
revenues (refer to the first section of Exhibit 5-15 captioned Scenario 1 Revenues ComingFrom). Of the total, an estimated $58 million (74%), was generated by casino players in
Kansas. As shown in the scenario 1 mid case for 2007, none of the $58 million stayed in
Kansas. Rather, it all went to Tribal casinos in Oklahoma (refer to the third section of
Exhibit 5-15 captioned Scenario 1 Mid Case - Revenues Going To).
Kansas has been projected to generated $103 million in 2010; however, the 2010 mid case
shows that Kansas would only retain $44 million, a net loss of $59 million. An estimated
$83 million would flow back to Oklahoma (the $24 million coming from Oklahoma and
Texas plus the $59 million coming from Kansas). Assuming no additional competition
enters the market, this trend could be expected to continue through 2012.
Exhibit 5-15 Flows of Gaming Revenue Funds for Scenario 1
Illustrates Where the Gaming Revenues Originated & Where They Went
Scenario 1 - Revenues Coming From
State 2007 % 2007 2008 2009 2010 % 2010 2011 2012 % 2012
KS $58,101,210 74% $57,818,892 $57,540,952 $102,869,150 81% $102,624,581 $102,388,917 81%
OK $17,727,675 23% $17,830,255 $17,932,721 $21,208,264 17% $21,382,157 $21,559,736 17%
TX $2,840,656 4% $2,865,391 $2,891,123 $3,176,700 2% $3,206,939 $3,237,134 3%
Total $78,669,541 100% $78,514,538 $78,364,796 $127,254,114 100% $127,213,677 $127,185,787 100%
Scenario 1 Low Case - Revenues Going To
State 2007 % 2007 2008 2009 2010 % 2010 2011 2012 % 2012
KS $0 0% $0 $0 $32,263,000 25% $32,362,000 $32,464,000 26%
OK $78,668,000 100% $78,512,000 $78,363,000 $94,991,000 75% $94,851,000 $94,719,000 74%
Total $78,668,000 100% $78,512,000 $78,363,000 $127,254,000 100% $127,213,000 $127,183,000 100%
Scenario 1 Mid Case - Revenues Going To
State 2007 % 2007 2008 2009 2010 % 2010 2011 2012 % 2012
KS $0 0% $0 $0 $44,022,000 35% $44,129,000 $44,239,000 35%
OK $78,668,000 100% $78,512,000 $78,363,000 $83,233,000 65% $83,085,000 $82,950,000 65%
Total $78,668,000 100% $78,512,000 $78,363,000 $127,255,000 100% $127,214,000 $127,189,000 100%
Scenario 1 High Case - Revenues Going To
State 2007 % 2007 2008 2009 2010 % 2010 2011 2012 % 2012
KS $0 0% $0 $0 $52,167,000 41% $52,273,000 $52,385,000 41%
OK $78,668,000 100% $78,512,000 $78,363,000 $75,088,000 59% $74,939,000 $74,800,000 59%
Total $78,668,000 100% $78,512,000 $78,363,000 $127,255,000 100% $127,212,000 $127,185,000 100%
Data Source: Wells Gaming Research, May 2008

Kansas Casino Market Study & Gaming Revenue Projections
May 2008 Wells Gaming Research Page 5-13
Scenario 2
Assumptions
Scenario 2 incorporates the casino in Ford County included in scenario 1, as well as the
following proposed expansions at Oklahoma casinos:
Oklahoma
1. Cherokee Casino Resort in Catoosa, OK (January 2009)
2. Kickapoo Casino in McLoud, OK (January 2009)
3. Osage Million Dollar Elm in Ponca City, OK (January 2009)
4. Creek Nation Casino in Tulsa, OK (September 2008
Revenue Projections
The following casino gaming revenue projections include WGR’s low, mid, and high case
forecasts for 2010 and 2012. The mid case projections show total casino gaming revenues of
approximately $127 million for the 2010 to 2012 period, almost identical to that of scenario
1. The added competition of the Oklahoma expansions simply shifts the distribution between
the two revenue categories.
Exhibit 5-16 Gaming Revenues Projections for Scenario 2
Includes Scenario 1 Plus the Proposed Expansions
Current Low Case Mid Case High Case
2007 2010 2012 2010 2012 2010 2012
*Ford County (Proposed) $0 $31,126,000 $31,325,000 $42,551,000 $42,767,000 $50,540,000 $50,759,000
All Existing Casinos $78,668,000 $96,128,000 $95,860,000 $84,702,000 $84,419,000 $76,714,000 $76,430,000
Total Scenario 1 $78,668,000 $127,254,000 $127,185,000 $127,253,000 $127,186,000 $127,254,000 $127,189,000
Data Source: Wells Gaming Research, May 2008
Revenue Impacts
The gaming revenue impacts show that the addition of the Oklahoma expansions results in a
negative difference of $ 2,000 between scenarios 1 and 2.
Exhibit 5-17 Revenue Impacts of Scenario 2
Current Low Case Mid Case High Case
2007 2010 2012 2010 2012 2010 2012
*Ford County (Proposed) $0 -$1,137,000 -$1,139,000 -$1,471,000 -$1,472,000 -$1,627,000 -$1,626,000
All Existing Casinos $0 $1,137,000 $1,141,000 $1,469,000 $1,469,000 $1,626,000 $1,630,000
Total Scenario 1 $0 $0 $2,000 -$2,000 -$3,000 -$1,000 $4,000
Data Source: Wells Gaming Research, May 2008

Kansas Casino Market Study & Gaming Revenue Projections
May 2008 Wells Gaming Research Page 5-14
Forecasted Flow of Funds
The addition of the casino in Ford County, together with the expansions at Oklahoma Tribal
casinos, would trigger changes in the following revenue flows. Kansas has been forecasted
to generate approximately $103 million in 2010 (refer to the first section of Exhibit 5-18
captioned Scenario 2 Revenues Coming From). However, in the 2010 mid case, Kansas has
been projected to retain $43 million (a net loss of $60.5 million). Refer to the third section of
Exhibit 5-18 captioned Scenario 2 Mid Case - Revenues Going To. Absent additional
competition, the foregoing revenue flows would most likely remain constant through 2012.
Exhibit 5-18 Flows of Gaming Revenue Funds for Scenario 2
Illustrates Where the Gaming Revenues Originated & When They Went
Scenario 2 - Revenues Coming From
State 2007 % 2007 2008 2009 2010 % 2010 2011 2012 % 2012
KS $58,101,210 74% $57,818,892 $57,540,952 $102,869,150 81% $102,624,581 $102,388,917 81%
OK $17,727,675 23% $17,830,255 $17,932,721 $21,208,264 17% $21,382,157 $21,559,736 17%
TX $2,840,656 4% $2,865,391 $2,891,123 $3,176,700 2% $3,206,939 $3,237,134 3%
Total $78,669,541 100% $78,514,538 $78,364,796 $127,254,114 100% $127,213,677 $127,185,787 100%
Scenario 2 Low Case - Revenues Going To
State 2007 % 2007 2008 2009 2010 % 2010 2011 2012 % 2012
KS $0 0% $0 $0 $31,126,000 24% $31,224,000 $31,325,000 25%
OK $78,668,000 100% $78,517,000 $78,362,000 $96,128,000 76% $95,988,000 $95,860,000 75%
Total $78,668,000 100% $78,517,000 $78,362,000 $127,254,000 100% $127,212,000 $127,185,000 100%
Scenario 2 Mid Case - Revenues Going To
State 2007 % 2007 2008 2009 2010 % 2010 2011 2012 % 2012
KS $0 0% $0 $0 $42,551,000 33% $42,657,000 $42,767,000 34%
OK $78,668,000 100% $78,517,000 $78,362,000 $84,702,000 67% $84,556,000 $84,419,000 66%
Total $78,668,000 100% $78,517,000 $78,362,000 $127,253,000 100% $127,213,000 $127,186,000 100%
Scenario 3 High Case - Revenues Going To
State 2007 % 2007 2008 2009 2010 % 2010 2011 2012 % 2012
KS $0 0% $0 $0 $50,540,000 40% $50,647,000 $50,759,000 40%
OK $78,668,000 100% $78,517,000 $78,362,000 $76,714,000 60% $76,568,000 $76,430,000 60%
Total $78,668,000 100% $78,517,000 $78,362,000 $127,254,000 100% $127,215,000 $127,189,000 100%
Data Source: Wells Gaming Research, May 2008

Kansas Casino Market Study & Gaming Revenue Projections
May 2008 Wells Gaming Research Page 5-15
Scenario 3Assumptions
Scenario 3 includes the assumptions in scenarios 1 and 2, as well as the following casinos
that are proposed for the southwest trade area:
Kansas
1. Camptown Greyhound Park in Frontenac, KS (January 2009)
2. Sumner County planned in Wellington, KS (January 2010)
3. Cherokee County planned in Baxter Springs, KS (January 2010)
Oklahoma
1. Downstream Casino Resort in Ottawa, OK (Jul 2008)
2. First Council Casino in Newkirk, OK (Mar 2008)
3. Ioway Casino Resort in Lincoln, OK (Jan 2009)
4. Pawnee Nation planned in Chilocco, OK
5. Ponca Tribe Oklahoma planned in Ponca City, OK
6. Seneca-Cayuga Tribes of Oklahoma planned in Grove, OK (Jul 2008)
7. Shawnee Tribe Oklahoma planned in Oklahoma City, OK
8. Wichita & Affiliated Tribes planned in Hinton, OK
Revenue Projections
Following in Exhibit 5-19 are WGR’s low, mid, and high case casino revenue forecasts for
scenario 3, 2010 and 2012. The mid case projections show gaming revenues of more than
$130 million for 2010 and 2012. The estimated revenue allocations project a reduction going
to Ford County, approximately $34 million (down from the $42 to $44 million range
projected in scenarios 2 and 1, respectively). Other revenue allocations include $41.5 million
allocated to other proposed casinos, and $55 million allocated to all existing casinos.
Exhibit 5-19 Revenues Forecasts for Scenario 3
Current Low Case Mid Case High Case
2007 2010 2012 2010 2012 2010 2012
*Ford County (Proposed) $0 $24,801,000 $24,985,000 $33,969,000 $34,181,000 $40,733,000 $40,957,000
Other Proposed Casinos $0 $45,112,000 $44,903,000 $41,477,000 $41,261,000 $38,779,000 $38,561,000
All Existing Casinos $78,668,000 $60,531,000 $60,432,000 $54,998,000 $54,877,900 $50,933,300 $50,804,100
Total Scenario 3 $78,668,000 $130,444,000 $130,320,000 $130,444,000 $130,319,900 $130,445,300 $130,322,100
Data Source: Wells Gaming Research, May 2008

Kansas Casino Market Study & Gaming Revenue Projections
May 2008 Wells Gaming Research Page 5-16
Revenue Impacts
Following are the combined gaming revenue impacts of scenarios 1 and 2, together with the
expansions proposed in scenario 3. These include the three casinos in Kansas and the eight
casinos in Oklahoma. Overall, the changes in gaming revenue would be limited to an
increase of approximately $3.2 million over the totals for scenarios 1 and 2.
Exhibit 5-20 Revenue Impacts for Scenario 3
Includes Scenario 1, the OK Expansions, & Three KS Casinos
Current Low Case Mid Case High Case
2007 2010 2012 2010 2012 2010 2012
*Ford County (Proposed) $0 -$6,325,000 -$6,340,000 -$8,582,000 -$8,586,000 -$9,807,000 -$9,802,000
*Other Proposed Casinos $0 $45,112,000 $44,903,000 $41,477,000 $41,261,000 $38,779,000 $38,561,000
All Existing Casinos $0 -$35,597,000 -$35,428,000 -$29,704,000 -$29,541,100 -$25,780,700 -$25,625,900
Total Scenario 3 $0 $3,190,000 $3,135,000 $3,191,000 $3,133,900 $3,191,300 $3,133,100
Data Source: Wells Gaming Research, May 2008

Kansas Casino Market Study & Gaming Revenue Projections
May 2008 Wells Gaming Research Page 5-17
Forecasted Flow of Funds
WGR’s projections for shifts in casino revenue flows, given the assumptions of scenario 3,
are summarized in Exhibit 5-21. Projections for Kansas include $106 million 2010 (refer to
the first section of Exhibit 5-21 captioned Scenario 3 Revenues Coming From). In the 2010
mid case estimates, less than one-half ($51 million) would go to Kansas. The net loss to
Kansas has been estimated at $55 million (refer to the third section of Exhibit 5-21 captioned
Scenario 3 Mid Case - Revenues Going To). Oklahoma and Texas combined are projected to
generate $24.3 million in 2010. However, nearly $80 million would flow back to Oklahoma
in the mid case. Without additional changes in the southwest trade area’s gaming market, the
2010 forecasts could be expected to remain constant through 2012.
Exhibit 5-21 Flows of Gaming Revenue Funds for Scenario 3
Illustrates Where the Gaming Revenue Originated & Where They Went
Scenario 3 - Revenues Coming From
State 2007 % 2007 2008 2009 2010 % 2010 2011 2012 % 2012
KS $58,101,210 74% $57,917,795 $57,639,207 $106,059,235 81% $105,785,654 $105,521,431 81%
OK $17,727,675 23% $17,832,355 $17,934,814 $21,210,349 16% $21,384,236 $21,561,807 17%
TX $2,840,656 4% $2,865,391 $2,891,123 $3,176,700 2% $3,206,939 $3,237,134 2%
Total $78,669,541 100% $78,615,541 $78,465,144 $130,446,284 100% $130,376,829 $130,320,372 100%
Scenario 3 - Low Case Revenues Going To
State 2007 % 2007 2008 2009 2010 % 2010 2011 2012 % 2012
KS $0 0% $0 $645,000 $42,730,000 33% $42,751,000 $42,774,000 33%
OK $78,668,000 100% $78,617,000 $77,820,000 $87,714,000 67% $87,628,000 $87,546,000 67%
Total $78,668,000 100% $78,617,000 $78,465,000 $130,444,000 100% $130,379,000 $130,320,000 100%
Scenario 3 - Mid Case Revenues Going To
State 2007 % 2007 2008 2009 2010 % 2010 2011 2012 % 2012
KS $0 0% $0 $645,000 $50,634,000 39% $50,668,000 $50,706,000 39%
OK $78,668,000 100% $78,617,000 $77,820,000 $79,810,000 61% $79,712,000 $79,613,900 61%
Total $78,668,000 100% $78,617,000 $78,465,000 $130,444,000 100% $130,380,000 $130,319,900 100%
Scenario 3 - High Case Revenues Going To
State 2007 % 2007 2008 2009 2010 % 2010 2011 2012 % 2012
KS $0 0% $0 $645,000 $56,446,000 43% $56,485,000 $56,531,000 43%
OK $78,668,000 100% $78,617,000 $77,820,000 $73,999,300 57% $73,888,300 $73,791,100 57%
Total $78,668,000 100% $78,617,000 $78,465,000 $130,445,300 100% $130,373,300 $130,322,100 100%
Data Source: Wells Gaming Research, May 2008

Kansas Casino Market Study & Gaming Revenue Projections
Wells Gaming Research
May 2008
Section 6

Kansas Casino Market Study & Gaming Revenue Projections
May 2008 Wells Gaming Research Page 6-1
Information on Wells Gaming Research & Richard H. Wells
Following is detailed information regarding Wells Gaming Research’s many services, as well
as personal information about Richard H. Wells, WGR’s president:
• Professional Services Offered (page 6-2)
• Casino Feasibility Studies (page 6-3)
• Casino Gaming Market Studies (page 6-3)
• Competitive Gaming Equipment Inventories (page 6-4)
• Litigation & Legislative Support (page 6-4)
• Marketing Research (page 6-4)
• Marketing Surveys (page 6-5)
• Market & Financial Due Diligence (page 6-5)
• Financial Benchmark Studies (page 6-5)
• Special Projects (page 6-5)
• Other Casino Gaming Services (page 6-6)
• Corporate Background (page 6-6)
• Online Casino Player Count Service™ (page 6-7)
• Richard H. Wells, Experience and Qualifications (page 6-8)
• Client List, including current and previous WGR clients (page 6-9)

Kansas Casino Market Study & Gaming Revenue Projections
May 2008 Wells Gaming Research Page 6-2
Professional Services Offered:
Wells Gaming Research (hereinafter referred to as WGR) is a highly respected provider of a
wide-range of research and advisory services for the casino gaming industry.
Casino Player Count Service™:
WGR's Casino Player Count Service™ has become the standard for measuring relative
player count performance within the casino gaming industry. Our player count service is
widely used by casinos, as well as by equity analysts who track public gaming companies.
WGR’s weekly online player count reports are accompanied by a host of powerful, user
friendly analytical tools that make it quick and easy for a client casino to monitor the
competition. Client casinos can log on to WGR’s website and evaluate their competitors
using the following performance criteria:
• Casino rankings based on player count volume
• Number of table game and/or slot machine players
• Percent distribution of players
• Gaming capacity inventory for both table games and slot machines
• Percent distribution of market capacity
• Percent of capacity utilized
• User defined market fair share percentages
Fair Share Goal Setting Targets for User Defined Markets
One of the newest and most exciting features of WGR’s Casino Player Count Service™ is
fair share goal setting for user-defined markets. WGR’s online player count service
automatically calculates the number of players required for a casino to reach a series of fair
market share targets (for example, 100%, 105%, and 110%).
Gaming Capacity Inventories
WGR updates the gaming capacity inventory statistics for the player count service on a
quarterly basis. Client casinos can easily monitor capacity adjustments for both table games
and slot machines for their casino, as well as for their competitors. WGR’s website also
provides a capacity trend analysis feature.
Equity Analysts
Equity analysts use WGR’s Casino Player Count Service™ reports to monitor player counts
for individual casinos owned by public companies, and to track entire market areas. WGR’s
player count statistics are also given consideration by equity analysts when forecasting
quarterly casino revenues.
Data Collection for WGR’s Casino Player Count Service
WGR’s field representatives physically count casino players five or more times per week in
164 casinos located throughout the U.S. WGR’s current player count service areas include
California, Louisiana, Mississippi, Nevada, and New Mexico.

Kansas Casino Market Study & Gaming Revenue Projections
May 2008 Wells Gaming Research Page 6-3
Casino Feasibility Studies
WGR’s databases contain a detailed history of casino player counts collected in eleven major
gaming markets located throughout the U.S. This exclusive player count information
provides WGR with a proprietary resource that is unmatched for projecting player volume,
which is a key variable in the revenue function.
WGR has conducted casino feasibility studies and financial projections for a number of new
casinos, including those proposed in:
• Mississippi – Tunica.
• Nevada - Las Vegas (the Strip, the Offstrip, and North Las Vegas), as well as for
Reno, Henderson, and Jackpot.
• Nova Scotia - Halifax and Sydney.
Casino Gaming Market Studies
WGR’s databases contain over 350,000 casino player counts collected between 1990 and
2007. Capacity information is collected and updated regularly on each casino’s inventory
capacity mix of slot machines and table games. The player count data allows WGR to track
individual casinos, groups of casinos, and casino markets more closely and accurately than
any other organization except the state gaming regulatory authorities.
WGR has developed a custom casino gravity modeling system designed to forecast casino
revenues while taking into account the impacts that new or expanded competing casinos
could have on the project. The model is customized to include the appropriate trade area and
competitive casinos for each project.
Major market studies include:
• Las Vegas, Nevada area (Strip, Offstrip, North Las Vegas, & Henderson)
• Reno & Sparks, Nevada
• Minden/Gardnerville, Nevada
• Carson City, Nevada
• Northern California
• South Lake Tahoe
• Mississippi (Tunica, Natchez, & Vicksburg)
• Shreveport, Louisiana
• Iowa (Spencer, Ottumwa, Emmetsburg, Waterloo, Davenport, & Bettendorf)
• Sugar Creek, Missouri
• Southern Kansas
• Southern Indiana
• North-East Kentucky

Kansas Casino Market Study & Gaming Revenue Projections
May 2008 Wells Gaming Research Page 6-4
Competitive Gaming Equipment Inventories
WGR conducts capacity inventories of slot machines, electronic player tracking systems, and
other gaming equipment located in casinos throughout the U.S. The client selects the casinos
to be inventoried. Then, WGR conducts the equipment inventories and does the comparative
analyses. WGR's clients include both casinos and major slot machine manufacturers. Slot
machine inventory projects include:
• 38 Tribal casinos in California.
• 108,000 slot machines located in 50 U.S. casinos, as well as five Canadian casinos
(inventories are conducted twice each year).
• 18,000 slot machines located in eight large Las Vegas casinos.
Litigation & Legislative Support
WGR provides a host of gaming related services to attorneys in the form of:
• Financial and market analyses
• Expert testimony and depositions
• Analyses of opposing expert reports
• Development of questions for depositions
• Development of exhibits for use in court
• Competitive analyses for anti-trust issues
• Exhibits, documents, and expert testimony for legislative issues
Marketing Research
WGR has conducted a wide variety of gaming related marketing research studies for casino
clients, as well as for proprietary internal use. For example, WGR has analyzed:
• The demographics and gambling characteristics of golfers on a nationwide basis.
• The gambling and demographic characteristics of local residents in both Reno and
Las Vegas.
• The growth of various forms of gaming in Reno's four major feeder markets
(California, Oregon, Washington, and British Columbia).

Kansas Casino Market Study & Gaming Revenue Projections
May 2008 Wells Gaming Research Page 6-5
Marketing Surveys
Recent market research surveys include:
• 600 Las Vegas Strip visitors for a casino client
• 465 slot directors for a slot manufacturer
• 900 gaming establishments for a slot manufacturer
• 600 telephone inquiries to casino slot departments regarding online slot machine
systems
Market & Financial Due Diligence
WGR is well positioned to assist casino buyers in evaluating gaming markets in terms of:
• Competition
• Financial and operating performance
• Improvement potential of casino acquisition candidates
Financial Benchmark Studies
WGR conducts financial benchmark studies for existing casinos. Both revenue and expense
line items are compared with a casino's peer group of competitors. Differences are flagged.
One such study greatly aided the Client in improving its financial performance and in turning
losses into profits.
Special Projects
WGR conducts special projects on an ongoing basis. Some examples include:
• Casino market supply and demand analyses
• Slot and table game trends
• Casino player trend analyses
• Utilization analyses (table games including Caribbean Stud and Let-It-Ride, as well
as slot machines and automatic shuffler)
• Competitive analyses of slot machine inventories and utilization
• Table game instruction programs
• Average bets by table minimums for blackjack and craps
• Player counts by ethnic groups
Kansas Casino Market Study & Gaming Revenue Projections
May 2008 Wells Gaming Research Page 6-6
Other Casino Gaming Services
Slot Payback Certification
WGR provides verification and certification of win percentages for slot machines and video
poker machines. Casinos have successfully used the win percentages in advertising
campaigns.
Pedestrian Traffic Counts
WGR has conducted pedestrian traffic studies to determine pedestrian volumes, directions,
and other characteristics of pedestrian traffic behavior in targeted areas in Las Vegas and
Reno. Two specific locations were the intersection of Las Vegas Boulevard and Tropicana
Avenue in Las Vegas and on Virginia Street in downtown Reno.
Special Event Attendance
WGR conducts attendance counts at special events, primarily in Nevada (Reno, Las Vegas,
and Laughlin) for convention authorities and other clients. WGR has conducted attendance
counts at most of Reno’s special events.
Corporate Background
WGR was established in 1990. In 1995, WGR was incorporated under the laws of the State
of Nevada.
WGR is a privately held corporation. The principal officers include Richard H. Wells,
President and Peggy P. Wells, Vice President and Secretary/Treasurer.
WGR’s president, Richard H. Wells, has over thirty years of experience in conducting
financial and market feasibility studies for the casino, hotel, banking, and oil and gas
industries. Wells is supported by a well-trained staff with experience and expertise in
computer programming, finance, economics, and market analyses.
In addition to the staff, WGR subcontracts, on an as-needed basis, with highly qualified and
respected professionals who specialize in a wide-range of technical disciplines including
marketing research, statistics, demographic statistics and data analyses, economic and social
impact analyses, and legal counsel.

Kansas Casino Market Study & Gaming Revenue Projections
May 2008 Wells Gaming Research Page 6-7
Online Casino Player Count Service™
WGR has converted its player count reporting system from a weekly hard copy report to a
suite of powerful, online, easy-to-use reporting and analysis tools. The Internet now makes it
possible for WGR to share these tools with our clients.
WGR is not only providing its Casino Player Count Service™ Reports online via the
Internet, we are also providing our clients with a host of online analytical tools. For
example, WGR’s clients can now select a specific set of competitive casinos and time
periods to conduct custom analyses.
A total of seven (7) online reporting menu options are offered:
1. Monthly
2. Weekly
3. Daily
4. Multi-Month Trend Analysis
5. User Defined Two-Period Comparisons
6. Capacity Trend Analysis
7. Average Counts by Day-of-Week or Time-of-Day
Four (4) options are provided for viewing, downloading, and printing the user defined
reports:
1. Web Browser,
2. Tab Delimited Download (Excel or other spreadsheet compatible)
3. PDF file uncompressed
4. PDF file compressed (ZIP)
Weekend player counts are now available to our clients by Monday afternoon, 5PM Pacific
Time. All weekly player count data is audited and finalized by Thursday afternoon, 5PM
Pacific Time. This puts the player count data in the clients’ hands several days earlier than
the hard copy reports.
Online Access & Client Training:
Each person in our Client's organization who needs access to WGR online service will be
assigned a username and password for secure website access. WGR's clients are allowed an
unlimited number of users, at no additional cost.
WGR will conduct a training session to acquaint Client users with the new online system.
WGR's new online reporting system is easy-to-use and quick at creating user defined custom
player count reports. A half-hour training/orientation session is all that is needed for a user
to get started with WGR's new online reporting system.

Kansas Casino Market Study & Gaming Revenue Projections
May 2008 Wells Gaming Research Page 6-8
Richard H. Wells, Experience & Qualifications
Wells is founder and president of Wells Gaming
Research, a Nevada Corporation that provides
Casino Player Count Service™, a market share
tracking service, to over 160 casino clients in
Nevada, Mississippi, Louisiana, New Mexico, and
California.
Wells Gaming Research also performs a wide range
of consulting and gaming research assignments
including casino market studies, financial feasibility
studies, financial projections, due diligence,
litigation support, legislative issue support, and
gaming industry expert witness services for the
gaming industry.
Wells has fifteen years experience as a senior executive in the casino-hotel industry with
Holiday Inns, Harrah’s, and Bally’s. Wells has also held positions in management, planning,
and financial analysis for a large regional bank and a major international oil company.
Wells has a B.S. degree in business from Oklahoma State University and completed a post-
graduate program in Systems Dynamics at M.I.T. Wells has participated in a wide range of
community service activities and is listed in Marquis Who’s Who in Finance and Industry
and Marquis Who's Who in America.

Kansas Casino Market Study & Gaming Revenue Projections
May 2008 Wells Gaming Research Page 6-9
Wells Gaming Research Client List(Current and/or Prior Customers)
Aladdin Gaming, LLC: GEM, LLC ~ Reno, Nevada
Aladdin Resort & Casino ~ Las Vegas, Nevada Harrah's Casino Hotel ~ Lake Tahoe, Nevada
Ameristar Casinos, Inc. ~ Las Vegas, Nevada Harrah's Casino Hotel ~ Laughlin, Nevada
Alamo Travel Center ~ Sparks, Nevada Harrah's Hotel Casino ~ Reno, Nevada
Aristocrat Technologies, Inc. ~ Las Vegas, Nevada Harrah's Hotel Casino ~ Tunica, Mississippi
Arizona Charlie's Casino Hotel ~ Las Vegas, Nevada Hollywood Casino ~ Tunica, Mississippi
Arizona Charlie's East Casino Hotel ~ Las Vegas, Nevada Horseshoe Casino & Hotel ~ Bossier City, Louisiana
Avi Resort & Casino ~ Laughlin, Nevada Innovative Gaming Corporation of America
Baldini's Sports Casino ~ Reno, Nevada International Gaming Technology
Bear Stearns Companies, Inc. Isle of Capri Casinos, Inc.:
Binion's Horseshoe ~ Tunica, Mississippi Isle of Capri Casino ~ Bossier City, Louisiana
Boyd Gaming Corporation: Isle of Capri Casino ~ Biloxi, Mississippi
California Hotel & Casino ~ Las Vegas, Nevada Isle of Capri Casino - Lula, Mississippi
Fremont Hotel & Casino ~ Las Vegas, Nevada Isle of Capri Casino - Vicksburg, Mississippi
Main Street Station Hotel Casino ~ Las Vegas, Nevada Isleta Casino & Resort - Albuquerque, New Mexico
Sam's Town Hotel & Gambling Hall ~ Las Vegas, NV ITT Sheraton Gaming Division
Sam's Town Tunica Hotel & Gambling Hall ~ Tunica, MS John Ascuaga's Nugget ~ Reno, Nevada
Stardust Resort & Casino ~ Las Vegas, Nevada Lady Luck Hotel Casino ~ Las Vegas, Nevada
Bronco Billy's Sports Bar & Casino ~ Cripple Creek, CO Little Creek Casino ~ Shelton, Washington
Caesars Palace Hotel & Casino ~ Las Vegas, Nevada Majestic Star Casinos:
Cannery Casino Hotel ~ Las Vegas, Nevada Fitzgeralds Hotel Casino ~ Las Vegas, Nevada
Clay County Gaming Initiative, Inc. ~ Clay Co, Iowa Fitzgeralds Hotel Casino ~ Tunica, Mississippi
Club Cal-Neva/Virginian Hotel Casino ~ Reno, Nevada Mandalay Resort Group:
Coast Hotel & Casinos, Inc.: Circus Circus Hotel Casino ~ Reno, Nevada
Gold Coast Hotel Casino ~ Las Vegas, Nevada Circus Circus Hotel Resort & Casino ~ Las Vegas, NV
Suncoast Hotel & Casino ~ Las Vegas, Nevada Colorado Belle Hotel & Casino ~ Laughlin, Nevada
The Orleans Hotel & Casino ~ Las Vegas, Nevada Edgewater Hotel & Casino ~ Laughlin, Nevada
Copa Casino ~ Gulfport, Mississippi Excalibur Resort Hotel & Casino ~ Las Vegas, Nevada
DRKW - Grantchester, Inc. ~ New York, New York Gold Strike Casino & Resort ~ Tunica, Mississippi
Eldorado Hotel Casino ~ Reno, Nevada Luxor Resort Hotel & Casino ~ Las Vegas, Nevada
Fallon Paiute-Shoshone Tribe ~ Fallon, Nevada Mandalay Bay Resort & Casino ~ Las Vegas, Nevada
Fidelity Investments ~ Boston Monte Carlo Resort & Casino ~ Las Vegas, Nevada
Fitzgeralds Hotel Casino ~ Reno, Nevada Silver City ~ Las Vegas, Nevada
Four Queens Hotel Casino ~ Las Vegas, Nevada Silver Legacy Resort & Casino ~ Reno, Nevada
Greenspun Corporation ~ Las Vegas, Nevada Slots-A-Fun ~ Las Vegas, Nevada
Guild, Russell, Gallagher, & Fuller, LTD ~ Reno, Nevada Monarch Casino & Resort, Inc.:
Galleria Associates ~ Henderson, Nevada Atlantis Casino Resort ~ Reno, Nevada
Golden Phoenix Hotel Casino ~ Reno, Nevada

Kansas Casino Market Study & Gaming Revenue Projections
May 2008 Wells Gaming Research Page 6-10
Wells Gaming Research Client List (Continued)(Current and/or Prior Customers)
Mikhon Gaming Corporation Ramada Inn Speakeasy Casino ~ Reno, Nevada
Nevada Resort Association ~ Las Vegas, Nevada Rampart Casino ~ Las Vegas, Nevada
MGM • Mirage: Reno/Sparks Convention & Visitor’s Authority
Beau Rivage Hotel & Casino ~ Biloxi, Mississippi Rio Suite Hotel Casino ~ Las Vegas, Nevada
Bellagio Hotel & Casino ~ Las Vegas, Nevada River Palms Resort Casino ~ Laughlin, Nevada
Golden Nugget Hotel & Casino ~ Laughlin, Nevada Riverside Resort Hotel Casino ~ Laughlin, Nevada
MGM Grand Hotel Casino ~ Las Vegas, Nevada Riviera Hotel & Casino ~ Las Vegas, Nevada
New York New York Hotel & Casino ~ Las Vegas, NV Sands Regency Hotel Casino ~ Reno, Nevada
The Mirage Hotel & Casino ~ Las Vegas, Nevada Seven Circle Resorts, Inc.
Treasure Island at the Mirage ~ Las Vegas, Nevada Sheraton Casino ~ Halifax, Novia Scotia
Palms Casino Hotel ~ Las Vegas, Nevada Sheraton Hotel Casino ~ Tunica, Mississippi
Park Place Entertainment: Showboat Hotel Casino ~ Las Vegas, Nevada
Bally's Casino Las Vegas ~ Las Vegas, Nevada Si Redd's Oasis Hotel & Casino ~ Mesquite, Nevada
Bally's Casino Tunica ~ Tunica, Mississippi Silicon Gaming, Inc.
Flamingo Las Vegas ~ Las Vegas, Nevada Silver Club Hotel Casino ~ Sparks, Nevada
Flamingo Laughlin ~ Laughlin, Nevada Silverton Hotel & Casino ~ Las Vegas, Nevada
Grand Casino Biloxi ~ Biloxi, Mississippi Station Casinos, Inc.:
Grand Casino Gulfport ~ Gulfport, Mississippi Boulder Station Hotel & Casino ~ Las Vegas, NV
Grand Casino Tunica ~ Tunica, Mississippi Fiesta Henderson ~ Las Vegas, Nevada
Las Vegas Hilton ~ Las Vegas, Nevada Fiesta Rancho Casino Hotel ~ Las Vegas, Nevada
Oshea's ~ Las Vegas, Nevada Green Valley Ranch Resort & Spa ~ Las Vegas, NV
Paris Las Vegas ~ Las Vegas, Nevada Palace Station Hotel & Casino ~ Las Vegas, Nevada
Reno Hilton ~ Reno, Nevada Santa Fe Station Hotel Casino ~ Las Vegas, Nevada
Sheraton Casino ~ Tunica, Mississippi Sunset Station Hotel & Casino ~ Las Vegas, Nevada
Peppermill, Inc.: Texas Station Gambling Hall & Hotel ~ Las Vegas, NV
Peppermill Hotel Casino ~ Reno, Nevada Stratosphere Casino Hotel & Tower ~ Las Vegas, Nevada
Western Village Inn & Casino ~ Sparks, Nevada Terrible's Casino Hotel ~ Las Vegas, Nevada
Penn National Gaming, Inc. Thunder Valley Casino ~ Lincoln, California
Boomtown Casino ~ Biloxi, Mississippi Treasure Bay Casino Resort ~ Biloxi, Mississippi
Casino Magic ~ Bay St. Louis, Mississippi Tropicana Hotel Casino ~ Las Vegas, Nevada
Pinnacle Entertainment, Inc.: Tuscany Hotel & Casino ~ Las Vegas, Nevada
Boomtown Hotel • Casino • RV Park ~ Reno, Nevada Venetian Resort Hotel Casino ~ Las Vegas, Nevada
Casino Magic ~ Biloxi, Mississippi WMS Gaming Inc. ~ Waukegan, Illinois
Boomtown Casino ~ Bossier City, Louisiana Wild Game NG:
R&R Advertising Siena Hotel Spa & Casino ~ Reno, Nevada
Rail City Casino ~ Sparks Wynne Resorts, LTD ~ Las Vegas, Nevada
Ramada Express Hotel & Casino ~ Laughlin, Nevada Zeh Saint-Aubin Spoo ~ Reno, Nevada