Embed Size (px)
Citation preview

KANSAS DEPARTMENT OF HEALTH AND ENVIRONMENT BUREAU OF DISEASE CONTROL & PREVENTION
STI/HIV PROGRAM
TABLE OF CONTENTS
January - December 2017
Reported Rates of Chlamydia by Age
Reported Rates of Chlamydia by Race/Ethnicity
Reported Rates of Chlamydia by Gender
Reported Rates of Chlamydia by County
Reported Rates of Gonorrhea by Age
Reported Rates of Gonorrhea by Race/Ethnicity
Reported Rates of Gonorrhea by Gender
Reported Rates of Gonorrhea by County
Reported Rates of Early Syphilis by Age
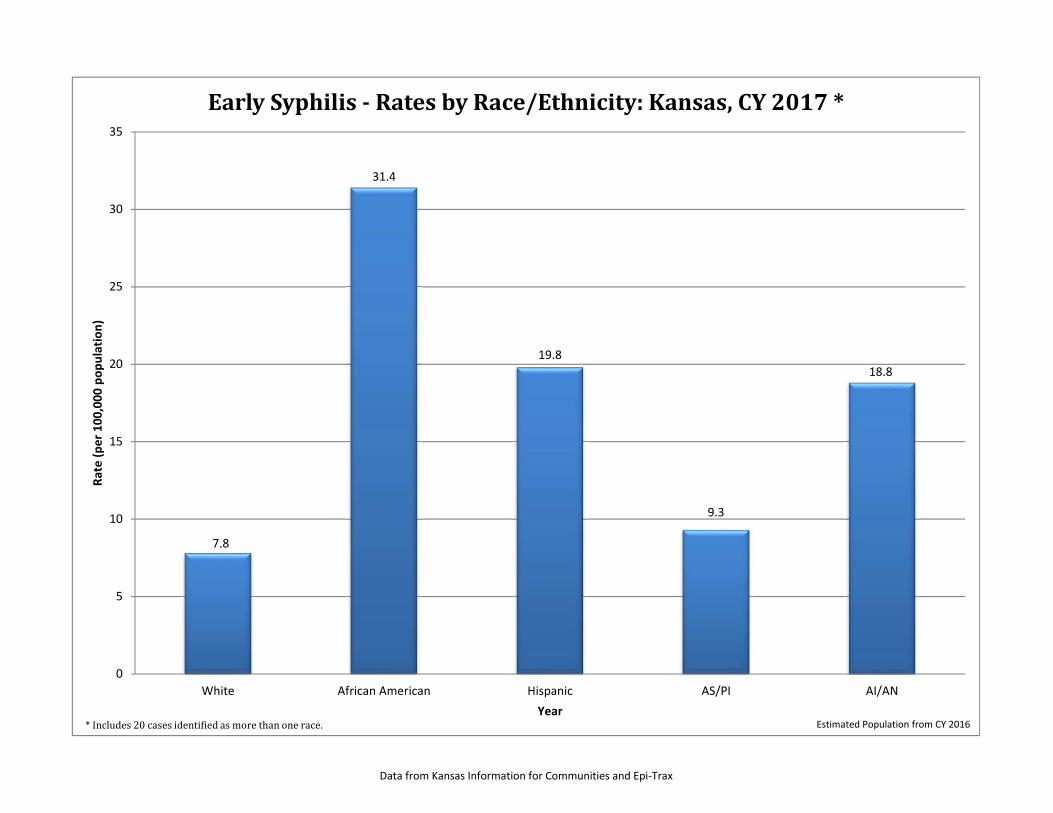
Reported Rates of Early Syphilis by Race/Ethnicity
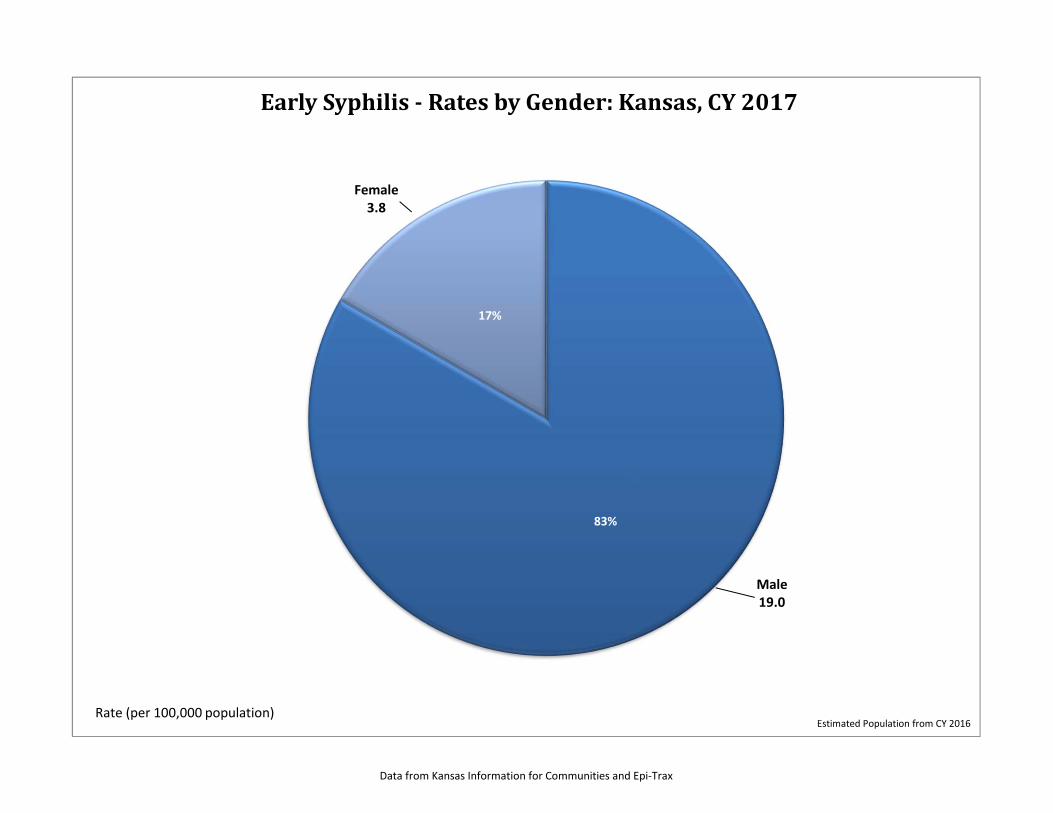
Reported Rates of Early Syphilis by Gender

Data from Kansas Information for Communities and Epi‐Trax
1.0 23.6
1,928.5
2,467.3
1,230.1
495.6
276.2
35.9 ‐
500.0
1,000.0
1,500.0
2,000.0
2,500.0
3,000.0
Age 0‐9 Age 10‐14 Age 15‐19 Age 20‐24 Age 25‐29 Age 30‐34 Age 35‐39 Age 40+
Rate (p
er 100,000
pop
ulation)
Year
Chlamydia‐ RatesbyAge:Kansas,CY2017
Estimated Population from CY 2016
Data from Kansas Information for Communities and Epi‐Trax
210.4
1,192.70
468.9
129.6
380.9
0
200
400
600
800
1000
1200
1400
White African American Hispanic AS/PI AI/AN
Rate (p
er 100,000
pop
ulation)
Year
Chlamydia‐ RatesbyRace/Ethnicity:KansasCY2017*
Estimated Population from CY 2016*Includes100 casesidentifiedasmorethanonerace.
Data from Kansas Information for Communities and Epi‐Trax
30%
70%
Chlamydia‐ RatesbyGender:Kansas,CY2017
Rate (per 100,000 population)Estimated Population from CY 2016
Female648.8
Male281.7

Butler
Ford
Reno
Ellis
Ness
Elk
Gove
Finney
Clark
Lyon
Gray
Logan
Barber
Rice
Smith
Trego
Pratt
CowleySumner
Jewell
Clay
Lane
Linn
Meade
Rooks
Scott
MarionRush
Rawlins
Barton
Thomas
Norton Phillips
Riley
Kearny
Cloud
Russell
Chase
Kiowa
Harper
Sherman
Wallace
Saline
Decatur
Hamilton
Morris
Graham
Osage
Marshall
Sedgwick
Morton
Osborne
Grant
Coffey
Stafford
Ottawa
Allen
Lincoln
Cheyenne
Sheridan
Greenwood
GreeleyMiami
Kingman
Wichita
Mitchell
Pawnee
Brown
Stevens
Stanton
Dickinson
Labette
Wilson
Nemaha
Seward
Republic
Jackson
McPherson
Ellsworth
Haskell
Hodgeman
Washington
HarveyBourbon
Neosho
Comanche
Franklin
Edwards
WabaunseeGeary
Crawford
Pottawatomie
Cherokee
Anderson
Jefferson
Shawnee
Douglas Johnson
Woodson
Chautauqua
Atchison
Doniphan
Montgomery
Leaven-worth
Wyandotte
75.2 78.5 137.9147.421.3211.9 162.3109.2 193.2 117.2
247.8
192.2119.6 80.1 208.8 207.1
168.997.6
211.9133.6 38.6 128.8174.1
110.6 215.3227.5
122.2231.5 33.8 130.8
132.1 187.3223.8118.6
148.3
197.2213.9
237.6
65.0204.2
149.4
116.0
194.0 80.5 206.4227.7117.8
213.5 144.8 213.3210.7 89.5 193.5 330.9326.0
275.3 326.2
426.2 413.8299.1
469.4 392.8 334.9 691.3 301.6390.3
491.8654.0
304.7
901.5
346.2640.3 732.6 345.1498.7
290.3
516.3
258.2331.4 258.3 384.7
295.1
255.5 355.7
816.9408.5 346.6
468.2
295.4
252.8 328.4
426.8594.5
302.6299.6287.7 284.9 451.9
343.8 414.0563.7 378.7 371.7
0.0 0.1 - 50.0 50.1 - 150.0 150.1 - 250.0 > 250.0
Chlamydia - Rates by County:January - December 2017
Rate (per 100,000 population) Confirmed Case(s):
Data Source: Estimated Population from CY 2016, Kansas Information for Communities and Epi-Trax database.Provided by: KS Department of Health and Environment, Bureau of Disease Control and Prevention
Note: The total rate of chlamydia for Kansas was 466.1 per 100,000 population.
Data from Kansas Information for Communities and Epi‐Trax
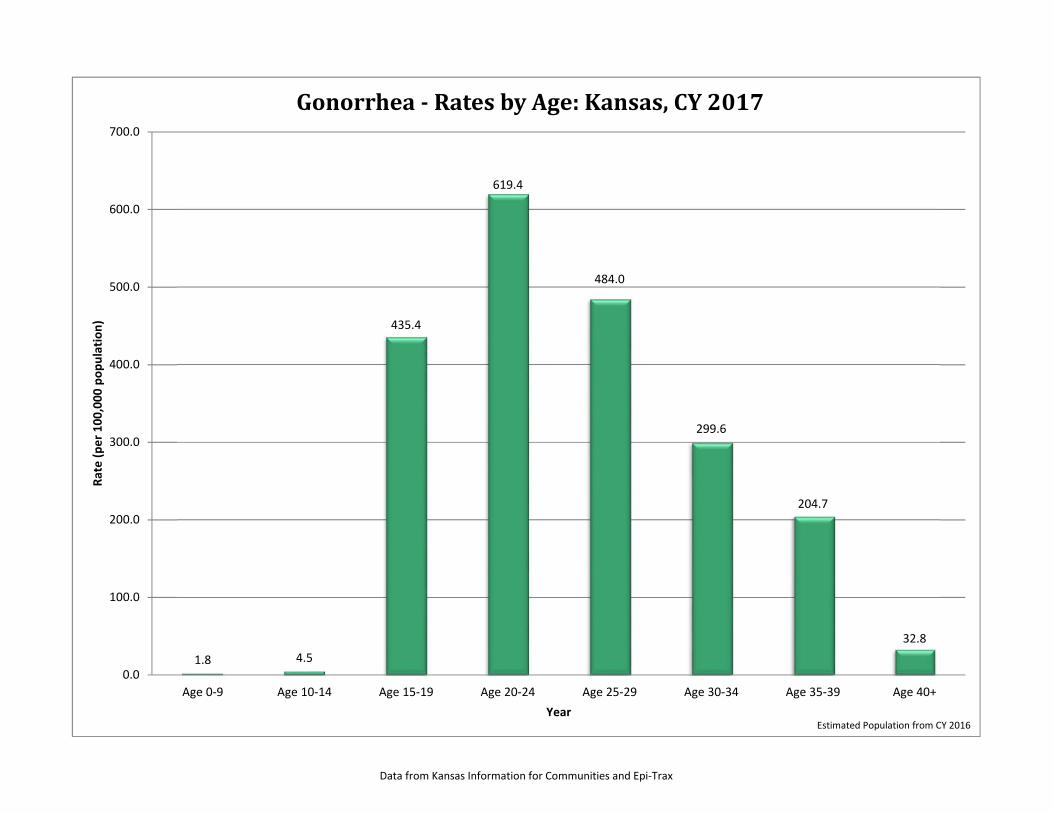
1.8 4.5
435.4
619.4
484.0
299.6
204.7
32.8
0.0
100.0
200.0
300.0
400.0
500.0
600.0
700.0
Age 0‐9 Age 10‐14 Age 15‐19 Age 20‐24 Age 25‐29 Age 30‐34 Age 35‐39 Age 40+
Rate (p
er 100,000
pop
ulation)
Year
Gonorrhea‐ RatesbyAge:Kansas,CY2017
Estimated Population from CY 2016

Data from Kansas Information for Communities and Epi‐Trax
76.3
756.6
141.8
50.8
148.1
0
100
200
300
400
500
600
700
800
White African American Hispanic AS/PI AI/AN
Rate (p
er 100,000
pop
ulation)
Year
Gonorrhea‐ RatesbyRace/Ethnicity:Kansas,CY2017*
Estimated Population from CY 2016*Includes51 casesidentifiedasmorethanonerace.
Data from Kansas Information for Communities and Epi‐Trax
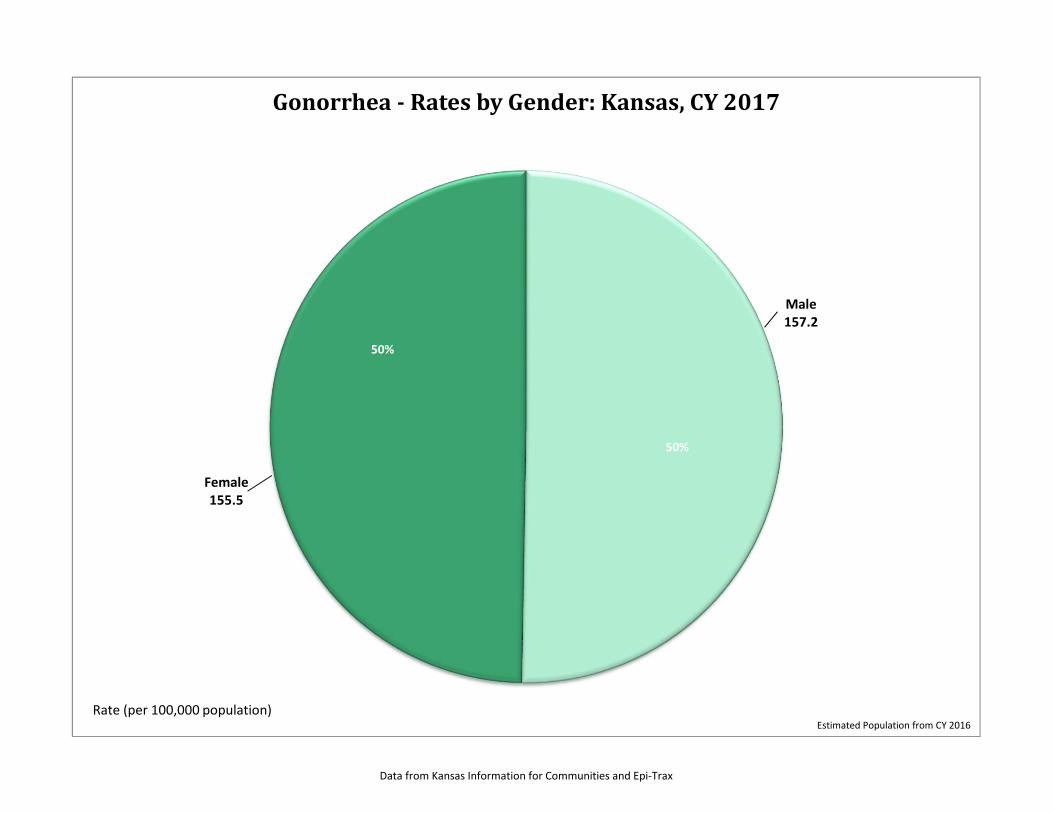
50%
50%
Gonorrhea‐ RatesbyGender:Kansas,CY2017
Rate (per 100,000 population)Estimated Population from CY 2016
Male157.2
Female155.5
Butler
Ford
Reno
Ellis
Ness
Elk
Gove
Finney
Clark
Lyon
Gray
Logan
Barber
Rice
Smith
Trego
Pratt
CowleySumner
Jewell
Clay
Lane
Linn
Meade
Rooks
Scott
MarionRush
Rawlins
Barton
Thomas
Norton Phillips
Riley
Kearny
Cloud
Russell
Chase
Kiowa
Harper
Sherman
Wallace
Saline
Decatur
Hamilton
Morris
Graham
Osage
Marshall
Sedgwick
Morton
Osborne
Grant
Coffey
Stafford
Ottawa
Allen
Lincoln
Cheyenne
Sheridan
Greenwood
GreeleyMiami
Kingman
Wichita
Mitchell
Pawnee
Brown
Stevens
Stanton
Dickinson
Labette
Wilson
Nemaha
Seward
Republic
Jackson
McPherson
Ellsworth
Haskell
Hodgeman
Washington
HarveyBourbon
Neosho
Comanche
Franklin
Edwards
WabaunseeGeary
Crawford
Pottawatomie
Cherokee
Anderson
Jefferson
Shawnee
Douglas Johnson
Woodson
Chautauqua
Atchison
Doniphan
Montgomery
Leaven-worth
Wyandotte
37.6 21.3 18.0 40.7 9.8
25.3 27.539.9 32.039.0 36.8
16.932.5
35.3 28.6
15.8 35.9
41.7 24.8 37.5 20.9
47.5
48.8 31.6 23.6 34.2
40.3 45.940.2
48.4 17.6 59.359.3
55.170.6103.3
104.4
127.9116.0
150.9120.0
54.9100.5
167.1
143.3334.6
87.1
379.7
78.758.8 220.2 99.4163.2
107.3
77.6
50.9 66.7
79.5 65.4 97.1
71.263.9
277.8102.1
53.591.7
82.368.1 70.1
67.7255.7
125.2124.865.4 68.1 76.6
78.5
85.9 128.771.2 96.5 128.0 85.5 132.1
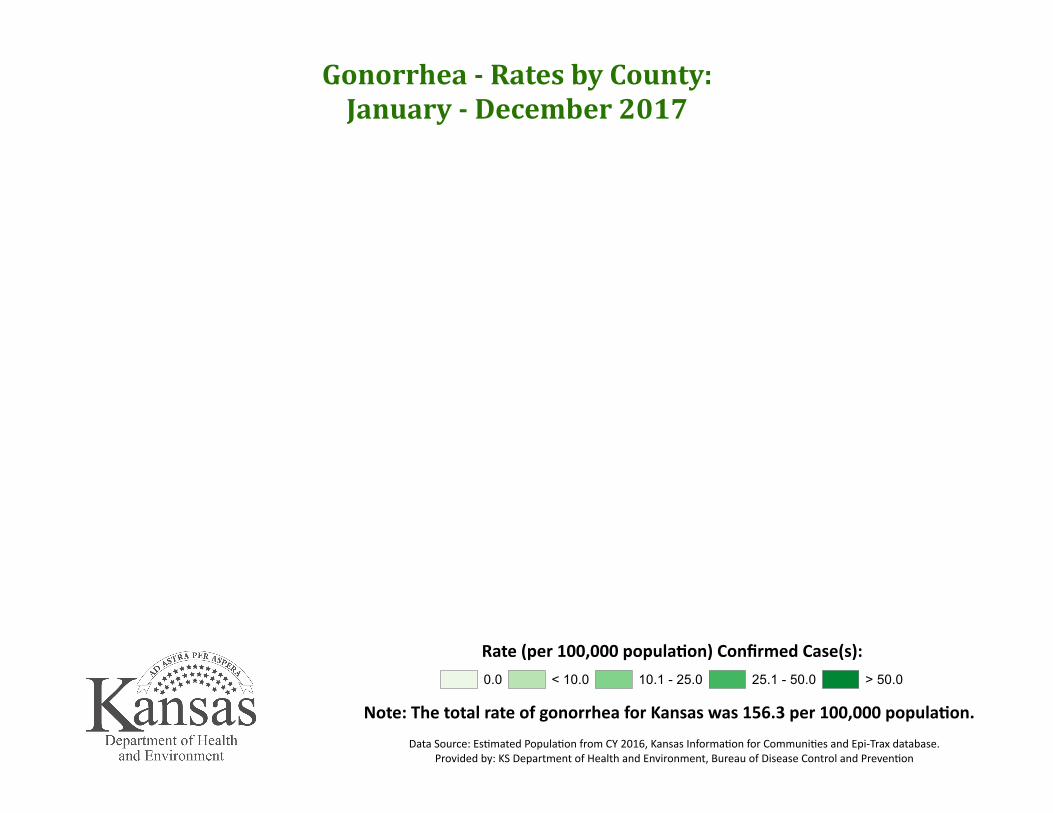
Gonorrhea - Rates by County:January - December 2017
Data Source: Estimated Population from CY 2016, Kansas Information for Communities and Epi-Trax database.Provided by: KS Department of Health and Environment, Bureau of Disease Control and Prevention
0.0 < 10.0 10.1 - 25.0 25.1 - 50.0 > 50.0
Note: The total rate of gonorrhea for Kansas was 156.3 per 100,000 population.
Rate (per 100,000 population) Confirmed Case(s):
Data from Kansas Information for Communities and Epi‐Trax
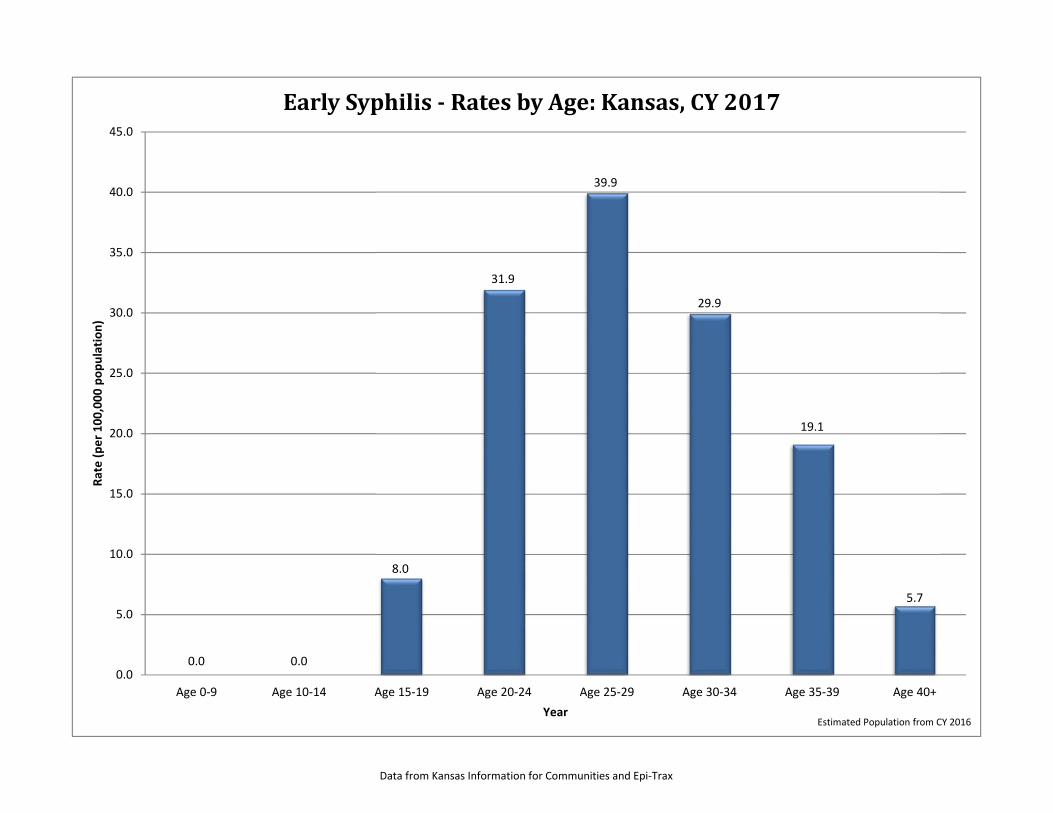
0.0 0.0
8.0
31.9
39.9
29.9
19.1
5.7
0.0
5.0
10.0
15.0
20.0
25.0
30.0
35.0
40.0
45.0
Age 0‐9 Age 10‐14 Age 15‐19 Age 20‐24 Age 25‐29 Age 30‐34 Age 35‐39 Age 40+
Rate (p
er 100,000
pop
ulation)
Year
EarlySyphilis‐ RatesbyAge:Kansas,CY2017
Estimated Population from CY 2016
Data from Kansas Information for Communities and Epi‐Trax
7.8
31.4
19.8
9.3
18.8
0
5
10
15
20
25
30
35
White African American Hispanic AS/PI AI/AN
Rate (p
er 100,000
pop
ulation)
Year
EarlySyphilis‐ RatesbyRace/Ethnicity:Kansas,CY2017*
Estimated Population from CY 2016*Includes20casesidentifiedasmorethanonerace.
Data from Kansas Information for Communities and Epi‐Trax
83%
17%
EarlySyphilis‐ RatesbyGender:Kansas,CY2017
Rate (per 100,000 population)Estimated Population from CY 2016
Female3.8
Male19.0