Embed Size (px)
Citation preview
KANSAS PUBLIC EMPLOYEES RETIREMENT SYSTEMCOST-SHARING MULTIPLE-EMPLOYER
DEFINED BENEFIT PENSION PLAN
Schedules of Employer and Nonemployer Allocations andSchedules of Pension Amounts by Employer and Nonemployer
June 30, 2019
(With Independent Auditors’ Report Thereon)

KANSAS PUBLIC EMPLOYEES RETIREMENT SYSTEMCOST-SHARING MULTIPLE-EMPLOYER DEFINED BENEFIT PENSION PLAN
2
Table of ContentsPage
Independent Auditors’ Report 3
Schedules of Employer and Nonemployer Allocations 5
Schedules of Pension Amounts by Employer and Nonemployer 34
Notes to Schedules of Employer and Nonemployer Allocations and Schedules of Pension Amounts by Employer and Nonemployer 81
Other Information (Unaudited)
Supplemental Schedule of Employer Special Funding Allocations – State/School Group 93
Supplemental Schedule of Special Funding Amounts by Employer – State/School Group 94
Supplemental Schedule of Nonemployer Contributions – State/School Group 95
Schedules of Net Pension Liability Sensitivities, Deferred Outflows/(Inflows) of Resources by Employer (by plan group):
State/School 102
Local 112
Kansas Police and Firemen (KP&F) 139
Judges 141
3
INDEPENDENT AUDITORS' REPORT
The Board of Trustees Kansas Public Employees Retirement System Topeka, Kansas
Report on Schedules
We have audited the accompanying schedules of employer and nonemployer allocations of the Kansas Public Employees Retirement System Cost-Sharing Multiple-Employer Defined Benefit Pension Plan (KPERS), as of and for the year ended June 30, 2019, and the related notes.
We have also audited the total for all entities of the columns titled net pension liability, total deferred outflows of resources, total deferred inflows of resources, and total employer pension expense as of and for the year ended June 30, 2019 (specified column totals), included in the accompanying schedules of pension amounts by employer and nonemployer of the Plans, and the related notes.
Management’s Responsibility for the Schedules
Management is responsible for the preparation and fair presentation of these schedules in accordance with accounting principles generally accepted in the United States of America; this includes the design, implementation, and maintenance of internal control relevant to the preparation and fair presentation of the schedules that are free from material misstatement, whether due to fraud or error.
Auditors’ Responsibility
Our responsibility is to express opinions on the schedules of employer and nonemployer allocations and the specified column totals included in the schedules of pension amounts by employer and nonemployer based on our audit. We conducted our audit in accordance with auditing standards generally accepted in the United States of America and the standards applicable to financial audits contained in Government Auditing Standards, issued by the Comptroller General of the United States. Those standards require that we plan and perform the audit to obtain reasonable assurance about whether the schedules of employer and nonemployer allocations and the specified column totals included in the schedules of pension amounts by employer and nonemployer are free from material misstatement.
An audit involves performing procedures to obtain audit evidence about the amounts and disclosures in the schedules of employer and nonemployer allocations and the specified column totals included in the schedules of pension amounts by employer and nonemployer. The procedures selected depend on the auditors’ judgment, including the assessment of the risks of material misstatement of the schedules of employer and nonemployer allocations and the specified column totals in the schedules of pension amounts by employer and nonemployer, whether due to fraud or error. In making those risk assessments, the auditor considers internal control relevant to the entity’s preparation and fair presentation of the schedules of employer and nonemployer allocations and specified column totals included in the schedules of pension amounts by employer and nonemployer in order to design audit procedures that are appropriate in the circumstances, but not for the purpose of expressing an opinion on the effectiveness of the entity’s internal control. Accordingly, we express no such opinion.
The Board of Trustees Kansas Public Employees Retirement System
4
An audit also includes evaluating the appropriateness of accounting policies used and the reasonableness of significant accounting estimates made by management, as well as evaluating the overall presentation of the schedules of employer and nonemployer allocations and specified column totals included in the schedules of pension amounts by employer and nonemployer.
We believe that the audit evidence we have obtained is sufficient and appropriate to provide a basis for our audit opinions.
Opinion
In our opinion, the schedules referred to above present fairly, in all material respects, the employer and nonemployer allocations and the net pension liability, total deferred outflows of resources, total deferred inflows of resources, and total employer pension expense for the total of all participating entities for KPERS as of and for the year ended June 30, 2019, in accordance with accounting principles generally accepted in the United States of America.
Other Matter
We have audited, in accordance with auditing standards generally accepted in the United States of America, the financial statements of KPERS as of and for the year ended June 30, 2019, and our report thereon, dated October 30, 2019, expressed an unmodified opinion on those statements.
Other Information
The Supplemental Schedules of Employer Special Funding Allocations – State/School Group, Special Funding Amounts by Employer – State/School Group, Nonemployer Contributions – State/School Group, and Schedules of Net Pension Liability Sensitivities, Deferred Outflows/(Inflows) of Resources by Employer (by plan group) on pages 93-141 have not been subjected to the auditing procedures applied in the audits of the Schedules of Employer and Nonemployer Allocations and the specified column totals in the Schedules of Pension Amounts by Employer and Nonemployer and accordingly, we do not express an opinion or provide any assurance on them.
Restriction on Use
Our report is intended solely for the information and use of the KPERS’ management and Board of Trustees, the State of Kansas, and KPERS’ employers and their auditors, and is not intended to be and should not be used by anyone other than these specified parties.
Other Reporting Required by Government Auditing Standards
In accordance with Government Audit Standards, we have also issued our report dated January 31, 2020, on our consideration of the KPERS’ internal control over financial reporting and on our tests of its compliance with certain provisions of laws, regulations, contracts and grant agreements and other matters. The purpose of that report is solely to describe the scope of our testing of internal control over financial reporting and compliance and the results of that testing, and not to provide an opinion on the effectiveness of KPERS’ internal control over financial reporting or on compliance. That report is an integral part of an audit performed in accordance with Government Auditing Standards in considering KPERS’ internal control over financial reporting.
a CliftonLarsonAllen LLP
Denver, Colorado January 31, 2020
KANSAS PUBLIC EMPLOYEES RETIREMENT SYSTEMCOST-SHARING MULTIPLE-EMPLOYER DEFINED BENEFIT PENSION PLAN
5
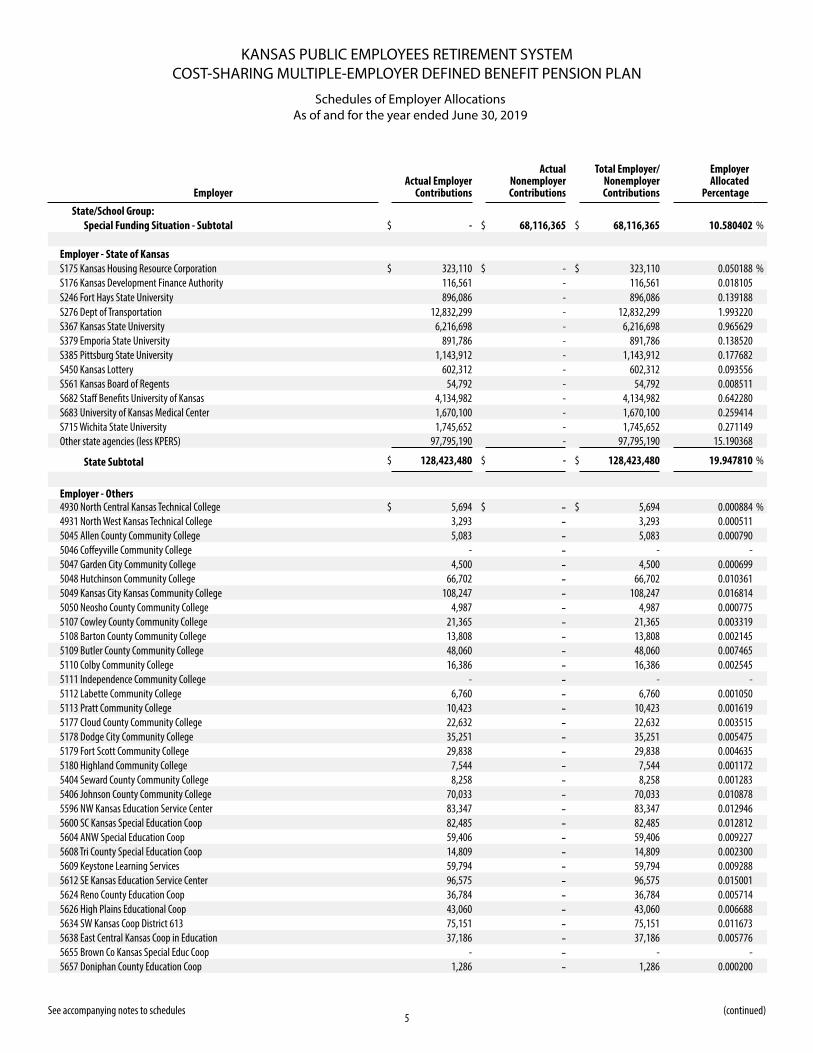
Schedules of Employer AllocationsAs of and for the year ended June 30, 2019
See accompanying notes to schedules
EmployerActual Employer
Contributions
Actual Nonemployer Contributions
Total Employer/ Nonemployer Contributions
Employer Allocated
Percentage
State/School Group:Special Funding Situation - Subtotal $ - $ 68,116,365 $ 68,116,365 10.580402 %
Employer - State of KansasS175 Kansas Housing Resource Corporation $ 323,110 $ - $ 323,110 0.050188 %S176 Kansas Development Finance Authority 116,561 - 116,561 0.018105 S246 Fort Hays State University 896,086 - 896,086 0.139188 S276 Dept of Transportation 12,832,299 - 12,832,299 1.993220 S367 Kansas State University 6,216,698 - 6,216,698 0.965629 S379 Emporia State University 891,786 - 891,786 0.138520 S385 Pittsburg State University 1,143,912 - 1,143,912 0.177682 S450 Kansas Lottery 602,312 - 602,312 0.093556 S561 Kansas Board of Regents 54,792 - 54,792 0.008511 S682 Staff Benefits University of Kansas 4,134,982 - 4,134,982 0.642280 S683 University of Kansas Medical Center 1,670,100 - 1,670,100 0.259414 S715 Wichita State University 1,745,652 - 1,745,652 0.271149 Other state agencies (less KPERS) 97,795,190 - 97,795,190 15.190368
State Subtotal $ 128,423,480 $ - $ 128,423,480 19.947810 %
Employer - Others4930 North Central Kansas Technical College $ 5,694 $ - $ 5,694 0.000884 %4931 North West Kansas Technical College 3,293 - 3,293 0.000511 5045 Allen County Community College 5,083 - 5,083 0.000790 5046 Coffeyville Community College - - - - 5047 Garden City Community College 4,500 - 4,500 0.000699 5048 Hutchinson Community College 66,702 - 66,702 0.010361 5049 Kansas City Kansas Community College 108,247 - 108,247 0.016814 5050 Neosho County Community College 4,987 - 4,987 0.000775 5107 Cowley County Community College 21,365 - 21,365 0.003319 5108 Barton County Community College 13,808 - 13,808 0.002145 5109 Butler County Community College 48,060 - 48,060 0.007465 5110 Colby Community College 16,386 - 16,386 0.002545 5111 Independence Community College - - - - 5112 Labette Community College 6,760 - 6,760 0.001050 5113 Pratt Community College 10,423 - 10,423 0.001619 5177 Cloud County Community College 22,632 - 22,632 0.003515 5178 Dodge City Community College 35,251 - 35,251 0.005475 5179 Fort Scott Community College 29,838 - 29,838 0.004635 5180 Highland Community College 7,544 - 7,544 0.001172 5404 Seward County Community College 8,258 - 8,258 0.001283 5406 Johnson County Community College 70,033 - 70,033 0.010878 5596 NW Kansas Education Service Center 83,347 - 83,347 0.012946 5600 SC Kansas Special Education Coop 82,485 - 82,485 0.012812 5604 ANW Special Education Coop 59,406 - 59,406 0.009227 5608 Tri County Special Education Coop 14,809 - 14,809 0.002300 5609 Keystone Learning Services 59,794 - 59,794 0.009288 5612 SE Kansas Education Service Center 96,575 - 96,575 0.015001 5624 Reno County Education Coop 36,784 - 36,784 0.005714 5626 High Plains Educational Coop 43,060 - 43,060 0.006688 5634 SW Kansas Coop District 613 75,151 - 75,151 0.011673 5638 East Central Kansas Coop in Education 37,186 - 37,186 0.005776 5655 Brown Co Kansas Special Educ Coop - - - - 5657 Doniphan County Education Coop 1,286 - 1,286 0.000200
(continued)
KANSAS PUBLIC EMPLOYEES RETIREMENT SYSTEMCOST-SHARING MULTIPLE-EMPLOYER DEFINED BENEFIT PENSION PLAN
6
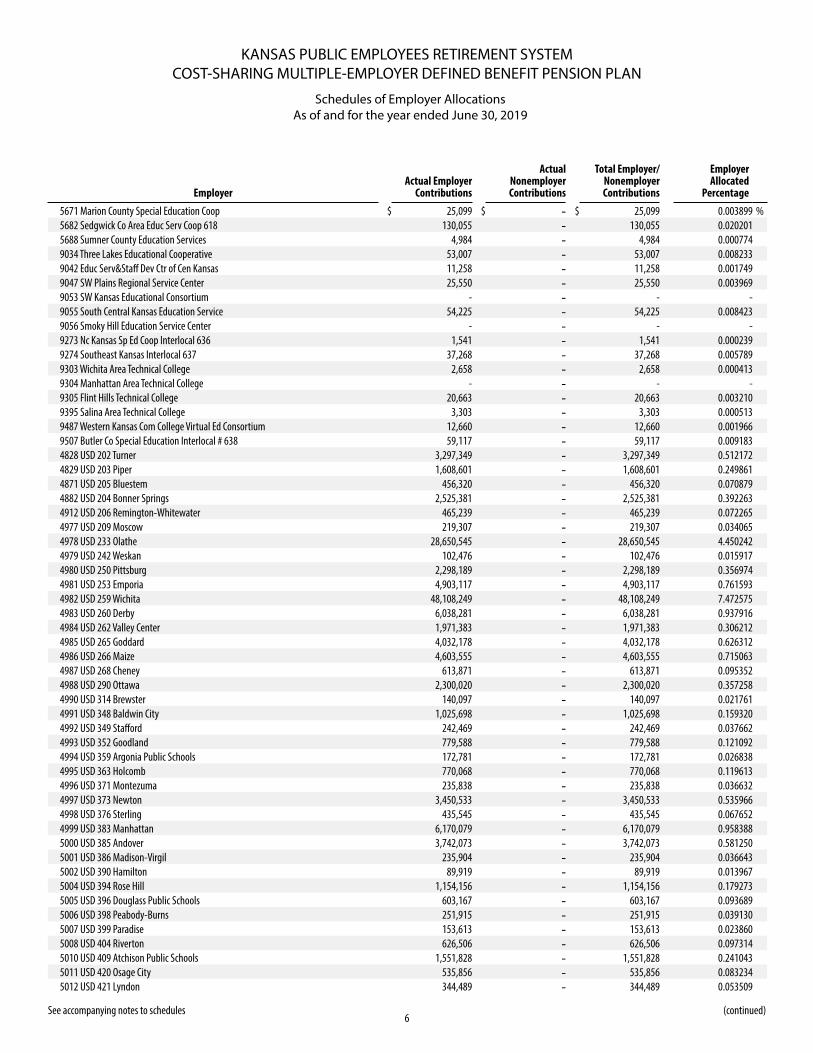
Schedules of Employer AllocationsAs of and for the year ended June 30, 2019
See accompanying notes to schedules
EmployerActual Employer
Contributions
Actual Nonemployer Contributions
Total Employer/ Nonemployer Contributions
Employer Allocated
Percentage
5671 Marion County Special Education Coop $ 25,099 $ - $ 25,099 0.003899 %5682 Sedgwick Co Area Educ Serv Coop 618 130,055 - 130,055 0.020201 5688 Sumner County Education Services 4,984 - 4,984 0.000774 9034 Three Lakes Educational Cooperative 53,007 - 53,007 0.008233 9042 Educ Serv&Staff Dev Ctr of Cen Kansas 11,258 - 11,258 0.001749 9047 SW Plains Regional Service Center 25,550 - 25,550 0.003969 9053 SW Kansas Educational Consortium - - - - 9055 South Central Kansas Education Service 54,225 - 54,225 0.008423 9056 Smoky Hill Education Service Center - - - - 9273 Nc Kansas Sp Ed Coop Interlocal 636 1,541 - 1,541 0.000239 9274 Southeast Kansas Interlocal 637 37,268 - 37,268 0.005789 9303 Wichita Area Technical College 2,658 - 2,658 0.000413 9304 Manhattan Area Technical College - - - - 9305 Flint Hills Technical College 20,663 - 20,663 0.003210 9395 Salina Area Technical College 3,303 - 3,303 0.000513 9487 Western Kansas Com College Virtual Ed Consortium 12,660 - 12,660 0.001966 9507 Butler Co Special Education Interlocal # 638 59,117 - 59,117 0.009183 4828 USD 202 Turner 3,297,349 - 3,297,349 0.512172 4829 USD 203 Piper 1,608,601 - 1,608,601 0.249861 4871 USD 205 Bluestem 456,320 - 456,320 0.070879 4882 USD 204 Bonner Springs 2,525,381 - 2,525,381 0.392263 4912 USD 206 Remington-Whitewater 465,239 - 465,239 0.072265 4977 USD 209 Moscow 219,307 - 219,307 0.034065 4978 USD 233 Olathe 28,650,545 - 28,650,545 4.450242 4979 USD 242 Weskan 102,476 - 102,476 0.015917 4980 USD 250 Pittsburg 2,298,189 - 2,298,189 0.356974 4981 USD 253 Emporia 4,903,117 - 4,903,117 0.761593 4982 USD 259 Wichita 48,108,249 - 48,108,249 7.472575 4983 USD 260 Derby 6,038,281 - 6,038,281 0.937916 4984 USD 262 Valley Center 1,971,383 - 1,971,383 0.306212 4985 USD 265 Goddard 4,032,178 - 4,032,178 0.626312 4986 USD 266 Maize 4,603,555 - 4,603,555 0.715063 4987 USD 268 Cheney 613,871 - 613,871 0.095352 4988 USD 290 Ottawa 2,300,020 - 2,300,020 0.357258 4990 USD 314 Brewster 140,097 - 140,097 0.021761 4991 USD 348 Baldwin City 1,025,698 - 1,025,698 0.159320 4992 USD 349 Stafford 242,469 - 242,469 0.037662 4993 USD 352 Goodland 779,588 - 779,588 0.121092 4994 USD 359 Argonia Public Schools 172,781 - 172,781 0.026838 4995 USD 363 Holcomb 770,068 - 770,068 0.119613 4996 USD 371 Montezuma 235,838 - 235,838 0.036632 4997 USD 373 Newton 3,450,533 - 3,450,533 0.535966 4998 USD 376 Sterling 435,545 - 435,545 0.067652 4999 USD 383 Manhattan 6,170,079 - 6,170,079 0.958388 5000 USD 385 Andover 3,742,073 - 3,742,073 0.581250 5001 USD 386 Madison-Virgil 235,904 - 235,904 0.036643 5002 USD 390 Hamilton 89,919 - 89,919 0.013967 5004 USD 394 Rose Hill 1,154,156 - 1,154,156 0.179273 5005 USD 396 Douglass Public Schools 603,167 - 603,167 0.093689 5006 USD 398 Peabody-Burns 251,915 - 251,915 0.039130 5007 USD 399 Paradise 153,613 - 153,613 0.023860 5008 USD 404 Riverton 626,506 - 626,506 0.097314 5010 USD 409 Atchison Public Schools 1,551,828 - 1,551,828 0.241043 5011 USD 420 Osage City 535,856 - 535,856 0.083234 5012 USD 421 Lyndon 344,489 - 344,489 0.053509
(continued)
KANSAS PUBLIC EMPLOYEES RETIREMENT SYSTEMCOST-SHARING MULTIPLE-EMPLOYER DEFINED BENEFIT PENSION PLAN
7
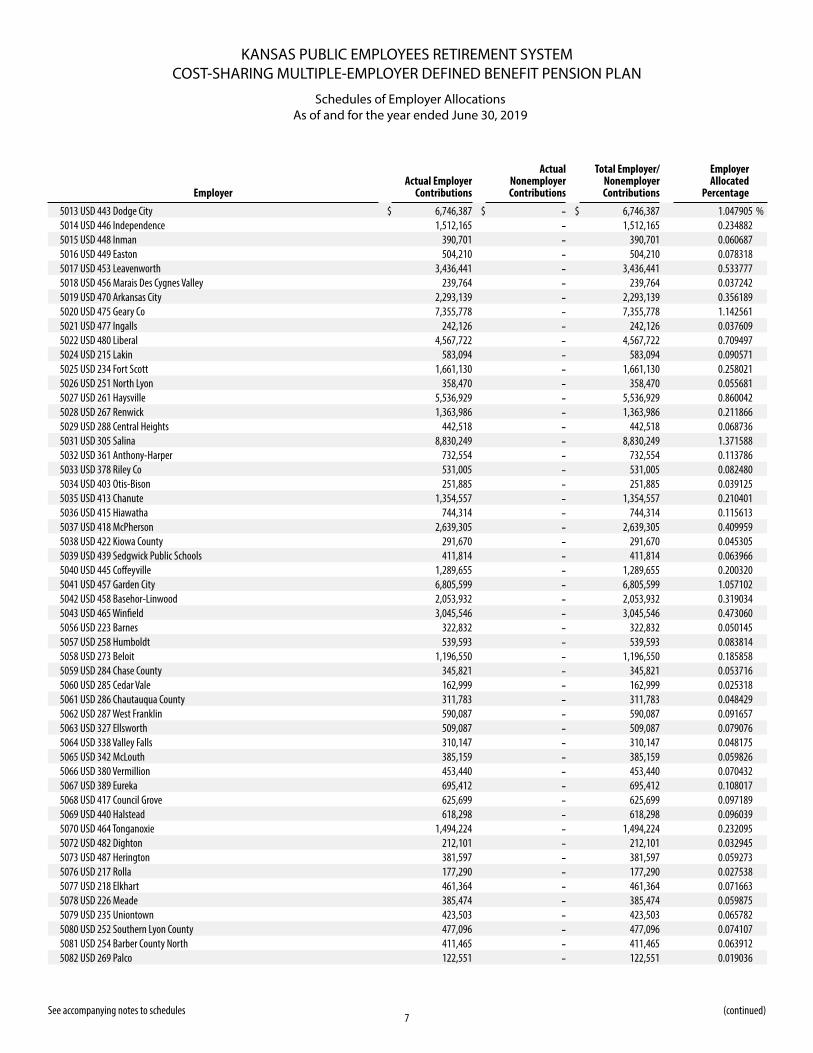
Schedules of Employer AllocationsAs of and for the year ended June 30, 2019
See accompanying notes to schedules
EmployerActual Employer
Contributions
Actual Nonemployer Contributions
Total Employer/ Nonemployer Contributions
Employer Allocated
Percentage
5013 USD 443 Dodge City $ 6,746,387 $ - $ 6,746,387 1.047905 %5014 USD 446 Independence 1,512,165 - 1,512,165 0.234882 5015 USD 448 Inman 390,701 - 390,701 0.060687 5016 USD 449 Easton 504,210 - 504,210 0.078318 5017 USD 453 Leavenworth 3,436,441 - 3,436,441 0.533777 5018 USD 456 Marais Des Cygnes Valley 239,764 - 239,764 0.037242 5019 USD 470 Arkansas City 2,293,139 - 2,293,139 0.356189 5020 USD 475 Geary Co 7,355,778 - 7,355,778 1.142561 5021 USD 477 Ingalls 242,126 - 242,126 0.037609 5022 USD 480 Liberal 4,567,722 - 4,567,722 0.709497 5024 USD 215 Lakin 583,094 - 583,094 0.090571 5025 USD 234 Fort Scott 1,661,130 - 1,661,130 0.258021 5026 USD 251 North Lyon 358,470 - 358,470 0.055681 5027 USD 261 Haysville 5,536,929 - 5,536,929 0.860042 5028 USD 267 Renwick 1,363,986 - 1,363,986 0.211866 5029 USD 288 Central Heights 442,518 - 442,518 0.068736 5031 USD 305 Salina 8,830,249 - 8,830,249 1.371588 5032 USD 361 Anthony-Harper 732,554 - 732,554 0.113786 5033 USD 378 Riley Co 531,005 - 531,005 0.082480 5034 USD 403 Otis-Bison 251,885 - 251,885 0.039125 5035 USD 413 Chanute 1,354,557 - 1,354,557 0.210401 5036 USD 415 Hiawatha 744,314 - 744,314 0.115613 5037 USD 418 McPherson 2,639,305 - 2,639,305 0.409959 5038 USD 422 Kiowa County 291,670 - 291,670 0.045305 5039 USD 439 Sedgwick Public Schools 411,814 - 411,814 0.063966 5040 USD 445 Coffeyville 1,289,655 - 1,289,655 0.200320 5041 USD 457 Garden City 6,805,599 - 6,805,599 1.057102 5042 USD 458 Basehor-Linwood 2,053,932 - 2,053,932 0.319034 5043 USD 465 Winfield 3,045,546 - 3,045,546 0.473060 5056 USD 223 Barnes 322,832 - 322,832 0.050145 5057 USD 258 Humboldt 539,593 - 539,593 0.083814 5058 USD 273 Beloit 1,196,550 - 1,196,550 0.185858 5059 USD 284 Chase County 345,821 - 345,821 0.053716 5060 USD 285 Cedar Vale 162,999 - 162,999 0.025318 5061 USD 286 Chautauqua County 311,783 - 311,783 0.048429 5062 USD 287 West Franklin 590,087 - 590,087 0.091657 5063 USD 327 Ellsworth 509,087 - 509,087 0.079076 5064 USD 338 Valley Falls 310,147 - 310,147 0.048175 5065 USD 342 McLouth 385,159 - 385,159 0.059826 5066 USD 380 Vermillion 453,440 - 453,440 0.070432 5067 USD 389 Eureka 695,412 - 695,412 0.108017 5068 USD 417 Council Grove 625,699 - 625,699 0.097189 5069 USD 440 Halstead 618,298 - 618,298 0.096039 5070 USD 464 Tonganoxie 1,494,224 - 1,494,224 0.232095 5072 USD 482 Dighton 212,101 - 212,101 0.032945 5073 USD 487 Herington 381,597 - 381,597 0.059273 5076 USD 217 Rolla 177,290 - 177,290 0.027538 5077 USD 218 Elkhart 461,364 - 461,364 0.071663 5078 USD 226 Meade 385,474 - 385,474 0.059875 5079 USD 235 Uniontown 423,503 - 423,503 0.065782 5080 USD 252 Southern Lyon County 477,096 - 477,096 0.074107 5081 USD 254 Barber County North 411,465 - 411,465 0.063912 5082 USD 269 Palco 122,551 - 122,551 0.019036
(continued)
KANSAS PUBLIC EMPLOYEES RETIREMENT SYSTEMCOST-SHARING MULTIPLE-EMPLOYER DEFINED BENEFIT PENSION PLAN
8
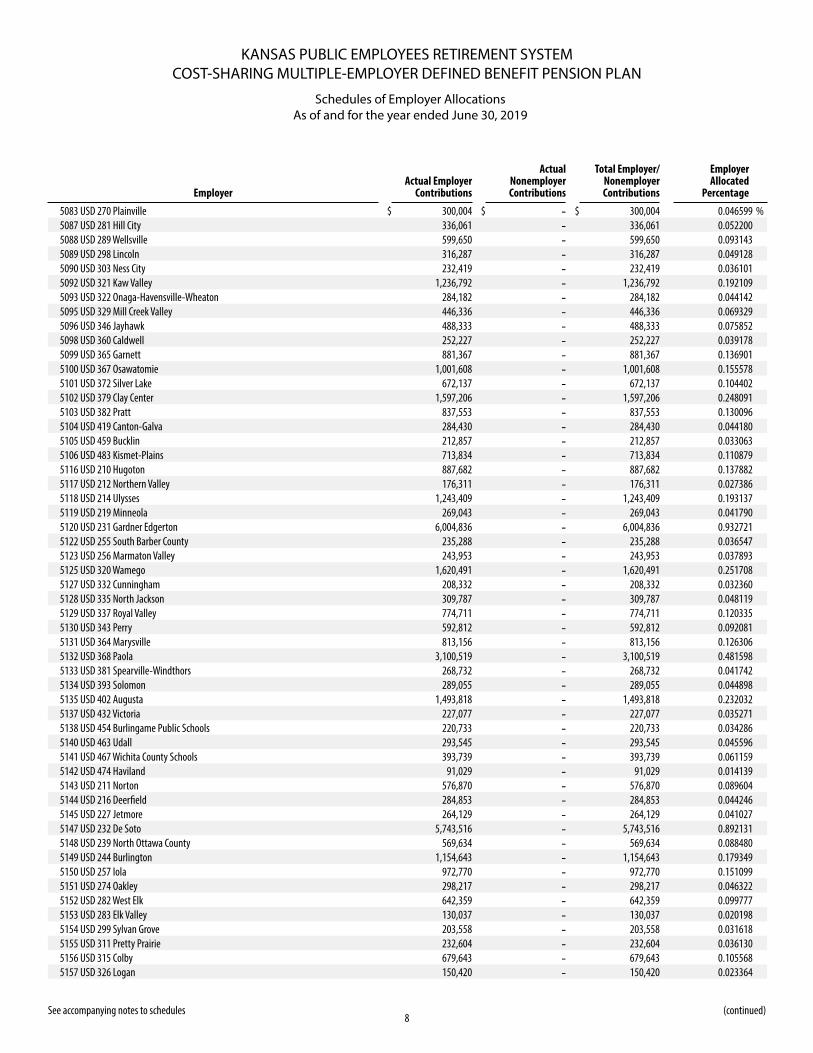
Schedules of Employer AllocationsAs of and for the year ended June 30, 2019
See accompanying notes to schedules
EmployerActual Employer
Contributions
Actual Nonemployer Contributions
Total Employer/ Nonemployer Contributions
Employer Allocated
Percentage
5083 USD 270 Plainville $ 300,004 $ - $ 300,004 0.046599 %5087 USD 281 Hill City 336,061 - 336,061 0.052200 5088 USD 289 Wellsville 599,650 - 599,650 0.093143 5089 USD 298 Lincoln 316,287 - 316,287 0.049128 5090 USD 303 Ness City 232,419 - 232,419 0.036101 5092 USD 321 Kaw Valley 1,236,792 - 1,236,792 0.192109 5093 USD 322 Onaga-Havensville-Wheaton 284,182 - 284,182 0.044142 5095 USD 329 Mill Creek Valley 446,336 - 446,336 0.069329 5096 USD 346 Jayhawk 488,333 - 488,333 0.075852 5098 USD 360 Caldwell 252,227 - 252,227 0.039178 5099 USD 365 Garnett 881,367 - 881,367 0.136901 5100 USD 367 Osawatomie 1,001,608 - 1,001,608 0.155578 5101 USD 372 Silver Lake 672,137 - 672,137 0.104402 5102 USD 379 Clay Center 1,597,206 - 1,597,206 0.248091 5103 USD 382 Pratt 837,553 - 837,553 0.130096 5104 USD 419 Canton-Galva 284,430 - 284,430 0.044180 5105 USD 459 Bucklin 212,857 - 212,857 0.033063 5106 USD 483 Kismet-Plains 713,834 - 713,834 0.110879 5116 USD 210 Hugoton 887,682 - 887,682 0.137882 5117 USD 212 Northern Valley 176,311 - 176,311 0.027386 5118 USD 214 Ulysses 1,243,409 - 1,243,409 0.193137 5119 USD 219 Minneola 269,043 - 269,043 0.041790 5120 USD 231 Gardner Edgerton 6,004,836 - 6,004,836 0.932721 5122 USD 255 South Barber County 235,288 - 235,288 0.036547 5123 USD 256 Marmaton Valley 243,953 - 243,953 0.037893 5125 USD 320 Wamego 1,620,491 - 1,620,491 0.251708 5127 USD 332 Cunningham 208,332 - 208,332 0.032360 5128 USD 335 North Jackson 309,787 - 309,787 0.048119 5129 USD 337 Royal Valley 774,711 - 774,711 0.120335 5130 USD 343 Perry 592,812 - 592,812 0.092081 5131 USD 364 Marysville 813,156 - 813,156 0.126306 5132 USD 368 Paola 3,100,519 - 3,100,519 0.481598 5133 USD 381 Spearville-Windthors 268,732 - 268,732 0.041742 5134 USD 393 Solomon 289,055 - 289,055 0.044898 5135 USD 402 Augusta 1,493,818 - 1,493,818 0.232032 5137 USD 432 Victoria 227,077 - 227,077 0.035271 5138 USD 454 Burlingame Public Schools 220,733 - 220,733 0.034286 5140 USD 463 Udall 293,545 - 293,545 0.045596 5141 USD 467 Wichita County Schools 393,739 - 393,739 0.061159 5142 USD 474 Haviland 91,029 - 91,029 0.014139 5143 USD 211 Norton 576,870 - 576,870 0.089604 5144 USD 216 Deerfield 284,853 - 284,853 0.044246 5145 USD 227 Jetmore 264,129 - 264,129 0.041027 5147 USD 232 De Soto 5,743,516 - 5,743,516 0.892131 5148 USD 239 North Ottawa County 569,634 - 569,634 0.088480 5149 USD 244 Burlington 1,154,643 - 1,154,643 0.179349 5150 USD 257 Iola 972,770 - 972,770 0.151099 5151 USD 274 Oakley 298,217 - 298,217 0.046322 5152 USD 282 West Elk 642,359 - 642,359 0.099777 5153 USD 283 Elk Valley 130,037 - 130,037 0.020198 5154 USD 299 Sylvan Grove 203,558 - 203,558 0.031618 5155 USD 311 Pretty Prairie 232,604 - 232,604 0.036130 5156 USD 315 Colby 679,643 - 679,643 0.105568 5157 USD 326 Logan 150,420 - 150,420 0.023364
(continued)
KANSAS PUBLIC EMPLOYEES RETIREMENT SYSTEMCOST-SHARING MULTIPLE-EMPLOYER DEFINED BENEFIT PENSION PLAN
9
Schedules of Employer AllocationsAs of and for the year ended June 30, 2019
See accompanying notes to schedules
EmployerActual Employer
Contributions
Actual Nonemployer Contributions
Total Employer/ Nonemployer Contributions
Employer Allocated
Percentage
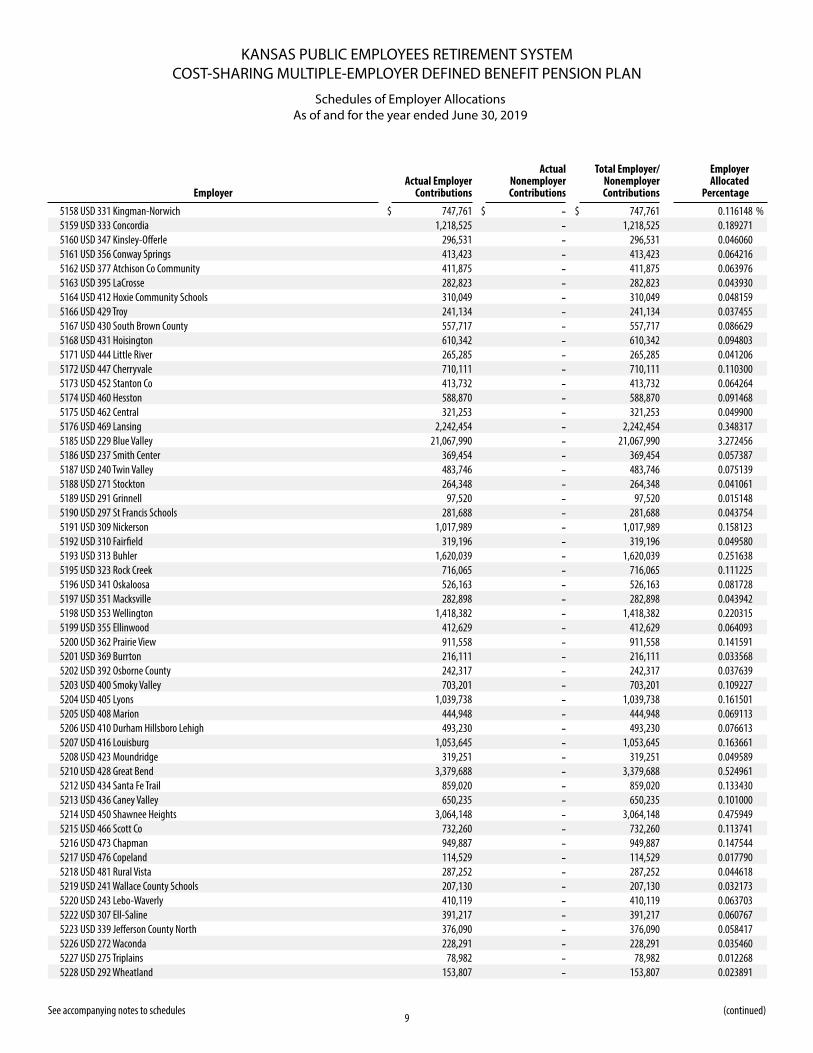
5158 USD 331 Kingman-Norwich $ 747,761 $ - $ 747,761 0.116148 %5159 USD 333 Concordia 1,218,525 - 1,218,525 0.189271 5160 USD 347 Kinsley-Offerle 296,531 - 296,531 0.046060 5161 USD 356 Conway Springs 413,423 - 413,423 0.064216 5162 USD 377 Atchison Co Community 411,875 - 411,875 0.063976 5163 USD 395 LaCrosse 282,823 - 282,823 0.043930 5164 USD 412 Hoxie Community Schools 310,049 - 310,049 0.048159 5166 USD 429 Troy 241,134 - 241,134 0.037455 5167 USD 430 South Brown County 557,717 - 557,717 0.086629 5168 USD 431 Hoisington 610,342 - 610,342 0.094803 5171 USD 444 Little River 265,285 - 265,285 0.041206 5172 USD 447 Cherryvale 710,111 - 710,111 0.110300 5173 USD 452 Stanton Co 413,732 - 413,732 0.064264 5174 USD 460 Hesston 588,870 - 588,870 0.091468 5175 USD 462 Central 321,253 - 321,253 0.049900 5176 USD 469 Lansing 2,242,454 - 2,242,454 0.348317 5185 USD 229 Blue Valley 21,067,990 - 21,067,990 3.272456 5186 USD 237 Smith Center 369,454 - 369,454 0.057387 5187 USD 240 Twin Valley 483,746 - 483,746 0.075139 5188 USD 271 Stockton 264,348 - 264,348 0.041061 5189 USD 291 Grinnell 97,520 - 97,520 0.015148 5190 USD 297 St Francis Schools 281,688 - 281,688 0.043754 5191 USD 309 Nickerson 1,017,989 - 1,017,989 0.158123 5192 USD 310 Fairfield 319,196 - 319,196 0.049580 5193 USD 313 Buhler 1,620,039 - 1,620,039 0.251638 5195 USD 323 Rock Creek 716,065 - 716,065 0.111225 5196 USD 341 Oskaloosa 526,163 - 526,163 0.081728 5197 USD 351 Macksville 282,898 - 282,898 0.043942 5198 USD 353 Wellington 1,418,382 - 1,418,382 0.220315 5199 USD 355 Ellinwood 412,629 - 412,629 0.064093 5200 USD 362 Prairie View 911,558 - 911,558 0.141591 5201 USD 369 Burrton 216,111 - 216,111 0.033568 5202 USD 392 Osborne County 242,317 - 242,317 0.037639 5203 USD 400 Smoky Valley 703,201 - 703,201 0.109227 5204 USD 405 Lyons 1,039,738 - 1,039,738 0.161501 5205 USD 408 Marion 444,948 - 444,948 0.069113 5206 USD 410 Durham Hillsboro Lehigh 493,230 - 493,230 0.076613 5207 USD 416 Louisburg 1,053,645 - 1,053,645 0.163661 5208 USD 423 Moundridge 319,251 - 319,251 0.049589 5210 USD 428 Great Bend 3,379,688 - 3,379,688 0.524961 5212 USD 434 Santa Fe Trail 859,020 - 859,020 0.133430 5213 USD 436 Caney Valley 650,235 - 650,235 0.101000 5214 USD 450 Shawnee Heights 3,064,148 - 3,064,148 0.475949 5215 USD 466 Scott Co 732,260 - 732,260 0.113741 5216 USD 473 Chapman 949,887 - 949,887 0.147544 5217 USD 476 Copeland 114,529 - 114,529 0.017790 5218 USD 481 Rural Vista 287,252 - 287,252 0.044618 5219 USD 241 Wallace County Schools 207,130 - 207,130 0.032173 5220 USD 243 Lebo-Waverly 410,119 - 410,119 0.063703 5222 USD 307 Ell-Saline 391,217 - 391,217 0.060767 5223 USD 339 Jefferson County North 376,090 - 376,090 0.058417 5226 USD 272 Waconda 228,291 - 228,291 0.035460 5227 USD 275 Triplains 78,982 - 78,982 0.012268 5228 USD 292 Wheatland 153,807 - 153,807 0.023891
(continued)
KANSAS PUBLIC EMPLOYEES RETIREMENT SYSTEMCOST-SHARING MULTIPLE-EMPLOYER DEFINED BENEFIT PENSION PLAN
10
Schedules of Employer AllocationsAs of and for the year ended June 30, 2019
See accompanying notes to schedules
EmployerActual Employer
Contributions
Actual Nonemployer Contributions
Total Employer/ Nonemployer Contributions
Employer Allocated
Percentage
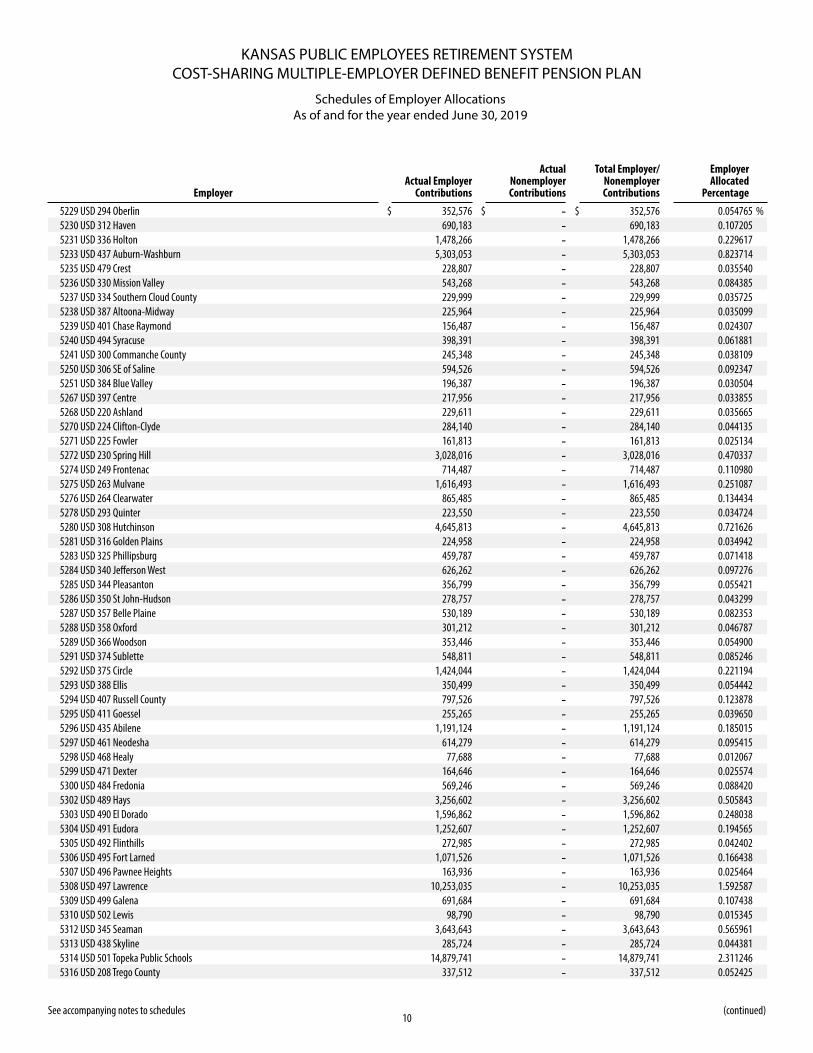
5229 USD 294 Oberlin $ 352,576 $ - $ 352,576 0.054765 %5230 USD 312 Haven 690,183 - 690,183 0.107205 5231 USD 336 Holton 1,478,266 - 1,478,266 0.229617 5233 USD 437 Auburn-Washburn 5,303,053 - 5,303,053 0.823714 5235 USD 479 Crest 228,807 - 228,807 0.035540 5236 USD 330 Mission Valley 543,268 - 543,268 0.084385 5237 USD 334 Southern Cloud County 229,999 - 229,999 0.035725 5238 USD 387 Altoona-Midway 225,964 - 225,964 0.035099 5239 USD 401 Chase Raymond 156,487 - 156,487 0.024307 5240 USD 494 Syracuse 398,391 - 398,391 0.061881 5241 USD 300 Commanche County 245,348 - 245,348 0.038109 5250 USD 306 SE of Saline 594,526 - 594,526 0.092347 5251 USD 384 Blue Valley 196,387 - 196,387 0.030504 5267 USD 397 Centre 217,956 - 217,956 0.033855 5268 USD 220 Ashland 229,611 - 229,611 0.035665 5270 USD 224 Clifton-Clyde 284,140 - 284,140 0.044135 5271 USD 225 Fowler 161,813 - 161,813 0.025134 5272 USD 230 Spring Hill 3,028,016 - 3,028,016 0.470337 5274 USD 249 Frontenac 714,487 - 714,487 0.110980 5275 USD 263 Mulvane 1,616,493 - 1,616,493 0.251087 5276 USD 264 Clearwater 865,485 - 865,485 0.134434 5278 USD 293 Quinter 223,550 - 223,550 0.034724 5280 USD 308 Hutchinson 4,645,813 - 4,645,813 0.721626 5281 USD 316 Golden Plains 224,958 - 224,958 0.034942 5283 USD 325 Phillipsburg 459,787 - 459,787 0.071418 5284 USD 340 Jefferson West 626,262 - 626,262 0.097276 5285 USD 344 Pleasanton 356,799 - 356,799 0.055421 5286 USD 350 St John-Hudson 278,757 - 278,757 0.043299 5287 USD 357 Belle Plaine 530,189 - 530,189 0.082353 5288 USD 358 Oxford 301,212 - 301,212 0.046787 5289 USD 366 Woodson 353,446 - 353,446 0.054900 5291 USD 374 Sublette 548,811 - 548,811 0.085246 5292 USD 375 Circle 1,424,044 - 1,424,044 0.221194 5293 USD 388 Ellis 350,499 - 350,499 0.054442 5294 USD 407 Russell County 797,526 - 797,526 0.123878 5295 USD 411 Goessel 255,265 - 255,265 0.039650 5296 USD 435 Abilene 1,191,124 - 1,191,124 0.185015 5297 USD 461 Neodesha 614,279 - 614,279 0.095415 5298 USD 468 Healy 77,688 - 77,688 0.012067 5299 USD 471 Dexter 164,646 - 164,646 0.025574 5300 USD 484 Fredonia 569,246 - 569,246 0.088420 5302 USD 489 Hays 3,256,602 - 3,256,602 0.505843 5303 USD 490 El Dorado 1,596,862 - 1,596,862 0.248038 5304 USD 491 Eudora 1,252,607 - 1,252,607 0.194565 5305 USD 492 Flinthills 272,985 - 272,985 0.042402 5306 USD 495 Fort Larned 1,071,526 - 1,071,526 0.166438 5307 USD 496 Pawnee Heights 163,936 - 163,936 0.025464 5308 USD 497 Lawrence 10,253,035 - 10,253,035 1.592587 5309 USD 499 Galena 691,684 - 691,684 0.107438 5310 USD 502 Lewis 98,790 - 98,790 0.015345 5312 USD 345 Seaman 3,643,643 - 3,643,643 0.565961 5313 USD 438 Skyline 285,724 - 285,724 0.044381 5314 USD 501 Topeka Public Schools 14,879,741 - 14,879,741 2.311246 5316 USD 208 Trego County 337,512 - 337,512 0.052425
(continued)
KANSAS PUBLIC EMPLOYEES RETIREMENT SYSTEMCOST-SHARING MULTIPLE-EMPLOYER DEFINED BENEFIT PENSION PLAN
11
Schedules of Employer AllocationsAs of and for the year ended June 30, 2019
See accompanying notes to schedules
EmployerActual Employer
Contributions
Actual Nonemployer Contributions
Total Employer/ Nonemployer Contributions
Employer Allocated
Percentage
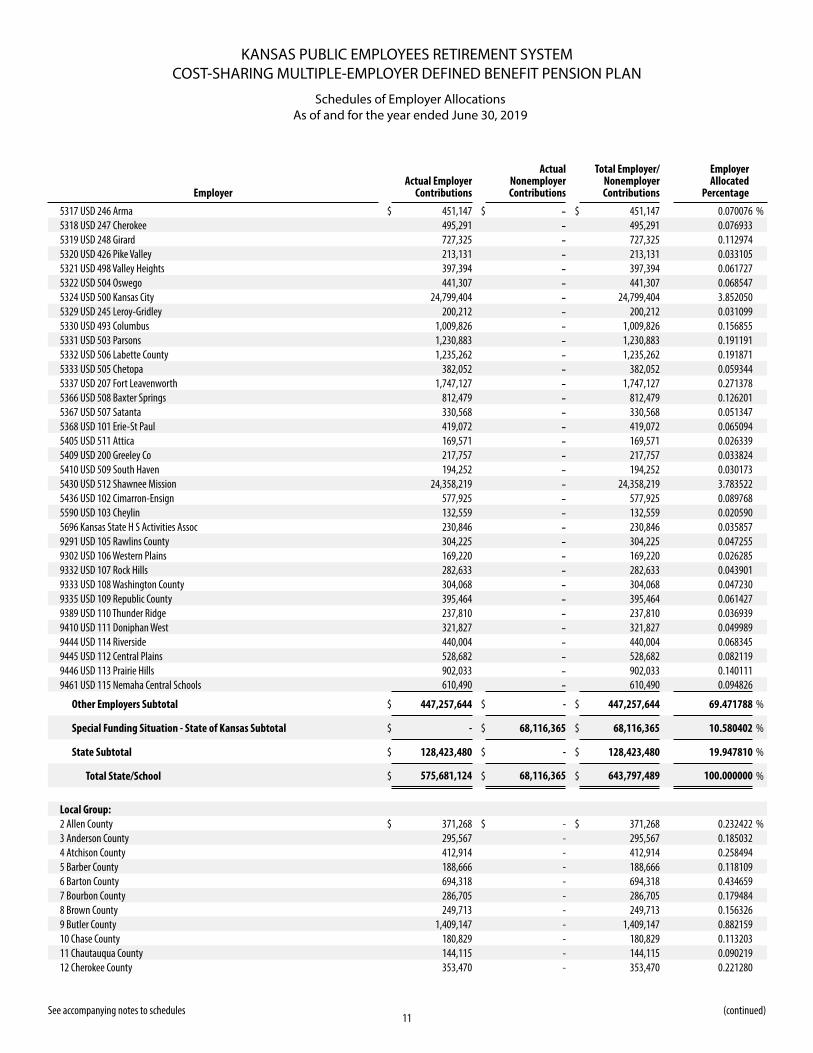
5317 USD 246 Arma $ 451,147 $ - $ 451,147 0.070076 %5318 USD 247 Cherokee 495,291 - 495,291 0.076933 5319 USD 248 Girard 727,325 - 727,325 0.112974 5320 USD 426 Pike Valley 213,131 - 213,131 0.033105 5321 USD 498 Valley Heights 397,394 - 397,394 0.061727 5322 USD 504 Oswego 441,307 - 441,307 0.068547 5324 USD 500 Kansas City 24,799,404 - 24,799,404 3.852050 5329 USD 245 Leroy-Gridley 200,212 - 200,212 0.031099 5330 USD 493 Columbus 1,009,826 - 1,009,826 0.156855 5331 USD 503 Parsons 1,230,883 - 1,230,883 0.191191 5332 USD 506 Labette County 1,235,262 - 1,235,262 0.191871 5333 USD 505 Chetopa 382,052 - 382,052 0.059344 5337 USD 207 Fort Leavenworth 1,747,127 - 1,747,127 0.271378 5366 USD 508 Baxter Springs 812,479 - 812,479 0.126201 5367 USD 507 Satanta 330,568 - 330,568 0.051347 5368 USD 101 Erie-St Paul 419,072 - 419,072 0.065094 5405 USD 511 Attica 169,571 - 169,571 0.026339 5409 USD 200 Greeley Co 217,757 - 217,757 0.033824 5410 USD 509 South Haven 194,252 - 194,252 0.030173 5430 USD 512 Shawnee Mission 24,358,219 - 24,358,219 3.783522 5436 USD 102 Cimarron-Ensign 577,925 - 577,925 0.089768 5590 USD 103 Cheylin 132,559 - 132,559 0.020590 5696 Kansas State H S Activities Assoc 230,846 - 230,846 0.035857 9291 USD 105 Rawlins County 304,225 - 304,225 0.047255 9302 USD 106 Western Plains 169,220 - 169,220 0.026285 9332 USD 107 Rock Hills 282,633 - 282,633 0.043901 9333 USD 108 Washington County 304,068 - 304,068 0.047230 9335 USD 109 Republic County 395,464 - 395,464 0.061427 9389 USD 110 Thunder Ridge 237,810 - 237,810 0.036939 9410 USD 111 Doniphan West 321,827 - 321,827 0.049989 9444 USD 114 Riverside 440,004 - 440,004 0.068345 9445 USD 112 Central Plains 528,682 - 528,682 0.082119 9446 USD 113 Prairie Hills 902,033 - 902,033 0.140111 9461 USD 115 Nemaha Central Schools 610,490 - 610,490 0.094826
Other Employers Subtotal $ 447,257,644 $ - $ 447,257,644 69.471788 %
Special Funding Situation - State of Kansas Subtotal $ - $ 68,116,365 $ 68,116,365 10.580402 %
State Subtotal $ 128,423,480 $ - $ 128,423,480 19.947810 %
Total State/School $ 575,681,124 $ 68,116,365 $ 643,797,489 100.000000 %
Local Group:2 Allen County $ 371,268 $ - $ 371,268 0.232422 %3 Anderson County 295,567 - 295,567 0.185032 4 Atchison County 412,914 - 412,914 0.258494 5 Barber County 188,666 - 188,666 0.118109 6 Barton County 694,318 - 694,318 0.434659 7 Bourbon County 286,705 - 286,705 0.179484 8 Brown County 249,713 - 249,713 0.156326 9 Butler County 1,409,147 - 1,409,147 0.882159 10 Chase County 180,829 - 180,829 0.113203 11 Chautauqua County 144,115 - 144,115 0.090219 12 Cherokee County 353,470 - 353,470 0.221280
(continued)
KANSAS PUBLIC EMPLOYEES RETIREMENT SYSTEMCOST-SHARING MULTIPLE-EMPLOYER DEFINED BENEFIT PENSION PLAN
12
Schedules of Employer AllocationsAs of and for the year ended June 30, 2019
See accompanying notes to schedules (continued)
EmployerActual Employer
Contributions
Actual Nonemployer Contributions
Total Employer/ Nonemployer Contributions
Employer Allocated
Percentage
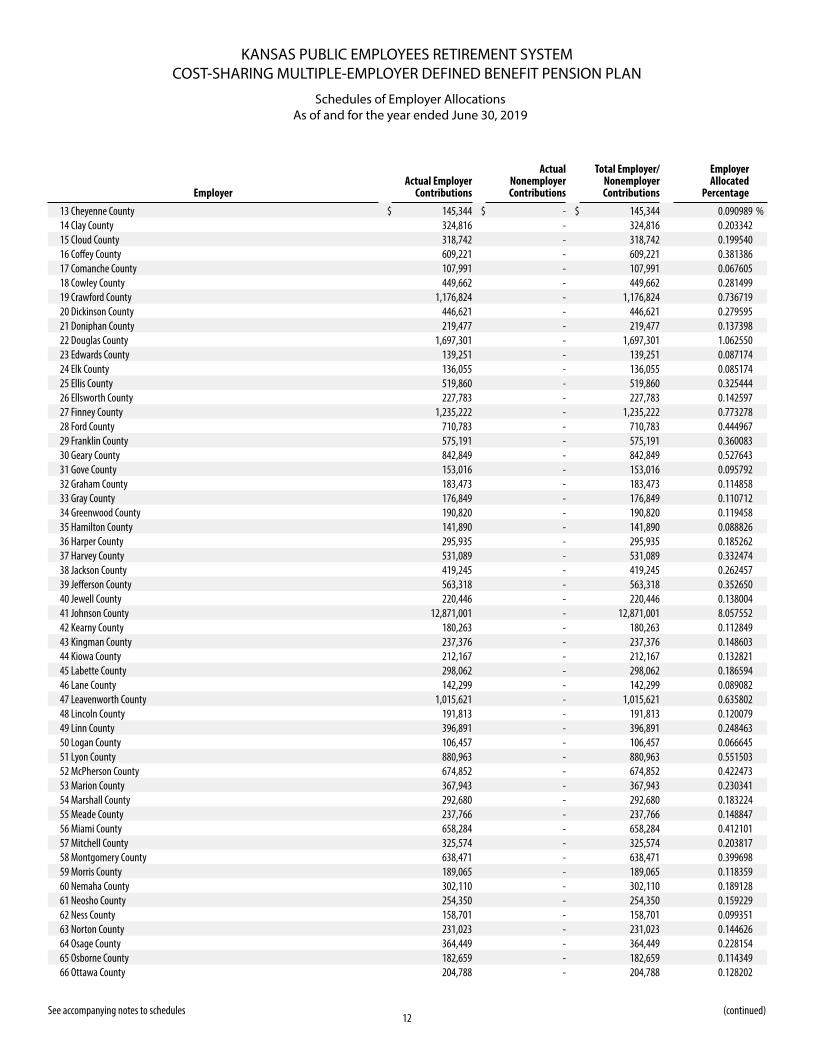
13 Cheyenne County $ 145,344 $ - $ 145,344 0.090989 %14 Clay County 324,816 - 324,816 0.203342 15 Cloud County 318,742 - 318,742 0.199540 16 Coffey County 609,221 - 609,221 0.381386 17 Comanche County 107,991 - 107,991 0.067605 18 Cowley County 449,662 - 449,662 0.281499 19 Crawford County 1,176,824 - 1,176,824 0.736719 20 Dickinson County 446,621 - 446,621 0.279595 21 Doniphan County 219,477 - 219,477 0.137398 22 Douglas County 1,697,301 - 1,697,301 1.062550 23 Edwards County 139,251 - 139,251 0.087174 24 Elk County 136,055 - 136,055 0.085174 25 Ellis County 519,860 - 519,860 0.325444 26 Ellsworth County 227,783 - 227,783 0.142597 27 Finney County 1,235,222 - 1,235,222 0.773278 28 Ford County 710,783 - 710,783 0.444967 29 Franklin County 575,191 - 575,191 0.360083 30 Geary County 842,849 - 842,849 0.527643 31 Gove County 153,016 - 153,016 0.095792 32 Graham County 183,473 - 183,473 0.114858 33 Gray County 176,849 - 176,849 0.110712 34 Greenwood County 190,820 - 190,820 0.119458 35 Hamilton County 141,890 - 141,890 0.088826 36 Harper County 295,935 - 295,935 0.185262 37 Harvey County 531,089 - 531,089 0.332474 38 Jackson County 419,245 - 419,245 0.262457 39 Jefferson County 563,318 - 563,318 0.352650 40 Jewell County 220,446 - 220,446 0.138004 41 Johnson County 12,871,001 - 12,871,001 8.057552 42 Kearny County 180,263 - 180,263 0.112849 43 Kingman County 237,376 - 237,376 0.148603 44 Kiowa County 212,167 - 212,167 0.132821 45 Labette County 298,062 - 298,062 0.186594 46 Lane County 142,299 - 142,299 0.089082 47 Leavenworth County 1,015,621 - 1,015,621 0.635802 48 Lincoln County 191,813 - 191,813 0.120079 49 Linn County 396,891 - 396,891 0.248463 50 Logan County 106,457 - 106,457 0.066645 51 Lyon County 880,963 - 880,963 0.551503 52 McPherson County 674,852 - 674,852 0.422473 53 Marion County 367,943 - 367,943 0.230341 54 Marshall County 292,680 - 292,680 0.183224 55 Meade County 237,766 - 237,766 0.148847 56 Miami County 658,284 - 658,284 0.412101 57 Mitchell County 325,574 - 325,574 0.203817 58 Montgomery County 638,471 - 638,471 0.399698 59 Morris County 189,065 - 189,065 0.118359 60 Nemaha County 302,110 - 302,110 0.189128 61 Neosho County 254,350 - 254,350 0.159229 62 Ness County 158,701 - 158,701 0.099351 63 Norton County 231,023 - 231,023 0.144626 64 Osage County 364,449 - 364,449 0.228154 65 Osborne County 182,659 - 182,659 0.114349 66 Ottawa County 204,788 - 204,788 0.128202
KANSAS PUBLIC EMPLOYEES RETIREMENT SYSTEMCOST-SHARING MULTIPLE-EMPLOYER DEFINED BENEFIT PENSION PLAN
13
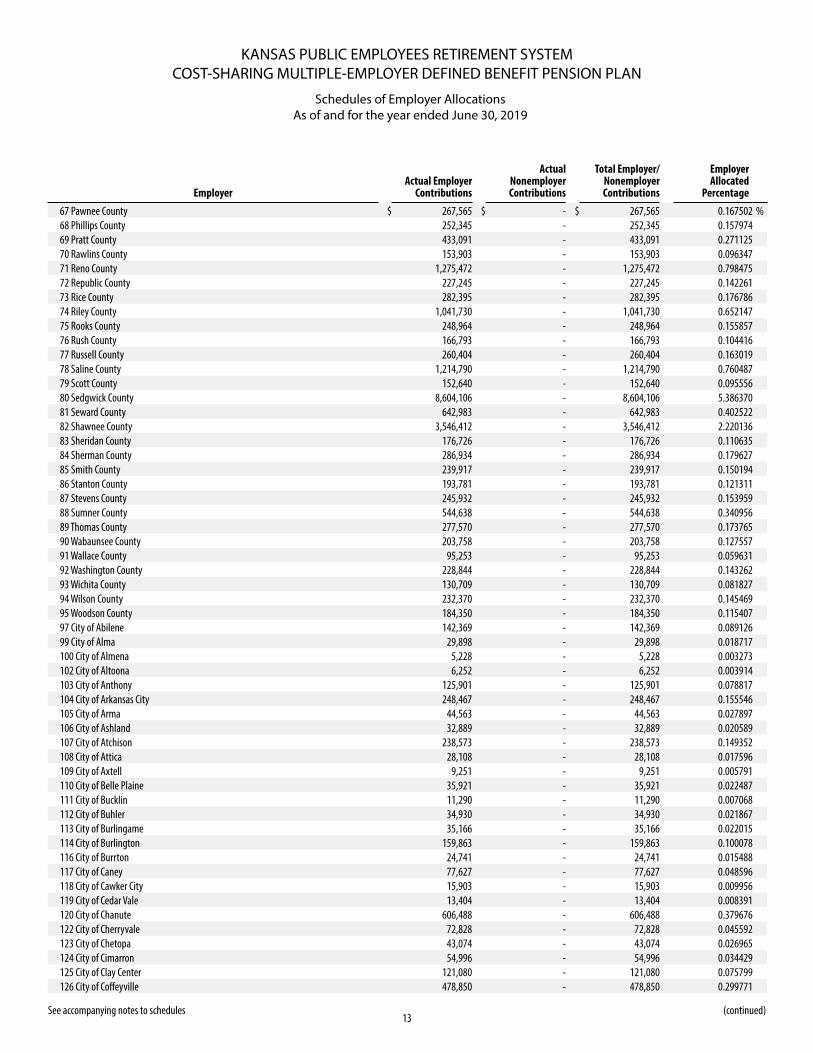
Schedules of Employer AllocationsAs of and for the year ended June 30, 2019
See accompanying notes to schedules (continued)
EmployerActual Employer
Contributions
Actual Nonemployer Contributions
Total Employer/ Nonemployer Contributions
Employer Allocated
Percentage
67 Pawnee County $ 267,565 $ - $ 267,565 0.167502 %68 Phillips County 252,345 - 252,345 0.157974 69 Pratt County 433,091 - 433,091 0.271125 70 Rawlins County 153,903 - 153,903 0.096347 71 Reno County 1,275,472 - 1,275,472 0.798475 72 Republic County 227,245 - 227,245 0.142261 73 Rice County 282,395 - 282,395 0.176786 74 Riley County 1,041,730 - 1,041,730 0.652147 75 Rooks County 248,964 - 248,964 0.155857 76 Rush County 166,793 - 166,793 0.104416 77 Russell County 260,404 - 260,404 0.163019 78 Saline County 1,214,790 - 1,214,790 0.760487 79 Scott County 152,640 - 152,640 0.095556 80 Sedgwick County 8,604,106 - 8,604,106 5.386370 81 Seward County 642,983 - 642,983 0.402522 82 Shawnee County 3,546,412 - 3,546,412 2.220136 83 Sheridan County 176,726 - 176,726 0.110635 84 Sherman County 286,934 - 286,934 0.179627 85 Smith County 239,917 - 239,917 0.150194 86 Stanton County 193,781 - 193,781 0.121311 87 Stevens County 245,932 - 245,932 0.153959 88 Sumner County 544,638 - 544,638 0.340956 89 Thomas County 277,570 - 277,570 0.173765 90 Wabaunsee County 203,758 - 203,758 0.127557 91 Wallace County 95,253 - 95,253 0.059631 92 Washington County 228,844 - 228,844 0.143262 93 Wichita County 130,709 - 130,709 0.081827 94 Wilson County 232,370 - 232,370 0.145469 95 Woodson County 184,350 - 184,350 0.115407 97 City of Abilene 142,369 - 142,369 0.089126 99 City of Alma 29,898 - 29,898 0.018717 100 City of Almena 5,228 - 5,228 0.003273 102 City of Altoona 6,252 - 6,252 0.003914 103 City of Anthony 125,901 - 125,901 0.078817 104 City of Arkansas City 248,467 - 248,467 0.155546 105 City of Arma 44,563 - 44,563 0.027897 106 City of Ashland 32,889 - 32,889 0.020589 107 City of Atchison 238,573 - 238,573 0.149352 108 City of Attica 28,108 - 28,108 0.017596 109 City of Axtell 9,251 - 9,251 0.005791 110 City of Belle Plaine 35,921 - 35,921 0.022487 111 City of Bucklin 11,290 - 11,290 0.007068 112 City of Buhler 34,930 - 34,930 0.021867 113 City of Burlingame 35,166 - 35,166 0.022015 114 City of Burlington 159,863 - 159,863 0.100078 116 City of Burrton 24,741 - 24,741 0.015488 117 City of Caney 77,627 - 77,627 0.048596 118 City of Cawker City 15,903 - 15,903 0.009956 119 City of Cedar Vale 13,404 - 13,404 0.008391 120 City of Chanute 606,488 - 606,488 0.379676 122 City of Cherryvale 72,828 - 72,828 0.045592 123 City of Chetopa 43,074 - 43,074 0.026965 124 City of Cimarron 54,996 - 54,996 0.034429 125 City of Clay Center 121,080 - 121,080 0.075799 126 City of Coffeyville 478,850 - 478,850 0.299771
KANSAS PUBLIC EMPLOYEES RETIREMENT SYSTEMCOST-SHARING MULTIPLE-EMPLOYER DEFINED BENEFIT PENSION PLAN
14
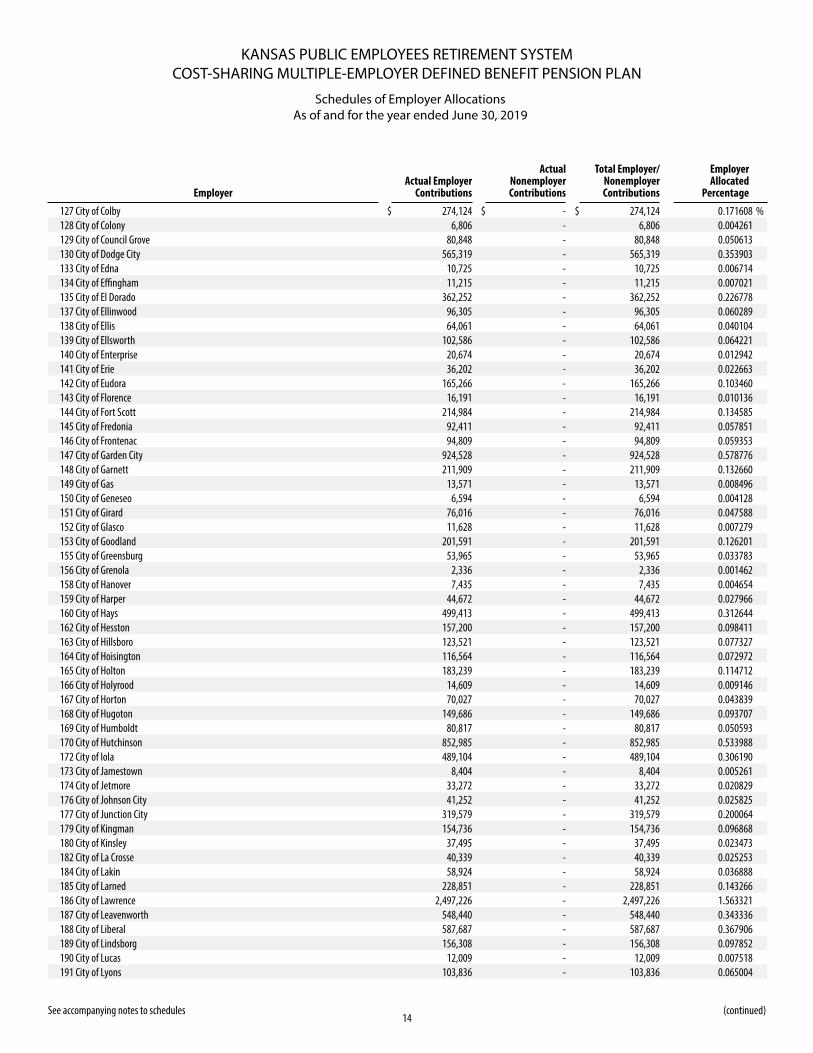
Schedules of Employer AllocationsAs of and for the year ended June 30, 2019
See accompanying notes to schedules (continued)
EmployerActual Employer
Contributions
Actual Nonemployer Contributions
Total Employer/ Nonemployer Contributions
Employer Allocated
Percentage
127 City of Colby $ 274,124 $ - $ 274,124 0.171608 %128 City of Colony 6,806 - 6,806 0.004261 129 City of Council Grove 80,848 - 80,848 0.050613 130 City of Dodge City 565,319 - 565,319 0.353903 133 City of Edna 10,725 - 10,725 0.006714 134 City of Effingham 11,215 - 11,215 0.007021 135 City of El Dorado 362,252 - 362,252 0.226778 137 City of Ellinwood 96,305 - 96,305 0.060289 138 City of Ellis 64,061 - 64,061 0.040104 139 City of Ellsworth 102,586 - 102,586 0.064221 140 City of Enterprise 20,674 - 20,674 0.012942 141 City of Erie 36,202 - 36,202 0.022663 142 City of Eudora 165,266 - 165,266 0.103460 143 City of Florence 16,191 - 16,191 0.010136 144 City of Fort Scott 214,984 - 214,984 0.134585 145 City of Fredonia 92,411 - 92,411 0.057851 146 City of Frontenac 94,809 - 94,809 0.059353 147 City of Garden City 924,528 - 924,528 0.578776 148 City of Garnett 211,909 - 211,909 0.132660 149 City of Gas 13,571 - 13,571 0.008496 150 City of Geneseo 6,594 - 6,594 0.004128 151 City of Girard 76,016 - 76,016 0.047588 152 City of Glasco 11,628 - 11,628 0.007279 153 City of Goodland 201,591 - 201,591 0.126201 155 City of Greensburg 53,965 - 53,965 0.033783 156 City of Grenola 2,336 - 2,336 0.001462 158 City of Hanover 7,435 - 7,435 0.004654 159 City of Harper 44,672 - 44,672 0.027966 160 City of Hays 499,413 - 499,413 0.312644 162 City of Hesston 157,200 - 157,200 0.098411 163 City of Hillsboro 123,521 - 123,521 0.077327 164 City of Hoisington 116,564 - 116,564 0.072972 165 City of Holton 183,239 - 183,239 0.114712 166 City of Holyrood 14,609 - 14,609 0.009146 167 City of Horton 70,027 - 70,027 0.043839 168 City of Hugoton 149,686 - 149,686 0.093707 169 City of Humboldt 80,817 - 80,817 0.050593 170 City of Hutchinson 852,985 - 852,985 0.533988 172 City of Iola 489,104 - 489,104 0.306190 173 City of Jamestown 8,404 - 8,404 0.005261 174 City of Jetmore 33,272 - 33,272 0.020829 176 City of Johnson City 41,252 - 41,252 0.025825 177 City of Junction City 319,579 - 319,579 0.200064 179 City of Kingman 154,736 - 154,736 0.096868 180 City of Kinsley 37,495 - 37,495 0.023473 182 City of La Crosse 40,339 - 40,339 0.025253 184 City of Lakin 58,924 - 58,924 0.036888 185 City of Larned 228,851 - 228,851 0.143266 186 City of Lawrence 2,497,226 - 2,497,226 1.563321 187 City of Leavenworth 548,440 - 548,440 0.343336 188 City of Liberal 587,687 - 587,687 0.367906 189 City of Lindsborg 156,308 - 156,308 0.097852 190 City of Lucas 12,009 - 12,009 0.007518 191 City of Lyons 103,836 - 103,836 0.065004
KANSAS PUBLIC EMPLOYEES RETIREMENT SYSTEMCOST-SHARING MULTIPLE-EMPLOYER DEFINED BENEFIT PENSION PLAN
15
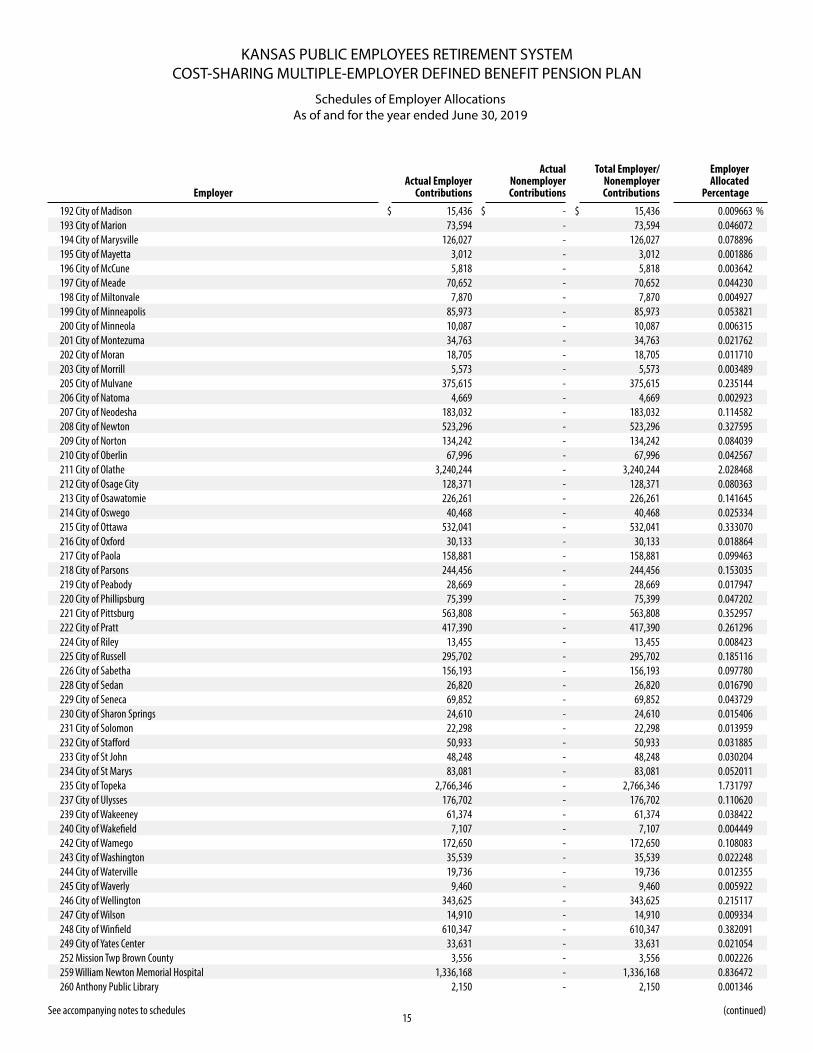
Schedules of Employer AllocationsAs of and for the year ended June 30, 2019
See accompanying notes to schedules (continued)
EmployerActual Employer
Contributions
Actual Nonemployer Contributions
Total Employer/ Nonemployer Contributions
Employer Allocated
Percentage
192 City of Madison $ 15,436 $ - $ 15,436 0.009663 %193 City of Marion 73,594 - 73,594 0.046072 194 City of Marysville 126,027 - 126,027 0.078896 195 City of Mayetta 3,012 - 3,012 0.001886 196 City of McCune 5,818 - 5,818 0.003642 197 City of Meade 70,652 - 70,652 0.044230 198 City of Miltonvale 7,870 - 7,870 0.004927 199 City of Minneapolis 85,973 - 85,973 0.053821 200 City of Minneola 10,087 - 10,087 0.006315 201 City of Montezuma 34,763 - 34,763 0.021762 202 City of Moran 18,705 - 18,705 0.011710 203 City of Morrill 5,573 - 5,573 0.003489 205 City of Mulvane 375,615 - 375,615 0.235144 206 City of Natoma 4,669 - 4,669 0.002923 207 City of Neodesha 183,032 - 183,032 0.114582 208 City of Newton 523,296 - 523,296 0.327595 209 City of Norton 134,242 - 134,242 0.084039 210 City of Oberlin 67,996 - 67,996 0.042567 211 City of Olathe 3,240,244 - 3,240,244 2.028468 212 City of Osage City 128,371 - 128,371 0.080363 213 City of Osawatomie 226,261 - 226,261 0.141645 214 City of Oswego 40,468 - 40,468 0.025334 215 City of Ottawa 532,041 - 532,041 0.333070 216 City of Oxford 30,133 - 30,133 0.018864 217 City of Paola 158,881 - 158,881 0.099463 218 City of Parsons 244,456 - 244,456 0.153035 219 City of Peabody 28,669 - 28,669 0.017947 220 City of Phillipsburg 75,399 - 75,399 0.047202 221 City of Pittsburg 563,808 - 563,808 0.352957 222 City of Pratt 417,390 - 417,390 0.261296 224 City of Riley 13,455 - 13,455 0.008423 225 City of Russell 295,702 - 295,702 0.185116 226 City of Sabetha 156,193 - 156,193 0.097780 228 City of Sedan 26,820 - 26,820 0.016790 229 City of Seneca 69,852 - 69,852 0.043729 230 City of Sharon Springs 24,610 - 24,610 0.015406 231 City of Solomon 22,298 - 22,298 0.013959 232 City of Stafford 50,933 - 50,933 0.031885 233 City of St John 48,248 - 48,248 0.030204 234 City of St Marys 83,081 - 83,081 0.052011 235 City of Topeka 2,766,346 - 2,766,346 1.731797 237 City of Ulysses 176,702 - 176,702 0.110620 239 City of Wakeeney 61,374 - 61,374 0.038422 240 City of Wakefield 7,107 - 7,107 0.004449 242 City of Wamego 172,650 - 172,650 0.108083 243 City of Washington 35,539 - 35,539 0.022248 244 City of Waterville 19,736 - 19,736 0.012355 245 City of Waverly 9,460 - 9,460 0.005922 246 City of Wellington 343,625 - 343,625 0.215117 247 City of Wilson 14,910 - 14,910 0.009334 248 City of Winfield 610,347 - 610,347 0.382091 249 City of Yates Center 33,631 - 33,631 0.021054 252 Mission Twp Brown County 3,556 - 3,556 0.002226 259 William Newton Memorial Hospital 1,336,168 - 1,336,168 0.836472 260 Anthony Public Library 2,150 - 2,150 0.001346
KANSAS PUBLIC EMPLOYEES RETIREMENT SYSTEMCOST-SHARING MULTIPLE-EMPLOYER DEFINED BENEFIT PENSION PLAN
16
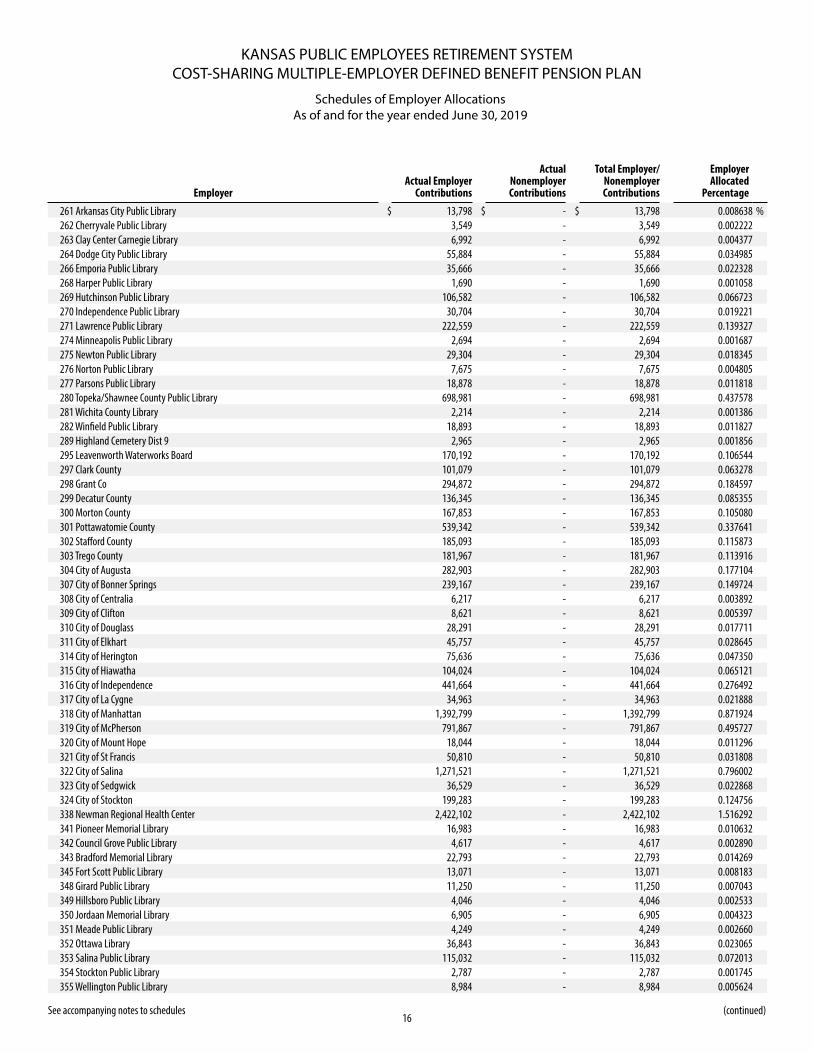
Schedules of Employer AllocationsAs of and for the year ended June 30, 2019
See accompanying notes to schedules (continued)
EmployerActual Employer
Contributions
Actual Nonemployer Contributions
Total Employer/ Nonemployer Contributions
Employer Allocated
Percentage
261 Arkansas City Public Library $ 13,798 $ - $ 13,798 0.008638 %262 Cherryvale Public Library 3,549 - 3,549 0.002222 263 Clay Center Carnegie Library 6,992 - 6,992 0.004377 264 Dodge City Public Library 55,884 - 55,884 0.034985 266 Emporia Public Library 35,666 - 35,666 0.022328 268 Harper Public Library 1,690 - 1,690 0.001058 269 Hutchinson Public Library 106,582 - 106,582 0.066723 270 Independence Public Library 30,704 - 30,704 0.019221 271 Lawrence Public Library 222,559 - 222,559 0.139327 274 Minneapolis Public Library 2,694 - 2,694 0.001687 275 Newton Public Library 29,304 - 29,304 0.018345 276 Norton Public Library 7,675 - 7,675 0.004805 277 Parsons Public Library 18,878 - 18,878 0.011818 280 Topeka/Shawnee County Public Library 698,981 - 698,981 0.437578 281 Wichita County Library 2,214 - 2,214 0.001386 282 Winfield Public Library 18,893 - 18,893 0.011827 289 Highland Cemetery Dist 9 2,965 - 2,965 0.001856 295 Leavenworth Waterworks Board 170,192 - 170,192 0.106544 297 Clark County 101,079 - 101,079 0.063278 298 Grant Co 294,872 - 294,872 0.184597 299 Decatur County 136,345 - 136,345 0.085355 300 Morton County 167,853 - 167,853 0.105080 301 Pottawatomie County 539,342 - 539,342 0.337641 302 Stafford County 185,093 - 185,093 0.115873 303 Trego County 181,967 - 181,967 0.113916 304 City of Augusta 282,903 - 282,903 0.177104 307 City of Bonner Springs 239,167 - 239,167 0.149724 308 City of Centralia 6,217 - 6,217 0.003892 309 City of Clifton 8,621 - 8,621 0.005397 310 City of Douglass 28,291 - 28,291 0.017711 311 City of Elkhart 45,757 - 45,757 0.028645 314 City of Herington 75,636 - 75,636 0.047350 315 City of Hiawatha 104,024 - 104,024 0.065121 316 City of Independence 441,664 - 441,664 0.276492 317 City of La Cygne 34,963 - 34,963 0.021888 318 City of Manhattan 1,392,799 - 1,392,799 0.871924 319 City of McPherson 791,867 - 791,867 0.495727 320 City of Mount Hope 18,044 - 18,044 0.011296 321 City of St Francis 50,810 - 50,810 0.031808 322 City of Salina 1,271,521 - 1,271,521 0.796002 323 City of Sedgwick 36,529 - 36,529 0.022868 324 City of Stockton 199,283 - 199,283 0.124756 338 Newman Regional Health Center 2,422,102 - 2,422,102 1.516292 341 Pioneer Memorial Library 16,983 - 16,983 0.010632 342 Council Grove Public Library 4,617 - 4,617 0.002890 343 Bradford Memorial Library 22,793 - 22,793 0.014269 345 Fort Scott Public Library 13,071 - 13,071 0.008183 348 Girard Public Library 11,250 - 11,250 0.007043 349 Hillsboro Public Library 4,046 - 4,046 0.002533 350 Jordaan Memorial Library 6,905 - 6,905 0.004323 351 Meade Public Library 4,249 - 4,249 0.002660 352 Ottawa Library 36,843 - 36,843 0.023065 353 Salina Public Library 115,032 - 115,032 0.072013 354 Stockton Public Library 2,787 - 2,787 0.001745 355 Wellington Public Library 8,984 - 8,984 0.005624
KANSAS PUBLIC EMPLOYEES RETIREMENT SYSTEMCOST-SHARING MULTIPLE-EMPLOYER DEFINED BENEFIT PENSION PLAN
17
Schedules of Employer AllocationsAs of and for the year ended June 30, 2019
See accompanying notes to schedules (continued)
EmployerActual Employer
Contributions
Actual Nonemployer Contributions
Total Employer/ Nonemployer Contributions
Employer Allocated
Percentage
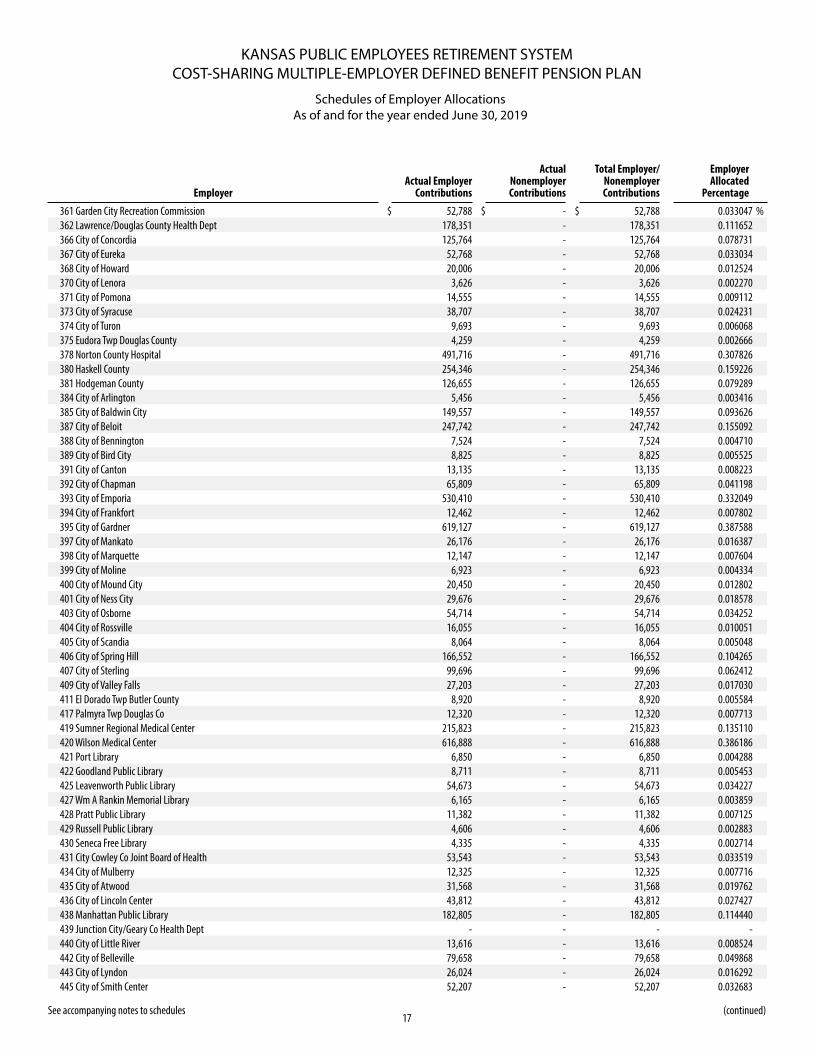
361 Garden City Recreation Commission $ 52,788 $ - $ 52,788 0.033047 %362 Lawrence/Douglas County Health Dept 178,351 - 178,351 0.111652 366 City of Concordia 125,764 - 125,764 0.078731 367 City of Eureka 52,768 - 52,768 0.033034 368 City of Howard 20,006 - 20,006 0.012524 370 City of Lenora 3,626 - 3,626 0.002270 371 City of Pomona 14,555 - 14,555 0.009112 373 City of Syracuse 38,707 - 38,707 0.024231 374 City of Turon 9,693 - 9,693 0.006068 375 Eudora Twp Douglas County 4,259 - 4,259 0.002666 378 Norton County Hospital 491,716 - 491,716 0.307826 380 Haskell County 254,346 - 254,346 0.159226 381 Hodgeman County 126,655 - 126,655 0.079289 384 City of Arlington 5,456 - 5,456 0.003416 385 City of Baldwin City 149,557 - 149,557 0.093626 387 City of Beloit 247,742 - 247,742 0.155092 388 City of Bennington 7,524 - 7,524 0.004710 389 City of Bird City 8,825 - 8,825 0.005525 391 City of Canton 13,135 - 13,135 0.008223 392 City of Chapman 65,809 - 65,809 0.041198 393 City of Emporia 530,410 - 530,410 0.332049 394 City of Frankfort 12,462 - 12,462 0.007802 395 City of Gardner 619,127 - 619,127 0.387588 397 City of Mankato 26,176 - 26,176 0.016387 398 City of Marquette 12,147 - 12,147 0.007604 399 City of Moline 6,923 - 6,923 0.004334 400 City of Mound City 20,450 - 20,450 0.012802 401 City of Ness City 29,676 - 29,676 0.018578 403 City of Osborne 54,714 - 54,714 0.034252 404 City of Rossville 16,055 - 16,055 0.010051 405 City of Scandia 8,064 - 8,064 0.005048 406 City of Spring Hill 166,552 - 166,552 0.104265 407 City of Sterling 99,696 - 99,696 0.062412 409 City of Valley Falls 27,203 - 27,203 0.017030 411 El Dorado Twp Butler County 8,920 - 8,920 0.005584 417 Palmyra Twp Douglas Co 12,320 - 12,320 0.007713 419 Sumner Regional Medical Center 215,823 - 215,823 0.135110 420 Wilson Medical Center 616,888 - 616,888 0.386186 421 Port Library 6,850 - 6,850 0.004288 422 Goodland Public Library 8,711 - 8,711 0.005453 425 Leavenworth Public Library 54,673 - 54,673 0.034227 427 Wm A Rankin Memorial Library 6,165 - 6,165 0.003859 428 Pratt Public Library 11,382 - 11,382 0.007125 429 Russell Public Library 4,606 - 4,606 0.002883 430 Seneca Free Library 4,335 - 4,335 0.002714 431 City Cowley Co Joint Board of Health 53,543 - 53,543 0.033519 434 City of Mulberry 12,325 - 12,325 0.007716 435 City of Atwood 31,568 - 31,568 0.019762 436 City of Lincoln Center 43,812 - 43,812 0.027427 438 Manhattan Public Library 182,805 - 182,805 0.114440 439 Junction City/Geary Co Health Dept - - - - 440 City of Little River 13,616 - 13,616 0.008524 442 City of Belleville 79,658 - 79,658 0.049868 443 City of Lyndon 26,024 - 26,024 0.016292 445 City of Smith Center 52,207 - 52,207 0.032683
KANSAS PUBLIC EMPLOYEES RETIREMENT SYSTEMCOST-SHARING MULTIPLE-EMPLOYER DEFINED BENEFIT PENSION PLAN
18
Schedules of Employer AllocationsAs of and for the year ended June 30, 2019
See accompanying notes to schedules (continued)
EmployerActual Employer
Contributions
Actual Nonemployer Contributions
Total Employer/ Nonemployer Contributions
Employer Allocated
Percentage
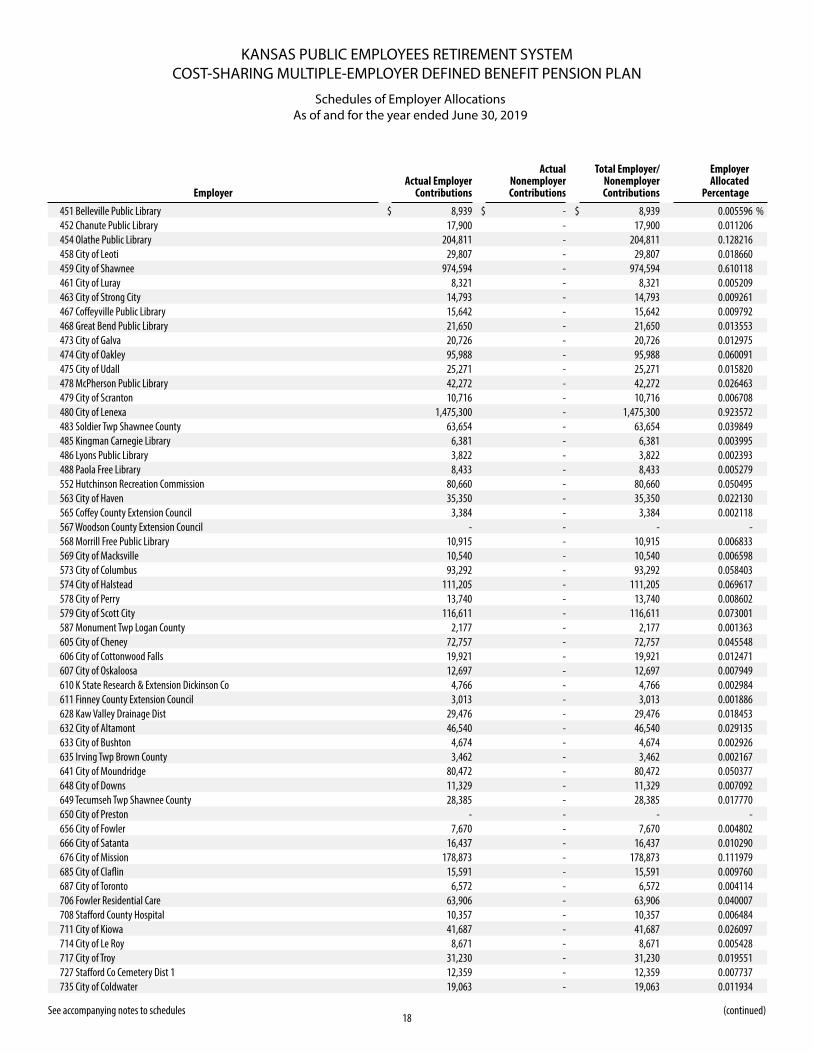
451 Belleville Public Library $ 8,939 $ - $ 8,939 0.005596 %452 Chanute Public Library 17,900 - 17,900 0.011206 454 Olathe Public Library 204,811 - 204,811 0.128216 458 City of Leoti 29,807 - 29,807 0.018660 459 City of Shawnee 974,594 - 974,594 0.610118 461 City of Luray 8,321 - 8,321 0.005209 463 City of Strong City 14,793 - 14,793 0.009261 467 Coffeyville Public Library 15,642 - 15,642 0.009792 468 Great Bend Public Library 21,650 - 21,650 0.013553 473 City of Galva 20,726 - 20,726 0.012975 474 City of Oakley 95,988 - 95,988 0.060091 475 City of Udall 25,271 - 25,271 0.015820 478 McPherson Public Library 42,272 - 42,272 0.026463 479 City of Scranton 10,716 - 10,716 0.006708 480 City of Lenexa 1,475,300 - 1,475,300 0.923572 483 Soldier Twp Shawnee County 63,654 - 63,654 0.039849 485 Kingman Carnegie Library 6,381 - 6,381 0.003995 486 Lyons Public Library 3,822 - 3,822 0.002393 488 Paola Free Library 8,433 - 8,433 0.005279 552 Hutchinson Recreation Commission 80,660 - 80,660 0.050495 563 City of Haven 35,350 - 35,350 0.022130 565 Coffey County Extension Council 3,384 - 3,384 0.002118 567 Woodson County Extension Council - - - - 568 Morrill Free Public Library 10,915 - 10,915 0.006833 569 City of Macksville 10,540 - 10,540 0.006598 573 City of Columbus 93,292 - 93,292 0.058403 574 City of Halstead 111,205 - 111,205 0.069617 578 City of Perry 13,740 - 13,740 0.008602 579 City of Scott City 116,611 - 116,611 0.073001 587 Monument Twp Logan County 2,177 - 2,177 0.001363 605 City of Cheney 72,757 - 72,757 0.045548 606 City of Cottonwood Falls 19,921 - 19,921 0.012471 607 City of Oskaloosa 12,697 - 12,697 0.007949 610 K State Research & Extension Dickinson Co 4,766 - 4,766 0.002984 611 Finney County Extension Council 3,013 - 3,013 0.001886 628 Kaw Valley Drainage Dist 29,476 - 29,476 0.018453 632 City of Altamont 46,540 - 46,540 0.029135 633 City of Bushton 4,674 - 4,674 0.002926 635 Irving Twp Brown County 3,462 - 3,462 0.002167 641 City of Moundridge 80,472 - 80,472 0.050377 648 City of Downs 11,329 - 11,329 0.007092 649 Tecumseh Twp Shawnee County 28,385 - 28,385 0.017770 650 City of Preston - - - - 656 City of Fowler 7,670 - 7,670 0.004802 666 City of Satanta 16,437 - 16,437 0.010290 676 City of Mission 178,873 - 178,873 0.111979 685 City of Claflin 15,591 - 15,591 0.009760 687 City of Toronto 6,572 - 6,572 0.004114 706 Fowler Residential Care 63,906 - 63,906 0.040007 708 Stafford County Hospital 10,357 - 10,357 0.006484 711 City of Kiowa 41,687 - 41,687 0.026097 714 City of Le Roy 8,671 - 8,671 0.005428 717 City of Troy 31,230 - 31,230 0.019551 727 Stafford Co Cemetery Dist 1 12,359 - 12,359 0.007737 735 City of Coldwater 19,063 - 19,063 0.011934
KANSAS PUBLIC EMPLOYEES RETIREMENT SYSTEMCOST-SHARING MULTIPLE-EMPLOYER DEFINED BENEFIT PENSION PLAN
19
Schedules of Employer AllocationsAs of and for the year ended June 30, 2019
See accompanying notes to schedules (continued)
EmployerActual Employer
Contributions
Actual Nonemployer Contributions
Total Employer/ Nonemployer Contributions
Employer Allocated
Percentage
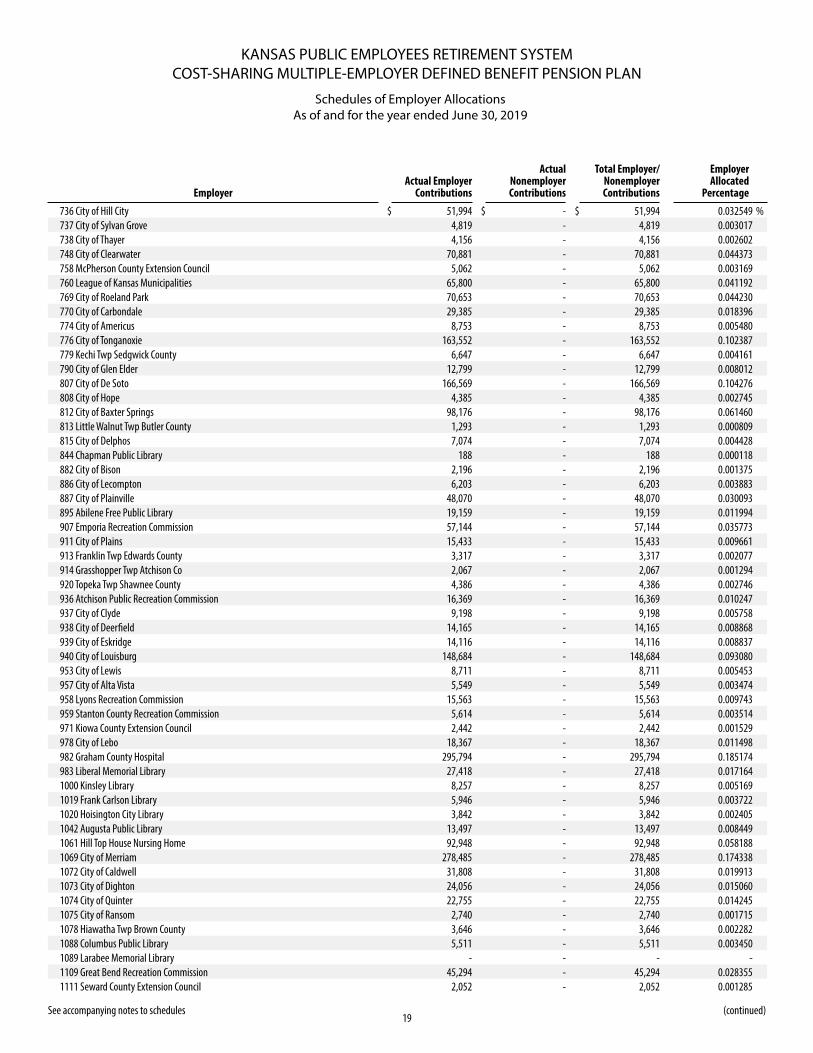
736 City of Hill City $ 51,994 $ - $ 51,994 0.032549 %737 City of Sylvan Grove 4,819 - 4,819 0.003017 738 City of Thayer 4,156 - 4,156 0.002602 748 City of Clearwater 70,881 - 70,881 0.044373 758 McPherson County Extension Council 5,062 - 5,062 0.003169 760 League of Kansas Municipalities 65,800 - 65,800 0.041192 769 City of Roeland Park 70,653 - 70,653 0.044230 770 City of Carbondale 29,385 - 29,385 0.018396 774 City of Americus 8,753 - 8,753 0.005480 776 City of Tonganoxie 163,552 - 163,552 0.102387 779 Kechi Twp Sedgwick County 6,647 - 6,647 0.004161 790 City of Glen Elder 12,799 - 12,799 0.008012 807 City of De Soto 166,569 - 166,569 0.104276 808 City of Hope 4,385 - 4,385 0.002745 812 City of Baxter Springs 98,176 - 98,176 0.061460 813 Little Walnut Twp Butler County 1,293 - 1,293 0.000809 815 City of Delphos 7,074 - 7,074 0.004428 844 Chapman Public Library 188 - 188 0.000118 882 City of Bison 2,196 - 2,196 0.001375 886 City of Lecompton 6,203 - 6,203 0.003883 887 City of Plainville 48,070 - 48,070 0.030093 895 Abilene Free Public Library 19,159 - 19,159 0.011994 907 Emporia Recreation Commission 57,144 - 57,144 0.035773 911 City of Plains 15,433 - 15,433 0.009661 913 Franklin Twp Edwards County 3,317 - 3,317 0.002077 914 Grasshopper Twp Atchison Co 2,067 - 2,067 0.001294 920 Topeka Twp Shawnee County 4,386 - 4,386 0.002746 936 Atchison Public Recreation Commission 16,369 - 16,369 0.010247 937 City of Clyde 9,198 - 9,198 0.005758 938 City of Deerfield 14,165 - 14,165 0.008868 939 City of Eskridge 14,116 - 14,116 0.008837 940 City of Louisburg 148,684 - 148,684 0.093080 953 City of Lewis 8,711 - 8,711 0.005453 957 City of Alta Vista 5,549 - 5,549 0.003474 958 Lyons Recreation Commission 15,563 - 15,563 0.009743 959 Stanton County Recreation Commission 5,614 - 5,614 0.003514 971 Kiowa County Extension Council 2,442 - 2,442 0.001529 978 City of Lebo 18,367 - 18,367 0.011498 982 Graham County Hospital 295,794 - 295,794 0.185174 983 Liberal Memorial Library 27,418 - 27,418 0.017164 1000 Kinsley Library 8,257 - 8,257 0.005169 1019 Frank Carlson Library 5,946 - 5,946 0.003722 1020 Hoisington City Library 3,842 - 3,842 0.002405 1042 Augusta Public Library 13,497 - 13,497 0.008449 1061 Hill Top House Nursing Home 92,948 - 92,948 0.058188 1069 City of Merriam 278,485 - 278,485 0.174338 1072 City of Caldwell 31,808 - 31,808 0.019913 1073 City of Dighton 24,056 - 24,056 0.015060 1074 City of Quinter 22,755 - 22,755 0.014245 1075 City of Ransom 2,740 - 2,740 0.001715 1078 Hiawatha Twp Brown County 3,646 - 3,646 0.002282 1088 Columbus Public Library 5,511 - 5,511 0.003450 1089 Larabee Memorial Library - - - - 1109 Great Bend Recreation Commission 45,294 - 45,294 0.028355 1111 Seward County Extension Council 2,052 - 2,052 0.001285
KANSAS PUBLIC EMPLOYEES RETIREMENT SYSTEMCOST-SHARING MULTIPLE-EMPLOYER DEFINED BENEFIT PENSION PLAN
20
Schedules of Employer AllocationsAs of and for the year ended June 30, 2019
See accompanying notes to schedules (continued)
EmployerActual Employer
Contributions
Actual Nonemployer Contributions
Total Employer/ Nonemployer Contributions
Employer Allocated
Percentage
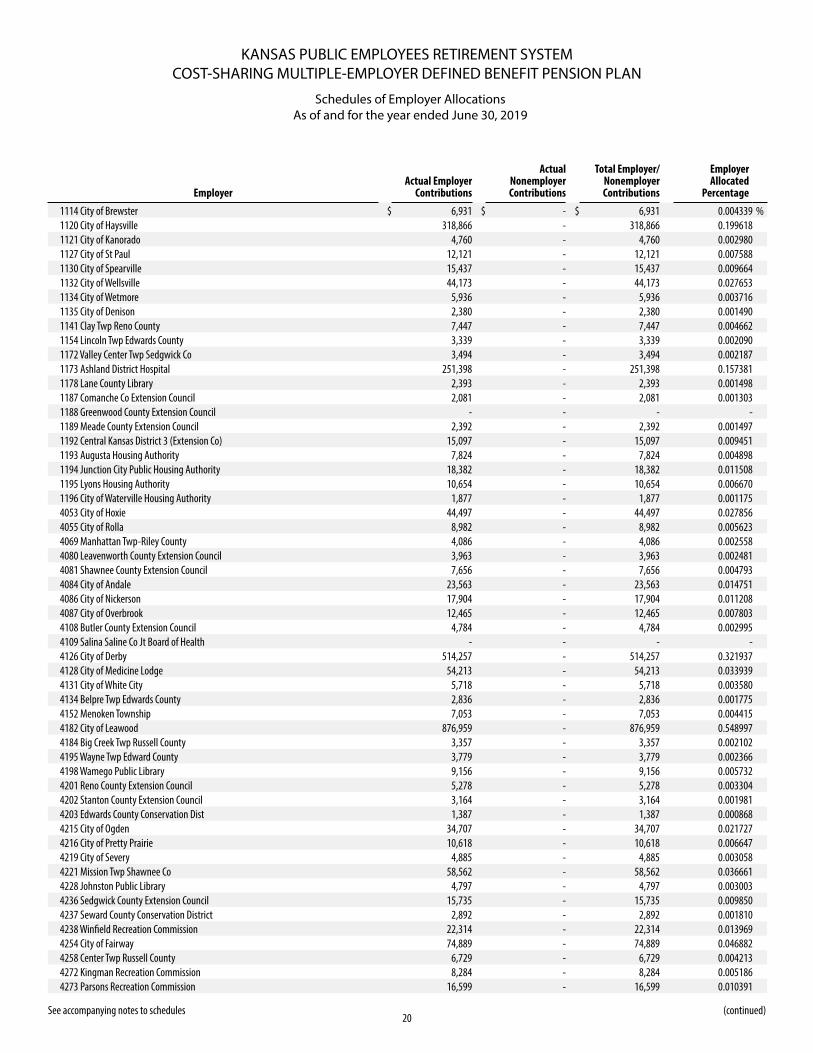
1114 City of Brewster $ 6,931 $ - $ 6,931 0.004339 %1120 City of Haysville 318,866 - 318,866 0.199618 1121 City of Kanorado 4,760 - 4,760 0.002980 1127 City of St Paul 12,121 - 12,121 0.007588 1130 City of Spearville 15,437 - 15,437 0.009664 1132 City of Wellsville 44,173 - 44,173 0.027653 1134 City of Wetmore 5,936 - 5,936 0.003716 1135 City of Denison 2,380 - 2,380 0.001490 1141 Clay Twp Reno County 7,447 - 7,447 0.004662 1154 Lincoln Twp Edwards County 3,339 - 3,339 0.002090 1172 Valley Center Twp Sedgwick Co 3,494 - 3,494 0.002187 1173 Ashland District Hospital 251,398 - 251,398 0.157381 1178 Lane County Library 2,393 - 2,393 0.001498 1187 Comanche Co Extension Council 2,081 - 2,081 0.001303 1188 Greenwood County Extension Council - - - - 1189 Meade County Extension Council 2,392 - 2,392 0.001497 1192 Central Kansas District 3 (Extension Co) 15,097 - 15,097 0.009451 1193 Augusta Housing Authority 7,824 - 7,824 0.004898 1194 Junction City Public Housing Authority 18,382 - 18,382 0.011508 1195 Lyons Housing Authority 10,654 - 10,654 0.006670 1196 City of Waterville Housing Authority 1,877 - 1,877 0.001175 4053 City of Hoxie 44,497 - 44,497 0.027856 4055 City of Rolla 8,982 - 8,982 0.005623 4069 Manhattan Twp-Riley County 4,086 - 4,086 0.002558 4080 Leavenworth County Extension Council 3,963 - 3,963 0.002481 4081 Shawnee County Extension Council 7,656 - 7,656 0.004793 4084 City of Andale 23,563 - 23,563 0.014751 4086 City of Nickerson 17,904 - 17,904 0.011208 4087 City of Overbrook 12,465 - 12,465 0.007803 4108 Butler County Extension Council 4,784 - 4,784 0.002995 4109 Salina Saline Co Jt Board of Health - - - - 4126 City of Derby 514,257 - 514,257 0.321937 4128 City of Medicine Lodge 54,213 - 54,213 0.033939 4131 City of White City 5,718 - 5,718 0.003580 4134 Belpre Twp Edwards County 2,836 - 2,836 0.001775 4152 Menoken Township 7,053 - 7,053 0.004415 4182 City of Leawood 876,959 - 876,959 0.548997 4184 Big Creek Twp Russell County 3,357 - 3,357 0.002102 4195 Wayne Twp Edward County 3,779 - 3,779 0.002366 4198 Wamego Public Library 9,156 - 9,156 0.005732 4201 Reno County Extension Council 5,278 - 5,278 0.003304 4202 Stanton County Extension Council 3,164 - 3,164 0.001981 4203 Edwards County Conservation Dist 1,387 - 1,387 0.000868 4215 City of Ogden 34,707 - 34,707 0.021727 4216 City of Pretty Prairie 10,618 - 10,618 0.006647 4219 City of Severy 4,885 - 4,885 0.003058 4221 Mission Twp Shawnee Co 58,562 - 58,562 0.036661 4228 Johnston Public Library 4,797 - 4,797 0.003003 4236 Sedgwick County Extension Council 15,735 - 15,735 0.009850 4237 Seward County Conservation District 2,892 - 2,892 0.001810 4238 Winfield Recreation Commission 22,314 - 22,314 0.013969 4254 City of Fairway 74,889 - 74,889 0.046882 4258 Center Twp Russell County 6,729 - 6,729 0.004213 4272 Kingman Recreation Commission 8,284 - 8,284 0.005186 4273 Parsons Recreation Commission 16,599 - 16,599 0.010391
KANSAS PUBLIC EMPLOYEES RETIREMENT SYSTEMCOST-SHARING MULTIPLE-EMPLOYER DEFINED BENEFIT PENSION PLAN
21
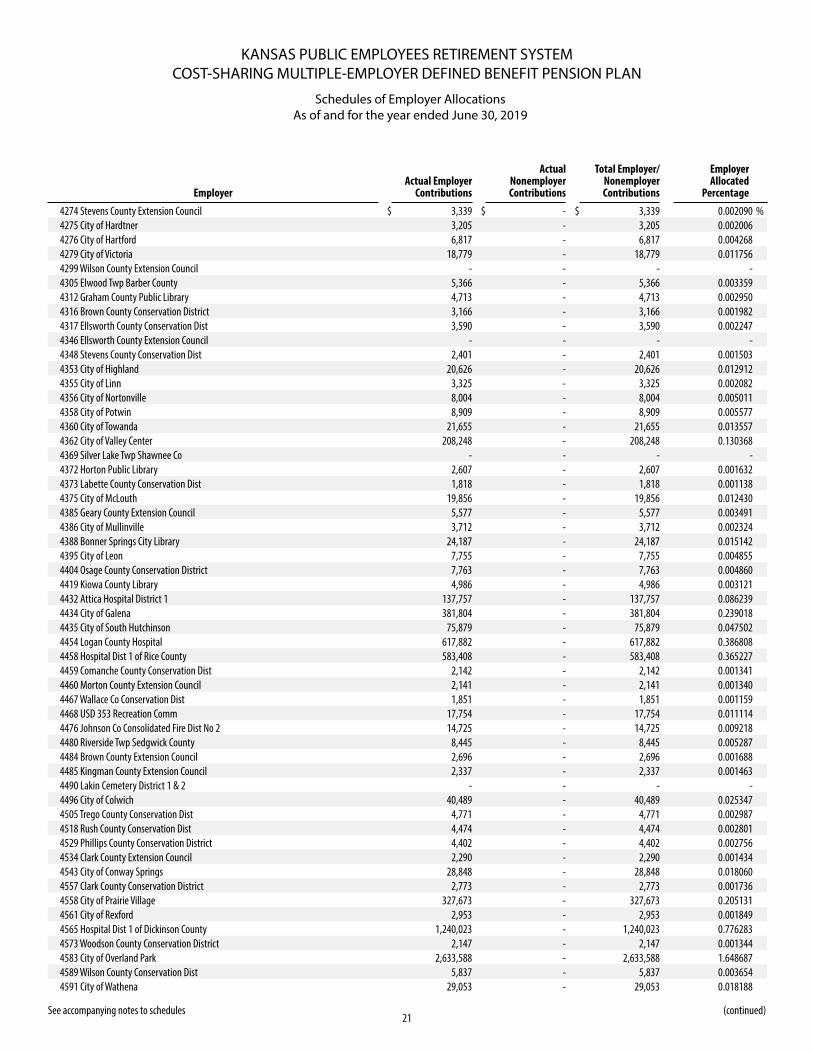
Schedules of Employer AllocationsAs of and for the year ended June 30, 2019
See accompanying notes to schedules (continued)
EmployerActual Employer
Contributions
Actual Nonemployer Contributions
Total Employer/ Nonemployer Contributions
Employer Allocated
Percentage
4274 Stevens County Extension Council $ 3,339 $ - $ 3,339 0.002090 %4275 City of Hardtner 3,205 - 3,205 0.002006 4276 City of Hartford 6,817 - 6,817 0.004268 4279 City of Victoria 18,779 - 18,779 0.011756 4299 Wilson County Extension Council - - - - 4305 Elwood Twp Barber County 5,366 - 5,366 0.003359 4312 Graham County Public Library 4,713 - 4,713 0.002950 4316 Brown County Conservation District 3,166 - 3,166 0.001982 4317 Ellsworth County Conservation Dist 3,590 - 3,590 0.002247 4346 Ellsworth County Extension Council - - - - 4348 Stevens County Conservation Dist 2,401 - 2,401 0.001503 4353 City of Highland 20,626 - 20,626 0.012912 4355 City of Linn 3,325 - 3,325 0.002082 4356 City of Nortonville 8,004 - 8,004 0.005011 4358 City of Potwin 8,909 - 8,909 0.005577 4360 City of Towanda 21,655 - 21,655 0.013557 4362 City of Valley Center 208,248 - 208,248 0.130368 4369 Silver Lake Twp Shawnee Co - - - - 4372 Horton Public Library 2,607 - 2,607 0.001632 4373 Labette County Conservation Dist 1,818 - 1,818 0.001138 4375 City of McLouth 19,856 - 19,856 0.012430 4385 Geary County Extension Council 5,577 - 5,577 0.003491 4386 City of Mullinville 3,712 - 3,712 0.002324 4388 Bonner Springs City Library 24,187 - 24,187 0.015142 4395 City of Leon 7,755 - 7,755 0.004855 4404 Osage County Conservation District 7,763 - 7,763 0.004860 4419 Kiowa County Library 4,986 - 4,986 0.003121 4432 Attica Hospital District 1 137,757 - 137,757 0.086239 4434 City of Galena 381,804 - 381,804 0.239018 4435 City of South Hutchinson 75,879 - 75,879 0.047502 4454 Logan County Hospital 617,882 - 617,882 0.386808 4458 Hospital Dist 1 of Rice County 583,408 - 583,408 0.365227 4459 Comanche County Conservation Dist 2,142 - 2,142 0.001341 4460 Morton County Extension Council 2,141 - 2,141 0.001340 4467 Wallace Co Conservation Dist 1,851 - 1,851 0.001159 4468 USD 353 Recreation Comm 17,754 - 17,754 0.011114 4476 Johnson Co Consolidated Fire Dist No 2 14,725 - 14,725 0.009218 4480 Riverside Twp Sedgwick County 8,445 - 8,445 0.005287 4484 Brown County Extension Council 2,696 - 2,696 0.001688 4485 Kingman County Extension Council 2,337 - 2,337 0.001463 4490 Lakin Cemetery District 1 & 2 - - - - 4496 City of Colwich 40,489 - 40,489 0.025347 4505 Trego County Conservation Dist 4,771 - 4,771 0.002987 4518 Rush County Conservation Dist 4,474 - 4,474 0.002801 4529 Phillips County Conservation District 4,402 - 4,402 0.002756 4534 Clark County Extension Council 2,290 - 2,290 0.001434 4543 City of Conway Springs 28,848 - 28,848 0.018060 4557 Clark County Conservation District 2,773 - 2,773 0.001736 4558 City of Prairie Village 327,673 - 327,673 0.205131 4561 City of Rexford 2,953 - 2,953 0.001849 4565 Hospital Dist 1 of Dickinson County 1,240,023 - 1,240,023 0.776283 4573 Woodson County Conservation District 2,147 - 2,147 0.001344 4583 City of Overland Park 2,633,588 - 2,633,588 1.648687 4589 Wilson County Conservation Dist 5,837 - 5,837 0.003654 4591 City of Wathena 29,053 - 29,053 0.018188
KANSAS PUBLIC EMPLOYEES RETIREMENT SYSTEMCOST-SHARING MULTIPLE-EMPLOYER DEFINED BENEFIT PENSION PLAN
22
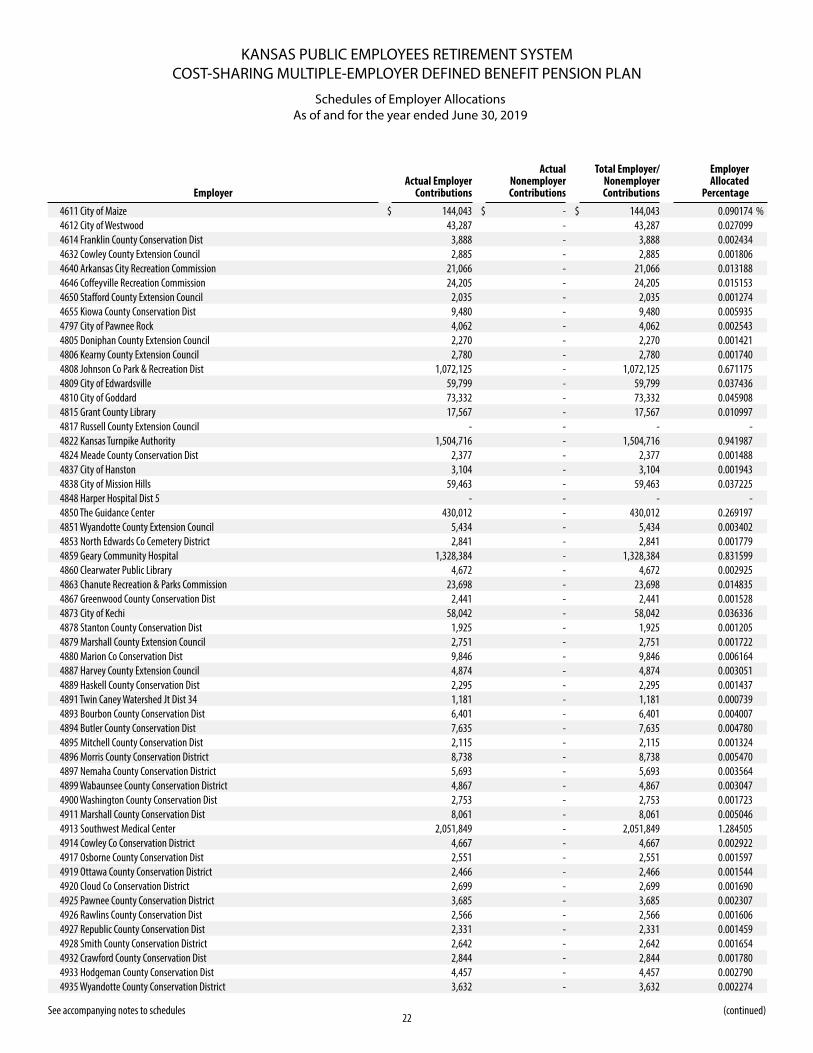
Schedules of Employer AllocationsAs of and for the year ended June 30, 2019
See accompanying notes to schedules (continued)
EmployerActual Employer
Contributions
Actual Nonemployer Contributions
Total Employer/ Nonemployer Contributions
Employer Allocated
Percentage
4611 City of Maize $ 144,043 $ - $ 144,043 0.090174 %4612 City of Westwood 43,287 - 43,287 0.027099 4614 Franklin County Conservation Dist 3,888 - 3,888 0.002434 4632 Cowley County Extension Council 2,885 - 2,885 0.001806 4640 Arkansas City Recreation Commission 21,066 - 21,066 0.013188 4646 Coffeyville Recreation Commission 24,205 - 24,205 0.015153 4650 Stafford County Extension Council 2,035 - 2,035 0.001274 4655 Kiowa County Conservation Dist 9,480 - 9,480 0.005935 4797 City of Pawnee Rock 4,062 - 4,062 0.002543 4805 Doniphan County Extension Council 2,270 - 2,270 0.001421 4806 Kearny County Extension Council 2,780 - 2,780 0.001740 4808 Johnson Co Park & Recreation Dist 1,072,125 - 1,072,125 0.671175 4809 City of Edwardsville 59,799 - 59,799 0.037436 4810 City of Goddard 73,332 - 73,332 0.045908 4815 Grant County Library 17,567 - 17,567 0.010997 4817 Russell County Extension Council - - - - 4822 Kansas Turnpike Authority 1,504,716 - 1,504,716 0.941987 4824 Meade County Conservation Dist 2,377 - 2,377 0.001488 4837 City of Hanston 3,104 - 3,104 0.001943 4838 City of Mission Hills 59,463 - 59,463 0.037225 4848 Harper Hospital Dist 5 - - - - 4850 The Guidance Center 430,012 - 430,012 0.269197 4851 Wyandotte County Extension Council 5,434 - 5,434 0.003402 4853 North Edwards Co Cemetery District 2,841 - 2,841 0.001779 4859 Geary Community Hospital 1,328,384 - 1,328,384 0.831599 4860 Clearwater Public Library 4,672 - 4,672 0.002925 4863 Chanute Recreation & Parks Commission 23,698 - 23,698 0.014835 4867 Greenwood County Conservation Dist 2,441 - 2,441 0.001528 4873 City of Kechi 58,042 - 58,042 0.036336 4878 Stanton County Conservation Dist 1,925 - 1,925 0.001205 4879 Marshall County Extension Council 2,751 - 2,751 0.001722 4880 Marion Co Conservation Dist 9,846 - 9,846 0.006164 4887 Harvey County Extension Council 4,874 - 4,874 0.003051 4889 Haskell County Conservation Dist 2,295 - 2,295 0.001437 4891 Twin Caney Watershed Jt Dist 34 1,181 - 1,181 0.000739 4893 Bourbon County Conservation Dist 6,401 - 6,401 0.004007 4894 Butler County Conservation Dist 7,635 - 7,635 0.004780 4895 Mitchell County Conservation Dist 2,115 - 2,115 0.001324 4896 Morris County Conservation District 8,738 - 8,738 0.005470 4897 Nemaha County Conservation District 5,693 - 5,693 0.003564 4899 Wabaunsee County Conservation District 4,867 - 4,867 0.003047 4900 Washington County Conservation Dist 2,753 - 2,753 0.001723 4911 Marshall County Conservation Dist 8,061 - 8,061 0.005046 4913 Southwest Medical Center 2,051,849 - 2,051,849 1.284505 4914 Cowley Co Conservation District 4,667 - 4,667 0.002922 4917 Osborne County Conservation Dist 2,551 - 2,551 0.001597 4919 Ottawa County Conservation District 2,466 - 2,466 0.001544 4920 Cloud Co Conservation District 2,699 - 2,699 0.001690 4925 Pawnee County Conservation District 3,685 - 3,685 0.002307 4926 Rawlins County Conservation Dist 2,566 - 2,566 0.001606 4927 Republic County Conservation Dist 2,331 - 2,331 0.001459 4928 Smith County Conservation District 2,642 - 2,642 0.001654 4932 Crawford County Conservation Dist 2,844 - 2,844 0.001780 4933 Hodgeman County Conservation Dist 4,457 - 4,457 0.002790 4935 Wyandotte County Conservation District 3,632 - 3,632 0.002274
KANSAS PUBLIC EMPLOYEES RETIREMENT SYSTEMCOST-SHARING MULTIPLE-EMPLOYER DEFINED BENEFIT PENSION PLAN
23
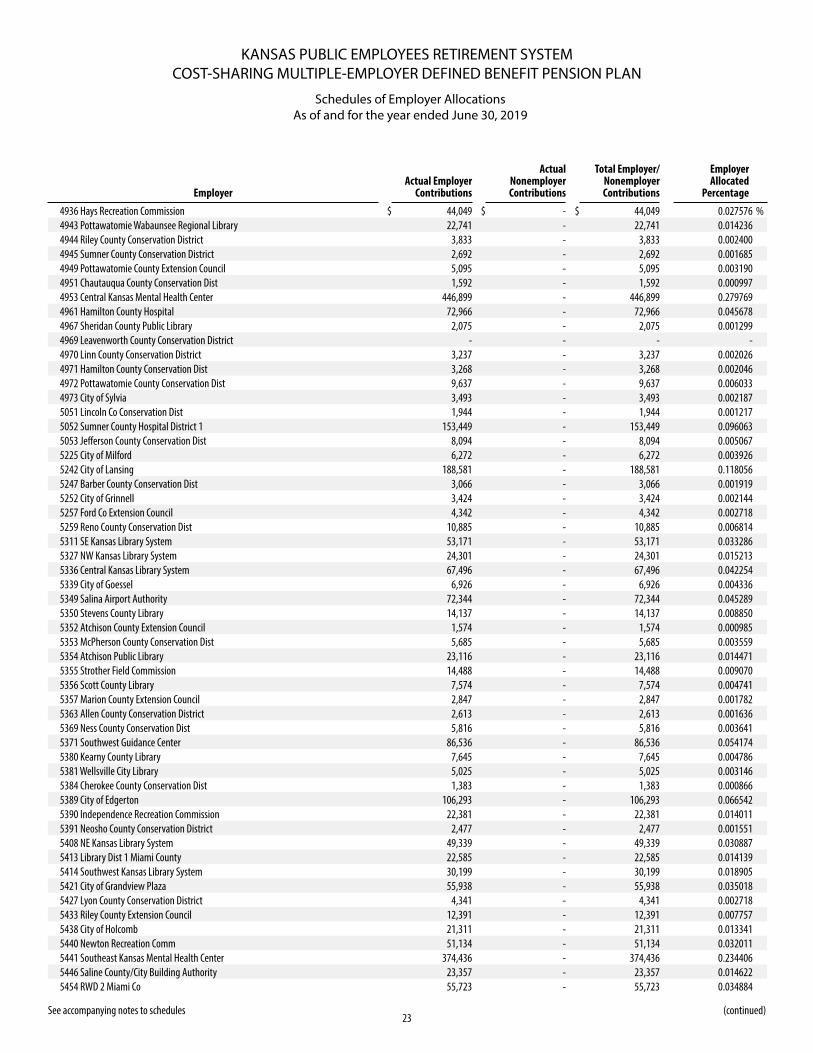
Schedules of Employer AllocationsAs of and for the year ended June 30, 2019
See accompanying notes to schedules (continued)
EmployerActual Employer
Contributions
Actual Nonemployer Contributions
Total Employer/ Nonemployer Contributions
Employer Allocated
Percentage
4936 Hays Recreation Commission $ 44,049 $ - $ 44,049 0.027576 %4943 Pottawatomie Wabaunsee Regional Library 22,741 - 22,741 0.014236 4944 Riley County Conservation District 3,833 - 3,833 0.002400 4945 Sumner County Conservation District 2,692 - 2,692 0.001685 4949 Pottawatomie County Extension Council 5,095 - 5,095 0.003190 4951 Chautauqua County Conservation Dist 1,592 - 1,592 0.000997 4953 Central Kansas Mental Health Center 446,899 - 446,899 0.279769 4961 Hamilton County Hospital 72,966 - 72,966 0.045678 4967 Sheridan County Public Library 2,075 - 2,075 0.001299 4969 Leavenworth County Conservation District - - - - 4970 Linn County Conservation District 3,237 - 3,237 0.002026 4971 Hamilton County Conservation Dist 3,268 - 3,268 0.002046 4972 Pottawatomie County Conservation Dist 9,637 - 9,637 0.006033 4973 City of Sylvia 3,493 - 3,493 0.002187 5051 Lincoln Co Conservation Dist 1,944 - 1,944 0.001217 5052 Sumner County Hospital District 1 153,449 - 153,449 0.096063 5053 Jefferson County Conservation Dist 8,094 - 8,094 0.005067 5225 City of Milford 6,272 - 6,272 0.003926 5242 City of Lansing 188,581 - 188,581 0.118056 5247 Barber County Conservation Dist 3,066 - 3,066 0.001919 5252 City of Grinnell 3,424 - 3,424 0.002144 5257 Ford Co Extension Council 4,342 - 4,342 0.002718 5259 Reno County Conservation Dist 10,885 - 10,885 0.006814 5311 SE Kansas Library System 53,171 - 53,171 0.033286 5327 NW Kansas Library System 24,301 - 24,301 0.015213 5336 Central Kansas Library System 67,496 - 67,496 0.042254 5339 City of Goessel 6,926 - 6,926 0.004336 5349 Salina Airport Authority 72,344 - 72,344 0.045289 5350 Stevens County Library 14,137 - 14,137 0.008850 5352 Atchison County Extension Council 1,574 - 1,574 0.000985 5353 McPherson County Conservation Dist 5,685 - 5,685 0.003559 5354 Atchison Public Library 23,116 - 23,116 0.014471 5355 Strother Field Commission 14,488 - 14,488 0.009070 5356 Scott County Library 7,574 - 7,574 0.004741 5357 Marion County Extension Council 2,847 - 2,847 0.001782 5363 Allen County Conservation District 2,613 - 2,613 0.001636 5369 Ness County Conservation Dist 5,816 - 5,816 0.003641 5371 Southwest Guidance Center 86,536 - 86,536 0.054174 5380 Kearny County Library 7,645 - 7,645 0.004786 5381 Wellsville City Library 5,025 - 5,025 0.003146 5384 Cherokee County Conservation Dist 1,383 - 1,383 0.000866 5389 City of Edgerton 106,293 - 106,293 0.066542 5390 Independence Recreation Commission 22,381 - 22,381 0.014011 5391 Neosho County Conservation District 2,477 - 2,477 0.001551 5408 NE Kansas Library System 49,339 - 49,339 0.030887 5413 Library Dist 1 Miami County 22,585 - 22,585 0.014139 5414 Southwest Kansas Library System 30,199 - 30,199 0.018905 5421 City of Grandview Plaza 55,938 - 55,938 0.035018 5427 Lyon County Conservation District 4,341 - 4,341 0.002718 5433 Riley County Extension Council 12,391 - 12,391 0.007757 5438 City of Holcomb 21,311 - 21,311 0.013341 5440 Newton Recreation Comm 51,134 - 51,134 0.032011 5441 Southeast Kansas Mental Health Center 374,436 - 374,436 0.234406 5446 Saline County/City Building Authority 23,357 - 23,357 0.014622 5454 RWD 2 Miami Co 55,723 - 55,723 0.034884
KANSAS PUBLIC EMPLOYEES RETIREMENT SYSTEMCOST-SHARING MULTIPLE-EMPLOYER DEFINED BENEFIT PENSION PLAN
24
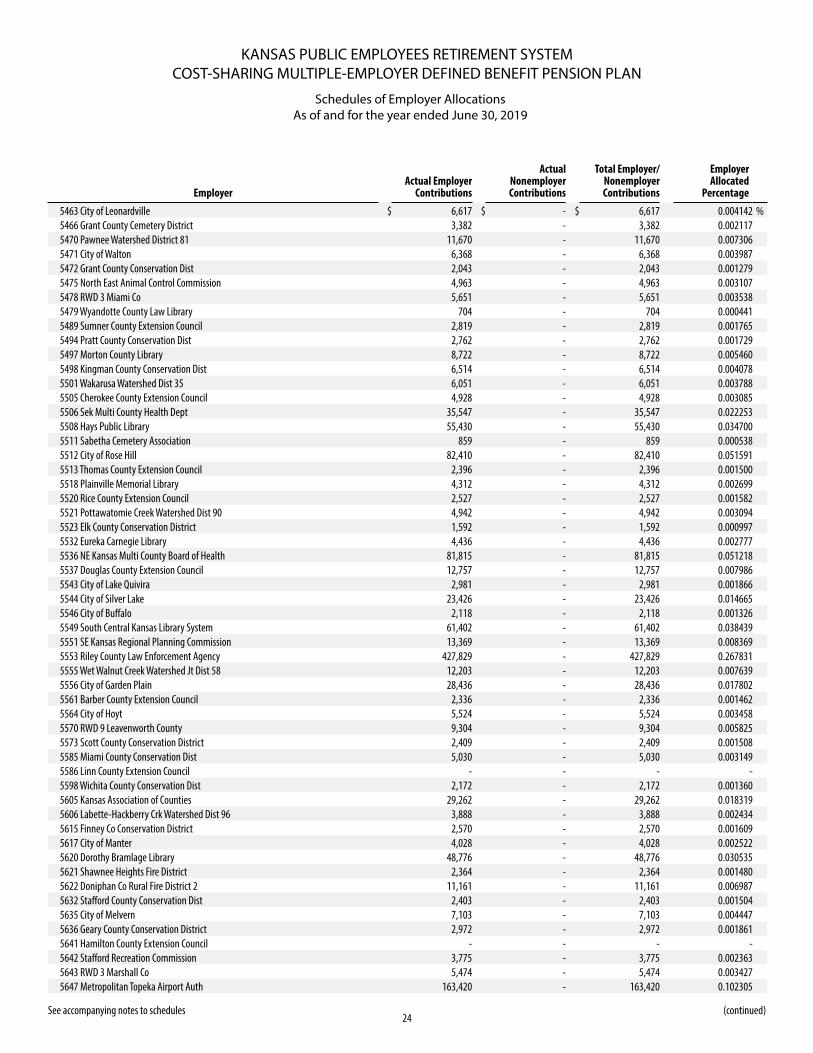
Schedules of Employer AllocationsAs of and for the year ended June 30, 2019
See accompanying notes to schedules (continued)
EmployerActual Employer
Contributions
Actual Nonemployer Contributions
Total Employer/ Nonemployer Contributions
Employer Allocated
Percentage
5463 City of Leonardville $ 6,617 $ - $ 6,617 0.004142 %5466 Grant County Cemetery District 3,382 - 3,382 0.002117 5470 Pawnee Watershed District 81 11,670 - 11,670 0.007306 5471 City of Walton 6,368 - 6,368 0.003987 5472 Grant County Conservation Dist 2,043 - 2,043 0.001279 5475 North East Animal Control Commission 4,963 - 4,963 0.003107 5478 RWD 3 Miami Co 5,651 - 5,651 0.003538 5479 Wyandotte County Law Library 704 - 704 0.000441 5489 Sumner County Extension Council 2,819 - 2,819 0.001765 5494 Pratt County Conservation Dist 2,762 - 2,762 0.001729 5497 Morton County Library 8,722 - 8,722 0.005460 5498 Kingman County Conservation Dist 6,514 - 6,514 0.004078 5501 Wakarusa Watershed Dist 35 6,051 - 6,051 0.003788 5505 Cherokee County Extension Council 4,928 - 4,928 0.003085 5506 Sek Multi County Health Dept 35,547 - 35,547 0.022253 5508 Hays Public Library 55,430 - 55,430 0.034700 5511 Sabetha Cemetery Association 859 - 859 0.000538 5512 City of Rose Hill 82,410 - 82,410 0.051591 5513 Thomas County Extension Council 2,396 - 2,396 0.001500 5518 Plainville Memorial Library 4,312 - 4,312 0.002699 5520 Rice County Extension Council 2,527 - 2,527 0.001582 5521 Pottawatomie Creek Watershed Dist 90 4,942 - 4,942 0.003094 5523 Elk County Conservation District 1,592 - 1,592 0.000997 5532 Eureka Carnegie Library 4,436 - 4,436 0.002777 5536 NE Kansas Multi County Board of Health 81,815 - 81,815 0.051218 5537 Douglas County Extension Council 12,757 - 12,757 0.007986 5543 City of Lake Quivira 2,981 - 2,981 0.001866 5544 City of Silver Lake 23,426 - 23,426 0.014665 5546 City of Buffalo 2,118 - 2,118 0.001326 5549 South Central Kansas Library System 61,402 - 61,402 0.038439 5551 SE Kansas Regional Planning Commission 13,369 - 13,369 0.008369 5553 Riley County Law Enforcement Agency 427,829 - 427,829 0.267831 5555 Wet Walnut Creek Watershed Jt Dist 58 12,203 - 12,203 0.007639 5556 City of Garden Plain 28,436 - 28,436 0.017802 5561 Barber County Extension Council 2,336 - 2,336 0.001462 5564 City of Hoyt 5,524 - 5,524 0.003458 5570 RWD 9 Leavenworth County 9,304 - 9,304 0.005825 5573 Scott County Conservation District 2,409 - 2,409 0.001508 5585 Miami County Conservation Dist 5,030 - 5,030 0.003149 5586 Linn County Extension Council - - - - 5598 Wichita County Conservation Dist 2,172 - 2,172 0.001360 5605 Kansas Association of Counties 29,262 - 29,262 0.018319 5606 Labette-Hackberry Crk Watershed Dist 96 3,888 - 3,888 0.002434 5615 Finney Co Conservation District 2,570 - 2,570 0.001609 5617 City of Manter 4,028 - 4,028 0.002522 5620 Dorothy Bramlage Library 48,776 - 48,776 0.030535 5621 Shawnee Heights Fire District 2,364 - 2,364 0.001480 5622 Doniphan Co Rural Fire District 2 11,161 - 11,161 0.006987 5632 Stafford County Conservation Dist 2,403 - 2,403 0.001504 5635 City of Melvern 7,103 - 7,103 0.004447 5636 Geary County Conservation District 2,972 - 2,972 0.001861 5641 Hamilton County Extension Council - - - - 5642 Stafford Recreation Commission 3,775 - 3,775 0.002363 5643 RWD 3 Marshall Co 5,474 - 5,474 0.003427 5647 Metropolitan Topeka Airport Auth 163,420 - 163,420 0.102305
KANSAS PUBLIC EMPLOYEES RETIREMENT SYSTEMCOST-SHARING MULTIPLE-EMPLOYER DEFINED BENEFIT PENSION PLAN
25
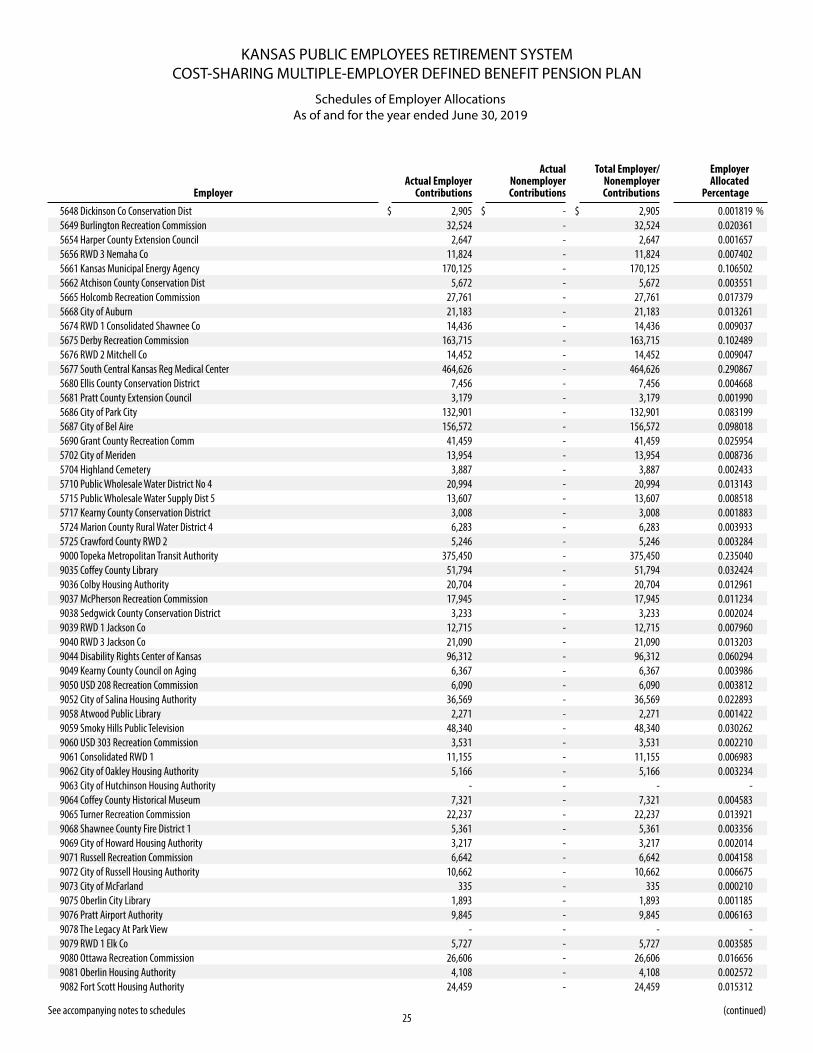
Schedules of Employer AllocationsAs of and for the year ended June 30, 2019
See accompanying notes to schedules (continued)
EmployerActual Employer
Contributions
Actual Nonemployer Contributions
Total Employer/ Nonemployer Contributions
Employer Allocated
Percentage
5648 Dickinson Co Conservation Dist $ 2,905 $ - $ 2,905 0.001819 %5649 Burlington Recreation Commission 32,524 - 32,524 0.020361 5654 Harper County Extension Council 2,647 - 2,647 0.001657 5656 RWD 3 Nemaha Co 11,824 - 11,824 0.007402 5661 Kansas Municipal Energy Agency 170,125 - 170,125 0.106502 5662 Atchison County Conservation Dist 5,672 - 5,672 0.003551 5665 Holcomb Recreation Commission 27,761 - 27,761 0.017379 5668 City of Auburn 21,183 - 21,183 0.013261 5674 RWD 1 Consolidated Shawnee Co 14,436 - 14,436 0.009037 5675 Derby Recreation Commission 163,715 - 163,715 0.102489 5676 RWD 2 Mitchell Co 14,452 - 14,452 0.009047 5677 South Central Kansas Reg Medical Center 464,626 - 464,626 0.290867 5680 Ellis County Conservation District 7,456 - 7,456 0.004668 5681 Pratt County Extension Council 3,179 - 3,179 0.001990 5686 City of Park City 132,901 - 132,901 0.083199 5687 City of Bel Aire 156,572 - 156,572 0.098018 5690 Grant County Recreation Comm 41,459 - 41,459 0.025954 5702 City of Meriden 13,954 - 13,954 0.008736 5704 Highland Cemetery 3,887 - 3,887 0.002433 5710 Public Wholesale Water District No 4 20,994 - 20,994 0.013143 5715 Public Wholesale Water Supply Dist 5 13,607 - 13,607 0.008518 5717 Kearny County Conservation District 3,008 - 3,008 0.001883 5724 Marion County Rural Water District 4 6,283 - 6,283 0.003933 5725 Crawford County RWD 2 5,246 - 5,246 0.003284 9000 Topeka Metropolitan Transit Authority 375,450 - 375,450 0.235040 9035 Coffey County Library 51,794 - 51,794 0.032424 9036 Colby Housing Authority 20,704 - 20,704 0.012961 9037 McPherson Recreation Commission 17,945 - 17,945 0.011234 9038 Sedgwick County Conservation District 3,233 - 3,233 0.002024 9039 RWD 1 Jackson Co 12,715 - 12,715 0.007960 9040 RWD 3 Jackson Co 21,090 - 21,090 0.013203 9044 Disability Rights Center of Kansas 96,312 - 96,312 0.060294 9049 Kearny County Council on Aging 6,367 - 6,367 0.003986 9050 USD 208 Recreation Commission 6,090 - 6,090 0.003812 9052 City of Salina Housing Authority 36,569 - 36,569 0.022893 9058 Atwood Public Library 2,271 - 2,271 0.001422 9059 Smoky Hills Public Television 48,340 - 48,340 0.030262 9060 USD 303 Recreation Commission 3,531 - 3,531 0.002210 9061 Consolidated RWD 1 11,155 - 11,155 0.006983 9062 City of Oakley Housing Authority 5,166 - 5,166 0.003234 9063 City of Hutchinson Housing Authority - - - - 9064 Coffey County Historical Museum 7,321 - 7,321 0.004583 9065 Turner Recreation Commission 22,237 - 22,237 0.013921 9068 Shawnee County Fire District 1 5,361 - 5,361 0.003356 9069 City of Howard Housing Authority 3,217 - 3,217 0.002014 9071 Russell Recreation Commission 6,642 - 6,642 0.004158 9072 City of Russell Housing Authority 10,662 - 10,662 0.006675 9073 City of McFarland 335 - 335 0.000210 9075 Oberlin City Library 1,893 - 1,893 0.001185 9076 Pratt Airport Authority 9,845 - 9,845 0.006163 9078 The Legacy At Park View - - - - 9079 RWD 1 Elk Co 5,727 - 5,727 0.003585 9080 Ottawa Recreation Commission 26,606 - 26,606 0.016656 9081 Oberlin Housing Authority 4,108 - 4,108 0.002572 9082 Fort Scott Housing Authority 24,459 - 24,459 0.015312
KANSAS PUBLIC EMPLOYEES RETIREMENT SYSTEMCOST-SHARING MULTIPLE-EMPLOYER DEFINED BENEFIT PENSION PLAN
26
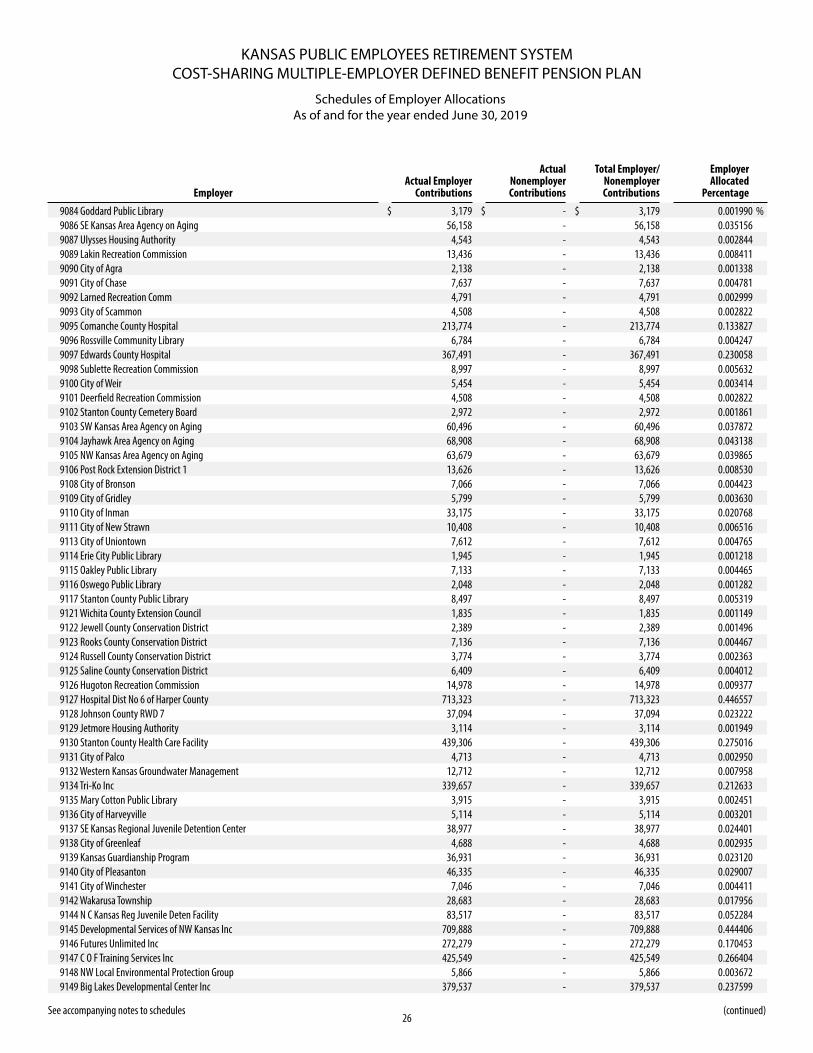
Schedules of Employer AllocationsAs of and for the year ended June 30, 2019
See accompanying notes to schedules (continued)
EmployerActual Employer
Contributions
Actual Nonemployer Contributions
Total Employer/ Nonemployer Contributions
Employer Allocated
Percentage
9084 Goddard Public Library $ 3,179 $ - $ 3,179 0.001990 %9086 SE Kansas Area Agency on Aging 56,158 - 56,158 0.035156 9087 Ulysses Housing Authority 4,543 - 4,543 0.002844 9089 Lakin Recreation Commission 13,436 - 13,436 0.008411 9090 City of Agra 2,138 - 2,138 0.001338 9091 City of Chase 7,637 - 7,637 0.004781 9092 Larned Recreation Comm 4,791 - 4,791 0.002999 9093 City of Scammon 4,508 - 4,508 0.002822 9095 Comanche County Hospital 213,774 - 213,774 0.133827 9096 Rossville Community Library 6,784 - 6,784 0.004247 9097 Edwards County Hospital 367,491 - 367,491 0.230058 9098 Sublette Recreation Commission 8,997 - 8,997 0.005632 9100 City of Weir 5,454 - 5,454 0.003414 9101 Deerfield Recreation Commission 4,508 - 4,508 0.002822 9102 Stanton County Cemetery Board 2,972 - 2,972 0.001861 9103 SW Kansas Area Agency on Aging 60,496 - 60,496 0.037872 9104 Jayhawk Area Agency on Aging 68,908 - 68,908 0.043138 9105 NW Kansas Area Agency on Aging 63,679 - 63,679 0.039865 9106 Post Rock Extension District 1 13,626 - 13,626 0.008530 9108 City of Bronson 7,066 - 7,066 0.004423 9109 City of Gridley 5,799 - 5,799 0.003630 9110 City of Inman 33,175 - 33,175 0.020768 9111 City of New Strawn 10,408 - 10,408 0.006516 9113 City of Uniontown 7,612 - 7,612 0.004765 9114 Erie City Public Library 1,945 - 1,945 0.001218 9115 Oakley Public Library 7,133 - 7,133 0.004465 9116 Oswego Public Library 2,048 - 2,048 0.001282 9117 Stanton County Public Library 8,497 - 8,497 0.005319 9121 Wichita County Extension Council 1,835 - 1,835 0.001149 9122 Jewell County Conservation District 2,389 - 2,389 0.001496 9123 Rooks County Conservation District 7,136 - 7,136 0.004467 9124 Russell County Conservation District 3,774 - 3,774 0.002363 9125 Saline County Conservation District 6,409 - 6,409 0.004012 9126 Hugoton Recreation Commission 14,978 - 14,978 0.009377 9127 Hospital Dist No 6 of Harper County 713,323 - 713,323 0.446557 9128 Johnson County RWD 7 37,094 - 37,094 0.023222 9129 Jetmore Housing Authority 3,114 - 3,114 0.001949 9130 Stanton County Health Care Facility 439,306 - 439,306 0.275016 9131 City of Palco 4,713 - 4,713 0.002950 9132 Western Kansas Groundwater Management 12,712 - 12,712 0.007958 9134 Tri-Ko Inc 339,657 - 339,657 0.212633 9135 Mary Cotton Public Library 3,915 - 3,915 0.002451 9136 City of Harveyville 5,114 - 5,114 0.003201 9137 SE Kansas Regional Juvenile Detention Center 38,977 - 38,977 0.024401 9138 City of Greenleaf 4,688 - 4,688 0.002935 9139 Kansas Guardianship Program 36,931 - 36,931 0.023120 9140 City of Pleasanton 46,335 - 46,335 0.029007 9141 City of Winchester 7,046 - 7,046 0.004411 9142 Wakarusa Township 28,683 - 28,683 0.017956 9144 N C Kansas Reg Juvenile Deten Facility 83,517 - 83,517 0.052284 9145 Developmental Services of NW Kansas Inc 709,888 - 709,888 0.444406 9146 Futures Unlimited Inc 272,279 - 272,279 0.170453 9147 C O F Training Services Inc 425,549 - 425,549 0.266404 9148 NW Local Environmental Protection Group 5,866 - 5,866 0.003672 9149 Big Lakes Developmental Center Inc 379,537 - 379,537 0.237599
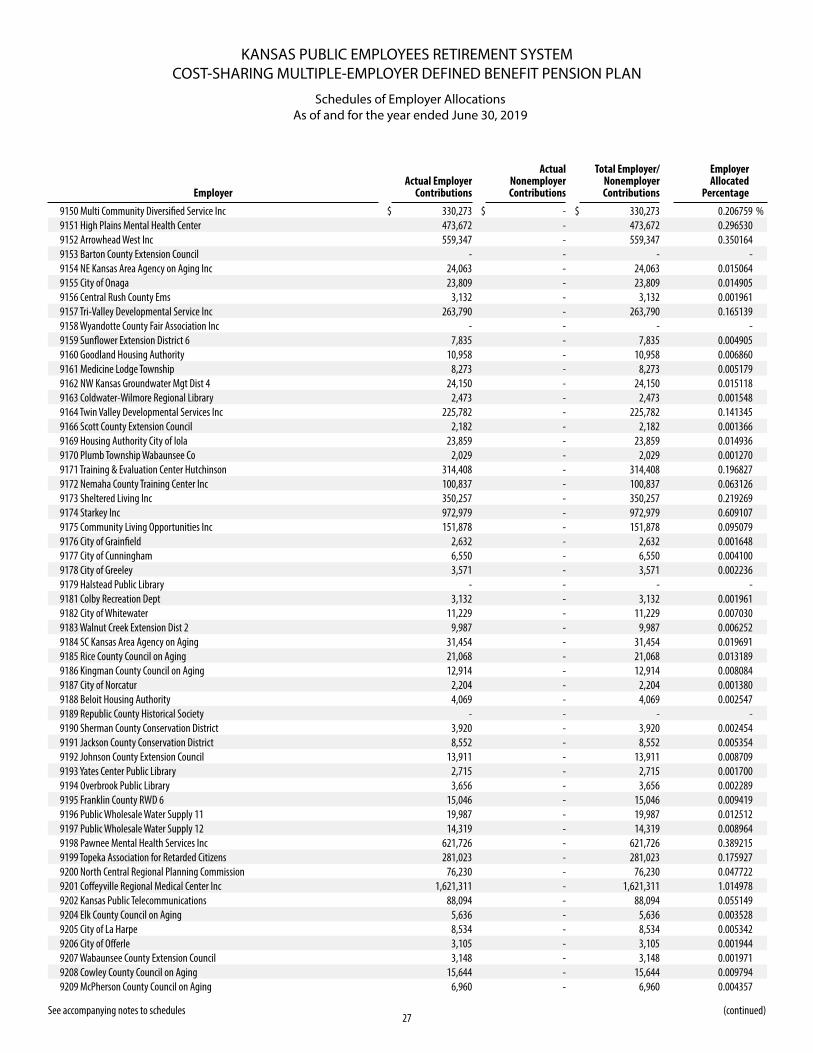
KANSAS PUBLIC EMPLOYEES RETIREMENT SYSTEMCOST-SHARING MULTIPLE-EMPLOYER DEFINED BENEFIT PENSION PLAN
27
Schedules of Employer AllocationsAs of and for the year ended June 30, 2019
See accompanying notes to schedules (continued)
EmployerActual Employer
Contributions
Actual Nonemployer Contributions
Total Employer/ Nonemployer Contributions
Employer Allocated
Percentage
9150 Multi Community Diversified Service Inc $ 330,273 $ - $ 330,273 0.206759 %9151 High Plains Mental Health Center 473,672 - 473,672 0.296530 9152 Arrowhead West Inc 559,347 - 559,347 0.350164 9153 Barton County Extension Council - - - - 9154 NE Kansas Area Agency on Aging Inc 24,063 - 24,063 0.015064 9155 City of Onaga 23,809 - 23,809 0.014905 9156 Central Rush County Ems 3,132 - 3,132 0.001961 9157 Tri-Valley Developmental Service Inc 263,790 - 263,790 0.165139 9158 Wyandotte County Fair Association Inc - - - - 9159 Sunflower Extension District 6 7,835 - 7,835 0.004905 9160 Goodland Housing Authority 10,958 - 10,958 0.006860 9161 Medicine Lodge Township 8,273 - 8,273 0.005179 9162 NW Kansas Groundwater Mgt Dist 4 24,150 - 24,150 0.015118 9163 Coldwater-Wilmore Regional Library 2,473 - 2,473 0.001548 9164 Twin Valley Developmental Services Inc 225,782 - 225,782 0.141345 9166 Scott County Extension Council 2,182 - 2,182 0.001366 9169 Housing Authority City of Iola 23,859 - 23,859 0.014936 9170 Plumb Township Wabaunsee Co 2,029 - 2,029 0.001270 9171 Training & Evaluation Center Hutchinson 314,408 - 314,408 0.196827 9172 Nemaha County Training Center Inc 100,837 - 100,837 0.063126 9173 Sheltered Living Inc 350,257 - 350,257 0.219269 9174 Starkey Inc 972,979 - 972,979 0.609107 9175 Community Living Opportunities Inc 151,878 - 151,878 0.095079 9176 City of Grainfield 2,632 - 2,632 0.001648 9177 City of Cunningham 6,550 - 6,550 0.004100 9178 City of Greeley 3,571 - 3,571 0.002236 9179 Halstead Public Library - - - - 9181 Colby Recreation Dept 3,132 - 3,132 0.001961 9182 City of Whitewater 11,229 - 11,229 0.007030 9183 Walnut Creek Extension Dist 2 9,987 - 9,987 0.006252 9184 SC Kansas Area Agency on Aging 31,454 - 31,454 0.019691 9185 Rice County Council on Aging 21,068 - 21,068 0.013189 9186 Kingman County Council on Aging 12,914 - 12,914 0.008084 9187 City of Norcatur 2,204 - 2,204 0.001380 9188 Beloit Housing Authority 4,069 - 4,069 0.002547 9189 Republic County Historical Society - - - - 9190 Sherman County Conservation District 3,920 - 3,920 0.002454 9191 Jackson County Conservation District 8,552 - 8,552 0.005354 9192 Johnson County Extension Council 13,911 - 13,911 0.008709 9193 Yates Center Public Library 2,715 - 2,715 0.001700 9194 Overbrook Public Library 3,656 - 3,656 0.002289 9195 Franklin County RWD 6 15,046 - 15,046 0.009419 9196 Public Wholesale Water Supply 11 19,987 - 19,987 0.012512 9197 Public Wholesale Water Supply 12 14,319 - 14,319 0.008964 9198 Pawnee Mental Health Services Inc 621,726 - 621,726 0.389215 9199 Topeka Association for Retarded Citizens 281,023 - 281,023 0.175927 9200 North Central Regional Planning Commission 76,230 - 76,230 0.047722 9201 Coffeyville Regional Medical Center Inc 1,621,311 - 1,621,311 1.014978 9202 Kansas Public Telecommunications 88,094 - 88,094 0.055149 9204 Elk County Council on Aging 5,636 - 5,636 0.003528 9205 City of La Harpe 8,534 - 8,534 0.005342 9206 City of Offerle 3,105 - 3,105 0.001944 9207 Wabaunsee County Extension Council 3,148 - 3,148 0.001971 9208 Cowley County Council on Aging 15,644 - 15,644 0.009794 9209 McPherson County Council on Aging 6,960 - 6,960 0.004357
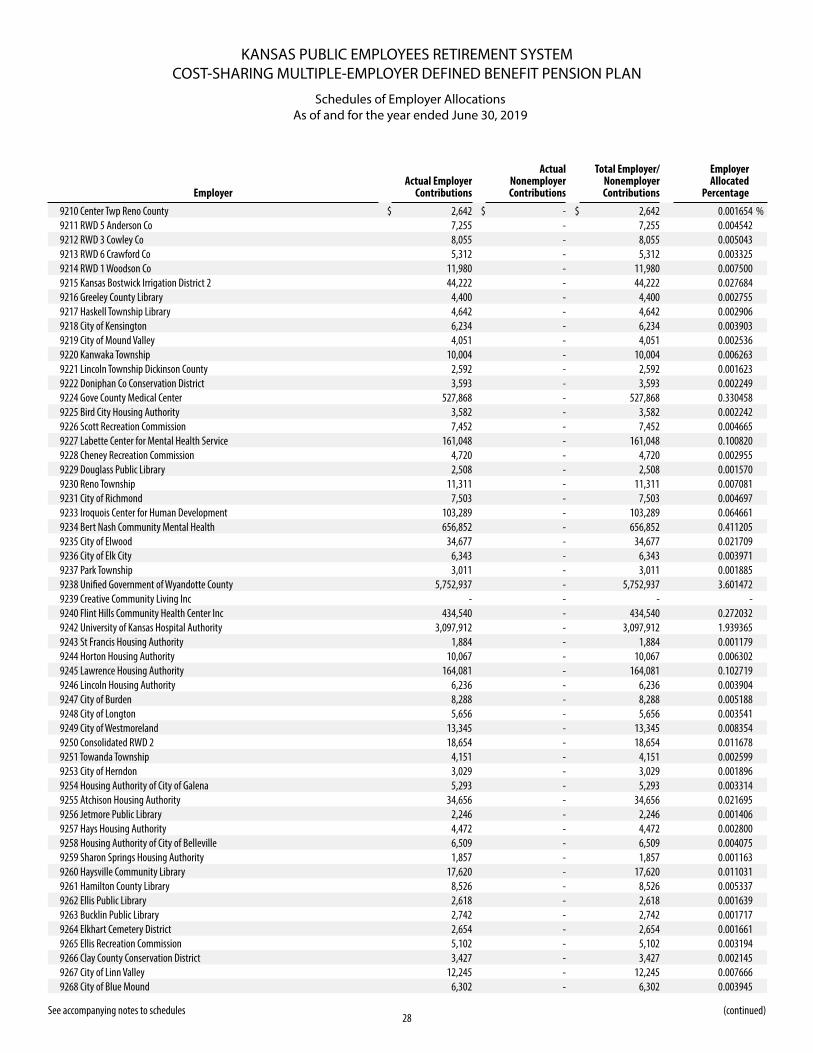
KANSAS PUBLIC EMPLOYEES RETIREMENT SYSTEMCOST-SHARING MULTIPLE-EMPLOYER DEFINED BENEFIT PENSION PLAN
28
Schedules of Employer AllocationsAs of and for the year ended June 30, 2019
See accompanying notes to schedules (continued)
EmployerActual Employer
Contributions
Actual Nonemployer Contributions
Total Employer/ Nonemployer Contributions
Employer Allocated
Percentage
9210 Center Twp Reno County $ 2,642 $ - $ 2,642 0.001654 %9211 RWD 5 Anderson Co 7,255 - 7,255 0.004542 9212 RWD 3 Cowley Co 8,055 - 8,055 0.005043 9213 RWD 6 Crawford Co 5,312 - 5,312 0.003325 9214 RWD 1 Woodson Co 11,980 - 11,980 0.007500 9215 Kansas Bostwick Irrigation District 2 44,222 - 44,222 0.027684 9216 Greeley County Library 4,400 - 4,400 0.002755 9217 Haskell Township Library 4,642 - 4,642 0.002906 9218 City of Kensington 6,234 - 6,234 0.003903 9219 City of Mound Valley 4,051 - 4,051 0.002536 9220 Kanwaka Township 10,004 - 10,004 0.006263 9221 Lincoln Township Dickinson County 2,592 - 2,592 0.001623 9222 Doniphan Co Conservation District 3,593 - 3,593 0.002249 9224 Gove County Medical Center 527,868 - 527,868 0.330458 9225 Bird City Housing Authority 3,582 - 3,582 0.002242 9226 Scott Recreation Commission 7,452 - 7,452 0.004665 9227 Labette Center for Mental Health Service 161,048 - 161,048 0.100820 9228 Cheney Recreation Commission 4,720 - 4,720 0.002955 9229 Douglass Public Library 2,508 - 2,508 0.001570 9230 Reno Township 11,311 - 11,311 0.007081 9231 City of Richmond 7,503 - 7,503 0.004697 9233 Iroquois Center for Human Development 103,289 - 103,289 0.064661 9234 Bert Nash Community Mental Health 656,852 - 656,852 0.411205 9235 City of Elwood 34,677 - 34,677 0.021709 9236 City of Elk City 6,343 - 6,343 0.003971 9237 Park Township 3,011 - 3,011 0.001885 9238 Unified Government of Wyandotte County 5,752,937 - 5,752,937 3.601472 9239 Creative Community Living Inc - - - - 9240 Flint Hills Community Health Center Inc 434,540 - 434,540 0.272032 9242 University of Kansas Hospital Authority 3,097,912 - 3,097,912 1.939365 9243 St Francis Housing Authority 1,884 - 1,884 0.001179 9244 Horton Housing Authority 10,067 - 10,067 0.006302 9245 Lawrence Housing Authority 164,081 - 164,081 0.102719 9246 Lincoln Housing Authority 6,236 - 6,236 0.003904 9247 City of Burden 8,288 - 8,288 0.005188 9248 City of Longton 5,656 - 5,656 0.003541 9249 City of Westmoreland 13,345 - 13,345 0.008354 9250 Consolidated RWD 2 18,654 - 18,654 0.011678 9251 Towanda Township 4,151 - 4,151 0.002599 9253 City of Herndon 3,029 - 3,029 0.001896 9254 Housing Authority of City of Galena 5,293 - 5,293 0.003314 9255 Atchison Housing Authority 34,656 - 34,656 0.021695 9256 Jetmore Public Library 2,246 - 2,246 0.001406 9257 Hays Housing Authority 4,472 - 4,472 0.002800 9258 Housing Authority of City of Belleville 6,509 - 6,509 0.004075 9259 Sharon Springs Housing Authority 1,857 - 1,857 0.001163 9260 Haysville Community Library 17,620 - 17,620 0.011031 9261 Hamilton County Library 8,526 - 8,526 0.005337 9262 Ellis Public Library 2,618 - 2,618 0.001639 9263 Bucklin Public Library 2,742 - 2,742 0.001717 9264 Elkhart Cemetery District 2,654 - 2,654 0.001661 9265 Ellis Recreation Commission 5,102 - 5,102 0.003194 9266 Clay County Conservation District 3,427 - 3,427 0.002145 9267 City of Linn Valley 12,245 - 12,245 0.007666 9268 City of Blue Mound 6,302 - 6,302 0.003945
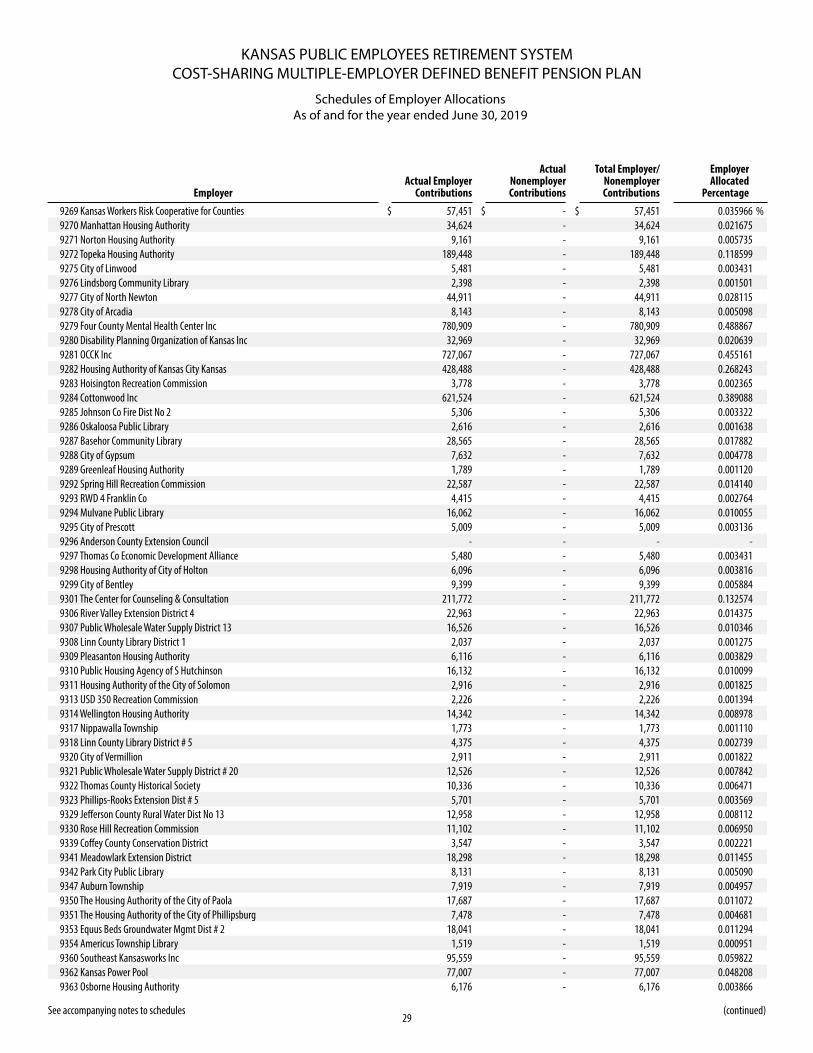
KANSAS PUBLIC EMPLOYEES RETIREMENT SYSTEMCOST-SHARING MULTIPLE-EMPLOYER DEFINED BENEFIT PENSION PLAN
29
Schedules of Employer AllocationsAs of and for the year ended June 30, 2019
See accompanying notes to schedules (continued)
EmployerActual Employer
Contributions
Actual Nonemployer Contributions
Total Employer/ Nonemployer Contributions
Employer Allocated
Percentage
9269 Kansas Workers Risk Cooperative for Counties $ 57,451 $ - $ 57,451 0.035966 %9270 Manhattan Housing Authority 34,624 - 34,624 0.021675 9271 Norton Housing Authority 9,161 - 9,161 0.005735 9272 Topeka Housing Authority 189,448 - 189,448 0.118599 9275 City of Linwood 5,481 - 5,481 0.003431 9276 Lindsborg Community Library 2,398 - 2,398 0.001501 9277 City of North Newton 44,911 - 44,911 0.028115 9278 City of Arcadia 8,143 - 8,143 0.005098 9279 Four County Mental Health Center Inc 780,909 - 780,909 0.488867 9280 Disability Planning Organization of Kansas Inc 32,969 - 32,969 0.020639 9281 OCCK Inc 727,067 - 727,067 0.455161 9282 Housing Authority of Kansas City Kansas 428,488 - 428,488 0.268243 9283 Hoisington Recreation Commission 3,778 - 3,778 0.002365 9284 Cottonwood Inc 621,524 - 621,524 0.389088 9285 Johnson Co Fire Dist No 2 5,306 - 5,306 0.003322 9286 Oskaloosa Public Library 2,616 - 2,616 0.001638 9287 Basehor Community Library 28,565 - 28,565 0.017882 9288 City of Gypsum 7,632 - 7,632 0.004778 9289 Greenleaf Housing Authority 1,789 - 1,789 0.001120 9292 Spring Hill Recreation Commission 22,587 - 22,587 0.014140 9293 RWD 4 Franklin Co 4,415 - 4,415 0.002764 9294 Mulvane Public Library 16,062 - 16,062 0.010055 9295 City of Prescott 5,009 - 5,009 0.003136 9296 Anderson County Extension Council - - - - 9297 Thomas Co Economic Development Alliance 5,480 - 5,480 0.003431 9298 Housing Authority of City of Holton 6,096 - 6,096 0.003816 9299 City of Bentley 9,399 - 9,399 0.005884 9301 The Center for Counseling & Consultation 211,772 - 211,772 0.132574 9306 River Valley Extension District 4 22,963 - 22,963 0.014375 9307 Public Wholesale Water Supply District 13 16,526 - 16,526 0.010346 9308 Linn County Library District 1 2,037 - 2,037 0.001275 9309 Pleasanton Housing Authority 6,116 - 6,116 0.003829 9310 Public Housing Agency of S Hutchinson 16,132 - 16,132 0.010099 9311 Housing Authority of the City of Solomon 2,916 - 2,916 0.001825 9313 USD 350 Recreation Commission 2,226 - 2,226 0.001394 9314 Wellington Housing Authority 14,342 - 14,342 0.008978 9317 Nippawalla Township 1,773 - 1,773 0.001110 9318 Linn County Library District # 5 4,375 - 4,375 0.002739 9320 City of Vermillion 2,911 - 2,911 0.001822 9321 Public Wholesale Water Supply District # 20 12,526 - 12,526 0.007842 9322 Thomas County Historical Society 10,336 - 10,336 0.006471 9323 Phillips-Rooks Extension Dist # 5 5,701 - 5,701 0.003569 9329 Jefferson County Rural Water Dist No 13 12,958 - 12,958 0.008112 9330 Rose Hill Recreation Commission 11,102 - 11,102 0.006950 9339 Coffey County Conservation District 3,547 - 3,547 0.002221 9341 Meadowlark Extension District 18,298 - 18,298 0.011455 9342 Park City Public Library 8,131 - 8,131 0.005090 9347 Auburn Township 7,919 - 7,919 0.004957 9350 The Housing Authority of the City of Paola 17,687 - 17,687 0.011072 9351 The Housing Authority of the City of Phillipsburg 7,478 - 7,478 0.004681 9353 Equus Beds Groundwater Mgmt Dist # 2 18,041 - 18,041 0.011294 9354 Americus Township Library 1,519 - 1,519 0.000951 9360 Southeast Kansasworks Inc 95,559 - 95,559 0.059822 9362 Kansas Power Pool 77,007 - 77,007 0.048208 9363 Osborne Housing Authority 6,176 - 6,176 0.003866
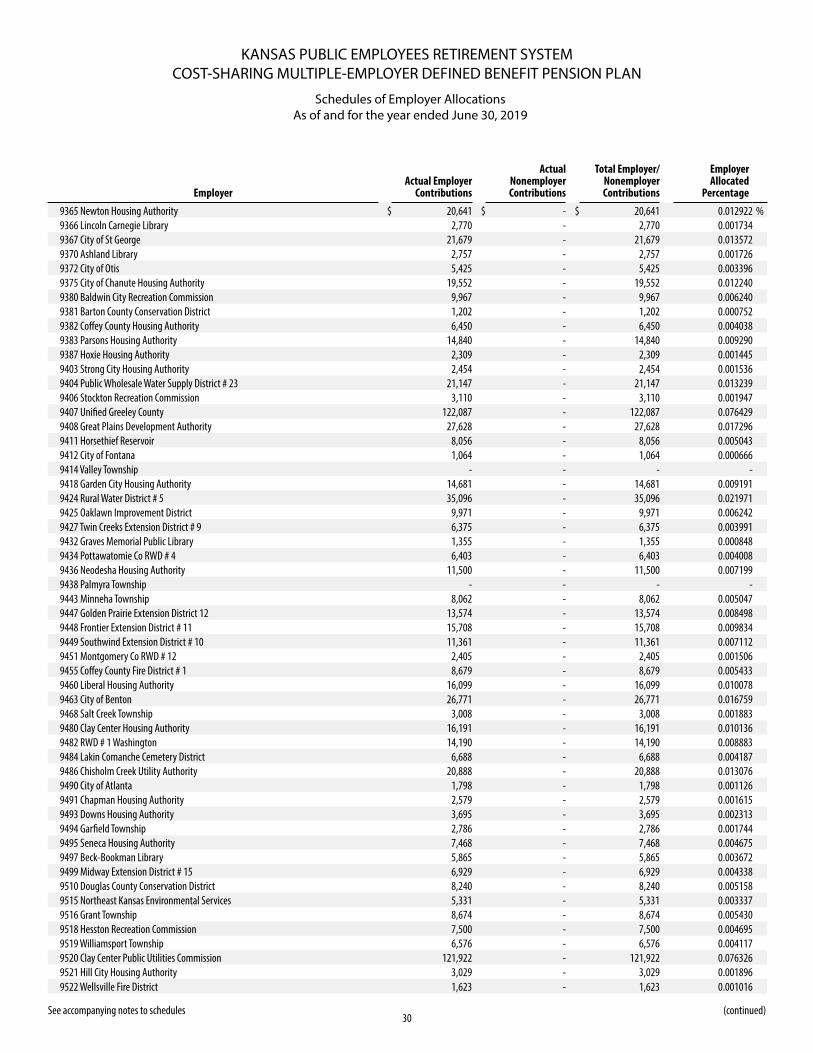
KANSAS PUBLIC EMPLOYEES RETIREMENT SYSTEMCOST-SHARING MULTIPLE-EMPLOYER DEFINED BENEFIT PENSION PLAN
30
Schedules of Employer AllocationsAs of and for the year ended June 30, 2019
See accompanying notes to schedules (continued)
EmployerActual Employer
Contributions
Actual Nonemployer Contributions
Total Employer/ Nonemployer Contributions
Employer Allocated
Percentage
9365 Newton Housing Authority $ 20,641 $ - $ 20,641 0.012922 %9366 Lincoln Carnegie Library 2,770 - 2,770 0.001734 9367 City of St George 21,679 - 21,679 0.013572 9370 Ashland Library 2,757 - 2,757 0.001726 9372 City of Otis 5,425 - 5,425 0.003396 9375 City of Chanute Housing Authority 19,552 - 19,552 0.012240 9380 Baldwin City Recreation Commission 9,967 - 9,967 0.006240 9381 Barton County Conservation District 1,202 - 1,202 0.000752 9382 Coffey County Housing Authority 6,450 - 6,450 0.004038 9383 Parsons Housing Authority 14,840 - 14,840 0.009290 9387 Hoxie Housing Authority 2,309 - 2,309 0.001445 9403 Strong City Housing Authority 2,454 - 2,454 0.001536 9404 Public Wholesale Water Supply District # 23 21,147 - 21,147 0.013239 9406 Stockton Recreation Commission 3,110 - 3,110 0.001947 9407 Unified Greeley County 122,087 - 122,087 0.076429 9408 Great Plains Development Authority 27,628 - 27,628 0.017296 9411 Horsethief Reservoir 8,056 - 8,056 0.005043 9412 City of Fontana 1,064 - 1,064 0.000666 9414 Valley Township - - - - 9418 Garden City Housing Authority 14,681 - 14,681 0.009191 9424 Rural Water District # 5 35,096 - 35,096 0.021971 9425 Oaklawn Improvement District 9,971 - 9,971 0.006242 9427 Twin Creeks Extension District # 9 6,375 - 6,375 0.003991 9432 Graves Memorial Public Library 1,355 - 1,355 0.000848 9434 Pottawatomie Co RWD # 4 6,403 - 6,403 0.004008 9436 Neodesha Housing Authority 11,500 - 11,500 0.007199 9438 Palmyra Township - - - - 9443 Minneha Township 8,062 - 8,062 0.005047 9447 Golden Prairie Extension District 12 13,574 - 13,574 0.008498 9448 Frontier Extension District # 11 15,708 - 15,708 0.009834 9449 Southwind Extension District # 10 11,361 - 11,361 0.007112 9451 Montgomery Co RWD # 12 2,405 - 2,405 0.001506 9455 Coffey County Fire District # 1 8,679 - 8,679 0.005433 9460 Liberal Housing Authority 16,099 - 16,099 0.010078 9463 City of Benton 26,771 - 26,771 0.016759 9468 Salt Creek Township 3,008 - 3,008 0.001883 9480 Clay Center Housing Authority 16,191 - 16,191 0.010136 9482 RWD # 1 Washington 14,190 - 14,190 0.008883 9484 Lakin Comanche Cemetery District 6,688 - 6,688 0.004187 9486 Chisholm Creek Utility Authority 20,888 - 20,888 0.013076 9490 City of Atlanta 1,798 - 1,798 0.001126 9491 Chapman Housing Authority 2,579 - 2,579 0.001615 9493 Downs Housing Authority 3,695 - 3,695 0.002313 9494 Garfield Township 2,786 - 2,786 0.001744 9495 Seneca Housing Authority 7,468 - 7,468 0.004675 9497 Beck-Bookman Library 5,865 - 5,865 0.003672 9499 Midway Extension District # 15 6,929 - 6,929 0.004338 9510 Douglas County Conservation District 8,240 - 8,240 0.005158 9515 Northeast Kansas Environmental Services 5,331 - 5,331 0.003337 9516 Grant Township 8,674 - 8,674 0.005430 9518 Hesston Recreation Commission 7,500 - 7,500 0.004695 9519 Williamsport Township 6,576 - 6,576 0.004117 9520 Clay Center Public Utilities Commission 121,922 - 121,922 0.076326 9521 Hill City Housing Authority 3,029 - 3,029 0.001896 9522 Wellsville Fire District 1,623 - 1,623 0.001016
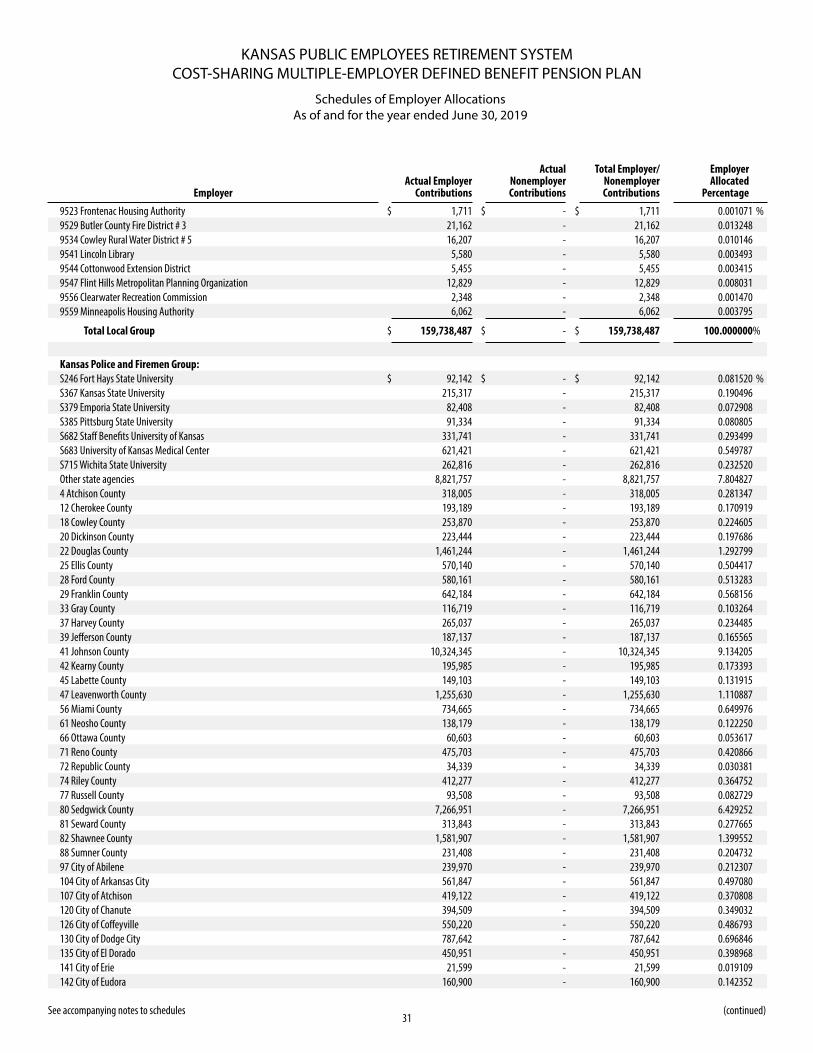
KANSAS PUBLIC EMPLOYEES RETIREMENT SYSTEMCOST-SHARING MULTIPLE-EMPLOYER DEFINED BENEFIT PENSION PLAN
31
Schedules of Employer AllocationsAs of and for the year ended June 30, 2019
See accompanying notes to schedules (continued)
EmployerActual Employer
Contributions
Actual Nonemployer Contributions
Total Employer/ Nonemployer Contributions
Employer Allocated
Percentage
9523 Frontenac Housing Authority $ 1,711 $ - $ 1,711 0.001071 %9529 Butler County Fire District # 3 21,162 - 21,162 0.013248 9534 Cowley Rural Water District # 5 16,207 - 16,207 0.010146 9541 Lincoln Library 5,580 - 5,580 0.003493 9544 Cottonwood Extension District 5,455 - 5,455 0.003415 9547 Flint Hills Metropolitan Planning Organization 12,829 - 12,829 0.008031 9556 Clearwater Recreation Commission 2,348 - 2,348 0.001470 9559 Minneapolis Housing Authority 6,062 - 6,062 0.003795
Total Local Group $ 159,738,487 $ - $ 159,738,487 100.000000 %
Kansas Police and Firemen Group:S246 Fort Hays State University $ 92,142 $ - $ 92,142 0.081520 %S367 Kansas State University 215,317 - 215,317 0.190496 S379 Emporia State University 82,408 - 82,408 0.072908 S385 Pittsburg State University 91,334 - 91,334 0.080805 S682 Staff Benefits University of Kansas 331,741 - 331,741 0.293499 S683 University of Kansas Medical Center 621,421 - 621,421 0.549787 S715 Wichita State University 262,816 - 262,816 0.232520 Other state agencies 8,821,757 - 8,821,757 7.804827 4 Atchison County 318,005 - 318,005 0.281347 12 Cherokee County 193,189 - 193,189 0.170919 18 Cowley County 253,870 - 253,870 0.224605 20 Dickinson County 223,444 - 223,444 0.197686 22 Douglas County 1,461,244 - 1,461,244 1.292799 25 Ellis County 570,140 - 570,140 0.504417 28 Ford County 580,161 - 580,161 0.513283 29 Franklin County 642,184 - 642,184 0.568156 33 Gray County 116,719 - 116,719 0.103264 37 Harvey County 265,037 - 265,037 0.234485 39 Jefferson County 187,137 - 187,137 0.165565 41 Johnson County 10,324,345 - 10,324,345 9.134205 42 Kearny County 195,985 - 195,985 0.173393 45 Labette County 149,103 - 149,103 0.131915 47 Leavenworth County 1,255,630 - 1,255,630 1.110887 56 Miami County 734,665 - 734,665 0.649976 61 Neosho County 138,179 - 138,179 0.122250 66 Ottawa County 60,603 - 60,603 0.053617 71 Reno County 475,703 - 475,703 0.420866 72 Republic County 34,339 - 34,339 0.030381 74 Riley County 412,277 - 412,277 0.364752 77 Russell County 93,508 - 93,508 0.082729 80 Sedgwick County 7,266,951 - 7,266,951 6.429252 81 Seward County 313,843 - 313,843 0.277665 82 Shawnee County 1,581,907 - 1,581,907 1.399552 88 Sumner County 231,408 - 231,408 0.204732 97 City of Abilene 239,970 - 239,970 0.212307 104 City of Arkansas City 561,847 - 561,847 0.497080 107 City of Atchison 419,122 - 419,122 0.370808 120 City of Chanute 394,509 - 394,509 0.349032 126 City of Coffeyville 550,220 - 550,220 0.486793 130 City of Dodge City 787,642 - 787,642 0.696846 135 City of El Dorado 450,951 - 450,951 0.398968 141 City of Erie 21,599 - 21,599 0.019109 142 City of Eudora 160,900 - 160,900 0.142352
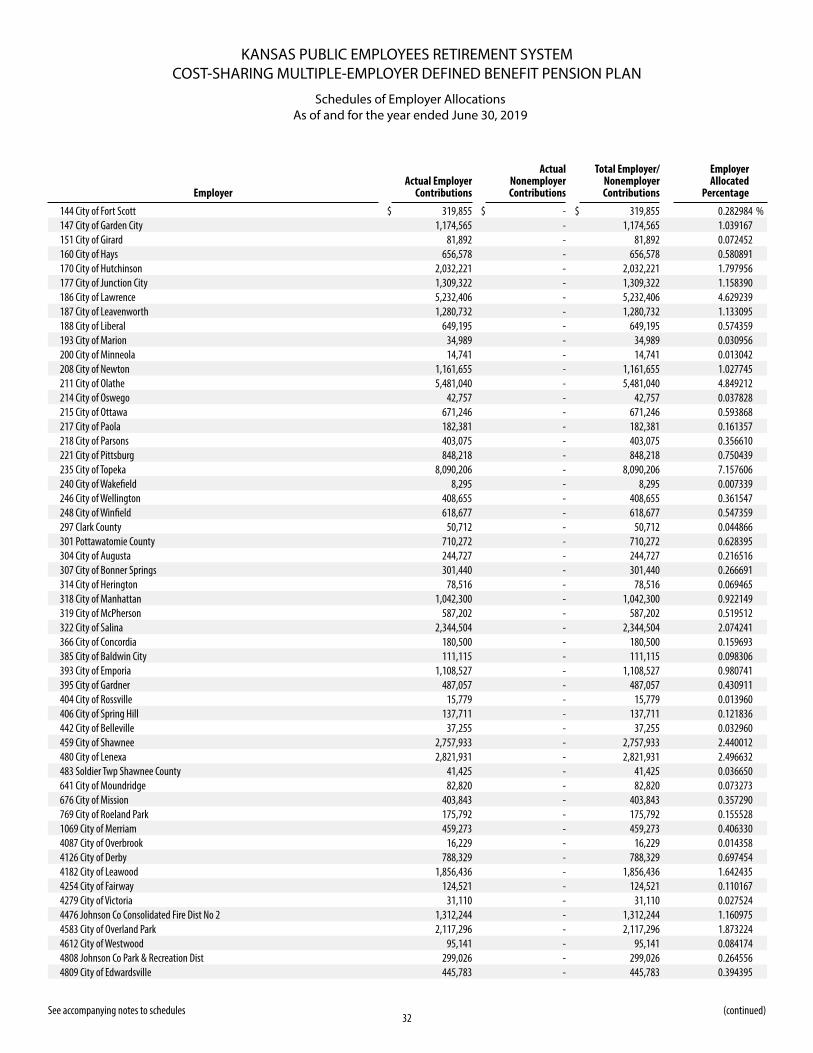
KANSAS PUBLIC EMPLOYEES RETIREMENT SYSTEMCOST-SHARING MULTIPLE-EMPLOYER DEFINED BENEFIT PENSION PLAN
32
Schedules of Employer AllocationsAs of and for the year ended June 30, 2019
See accompanying notes to schedules (continued)
EmployerActual Employer
Contributions
Actual Nonemployer Contributions
Total Employer/ Nonemployer Contributions
Employer Allocated
Percentage
144 City of Fort Scott $ 319,855 $ - $ 319,855 0.282984 %147 City of Garden City 1,174,565 - 1,174,565 1.039167 151 City of Girard 81,892 - 81,892 0.072452 160 City of Hays 656,578 - 656,578 0.580891 170 City of Hutchinson 2,032,221 - 2,032,221 1.797956 177 City of Junction City 1,309,322 - 1,309,322 1.158390 186 City of Lawrence 5,232,406 - 5,232,406 4.629239 187 City of Leavenworth 1,280,732 - 1,280,732 1.133095 188 City of Liberal 649,195 - 649,195 0.574359 193 City of Marion 34,989 - 34,989 0.030956 200 City of Minneola 14,741 - 14,741 0.013042 208 City of Newton 1,161,655 - 1,161,655 1.027745 211 City of Olathe 5,481,040 - 5,481,040 4.849212 214 City of Oswego 42,757 - 42,757 0.037828 215 City of Ottawa 671,246 - 671,246 0.593868 217 City of Paola 182,381 - 182,381 0.161357 218 City of Parsons 403,075 - 403,075 0.356610 221 City of Pittsburg 848,218 - 848,218 0.750439 235 City of Topeka 8,090,206 - 8,090,206 7.157606 240 City of Wakefield 8,295 - 8,295 0.007339 246 City of Wellington 408,655 - 408,655 0.361547 248 City of Winfield 618,677 - 618,677 0.547359 297 Clark County 50,712 - 50,712 0.044866 301 Pottawatomie County 710,272 - 710,272 0.628395 304 City of Augusta 244,727 - 244,727 0.216516 307 City of Bonner Springs 301,440 - 301,440 0.266691 314 City of Herington 78,516 - 78,516 0.069465 318 City of Manhattan 1,042,300 - 1,042,300 0.922149 319 City of McPherson 587,202 - 587,202 0.519512 322 City of Salina 2,344,504 - 2,344,504 2.074241 366 City of Concordia 180,500 - 180,500 0.159693 385 City of Baldwin City 111,115 - 111,115 0.098306 393 City of Emporia 1,108,527 - 1,108,527 0.980741 395 City of Gardner 487,057 - 487,057 0.430911 404 City of Rossville 15,779 - 15,779 0.013960 406 City of Spring Hill 137,711 - 137,711 0.121836 442 City of Belleville 37,255 - 37,255 0.032960 459 City of Shawnee 2,757,933 - 2,757,933 2.440012 480 City of Lenexa 2,821,931 - 2,821,931 2.496632 483 Soldier Twp Shawnee County 41,425 - 41,425 0.036650 641 City of Moundridge 82,820 - 82,820 0.073273 676 City of Mission 403,843 - 403,843 0.357290 769 City of Roeland Park 175,792 - 175,792 0.155528 1069 City of Merriam 459,273 - 459,273 0.406330 4087 City of Overbrook 16,229 - 16,229 0.014358 4126 City of Derby 788,329 - 788,329 0.697454 4182 City of Leawood 1,856,436 - 1,856,436 1.642435 4254 City of Fairway 124,521 - 124,521 0.110167 4279 City of Victoria 31,110 - 31,110 0.027524 4476 Johnson Co Consolidated Fire Dist No 2 1,312,244 - 1,312,244 1.160975 4583 City of Overland Park 2,117,296 - 2,117,296 1.873224 4612 City of Westwood 95,141 - 95,141 0.084174 4808 Johnson Co Park & Recreation Dist 299,026 - 299,026 0.264556 4809 City of Edwardsville 445,783 - 445,783 0.394395
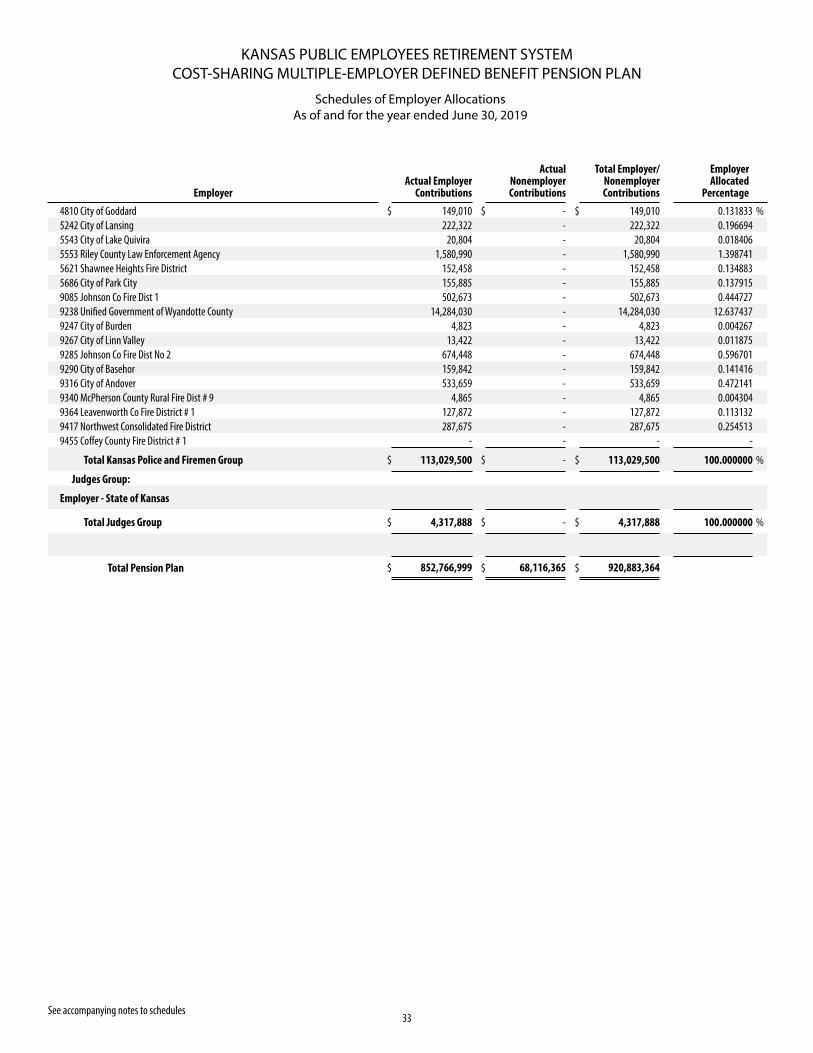
KANSAS PUBLIC EMPLOYEES RETIREMENT SYSTEMCOST-SHARING MULTIPLE-EMPLOYER DEFINED BENEFIT PENSION PLAN
33
Schedules of Employer AllocationsAs of and for the year ended June 30, 2019
See accompanying notes to schedules
EmployerActual Employer
Contributions
Actual Nonemployer Contributions
Total Employer/ Nonemployer Contributions
Employer Allocated
Percentage
4810 City of Goddard $ 149,010 $ - $ 149,010 0.131833 %5242 City of Lansing 222,322 - 222,322 0.196694 5543 City of Lake Quivira 20,804 - 20,804 0.018406 5553 Riley County Law Enforcement Agency 1,580,990 - 1,580,990 1.398741 5621 Shawnee Heights Fire District 152,458 - 152,458 0.134883 5686 City of Park City 155,885 - 155,885 0.137915 9085 Johnson Co Fire Dist 1 502,673 - 502,673 0.444727 9238 Unified Government of Wyandotte County 14,284,030 - 14,284,030 12.637437 9247 City of Burden 4,823 - 4,823 0.004267 9267 City of Linn Valley 13,422 - 13,422 0.011875 9285 Johnson Co Fire Dist No 2 674,448 - 674,448 0.596701 9290 City of Basehor 159,842 - 159,842 0.141416 9316 City of Andover 533,659 - 533,659 0.472141 9340 McPherson County Rural Fire Dist # 9 4,865 - 4,865 0.004304 9364 Leavenworth Co Fire District # 1 127,872 - 127,872 0.113132 9417 Northwest Consolidated Fire District 287,675 - 287,675 0.254513 9455 Coffey County Fire District # 1 - - - -
Total Kansas Police and Firemen Group $ 113,029,500 $ - $ 113,029,500 100.000000 %
Judges Group:
Employer - State of Kansas
Total Judges Group $ 4,317,888 $ - $ 4,317,888 100.000000 %
Total Pension Plan $ 852,766,999 $ 68,116,365 $ 920,883,364
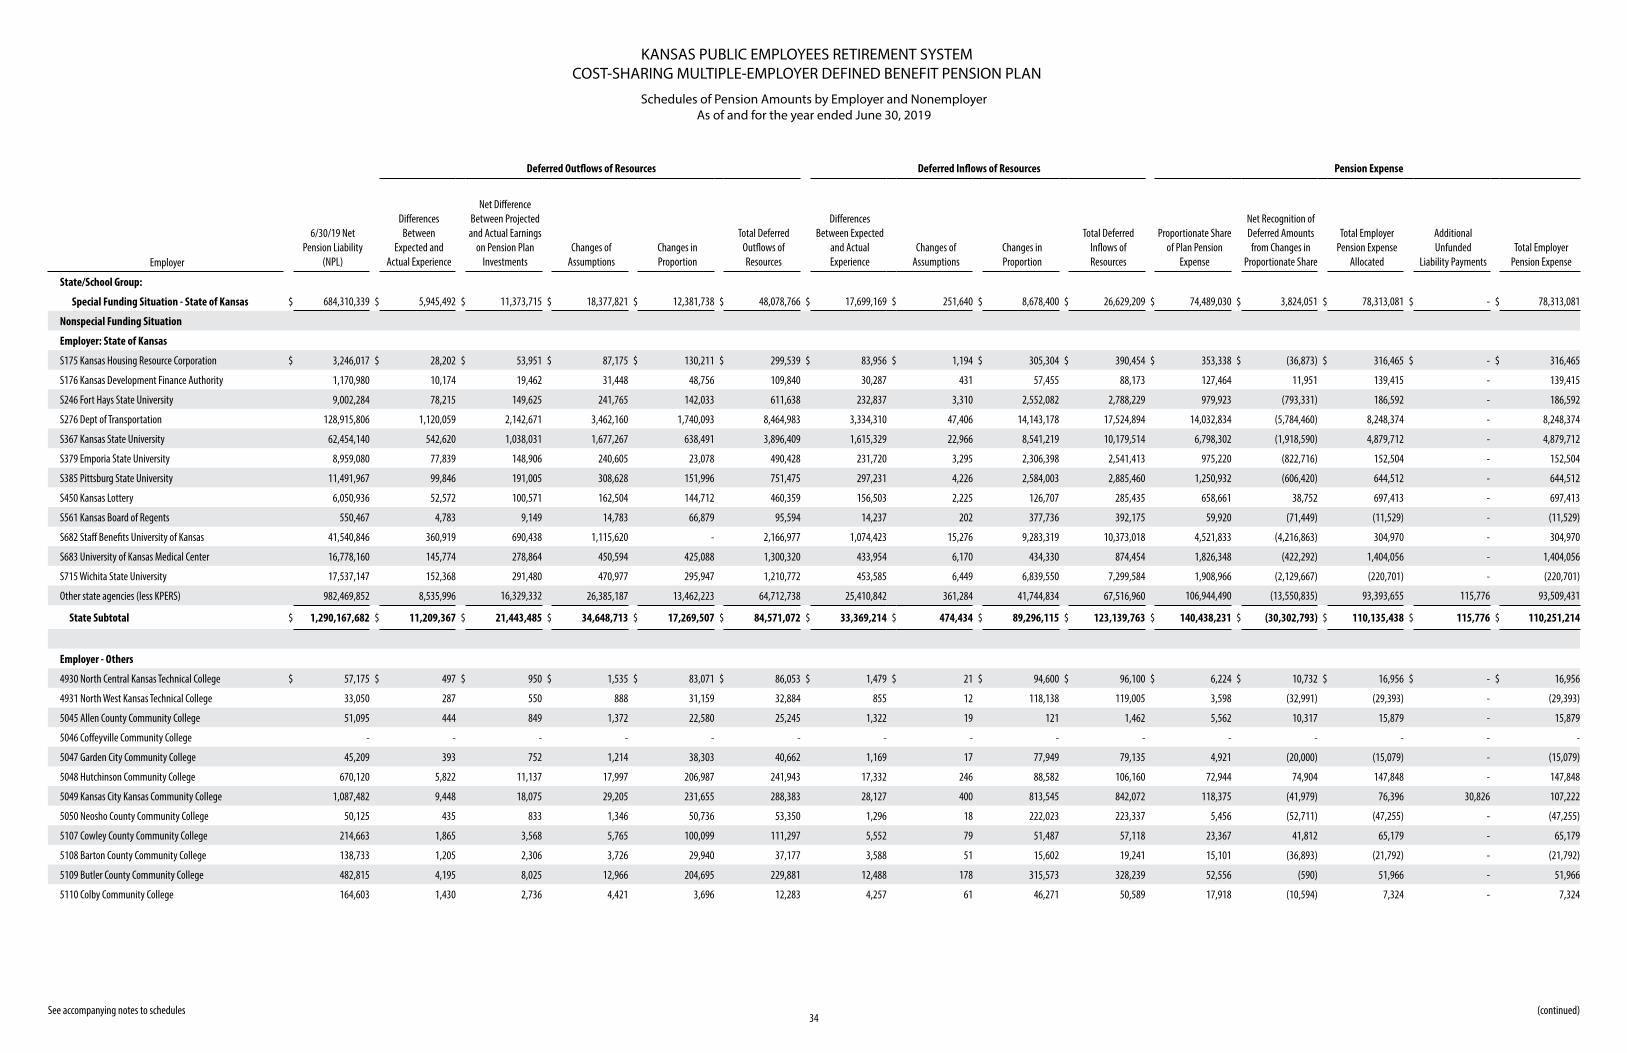
KANSAS PUBLIC EMPLOYEES RETIREMENT SYSTEMCOST-SHARING MULTIPLE-EMPLOYER DEFINED BENEFIT PENSION PLAN
Schedules of Pension Amounts by Employer and NonemployerAs of and for the year ended June 30, 2019
34 See accompanying notes to schedules
Deferred Outflows of Resources Deferred Inflows of Resources Pension Expense
Employer
6/30/19 Net Pension Liability
(NPL)
Differences Between
Expected and Actual Experience
Net Difference Between Projected and Actual Earnings
on Pension Plan Investments
Changes of Assumptions
Changes in Proportion
Total Deferred Outflows of Resources
Differences Between Expected
and Actual Experience
Changes of Assumptions
Changes in Proportion
Total Deferred Inflows of Resources
Proportionate Share of Plan Pension
Expense
Net Recognition of Deferred Amounts from Changes in
Proportionate Share
Total Employer Pension Expense
Allocated
Additional Unfunded
Liability PaymentsTotal Employer
Pension Expense
State/School Group:
Special Funding Situation - State of Kansas $ 684,310,339 $ 5,945,492 $ 11,373,715 $ 18,377,821 $ 12,381,738 $ 48,078,766 $ 17,699,169 $ 251,640 $ 8,678,400 $ 26,629,209 $ 74,489,030 $ 3,824,051 $ 78,313,081 $ - $ 78,313,081
Nonspecial Funding Situation
Employer: State of Kansas
S175 Kansas Housing Resource Corporation $ 3,246,017 $ 28,202 $ 53,951 $ 87,175 $ 130,211 $ 299,539 $ 83,956 $ 1,194 $ 305,304 $ 390,454 $ 353,338 $ (36,873) $ 316,465 $ - $ 316,465
S176 Kansas Development Finance Authority 1,170,980 10,174 19,462 31,448 48,756 109,840 30,287 431 57,455 88,173 127,464 11,951 139,415 - 139,415
S246 Fort Hays State University 9,002,284 78,215 149,625 241,765 142,033 611,638 232,837 3,310 2,552,082 2,788,229 979,923 (793,331) 186,592 - 186,592
S276 Dept of Transportation 128,915,806 1,120,059 2,142,671 3,462,160 1,740,093 8,464,983 3,334,310 47,406 14,143,178 17,524,894 14,032,834 (5,784,460) 8,248,374 - 8,248,374
S367 Kansas State University 62,454,140 542,620 1,038,031 1,677,267 638,491 3,896,409 1,615,329 22,966 8,541,219 10,179,514 6,798,302 (1,918,590) 4,879,712 - 4,879,712
S379 Emporia State University 8,959,080 77,839 148,906 240,605 23,078 490,428 231,720 3,295 2,306,398 2,541,413 975,220 (822,716) 152,504 - 152,504
S385 Pittsburg State University 11,491,967 99,846 191,005 308,628 151,996 751,475 297,231 4,226 2,584,003 2,885,460 1,250,932 (606,420) 644,512 - 644,512
S450 Kansas Lottery 6,050,936 52,572 100,571 162,504 144,712 460,359 156,503 2,225 126,707 285,435 658,661 38,752 697,413 - 697,413
S561 Kansas Board of Regents 550,467 4,783 9,149 14,783 66,879 95,594 14,237 202 377,736 392,175 59,920 (71,449) (11,529) - (11,529)
S682 Staff Benefits University of Kansas 41,540,846 360,919 690,438 1,115,620 - 2,166,977 1,074,423 15,276 9,283,319 10,373,018 4,521,833 (4,216,863) 304,970 - 304,970
S683 University of Kansas Medical Center 16,778,160 145,774 278,864 450,594 425,088 1,300,320 433,954 6,170 434,330 874,454 1,826,348 (422,292) 1,404,056 - 1,404,056
S715 Wichita State University 17,537,147 152,368 291,480 470,977 295,947 1,210,772 453,585 6,449 6,839,550 7,299,584 1,908,966 (2,129,667) (220,701) - (220,701)
Other state agencies (less KPERS) 982,469,852 8,535,996 16,329,332 26,385,187 13,462,223 64,712,738 25,410,842 361,284 41,744,834 67,516,960 106,944,490 (13,550,835) 93,393,655 115,776 93,509,431
State Subtotal $ 1,290,167,682 $ 11,209,367 $ 21,443,485 $ 34,648,713 $ 17,269,507 $ 84,571,072 $ 33,369,214 $ 474,434 $ 89,296,115 $ 123,139,763 $ 140,438,231 $ (30,302,793) $ 110,135,438 $ 115,776 $ 110,251,214
Employer - Others
4930 North Central Kansas Technical College $ 57,175 $ 497 $ 950 $ 1,535 $ 83,071 $ 86,053 $ 1,479 $ 21 $ 94,600 $ 96,100 $ 6,224 $ 10,732 $ 16,956 $ - $ 16,956
4931 North West Kansas Technical College 33,050 287 550 888 31,159 32,884 855 12 118,138 119,005 3,598 (32,991) (29,393) - (29,393)
5045 Allen County Community College 51,095 444 849 1,372 22,580 25,245 1,322 19 121 1,462 5,562 10,317 15,879 - 15,879
5046 Coffeyville Community College - - - - - - - - - - - - - - -
5047 Garden City Community College 45,209 393 752 1,214 38,303 40,662 1,169 17 77,949 79,135 4,921 (20,000) (15,079) - (15,079)
5048 Hutchinson Community College 670,120 5,822 11,137 17,997 206,987 241,943 17,332 246 88,582 106,160 72,944 74,904 147,848 - 147,848
5049 Kansas City Kansas Community College 1,087,482 9,448 18,075 29,205 231,655 288,383 28,127 400 813,545 842,072 118,375 (41,979) 76,396 30,826 107,222
5050 Neosho County Community College 50,125 435 833 1,346 50,736 53,350 1,296 18 222,023 223,337 5,456 (52,711) (47,255) - (47,255)
5107 Cowley County Community College 214,663 1,865 3,568 5,765 100,099 111,297 5,552 79 51,487 57,118 23,367 41,812 65,179 - 65,179
5108 Barton County Community College 138,733 1,205 2,306 3,726 29,940 37,177 3,588 51 15,602 19,241 15,101 (36,893) (21,792) - (21,792)
5109 Butler County Community College 482,815 4,195 8,025 12,966 204,695 229,881 12,488 178 315,573 328,239 52,556 (590) 51,966 - 51,966
5110 Colby Community College 164,603 1,430 2,736 4,421 3,696 12,283 4,257 61 46,271 50,589 17,918 (10,594) 7,324 - 7,324
(continued)
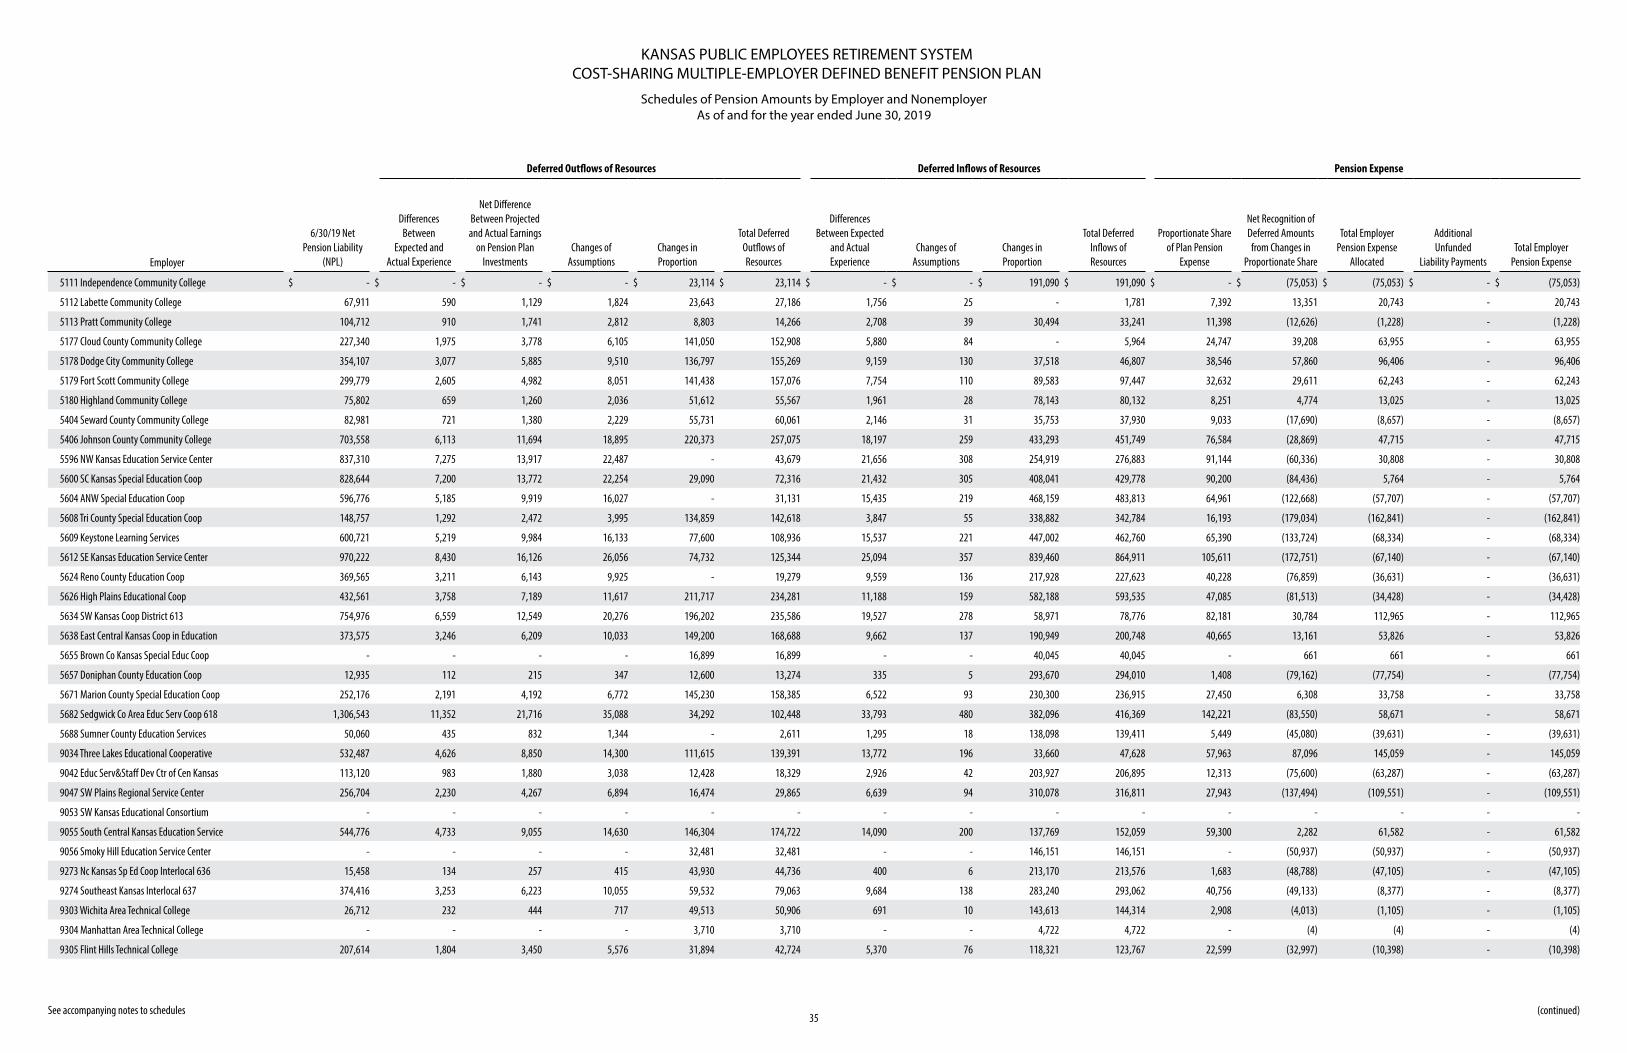
KANSAS PUBLIC EMPLOYEES RETIREMENT SYSTEMCOST-SHARING MULTIPLE-EMPLOYER DEFINED BENEFIT PENSION PLAN
Schedules of Pension Amounts by Employer and NonemployerAs of and for the year ended June 30, 2019
35 See accompanying notes to schedules
Deferred Outflows of Resources Deferred Inflows of Resources Pension Expense
Employer
6/30/19 Net Pension Liability
(NPL)
Differences Between
Expected and Actual Experience
Net Difference Between Projected and Actual Earnings
on Pension Plan Investments
Changes of Assumptions
Changes in Proportion
Total Deferred Outflows of Resources
Differences Between Expected
and Actual Experience
Changes of Assumptions
Changes in Proportion
Total Deferred Inflows of Resources
Proportionate Share of Plan Pension
Expense
Net Recognition of Deferred Amounts from Changes in
Proportionate Share
Total Employer Pension Expense
Allocated
Additional Unfunded
Liability PaymentsTotal Employer
Pension Expense
5111 Independence Community College $ - $ - $ - $ - $ 23,114 $ 23,114 $ - $ - $ 191,090 $ 191,090 $ - $ (75,053) $ (75,053) $ - $ (75,053)
5112 Labette Community College 67,911 590 1,129 1,824 23,643 27,186 1,756 25 - 1,781 7,392 13,351 20,743 - 20,743
5113 Pratt Community College 104,712 910 1,741 2,812 8,803 14,266 2,708 39 30,494 33,241 11,398 (12,626) (1,228) - (1,228)
5177 Cloud County Community College 227,340 1,975 3,778 6,105 141,050 152,908 5,880 84 - 5,964 24,747 39,208 63,955 - 63,955
5178 Dodge City Community College 354,107 3,077 5,885 9,510 136,797 155,269 9,159 130 37,518 46,807 38,546 57,860 96,406 - 96,406
5179 Fort Scott Community College 299,779 2,605 4,982 8,051 141,438 157,076 7,754 110 89,583 97,447 32,632 29,611 62,243 - 62,243
5180 Highland Community College 75,802 659 1,260 2,036 51,612 55,567 1,961 28 78,143 80,132 8,251 4,774 13,025 - 13,025
5404 Seward County Community College 82,981 721 1,380 2,229 55,731 60,061 2,146 31 35,753 37,930 9,033 (17,690) (8,657) - (8,657)
5406 Johnson County Community College 703,558 6,113 11,694 18,895 220,373 257,075 18,197 259 433,293 451,749 76,584 (28,869) 47,715 - 47,715
5596 NW Kansas Education Service Center 837,310 7,275 13,917 22,487 - 43,679 21,656 308 254,919 276,883 91,144 (60,336) 30,808 - 30,808
5600 SC Kansas Special Education Coop 828,644 7,200 13,772 22,254 29,090 72,316 21,432 305 408,041 429,778 90,200 (84,436) 5,764 - 5,764
5604 ANW Special Education Coop 596,776 5,185 9,919 16,027 - 31,131 15,435 219 468,159 483,813 64,961 (122,668) (57,707) - (57,707)
5608 Tri County Special Education Coop 148,757 1,292 2,472 3,995 134,859 142,618 3,847 55 338,882 342,784 16,193 (179,034) (162,841) - (162,841)
5609 Keystone Learning Services 600,721 5,219 9,984 16,133 77,600 108,936 15,537 221 447,002 462,760 65,390 (133,724) (68,334) - (68,334)
5612 SE Kansas Education Service Center 970,222 8,430 16,126 26,056 74,732 125,344 25,094 357 839,460 864,911 105,611 (172,751) (67,140) - (67,140)
5624 Reno County Education Coop 369,565 3,211 6,143 9,925 - 19,279 9,559 136 217,928 227,623 40,228 (76,859) (36,631) - (36,631)
5626 High Plains Educational Coop 432,561 3,758 7,189 11,617 211,717 234,281 11,188 159 582,188 593,535 47,085 (81,513) (34,428) - (34,428)
5634 SW Kansas Coop District 613 754,976 6,559 12,549 20,276 196,202 235,586 19,527 278 58,971 78,776 82,181 30,784 112,965 - 112,965
5638 East Central Kansas Coop in Education 373,575 3,246 6,209 10,033 149,200 168,688 9,662 137 190,949 200,748 40,665 13,161 53,826 - 53,826
5655 Brown Co Kansas Special Educ Coop - - - - 16,899 16,899 - - 40,045 40,045 - 661 661 - 661
5657 Doniphan County Education Coop 12,935 112 215 347 12,600 13,274 335 5 293,670 294,010 1,408 (79,162) (77,754) - (77,754)
5671 Marion County Special Education Coop 252,176 2,191 4,192 6,772 145,230 158,385 6,522 93 230,300 236,915 27,450 6,308 33,758 - 33,758
5682 Sedgwick Co Area Educ Serv Coop 618 1,306,543 11,352 21,716 35,088 34,292 102,448 33,793 480 382,096 416,369 142,221 (83,550) 58,671 - 58,671
5688 Sumner County Education Services 50,060 435 832 1,344 - 2,611 1,295 18 138,098 139,411 5,449 (45,080) (39,631) - (39,631)
9034 Three Lakes Educational Cooperative 532,487 4,626 8,850 14,300 111,615 139,391 13,772 196 33,660 47,628 57,963 87,096 145,059 - 145,059
9042 Educ Serv&Staff Dev Ctr of Cen Kansas 113,120 983 1,880 3,038 12,428 18,329 2,926 42 203,927 206,895 12,313 (75,600) (63,287) - (63,287)
9047 SW Plains Regional Service Center 256,704 2,230 4,267 6,894 16,474 29,865 6,639 94 310,078 316,811 27,943 (137,494) (109,551) - (109,551)
9053 SW Kansas Educational Consortium - - - - - - - - - - - - - - -
9055 South Central Kansas Education Service 544,776 4,733 9,055 14,630 146,304 174,722 14,090 200 137,769 152,059 59,300 2,282 61,582 - 61,582
9056 Smoky Hill Education Service Center - - - - 32,481 32,481 - - 146,151 146,151 - (50,937) (50,937) - (50,937)
9273 Nc Kansas Sp Ed Coop Interlocal 636 15,458 134 257 415 43,930 44,736 400 6 213,170 213,576 1,683 (48,788) (47,105) - (47,105)
9274 Southeast Kansas Interlocal 637 374,416 3,253 6,223 10,055 59,532 79,063 9,684 138 283,240 293,062 40,756 (49,133) (8,377) - (8,377)
9303 Wichita Area Technical College 26,712 232 444 717 49,513 50,906 691 10 143,613 144,314 2,908 (4,013) (1,105) - (1,105)
9304 Manhattan Area Technical College - - - - 3,710 3,710 - - 4,722 4,722 - (4) (4) - (4)
9305 Flint Hills Technical College 207,614 1,804 3,450 5,576 31,894 42,724 5,370 76 118,321 123,767 22,599 (32,997) (10,398) - (10,398)
(continued)
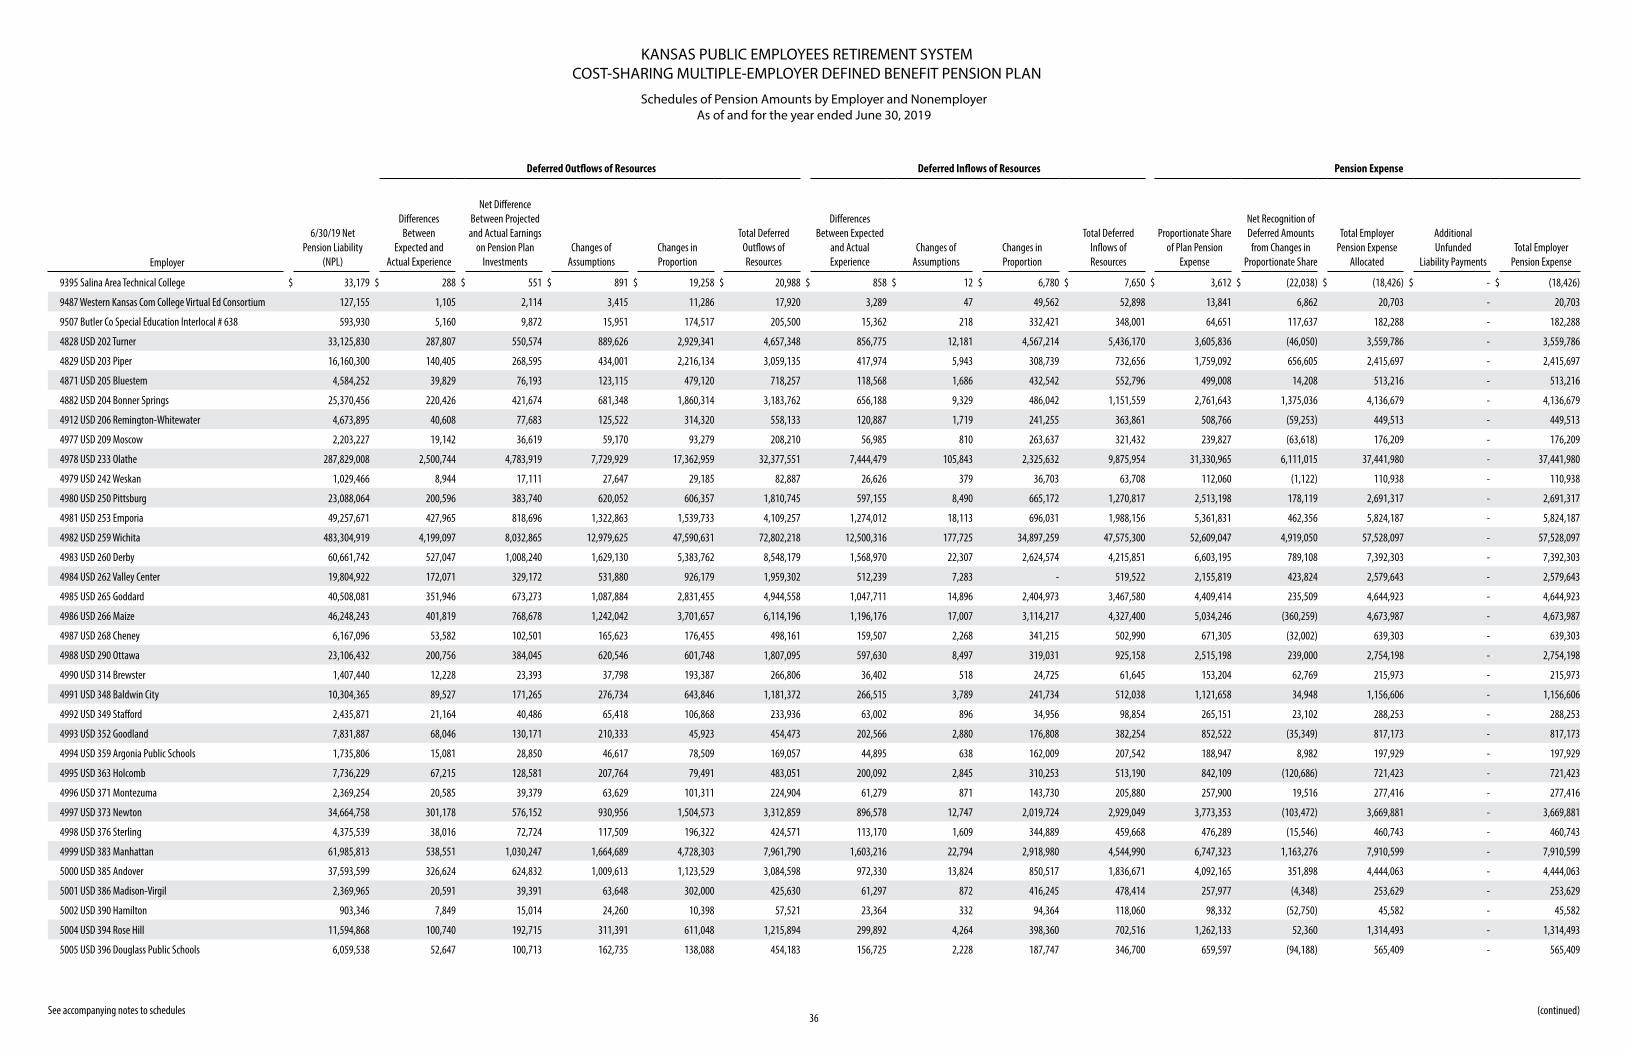
KANSAS PUBLIC EMPLOYEES RETIREMENT SYSTEMCOST-SHARING MULTIPLE-EMPLOYER DEFINED BENEFIT PENSION PLAN
Schedules of Pension Amounts by Employer and NonemployerAs of and for the year ended June 30, 2019
36 See accompanying notes to schedules
Deferred Outflows of Resources Deferred Inflows of Resources Pension Expense
Employer
6/30/19 Net Pension Liability
(NPL)
Differences Between
Expected and Actual Experience
Net Difference Between Projected and Actual Earnings
on Pension Plan Investments
Changes of Assumptions
Changes in Proportion
Total Deferred Outflows of Resources
Differences Between Expected
and Actual Experience
Changes of Assumptions
Changes in Proportion
Total Deferred Inflows of Resources
Proportionate Share of Plan Pension
Expense
Net Recognition of Deferred Amounts from Changes in
Proportionate Share
Total Employer Pension Expense
Allocated
Additional Unfunded
Liability PaymentsTotal Employer
Pension Expense
9395 Salina Area Technical College $ 33,179 $ 288 $ 551 $ 891 $ 19,258 $ 20,988 $ 858 $ 12 $ 6,780 $ 7,650 $ 3,612 $ (22,038) $ (18,426) $ - $ (18,426)
9487 Western Kansas Com College Virtual Ed Consortium 127,155 1,105 2,114 3,415 11,286 17,920 3,289 47 49,562 52,898 13,841 6,862 20,703 - 20,703
9507 Butler Co Special Education Interlocal # 638 593,930 5,160 9,872 15,951 174,517 205,500 15,362 218 332,421 348,001 64,651 117,637 182,288 - 182,288
4828 USD 202 Turner 33,125,830 287,807 550,574 889,626 2,929,341 4,657,348 856,775 12,181 4,567,214 5,436,170 3,605,836 (46,050) 3,559,786 - 3,559,786
4829 USD 203 Piper 16,160,300 140,405 268,595 434,001 2,216,134 3,059,135 417,974 5,943 308,739 732,656 1,759,092 656,605 2,415,697 - 2,415,697
4871 USD 205 Bluestem 4,584,252 39,829 76,193 123,115 479,120 718,257 118,568 1,686 432,542 552,796 499,008 14,208 513,216 - 513,216
4882 USD 204 Bonner Springs 25,370,456 220,426 421,674 681,348 1,860,314 3,183,762 656,188 9,329 486,042 1,151,559 2,761,643 1,375,036 4,136,679 - 4,136,679
4912 USD 206 Remington-Whitewater 4,673,895 40,608 77,683 125,522 314,320 558,133 120,887 1,719 241,255 363,861 508,766 (59,253) 449,513 - 449,513
4977 USD 209 Moscow 2,203,227 19,142 36,619 59,170 93,279 208,210 56,985 810 263,637 321,432 239,827 (63,618) 176,209 - 176,209
4978 USD 233 Olathe 287,829,008 2,500,744 4,783,919 7,729,929 17,362,959 32,377,551 7,444,479 105,843 2,325,632 9,875,954 31,330,965 6,111,015 37,441,980 - 37,441,980
4979 USD 242 Weskan 1,029,466 8,944 17,111 27,647 29,185 82,887 26,626 379 36,703 63,708 112,060 (1,122) 110,938 - 110,938
4980 USD 250 Pittsburg 23,088,064 200,596 383,740 620,052 606,357 1,810,745 597,155 8,490 665,172 1,270,817 2,513,198 178,119 2,691,317 - 2,691,317
4981 USD 253 Emporia 49,257,671 427,965 818,696 1,322,863 1,539,733 4,109,257 1,274,012 18,113 696,031 1,988,156 5,361,831 462,356 5,824,187 - 5,824,187
4982 USD 259 Wichita 483,304,919 4,199,097 8,032,865 12,979,625 47,590,631 72,802,218 12,500,316 177,725 34,897,259 47,575,300 52,609,047 4,919,050 57,528,097 - 57,528,097
4983 USD 260 Derby 60,661,742 527,047 1,008,240 1,629,130 5,383,762 8,548,179 1,568,970 22,307 2,624,574 4,215,851 6,603,195 789,108 7,392,303 - 7,392,303
4984 USD 262 Valley Center 19,804,922 172,071 329,172 531,880 926,179 1,959,302 512,239 7,283 - 519,522 2,155,819 423,824 2,579,643 - 2,579,643
4985 USD 265 Goddard 40,508,081 351,946 673,273 1,087,884 2,831,455 4,944,558 1,047,711 14,896 2,404,973 3,467,580 4,409,414 235,509 4,644,923 - 4,644,923
4986 USD 266 Maize 46,248,243 401,819 768,678 1,242,042 3,701,657 6,114,196 1,196,176 17,007 3,114,217 4,327,400 5,034,246 (360,259) 4,673,987 - 4,673,987
4987 USD 268 Cheney 6,167,096 53,582 102,501 165,623 176,455 498,161 159,507 2,268 341,215 502,990 671,305 (32,002) 639,303 - 639,303
4988 USD 290 Ottawa 23,106,432 200,756 384,045 620,546 601,748 1,807,095 597,630 8,497 319,031 925,158 2,515,198 239,000 2,754,198 - 2,754,198
4990 USD 314 Brewster 1,407,440 12,228 23,393 37,798 193,387 266,806 36,402 518 24,725 61,645 153,204 62,769 215,973 - 215,973
4991 USD 348 Baldwin City 10,304,365 89,527 171,265 276,734 643,846 1,181,372 266,515 3,789 241,734 512,038 1,121,658 34,948 1,156,606 - 1,156,606
4992 USD 349 Stafford 2,435,871 21,164 40,486 65,418 106,868 233,936 63,002 896 34,956 98,854 265,151 23,102 288,253 - 288,253
4993 USD 352 Goodland 7,831,887 68,046 130,171 210,333 45,923 454,473 202,566 2,880 176,808 382,254 852,522 (35,349) 817,173 - 817,173
4994 USD 359 Argonia Public Schools 1,735,806 15,081 28,850 46,617 78,509 169,057 44,895 638 162,009 207,542 188,947 8,982 197,929 - 197,929
4995 USD 363 Holcomb 7,736,229 67,215 128,581 207,764 79,491 483,051 200,092 2,845 310,253 513,190 842,109 (120,686) 721,423 - 721,423
4996 USD 371 Montezuma 2,369,254 20,585 39,379 63,629 101,311 224,904 61,279 871 143,730 205,880 257,900 19,516 277,416 - 277,416
4997 USD 373 Newton 34,664,758 301,178 576,152 930,956 1,504,573 3,312,859 896,578 12,747 2,019,724 2,929,049 3,773,353 (103,472) 3,669,881 - 3,669,881
4998 USD 376 Sterling 4,375,539 38,016 72,724 117,509 196,322 424,571 113,170 1,609 344,889 459,668 476,289 (15,546) 460,743 - 460,743
4999 USD 383 Manhattan 61,985,813 538,551 1,030,247 1,664,689 4,728,303 7,961,790 1,603,216 22,794 2,918,980 4,544,990 6,747,323 1,163,276 7,910,599 - 7,910,599
5000 USD 385 Andover 37,593,599 326,624 624,832 1,009,613 1,123,529 3,084,598 972,330 13,824 850,517 1,836,671 4,092,165 351,898 4,444,063 - 4,444,063
5001 USD 386 Madison-Virgil 2,369,965 20,591 39,391 63,648 302,000 425,630 61,297 872 416,245 478,414 257,977 (4,348) 253,629 - 253,629
5002 USD 390 Hamilton 903,346 7,849 15,014 24,260 10,398 57,521 23,364 332 94,364 118,060 98,332 (52,750) 45,582 - 45,582
5004 USD 394 Rose Hill 11,594,868 100,740 192,715 311,391 611,048 1,215,894 299,892 4,264 398,360 702,516 1,262,133 52,360 1,314,493 - 1,314,493
5005 USD 396 Douglass Public Schools 6,059,538 52,647 100,713 162,735 138,088 454,183 156,725 2,228 187,747 346,700 659,597 (94,188) 565,409 - 565,409
(continued)
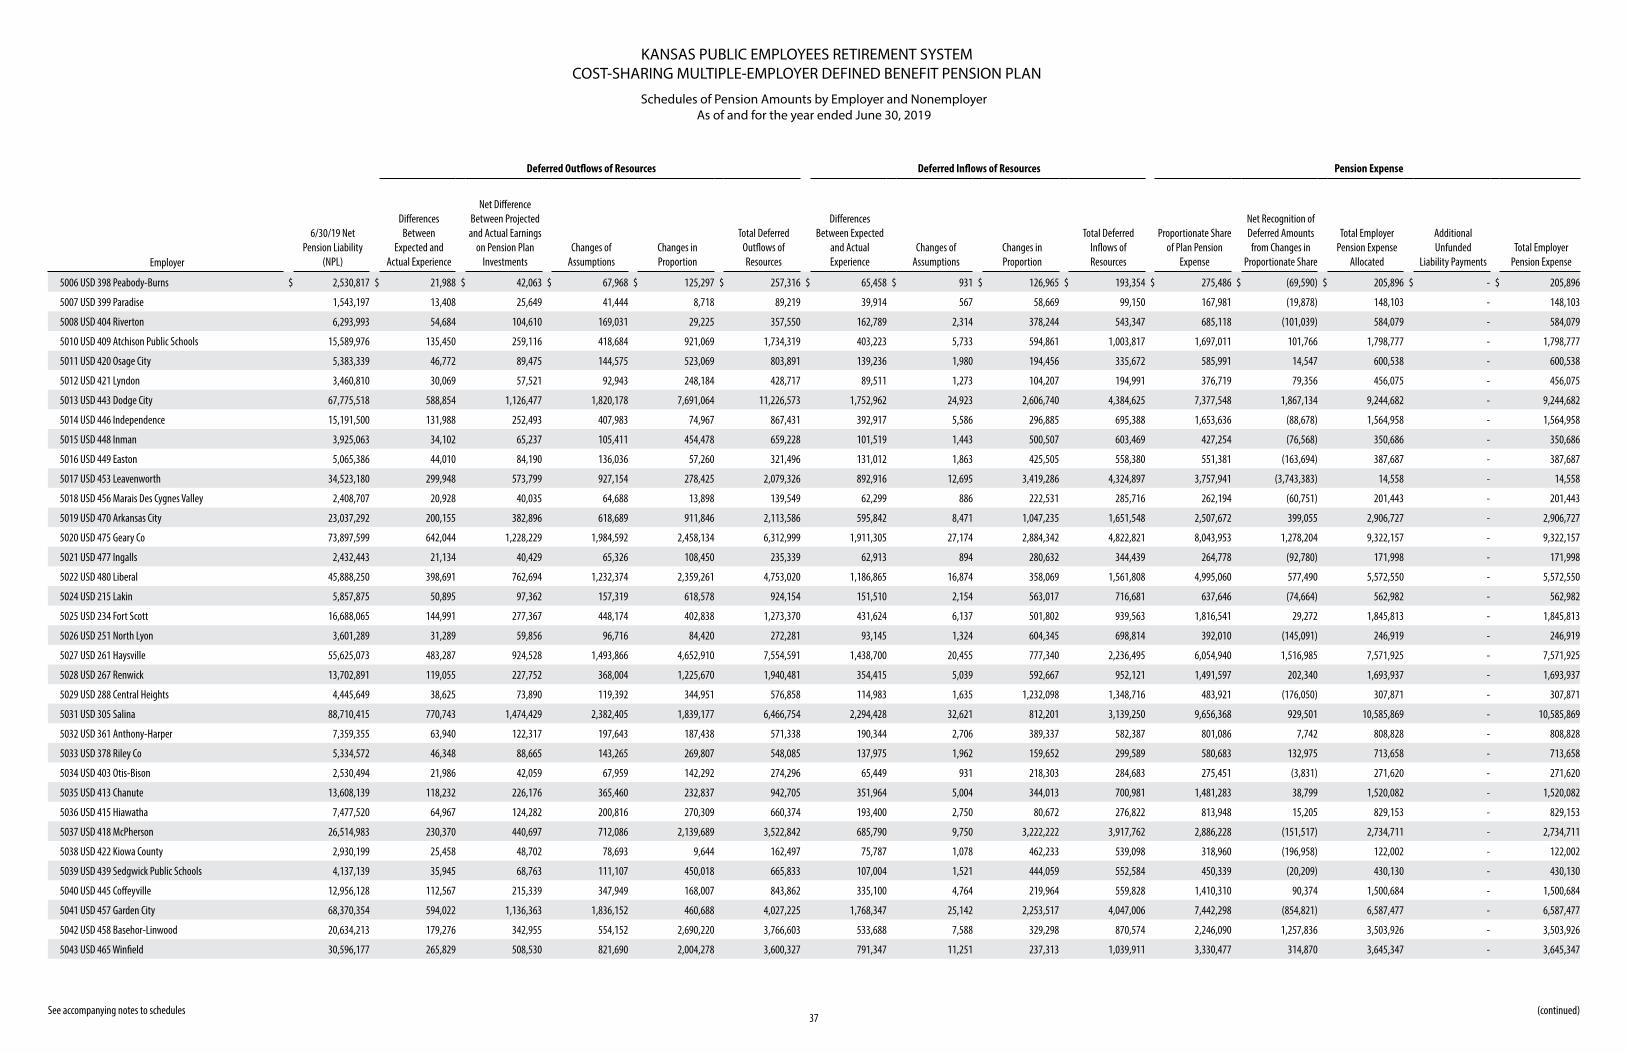
KANSAS PUBLIC EMPLOYEES RETIREMENT SYSTEMCOST-SHARING MULTIPLE-EMPLOYER DEFINED BENEFIT PENSION PLAN
Schedules of Pension Amounts by Employer and NonemployerAs of and for the year ended June 30, 2019
37 See accompanying notes to schedules
Deferred Outflows of Resources Deferred Inflows of Resources Pension Expense
Employer
6/30/19 Net Pension Liability
(NPL)
Differences Between
Expected and Actual Experience
Net Difference Between Projected and Actual Earnings
on Pension Plan Investments
Changes of Assumptions
Changes in Proportion
Total Deferred Outflows of Resources
Differences Between Expected
and Actual Experience
Changes of Assumptions
Changes in Proportion
Total Deferred Inflows of Resources
Proportionate Share of Plan Pension
Expense
Net Recognition of Deferred Amounts from Changes in
Proportionate Share
Total Employer Pension Expense
Allocated
Additional Unfunded
Liability PaymentsTotal Employer
Pension Expense
5006 USD 398 Peabody-Burns $ 2,530,817 $ 21,988 $ 42,063 $ 67,968 $ 125,297 $ 257,316 $ 65,458 $ 931 $ 126,965 $ 193,354 $ 275,486 $ (69,590) $ 205,896 $ - $ 205,896
5007 USD 399 Paradise 1,543,197 13,408 25,649 41,444 8,718 89,219 39,914 567 58,669 99,150 167,981 (19,878) 148,103 - 148,103
5008 USD 404 Riverton 6,293,993 54,684 104,610 169,031 29,225 357,550 162,789 2,314 378,244 543,347 685,118 (101,039) 584,079 - 584,079
5010 USD 409 Atchison Public Schools 15,589,976 135,450 259,116 418,684 921,069 1,734,319 403,223 5,733 594,861 1,003,817 1,697,011 101,766 1,798,777 - 1,798,777
5011 USD 420 Osage City 5,383,339 46,772 89,475 144,575 523,069 803,891 139,236 1,980 194,456 335,672 585,991 14,547 600,538 - 600,538
5012 USD 421 Lyndon 3,460,810 30,069 57,521 92,943 248,184 428,717 89,511 1,273 104,207 194,991 376,719 79,356 456,075 - 456,075
5013 USD 443 Dodge City 67,775,518 588,854 1,126,477 1,820,178 7,691,064 11,226,573 1,752,962 24,923 2,606,740 4,384,625 7,377,548 1,867,134 9,244,682 - 9,244,682
5014 USD 446 Independence 15,191,500 131,988 252,493 407,983 74,967 867,431 392,917 5,586 296,885 695,388 1,653,636 (88,678) 1,564,958 - 1,564,958
5015 USD 448 Inman 3,925,063 34,102 65,237 105,411 454,478 659,228 101,519 1,443 500,507 603,469 427,254 (76,568) 350,686 - 350,686
5016 USD 449 Easton 5,065,386 44,010 84,190 136,036 57,260 321,496 131,012 1,863 425,505 558,380 551,381 (163,694) 387,687 - 387,687
5017 USD 453 Leavenworth 34,523,180 299,948 573,799 927,154 278,425 2,079,326 892,916 12,695 3,419,286 4,324,897 3,757,941 (3,743,383) 14,558 - 14,558
5018 USD 456 Marais Des Cygnes Valley 2,408,707 20,928 40,035 64,688 13,898 139,549 62,299 886 222,531 285,716 262,194 (60,751) 201,443 - 201,443
5019 USD 470 Arkansas City 23,037,292 200,155 382,896 618,689 911,846 2,113,586 595,842 8,471 1,047,235 1,651,548 2,507,672 399,055 2,906,727 - 2,906,727
5020 USD 475 Geary Co 73,897,599 642,044 1,228,229 1,984,592 2,458,134 6,312,999 1,911,305 27,174 2,884,342 4,822,821 8,043,953 1,278,204 9,322,157 - 9,322,157
5021 USD 477 Ingalls 2,432,443 21,134 40,429 65,326 108,450 235,339 62,913 894 280,632 344,439 264,778 (92,780) 171,998 - 171,998
5022 USD 480 Liberal 45,888,250 398,691 762,694 1,232,374 2,359,261 4,753,020 1,186,865 16,874 358,069 1,561,808 4,995,060 577,490 5,572,550 - 5,572,550
5024 USD 215 Lakin 5,857,875 50,895 97,362 157,319 618,578 924,154 151,510 2,154 563,017 716,681 637,646 (74,664) 562,982 - 562,982
5025 USD 234 Fort Scott 16,688,065 144,991 277,367 448,174 402,838 1,273,370 431,624 6,137 501,802 939,563 1,816,541 29,272 1,845,813 - 1,845,813
5026 USD 251 North Lyon 3,601,289 31,289 59,856 96,716 84,420 272,281 93,145 1,324 604,345 698,814 392,010 (145,091) 246,919 - 246,919
5027 USD 261 Haysville 55,625,073 483,287 924,528 1,493,866 4,652,910 7,554,591 1,438,700 20,455 777,340 2,236,495 6,054,940 1,516,985 7,571,925 - 7,571,925
5028 USD 267 Renwick 13,702,891 119,055 227,752 368,004 1,225,670 1,940,481 354,415 5,039 592,667 952,121 1,491,597 202,340 1,693,937 - 1,693,937
5029 USD 288 Central Heights 4,445,649 38,625 73,890 119,392 344,951 576,858 114,983 1,635 1,232,098 1,348,716 483,921 (176,050) 307,871 - 307,871
5031 USD 305 Salina 88,710,415 770,743 1,474,429 2,382,405 1,839,177 6,466,754 2,294,428 32,621 812,201 3,139,250 9,656,368 929,501 10,585,869 - 10,585,869
5032 USD 361 Anthony-Harper 7,359,355 63,940 122,317 197,643 187,438 571,338 190,344 2,706 389,337 582,387 801,086 7,742 808,828 - 808,828
5033 USD 378 Riley Co 5,334,572 46,348 88,665 143,265 269,807 548,085 137,975 1,962 159,652 299,589 580,683 132,975 713,658 - 713,658
5034 USD 403 Otis-Bison 2,530,494 21,986 42,059 67,959 142,292 274,296 65,449 931 218,303 284,683 275,451 (3,831) 271,620 - 271,620
5035 USD 413 Chanute 13,608,139 118,232 226,176 365,460 232,837 942,705 351,964 5,004 344,013 700,981 1,481,283 38,799 1,520,082 - 1,520,082
5036 USD 415 Hiawatha 7,477,520 64,967 124,282 200,816 270,309 660,374 193,400 2,750 80,672 276,822 813,948 15,205 829,153 - 829,153
5037 USD 418 McPherson 26,514,983 230,370 440,697 712,086 2,139,689 3,522,842 685,790 9,750 3,222,222 3,917,762 2,886,228 (151,517) 2,734,711 - 2,734,711
5038 USD 422 Kiowa County 2,930,199 25,458 48,702 78,693 9,644 162,497 75,787 1,078 462,233 539,098 318,960 (196,958) 122,002 - 122,002
5039 USD 439 Sedgwick Public Schools 4,137,139 35,945 68,763 111,107 450,018 665,833 107,004 1,521 444,059 552,584 450,339 (20,209) 430,130 - 430,130
5040 USD 445 Coffeyville 12,956,128 112,567 215,339 347,949 168,007 843,862 335,100 4,764 219,964 559,828 1,410,310 90,374 1,500,684 - 1,500,684
5041 USD 457 Garden City 68,370,354 594,022 1,136,363 1,836,152 460,688 4,027,225 1,768,347 25,142 2,253,517 4,047,006 7,442,298 (854,821) 6,587,477 - 6,587,477
5042 USD 458 Basehor-Linwood 20,634,213 179,276 342,955 554,152 2,690,220 3,766,603 533,688 7,588 329,298 870,574 2,246,090 1,257,836 3,503,926 - 3,503,926
5043 USD 465 Winfield 30,596,177 265,829 508,530 821,690 2,004,278 3,600,327 791,347 11,251 237,313 1,039,911 3,330,477 314,870 3,645,347 - 3,645,347
(continued)
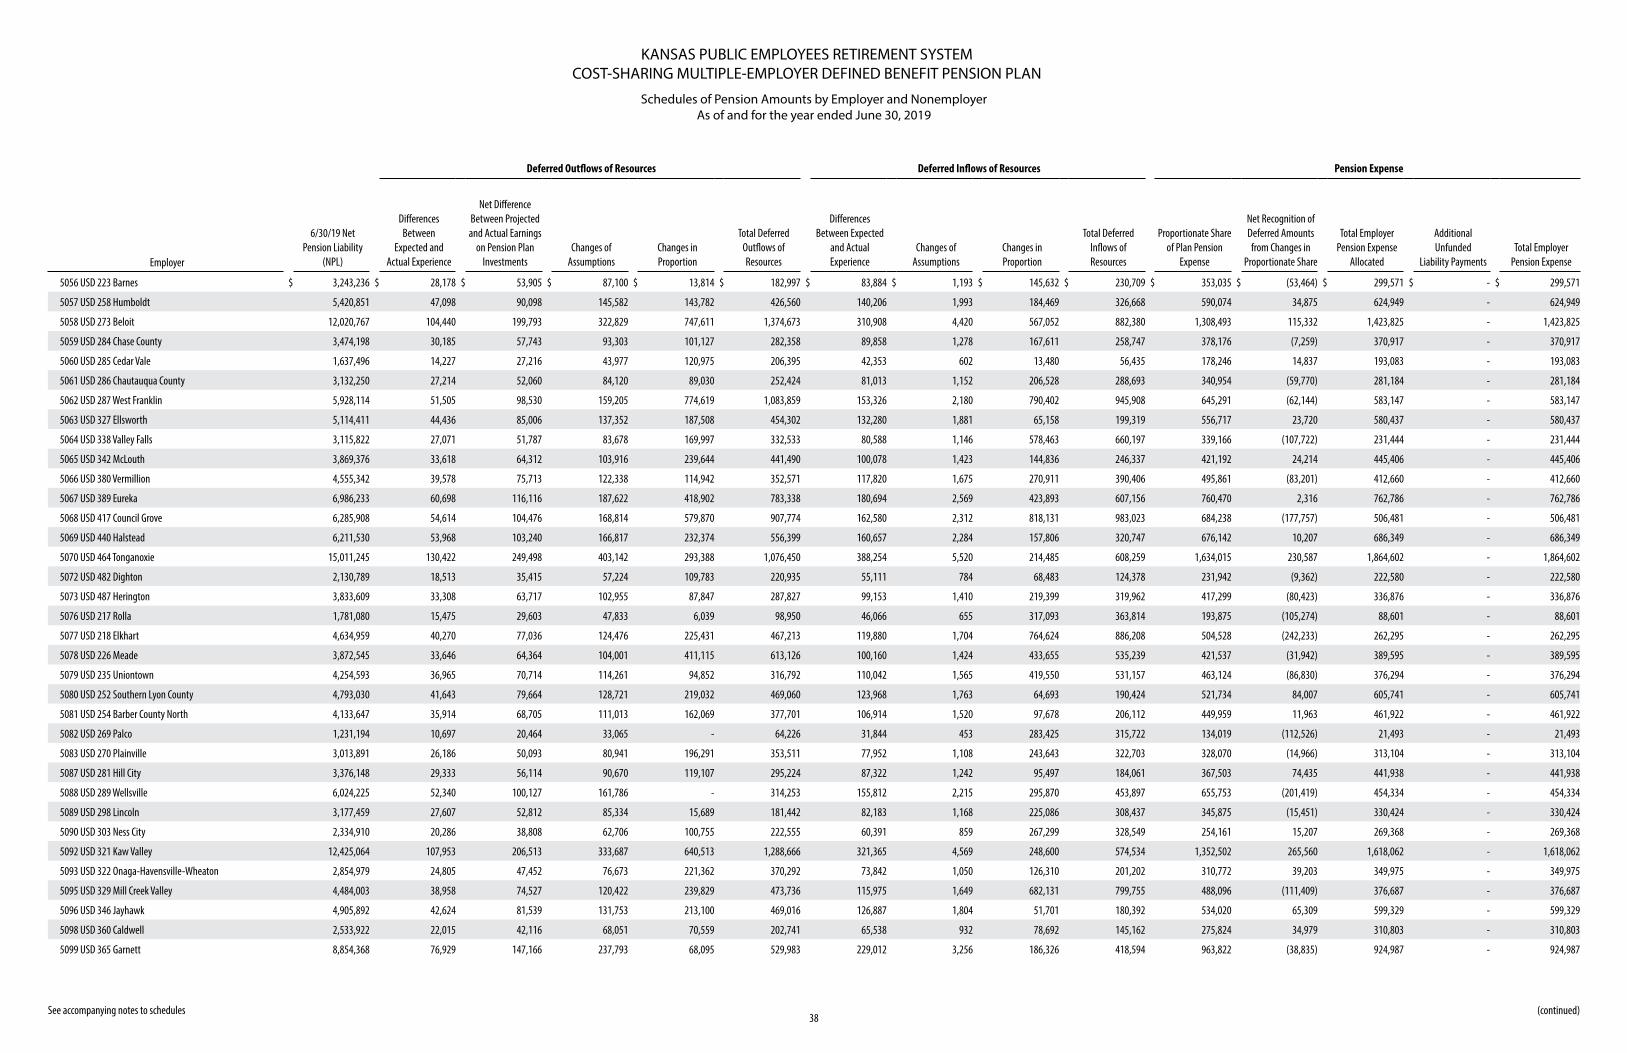
KANSAS PUBLIC EMPLOYEES RETIREMENT SYSTEMCOST-SHARING MULTIPLE-EMPLOYER DEFINED BENEFIT PENSION PLAN
Schedules of Pension Amounts by Employer and NonemployerAs of and for the year ended June 30, 2019
38 See accompanying notes to schedules
Deferred Outflows of Resources Deferred Inflows of Resources Pension Expense
Employer
6/30/19 Net Pension Liability
(NPL)
Differences Between
Expected and Actual Experience
Net Difference Between Projected and Actual Earnings
on Pension Plan Investments
Changes of Assumptions
Changes in Proportion
Total Deferred Outflows of Resources
Differences Between Expected
and Actual Experience
Changes of Assumptions
Changes in Proportion
Total Deferred Inflows of Resources
Proportionate Share of Plan Pension
Expense
Net Recognition of Deferred Amounts from Changes in
Proportionate Share
Total Employer Pension Expense
Allocated
Additional Unfunded
Liability PaymentsTotal Employer
Pension Expense
5056 USD 223 Barnes $ 3,243,236 $ 28,178 $ 53,905 $ 87,100 $ 13,814 $ 182,997 $ 83,884 $ 1,193 $ 145,632 $ 230,709 $ 353,035 $ (53,464) $ 299,571 $ - $ 299,571
5057 USD 258 Humboldt 5,420,851 47,098 90,098 145,582 143,782 426,560 140,206 1,993 184,469 326,668 590,074 34,875 624,949 - 624,949
5058 USD 273 Beloit 12,020,767 104,440 199,793 322,829 747,611 1,374,673 310,908 4,420 567,052 882,380 1,308,493 115,332 1,423,825 - 1,423,825
5059 USD 284 Chase County 3,474,198 30,185 57,743 93,303 101,127 282,358 89,858 1,278 167,611 258,747 378,176 (7,259) 370,917 - 370,917
5060 USD 285 Cedar Vale 1,637,496 14,227 27,216 43,977 120,975 206,395 42,353 602 13,480 56,435 178,246 14,837 193,083 - 193,083
5061 USD 286 Chautauqua County 3,132,250 27,214 52,060 84,120 89,030 252,424 81,013 1,152 206,528 288,693 340,954 (59,770) 281,184 - 281,184
5062 USD 287 West Franklin 5,928,114 51,505 98,530 159,205 774,619 1,083,859 153,326 2,180 790,402 945,908 645,291 (62,144) 583,147 - 583,147
5063 USD 327 Ellsworth 5,114,411 44,436 85,006 137,352 187,508 454,302 132,280 1,881 65,158 199,319 556,717 23,720 580,437 - 580,437
5064 USD 338 Valley Falls 3,115,822 27,071 51,787 83,678 169,997 332,533 80,588 1,146 578,463 660,197 339,166 (107,722) 231,444 - 231,444
5065 USD 342 McLouth 3,869,376 33,618 64,312 103,916 239,644 441,490 100,078 1,423 144,836 246,337 421,192 24,214 445,406 - 445,406
5066 USD 380 Vermillion 4,555,342 39,578 75,713 122,338 114,942 352,571 117,820 1,675 270,911 390,406 495,861 (83,201) 412,660 - 412,660
5067 USD 389 Eureka 6,986,233 60,698 116,116 187,622 418,902 783,338 180,694 2,569 423,893 607,156 760,470 2,316 762,786 - 762,786
5068 USD 417 Council Grove 6,285,908 54,614 104,476 168,814 579,870 907,774 162,580 2,312 818,131 983,023 684,238 (177,757) 506,481 - 506,481
5069 USD 440 Halstead 6,211,530 53,968 103,240 166,817 232,374 556,399 160,657 2,284 157,806 320,747 676,142 10,207 686,349 - 686,349
5070 USD 464 Tonganoxie 15,011,245 130,422 249,498 403,142 293,388 1,076,450 388,254 5,520 214,485 608,259 1,634,015 230,587 1,864,602 - 1,864,602
5072 USD 482 Dighton 2,130,789 18,513 35,415 57,224 109,783 220,935 55,111 784 68,483 124,378 231,942 (9,362) 222,580 - 222,580
5073 USD 487 Herington 3,833,609 33,308 63,717 102,955 87,847 287,827 99,153 1,410 219,399 319,962 417,299 (80,423) 336,876 - 336,876
5076 USD 217 Rolla 1,781,080 15,475 29,603 47,833 6,039 98,950 46,066 655 317,093 363,814 193,875 (105,274) 88,601 - 88,601
5077 USD 218 Elkhart 4,634,959 40,270 77,036 124,476 225,431 467,213 119,880 1,704 764,624 886,208 504,528 (242,233) 262,295 - 262,295
5078 USD 226 Meade 3,872,545 33,646 64,364 104,001 411,115 613,126 100,160 1,424 433,655 535,239 421,537 (31,942) 389,595 - 389,595
5079 USD 235 Uniontown 4,254,593 36,965 70,714 114,261 94,852 316,792 110,042 1,565 419,550 531,157 463,124 (86,830) 376,294 - 376,294
5080 USD 252 Southern Lyon County 4,793,030 41,643 79,664 128,721 219,032 469,060 123,968 1,763 64,693 190,424 521,734 84,007 605,741 - 605,741
5081 USD 254 Barber County North 4,133,647 35,914 68,705 111,013 162,069 377,701 106,914 1,520 97,678 206,112 449,959 11,963 461,922 - 461,922
5082 USD 269 Palco 1,231,194 10,697 20,464 33,065 - 64,226 31,844 453 283,425 315,722 134,019 (112,526) 21,493 - 21,493
5083 USD 270 Plainville 3,013,891 26,186 50,093 80,941 196,291 353,511 77,952 1,108 243,643 322,703 328,070 (14,966) 313,104 - 313,104
5087 USD 281 Hill City 3,376,148 29,333 56,114 90,670 119,107 295,224 87,322 1,242 95,497 184,061 367,503 74,435 441,938 - 441,938
5088 USD 289 Wellsville 6,024,225 52,340 100,127 161,786 - 314,253 155,812 2,215 295,870 453,897 655,753 (201,419) 454,334 - 454,334
5089 USD 298 Lincoln 3,177,459 27,607 52,812 85,334 15,689 181,442 82,183 1,168 225,086 308,437 345,875 (15,451) 330,424 - 330,424
5090 USD 303 Ness City 2,334,910 20,286 38,808 62,706 100,755 222,555 60,391 859 267,299 328,549 254,161 15,207 269,368 - 269,368
5092 USD 321 Kaw Valley 12,425,064 107,953 206,513 333,687 640,513 1,288,666 321,365 4,569 248,600 574,534 1,352,502 265,560 1,618,062 - 1,618,062
5093 USD 322 Onaga-Havensville-Wheaton 2,854,979 24,805 47,452 76,673 221,362 370,292 73,842 1,050 126,310 201,202 310,772 39,203 349,975 - 349,975
5095 USD 329 Mill Creek Valley 4,484,003 38,958 74,527 120,422 239,829 473,736 115,975 1,649 682,131 799,755 488,096 (111,409) 376,687 - 376,687
5096 USD 346 Jayhawk 4,905,892 42,624 81,539 131,753 213,100 469,016 126,887 1,804 51,701 180,392 534,020 65,309 599,329 - 599,329
5098 USD 360 Caldwell 2,533,922 22,015 42,116 68,051 70,559 202,741 65,538 932 78,692 145,162 275,824 34,979 310,803 - 310,803
5099 USD 365 Garnett 8,854,368 76,929 147,166 237,793 68,095 529,983 229,012 3,256 186,326 418,594 963,822 (38,835) 924,987 - 924,987
(continued)
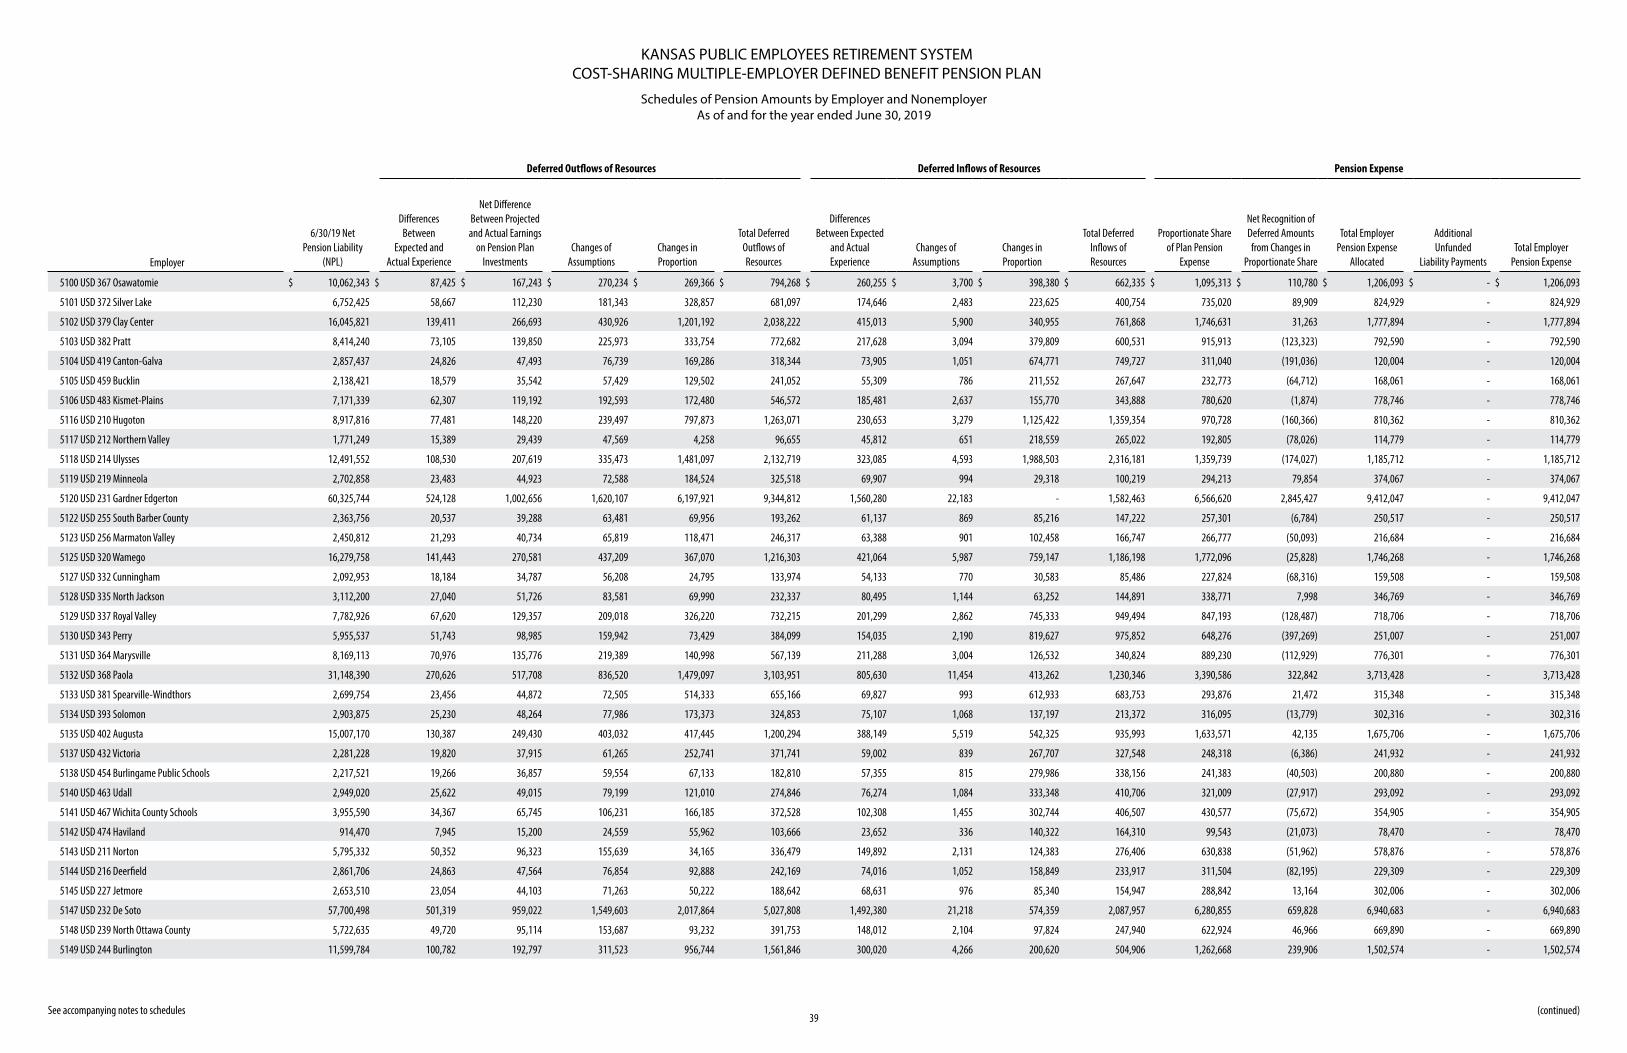
KANSAS PUBLIC EMPLOYEES RETIREMENT SYSTEMCOST-SHARING MULTIPLE-EMPLOYER DEFINED BENEFIT PENSION PLAN
Schedules of Pension Amounts by Employer and NonemployerAs of and for the year ended June 30, 2019
39 See accompanying notes to schedules
Deferred Outflows of Resources Deferred Inflows of Resources Pension Expense
Employer
6/30/19 Net Pension Liability
(NPL)
Differences Between
Expected and Actual Experience
Net Difference Between Projected and Actual Earnings
on Pension Plan Investments
Changes of Assumptions
Changes in Proportion
Total Deferred Outflows of Resources
Differences Between Expected
and Actual Experience
Changes of Assumptions
Changes in Proportion
Total Deferred Inflows of Resources
Proportionate Share of Plan Pension
Expense
Net Recognition of Deferred Amounts from Changes in
Proportionate Share
Total Employer Pension Expense
Allocated
Additional Unfunded
Liability PaymentsTotal Employer
Pension Expense
5100 USD 367 Osawatomie $ 10,062,343 $ 87,425 $ 167,243 $ 270,234 $ 269,366 $ 794,268 $ 260,255 $ 3,700 $ 398,380 $ 662,335 $ 1,095,313 $ 110,780 $ 1,206,093 $ - $ 1,206,093
5101 USD 372 Silver Lake 6,752,425 58,667 112,230 181,343 328,857 681,097 174,646 2,483 223,625 400,754 735,020 89,909 824,929 - 824,929
5102 USD 379 Clay Center 16,045,821 139,411 266,693 430,926 1,201,192 2,038,222 415,013 5,900 340,955 761,868 1,746,631 31,263 1,777,894 - 1,777,894
5103 USD 382 Pratt 8,414,240 73,105 139,850 225,973 333,754 772,682 217,628 3,094 379,809 600,531 915,913 (123,323) 792,590 - 792,590
5104 USD 419 Canton-Galva 2,857,437 24,826 47,493 76,739 169,286 318,344 73,905 1,051 674,771 749,727 311,040 (191,036) 120,004 - 120,004
5105 USD 459 Bucklin 2,138,421 18,579 35,542 57,429 129,502 241,052 55,309 786 211,552 267,647 232,773 (64,712) 168,061 - 168,061
5106 USD 483 Kismet-Plains 7,171,339 62,307 119,192 192,593 172,480 546,572 185,481 2,637 155,770 343,888 780,620 (1,874) 778,746 - 778,746
5116 USD 210 Hugoton 8,917,816 77,481 148,220 239,497 797,873 1,263,071 230,653 3,279 1,125,422 1,359,354 970,728 (160,366) 810,362 - 810,362
5117 USD 212 Northern Valley 1,771,249 15,389 29,439 47,569 4,258 96,655 45,812 651 218,559 265,022 192,805 (78,026) 114,779 - 114,779
5118 USD 214 Ulysses 12,491,552 108,530 207,619 335,473 1,481,097 2,132,719 323,085 4,593 1,988,503 2,316,181 1,359,739 (174,027) 1,185,712 - 1,185,712
5119 USD 219 Minneola 2,702,858 23,483 44,923 72,588 184,524 325,518 69,907 994 29,318 100,219 294,213 79,854 374,067 - 374,067
5120 USD 231 Gardner Edgerton 60,325,744 524,128 1,002,656 1,620,107 6,197,921 9,344,812 1,560,280 22,183 - 1,582,463 6,566,620 2,845,427 9,412,047 - 9,412,047
5122 USD 255 South Barber County 2,363,756 20,537 39,288 63,481 69,956 193,262 61,137 869 85,216 147,222 257,301 (6,784) 250,517 - 250,517
5123 USD 256 Marmaton Valley 2,450,812 21,293 40,734 65,819 118,471 246,317 63,388 901 102,458 166,747 266,777 (50,093) 216,684 - 216,684
5125 USD 320 Wamego 16,279,758 141,443 270,581 437,209 367,070 1,216,303 421,064 5,987 759,147 1,186,198 1,772,096 (25,828) 1,746,268 - 1,746,268
5127 USD 332 Cunningham 2,092,953 18,184 34,787 56,208 24,795 133,974 54,133 770 30,583 85,486 227,824 (68,316) 159,508 - 159,508
5128 USD 335 North Jackson 3,112,200 27,040 51,726 83,581 69,990 232,337 80,495 1,144 63,252 144,891 338,771 7,998 346,769 - 346,769
5129 USD 337 Royal Valley 7,782,926 67,620 129,357 209,018 326,220 732,215 201,299 2,862 745,333 949,494 847,193 (128,487) 718,706 - 718,706
5130 USD 343 Perry 5,955,537 51,743 98,985 159,942 73,429 384,099 154,035 2,190 819,627 975,852 648,276 (397,269) 251,007 - 251,007
5131 USD 364 Marysville 8,169,113 70,976 135,776 219,389 140,998 567,139 211,288 3,004 126,532 340,824 889,230 (112,929) 776,301 - 776,301
5132 USD 368 Paola 31,148,390 270,626 517,708 836,520 1,479,097 3,103,951 805,630 11,454 413,262 1,230,346 3,390,586 322,842 3,713,428 - 3,713,428
5133 USD 381 Spearville-Windthors 2,699,754 23,456 44,872 72,505 514,333 655,166 69,827 993 612,933 683,753 293,876 21,472 315,348 - 315,348
5134 USD 393 Solomon 2,903,875 25,230 48,264 77,986 173,373 324,853 75,107 1,068 137,197 213,372 316,095 (13,779) 302,316 - 302,316
5135 USD 402 Augusta 15,007,170 130,387 249,430 403,032 417,445 1,200,294 388,149 5,519 542,325 935,993 1,633,571 42,135 1,675,706 - 1,675,706
5137 USD 432 Victoria 2,281,228 19,820 37,915 61,265 252,741 371,741 59,002 839 267,707 327,548 248,318 (6,386) 241,932 - 241,932
5138 USD 454 Burlingame Public Schools 2,217,521 19,266 36,857 59,554 67,133 182,810 57,355 815 279,986 338,156 241,383 (40,503) 200,880 - 200,880
5140 USD 463 Udall 2,949,020 25,622 49,015 79,199 121,010 274,846 76,274 1,084 333,348 410,706 321,009 (27,917) 293,092 - 293,092
5141 USD 467 Wichita County Schools 3,955,590 34,367 65,745 106,231 166,185 372,528 102,308 1,455 302,744 406,507 430,577 (75,672) 354,905 - 354,905
5142 USD 474 Haviland 914,470 7,945 15,200 24,559 55,962 103,666 23,652 336 140,322 164,310 99,543 (21,073) 78,470 - 78,470
5143 USD 211 Norton 5,795,332 50,352 96,323 155,639 34,165 336,479 149,892 2,131 124,383 276,406 630,838 (51,962) 578,876 - 578,876
5144 USD 216 Deerfield 2,861,706 24,863 47,564 76,854 92,888 242,169 74,016 1,052 158,849 233,917 311,504 (82,195) 229,309 - 229,309
5145 USD 227 Jetmore 2,653,510 23,054 44,103 71,263 50,222 188,642 68,631 976 85,340 154,947 288,842 13,164 302,006 - 302,006
5147 USD 232 De Soto 57,700,498 501,319 959,022 1,549,603 2,017,864 5,027,808 1,492,380 21,218 574,359 2,087,957 6,280,855 659,828 6,940,683 - 6,940,683
5148 USD 239 North Ottawa County 5,722,635 49,720 95,114 153,687 93,232 391,753 148,012 2,104 97,824 247,940 622,924 46,966 669,890 - 669,890
5149 USD 244 Burlington 11,599,784 100,782 192,797 311,523 956,744 1,561,846 300,020 4,266 200,620 504,906 1,262,668 239,906 1,502,574 - 1,502,574
(continued)
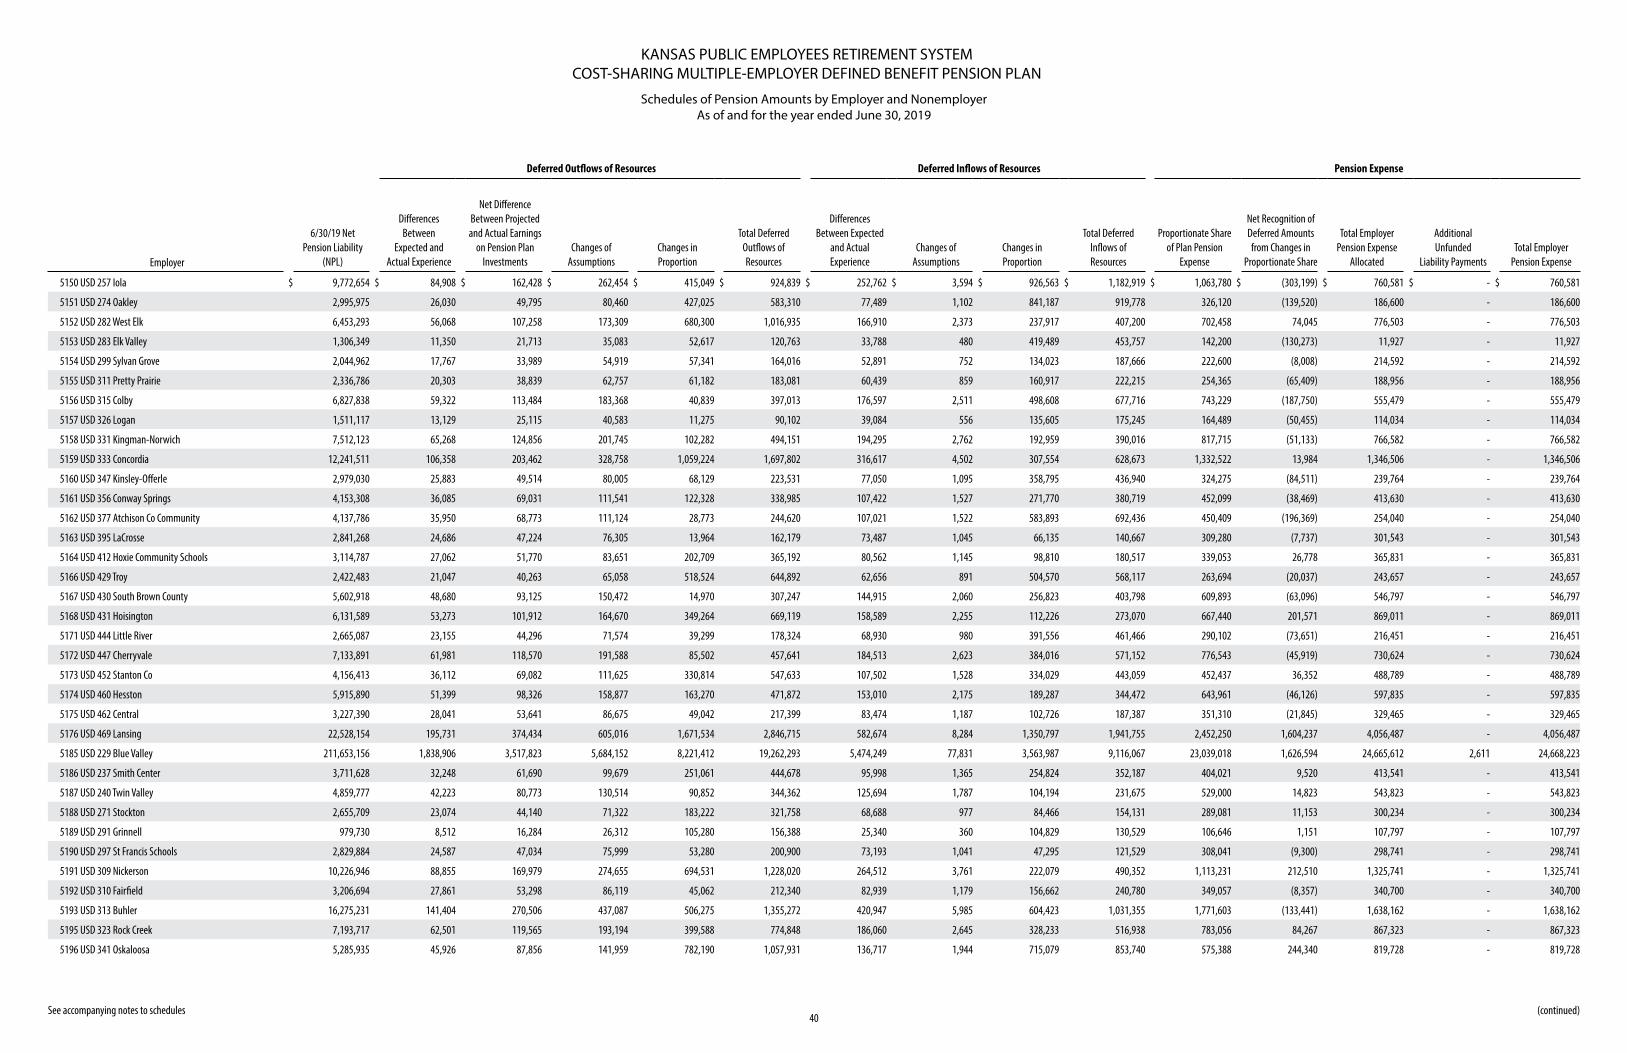
KANSAS PUBLIC EMPLOYEES RETIREMENT SYSTEMCOST-SHARING MULTIPLE-EMPLOYER DEFINED BENEFIT PENSION PLAN
Schedules of Pension Amounts by Employer and NonemployerAs of and for the year ended June 30, 2019
40 See accompanying notes to schedules
Deferred Outflows of Resources Deferred Inflows of Resources Pension Expense
Employer
6/30/19 Net Pension Liability
(NPL)
Differences Between
Expected and Actual Experience
Net Difference Between Projected and Actual Earnings
on Pension Plan Investments
Changes of Assumptions
Changes in Proportion
Total Deferred Outflows of Resources
Differences Between Expected
and Actual Experience
Changes of Assumptions
Changes in Proportion
Total Deferred Inflows of Resources
Proportionate Share of Plan Pension
Expense
Net Recognition of Deferred Amounts from Changes in
Proportionate Share
Total Employer Pension Expense
Allocated
Additional Unfunded
Liability PaymentsTotal Employer
Pension Expense
5150 USD 257 Iola $ 9,772,654 $ 84,908 $ 162,428 $ 262,454 $ 415,049 $ 924,839 $ 252,762 $ 3,594 $ 926,563 $ 1,182,919 $ 1,063,780 $ (303,199) $ 760,581 $ - $ 760,581
5151 USD 274 Oakley 2,995,975 26,030 49,795 80,460 427,025 583,310 77,489 1,102 841,187 919,778 326,120 (139,520) 186,600 - 186,600
5152 USD 282 West Elk 6,453,293 56,068 107,258 173,309 680,300 1,016,935 166,910 2,373 237,917 407,200 702,458 74,045 776,503 - 776,503
5153 USD 283 Elk Valley 1,306,349 11,350 21,713 35,083 52,617 120,763 33,788 480 419,489 453,757 142,200 (130,273) 11,927 - 11,927
5154 USD 299 Sylvan Grove 2,044,962 17,767 33,989 54,919 57,341 164,016 52,891 752 134,023 187,666 222,600 (8,008) 214,592 - 214,592
5155 USD 311 Pretty Prairie 2,336,786 20,303 38,839 62,757 61,182 183,081 60,439 859 160,917 222,215 254,365 (65,409) 188,956 - 188,956
5156 USD 315 Colby 6,827,838 59,322 113,484 183,368 40,839 397,013 176,597 2,511 498,608 677,716 743,229 (187,750) 555,479 - 555,479
5157 USD 326 Logan 1,511,117 13,129 25,115 40,583 11,275 90,102 39,084 556 135,605 175,245 164,489 (50,455) 114,034 - 114,034
5158 USD 331 Kingman-Norwich 7,512,123 65,268 124,856 201,745 102,282 494,151 194,295 2,762 192,959 390,016 817,715 (51,133) 766,582 - 766,582
5159 USD 333 Concordia 12,241,511 106,358 203,462 328,758 1,059,224 1,697,802 316,617 4,502 307,554 628,673 1,332,522 13,984 1,346,506 - 1,346,506
5160 USD 347 Kinsley-Offerle 2,979,030 25,883 49,514 80,005 68,129 223,531 77,050 1,095 358,795 436,940 324,275 (84,511) 239,764 - 239,764
5161 USD 356 Conway Springs 4,153,308 36,085 69,031 111,541 122,328 338,985 107,422 1,527 271,770 380,719 452,099 (38,469) 413,630 - 413,630
5162 USD 377 Atchison Co Community 4,137,786 35,950 68,773 111,124 28,773 244,620 107,021 1,522 583,893 692,436 450,409 (196,369) 254,040 - 254,040
5163 USD 395 LaCrosse 2,841,268 24,686 47,224 76,305 13,964 162,179 73,487 1,045 66,135 140,667 309,280 (7,737) 301,543 - 301,543
5164 USD 412 Hoxie Community Schools 3,114,787 27,062 51,770 83,651 202,709 365,192 80,562 1,145 98,810 180,517 339,053 26,778 365,831 - 365,831
5166 USD 429 Troy 2,422,483 21,047 40,263 65,058 518,524 644,892 62,656 891 504,570 568,117 263,694 (20,037) 243,657 - 243,657
5167 USD 430 South Brown County 5,602,918 48,680 93,125 150,472 14,970 307,247 144,915 2,060 256,823 403,798 609,893 (63,096) 546,797 - 546,797
5168 USD 431 Hoisington 6,131,589 53,273 101,912 164,670 349,264 669,119 158,589 2,255 112,226 273,070 667,440 201,571 869,011 - 869,011
5171 USD 444 Little River 2,665,087 23,155 44,296 71,574 39,299 178,324 68,930 980 391,556 461,466 290,102 (73,651) 216,451 - 216,451
5172 USD 447 Cherryvale 7,133,891 61,981 118,570 191,588 85,502 457,641 184,513 2,623 384,016 571,152 776,543 (45,919) 730,624 - 730,624
5173 USD 452 Stanton Co 4,156,413 36,112 69,082 111,625 330,814 547,633 107,502 1,528 334,029 443,059 452,437 36,352 488,789 - 488,789
5174 USD 460 Hesston 5,915,890 51,399 98,326 158,877 163,270 471,872 153,010 2,175 189,287 344,472 643,961 (46,126) 597,835 - 597,835
5175 USD 462 Central 3,227,390 28,041 53,641 86,675 49,042 217,399 83,474 1,187 102,726 187,387 351,310 (21,845) 329,465 - 329,465
5176 USD 469 Lansing 22,528,154 195,731 374,434 605,016 1,671,534 2,846,715 582,674 8,284 1,350,797 1,941,755 2,452,250 1,604,237 4,056,487 - 4,056,487
5185 USD 229 Blue Valley 211,653,156 1,838,906 3,517,823 5,684,152 8,221,412 19,262,293 5,474,249 77,831 3,563,987 9,116,067 23,039,018 1,626,594 24,665,612 2,611 24,668,223
5186 USD 237 Smith Center 3,711,628 32,248 61,690 99,679 251,061 444,678 95,998 1,365 254,824 352,187 404,021 9,520 413,541 - 413,541
5187 USD 240 Twin Valley 4,859,777 42,223 80,773 130,514 90,852 344,362 125,694 1,787 104,194 231,675 529,000 14,823 543,823 - 543,823
5188 USD 271 Stockton 2,655,709 23,074 44,140 71,322 183,222 321,758 68,688 977 84,466 154,131 289,081 11,153 300,234 - 300,234
5189 USD 291 Grinnell 979,730 8,512 16,284 26,312 105,280 156,388 25,340 360 104,829 130,529 106,646 1,151 107,797 - 107,797
5190 USD 297 St Francis Schools 2,829,884 24,587 47,034 75,999 53,280 200,900 73,193 1,041 47,295 121,529 308,041 (9,300) 298,741 - 298,741
5191 USD 309 Nickerson 10,226,946 88,855 169,979 274,655 694,531 1,228,020 264,512 3,761 222,079 490,352 1,113,231 212,510 1,325,741 - 1,325,741
5192 USD 310 Fairfield 3,206,694 27,861 53,298 86,119 45,062 212,340 82,939 1,179 156,662 240,780 349,057 (8,357) 340,700 - 340,700
5193 USD 313 Buhler 16,275,231 141,404 270,506 437,087 506,275 1,355,272 420,947 5,985 604,423 1,031,355 1,771,603 (133,441) 1,638,162 - 1,638,162
5195 USD 323 Rock Creek 7,193,717 62,501 119,565 193,194 399,588 774,848 186,060 2,645 328,233 516,938 783,056 84,267 867,323 - 867,323
5196 USD 341 Oskaloosa 5,285,935 45,926 87,856 141,959 782,190 1,057,931 136,717 1,944 715,079 853,740 575,388 244,340 819,728 - 819,728
(continued)
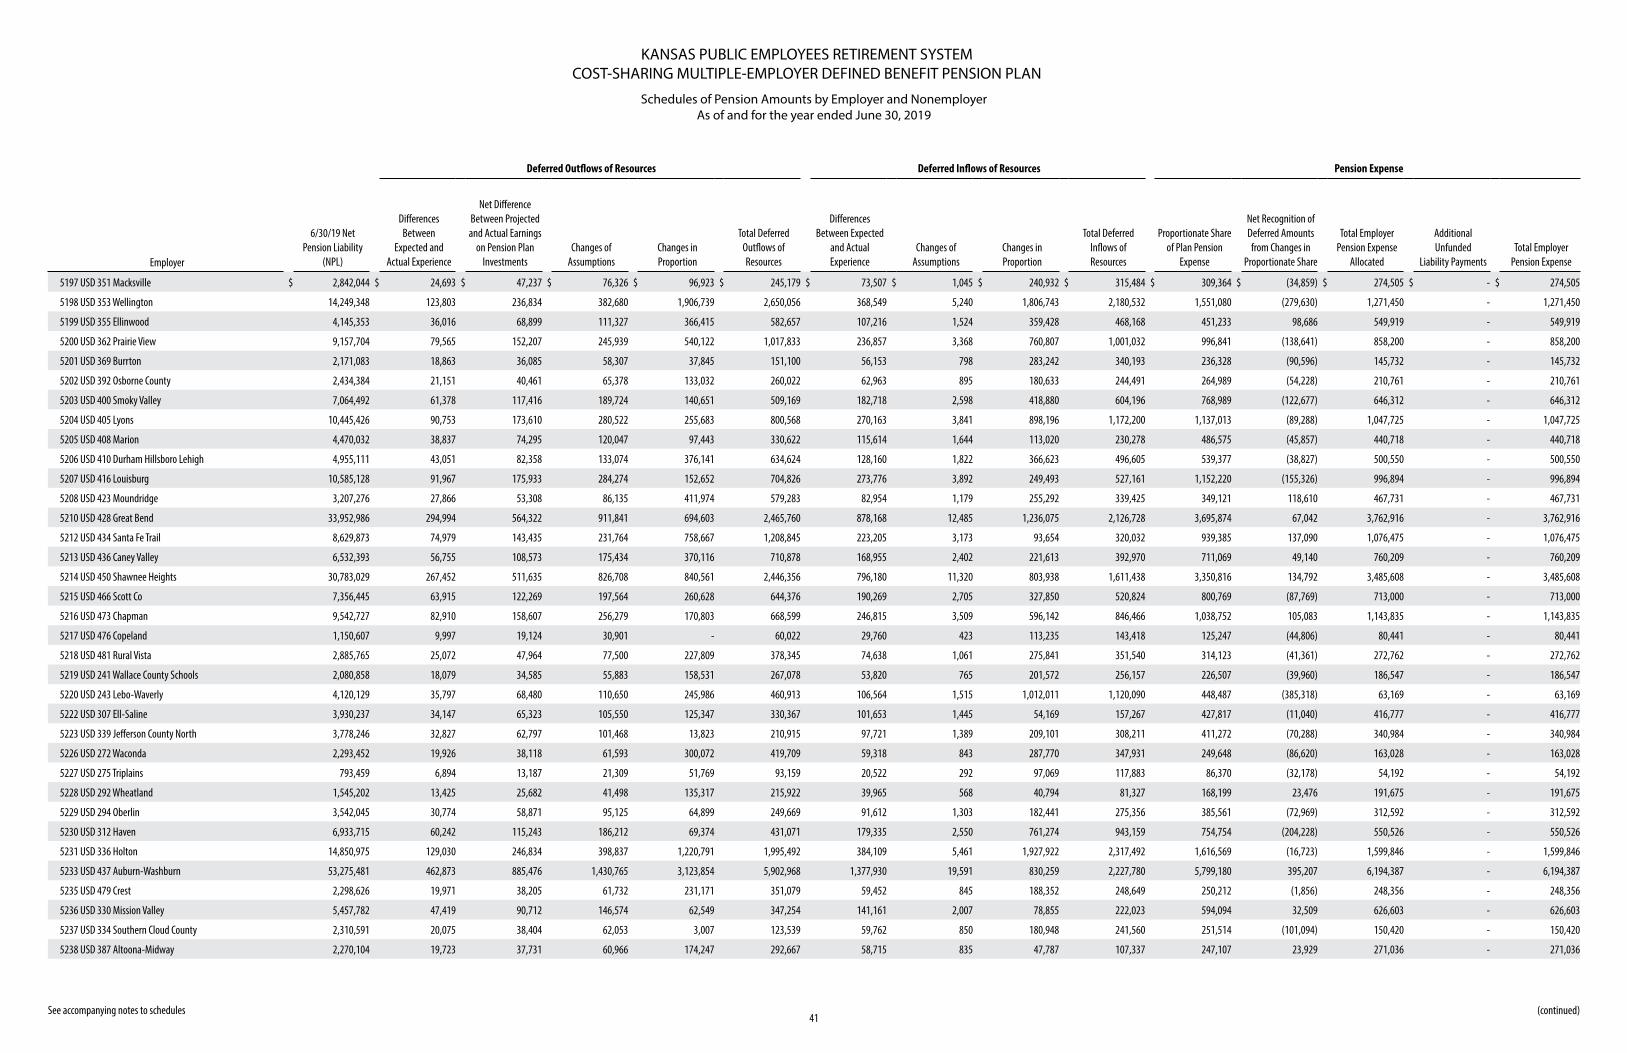
KANSAS PUBLIC EMPLOYEES RETIREMENT SYSTEMCOST-SHARING MULTIPLE-EMPLOYER DEFINED BENEFIT PENSION PLAN
Schedules of Pension Amounts by Employer and NonemployerAs of and for the year ended June 30, 2019
41 See accompanying notes to schedules
Deferred Outflows of Resources Deferred Inflows of Resources Pension Expense
Employer
6/30/19 Net Pension Liability
(NPL)
Differences Between
Expected and Actual Experience
Net Difference Between Projected and Actual Earnings
on Pension Plan Investments
Changes of Assumptions
Changes in Proportion
Total Deferred Outflows of Resources
Differences Between Expected
and Actual Experience
Changes of Assumptions
Changes in Proportion
Total Deferred Inflows of Resources
Proportionate Share of Plan Pension
Expense
Net Recognition of Deferred Amounts from Changes in
Proportionate Share
Total Employer Pension Expense
Allocated
Additional Unfunded
Liability PaymentsTotal Employer
Pension Expense
5197 USD 351 Macksville $ 2,842,044 $ 24,693 $ 47,237 $ 76,326 $ 96,923 $ 245,179 $ 73,507 $ 1,045 $ 240,932 $ 315,484 $ 309,364 $ (34,859) $ 274,505 $ - $ 274,505
5198 USD 353 Wellington 14,249,348 123,803 236,834 382,680 1,906,739 2,650,056 368,549 5,240 1,806,743 2,180,532 1,551,080 (279,630) 1,271,450 - 1,271,450
5199 USD 355 Ellinwood 4,145,353 36,016 68,899 111,327 366,415 582,657 107,216 1,524 359,428 468,168 451,233 98,686 549,919 - 549,919
5200 USD 362 Prairie View 9,157,704 79,565 152,207 245,939 540,122 1,017,833 236,857 3,368 760,807 1,001,032 996,841 (138,641) 858,200 - 858,200
5201 USD 369 Burrton 2,171,083 18,863 36,085 58,307 37,845 151,100 56,153 798 283,242 340,193 236,328 (90,596) 145,732 - 145,732
5202 USD 392 Osborne County 2,434,384 21,151 40,461 65,378 133,032 260,022 62,963 895 180,633 244,491 264,989 (54,228) 210,761 - 210,761
5203 USD 400 Smoky Valley 7,064,492 61,378 117,416 189,724 140,651 509,169 182,718 2,598 418,880 604,196 768,989 (122,677) 646,312 - 646,312
5204 USD 405 Lyons 10,445,426 90,753 173,610 280,522 255,683 800,568 270,163 3,841 898,196 1,172,200 1,137,013 (89,288) 1,047,725 - 1,047,725
5205 USD 408 Marion 4,470,032 38,837 74,295 120,047 97,443 330,622 115,614 1,644 113,020 230,278 486,575 (45,857) 440,718 - 440,718
5206 USD 410 Durham Hillsboro Lehigh 4,955,111 43,051 82,358 133,074 376,141 634,624 128,160 1,822 366,623 496,605 539,377 (38,827) 500,550 - 500,550
5207 USD 416 Louisburg 10,585,128 91,967 175,933 284,274 152,652 704,826 273,776 3,892 249,493 527,161 1,152,220 (155,326) 996,894 - 996,894
5208 USD 423 Moundridge 3,207,276 27,866 53,308 86,135 411,974 579,283 82,954 1,179 255,292 339,425 349,121 118,610 467,731 - 467,731
5210 USD 428 Great Bend 33,952,986 294,994 564,322 911,841 694,603 2,465,760 878,168 12,485 1,236,075 2,126,728 3,695,874 67,042 3,762,916 - 3,762,916
5212 USD 434 Santa Fe Trail 8,629,873 74,979 143,435 231,764 758,667 1,208,845 223,205 3,173 93,654 320,032 939,385 137,090 1,076,475 - 1,076,475
5213 USD 436 Caney Valley 6,532,393 56,755 108,573 175,434 370,116 710,878 168,955 2,402 221,613 392,970 711,069 49,140 760,209 - 760,209
5214 USD 450 Shawnee Heights 30,783,029 267,452 511,635 826,708 840,561 2,446,356 796,180 11,320 803,938 1,611,438 3,350,816 134,792 3,485,608 - 3,485,608
5215 USD 466 Scott Co 7,356,445 63,915 122,269 197,564 260,628 644,376 190,269 2,705 327,850 520,824 800,769 (87,769) 713,000 - 713,000
5216 USD 473 Chapman 9,542,727 82,910 158,607 256,279 170,803 668,599 246,815 3,509 596,142 846,466 1,038,752 105,083 1,143,835 - 1,143,835
5217 USD 476 Copeland 1,150,607 9,997 19,124 30,901 - 60,022 29,760 423 113,235 143,418 125,247 (44,806) 80,441 - 80,441
5218 USD 481 Rural Vista 2,885,765 25,072 47,964 77,500 227,809 378,345 74,638 1,061 275,841 351,540 314,123 (41,361) 272,762 - 272,762
5219 USD 241 Wallace County Schools 2,080,858 18,079 34,585 55,883 158,531 267,078 53,820 765 201,572 256,157 226,507 (39,960) 186,547 - 186,547
5220 USD 243 Lebo-Waverly 4,120,129 35,797 68,480 110,650 245,986 460,913 106,564 1,515 1,012,011 1,120,090 448,487 (385,318) 63,169 - 63,169
5222 USD 307 Ell-Saline 3,930,237 34,147 65,323 105,550 125,347 330,367 101,653 1,445 54,169 157,267 427,817 (11,040) 416,777 - 416,777
5223 USD 339 Jefferson County North 3,778,246 32,827 62,797 101,468 13,823 210,915 97,721 1,389 209,101 308,211 411,272 (70,288) 340,984 - 340,984
5226 USD 272 Waconda 2,293,452 19,926 38,118 61,593 300,072 419,709 59,318 843 287,770 347,931 249,648 (86,620) 163,028 - 163,028
5227 USD 275 Triplains 793,459 6,894 13,187 21,309 51,769 93,159 20,522 292 97,069 117,883 86,370 (32,178) 54,192 - 54,192
5228 USD 292 Wheatland 1,545,202 13,425 25,682 41,498 135,317 215,922 39,965 568 40,794 81,327 168,199 23,476 191,675 - 191,675
5229 USD 294 Oberlin 3,542,045 30,774 58,871 95,125 64,899 249,669 91,612 1,303 182,441 275,356 385,561 (72,969) 312,592 - 312,592
5230 USD 312 Haven 6,933,715 60,242 115,243 186,212 69,374 431,071 179,335 2,550 761,274 943,159 754,754 (204,228) 550,526 - 550,526
5231 USD 336 Holton 14,850,975 129,030 246,834 398,837 1,220,791 1,995,492 384,109 5,461 1,927,922 2,317,492 1,616,569 (16,723) 1,599,846 - 1,599,846
5233 USD 437 Auburn-Washburn 53,275,481 462,873 885,476 1,430,765 3,123,854 5,902,968 1,377,930 19,591 830,259 2,227,780 5,799,180 395,207 6,194,387 - 6,194,387
5235 USD 479 Crest 2,298,626 19,971 38,205 61,732 231,171 351,079 59,452 845 188,352 248,649 250,212 (1,856) 248,356 - 248,356
5236 USD 330 Mission Valley 5,457,782 47,419 90,712 146,574 62,549 347,254 141,161 2,007 78,855 222,023 594,094 32,509 626,603 - 626,603
5237 USD 334 Southern Cloud County 2,310,591 20,075 38,404 62,053 3,007 123,539 59,762 850 180,948 241,560 251,514 (101,094) 150,420 - 150,420
5238 USD 387 Altoona-Midway 2,270,104 19,723 37,731 60,966 174,247 292,667 58,715 835 47,787 107,337 247,107 23,929 271,036 - 271,036
(continued)
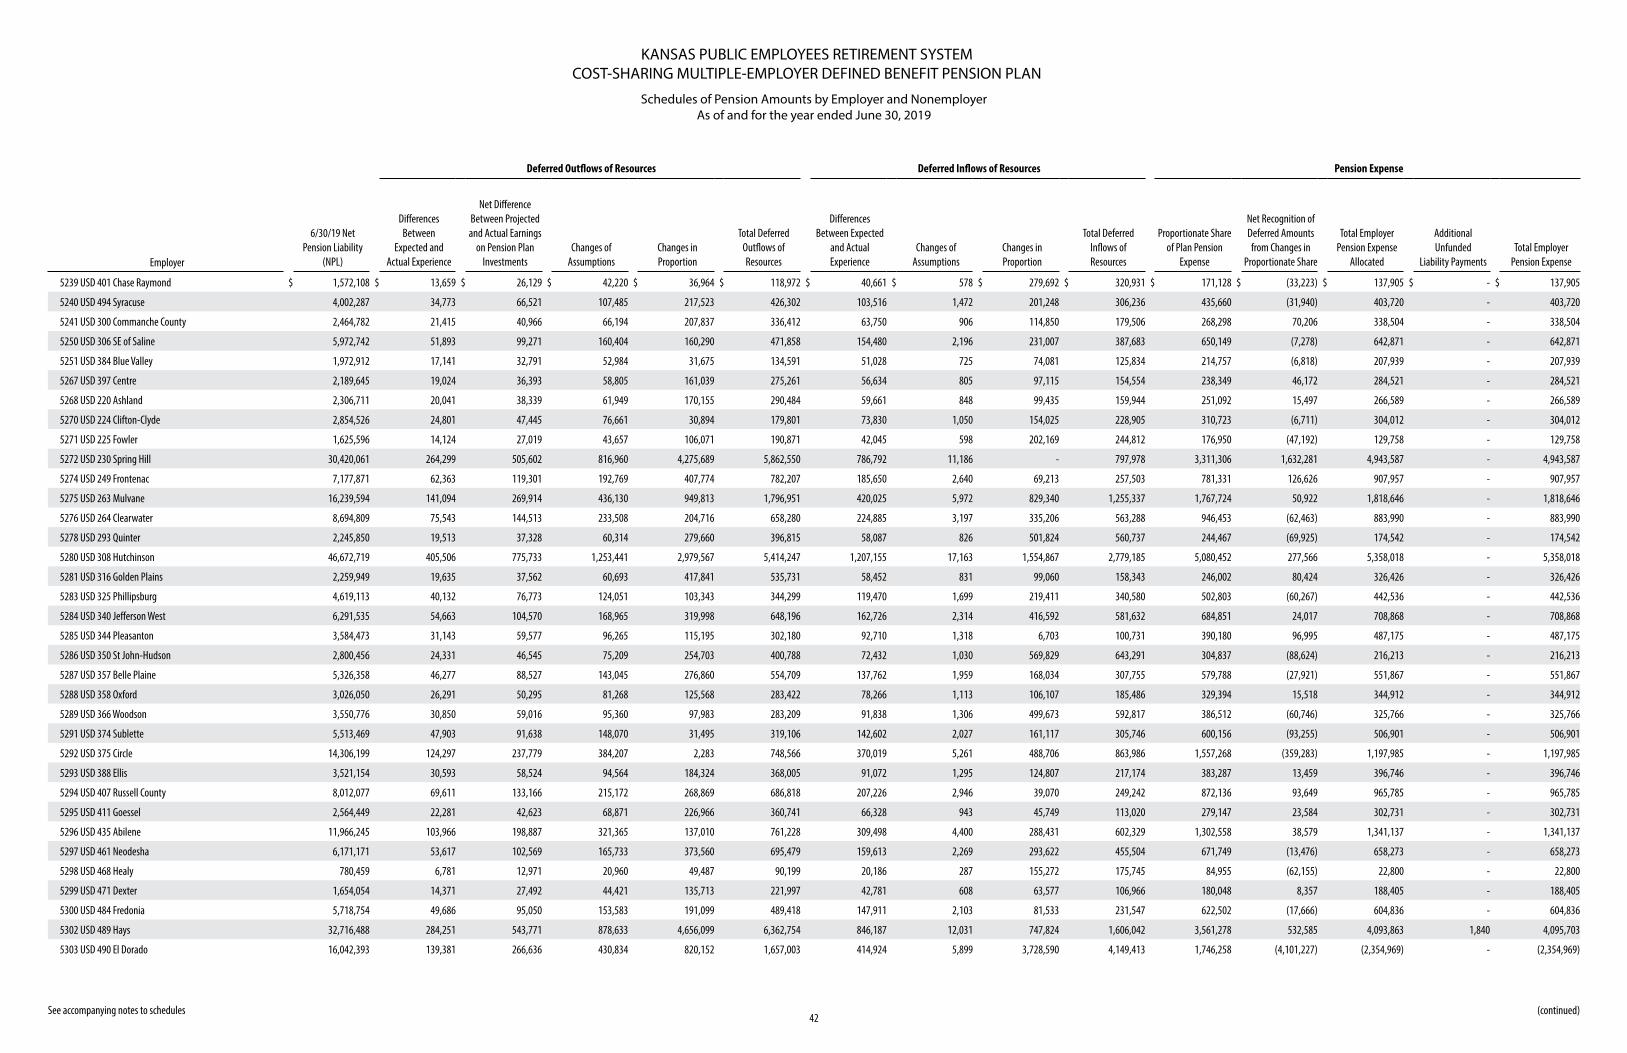
KANSAS PUBLIC EMPLOYEES RETIREMENT SYSTEMCOST-SHARING MULTIPLE-EMPLOYER DEFINED BENEFIT PENSION PLAN
Schedules of Pension Amounts by Employer and NonemployerAs of and for the year ended June 30, 2019
42 See accompanying notes to schedules
Deferred Outflows of Resources Deferred Inflows of Resources Pension Expense
Employer
6/30/19 Net Pension Liability
(NPL)
Differences Between
Expected and Actual Experience
Net Difference Between Projected and Actual Earnings
on Pension Plan Investments
Changes of Assumptions
Changes in Proportion
Total Deferred Outflows of Resources
Differences Between Expected
and Actual Experience
Changes of Assumptions
Changes in Proportion
Total Deferred Inflows of Resources
Proportionate Share of Plan Pension
Expense
Net Recognition of Deferred Amounts from Changes in
Proportionate Share
Total Employer Pension Expense
Allocated
Additional Unfunded
Liability PaymentsTotal Employer
Pension Expense
5239 USD 401 Chase Raymond $ 1,572,108 $ 13,659 $ 26,129 $ 42,220 $ 36,964 $ 118,972 $ 40,661 $ 578 $ 279,692 $ 320,931 $ 171,128 $ (33,223) $ 137,905 $ - $ 137,905
5240 USD 494 Syracuse 4,002,287 34,773 66,521 107,485 217,523 426,302 103,516 1,472 201,248 306,236 435,660 (31,940) 403,720 - 403,720
5241 USD 300 Commanche County 2,464,782 21,415 40,966 66,194 207,837 336,412 63,750 906 114,850 179,506 268,298 70,206 338,504 - 338,504
5250 USD 306 SE of Saline 5,972,742 51,893 99,271 160,404 160,290 471,858 154,480 2,196 231,007 387,683 650,149 (7,278) 642,871 - 642,871
5251 USD 384 Blue Valley 1,972,912 17,141 32,791 52,984 31,675 134,591 51,028 725 74,081 125,834 214,757 (6,818) 207,939 - 207,939
5267 USD 397 Centre 2,189,645 19,024 36,393 58,805 161,039 275,261 56,634 805 97,115 154,554 238,349 46,172 284,521 - 284,521
5268 USD 220 Ashland 2,306,711 20,041 38,339 61,949 170,155 290,484 59,661 848 99,435 159,944 251,092 15,497 266,589 - 266,589
5270 USD 224 Clifton-Clyde 2,854,526 24,801 47,445 76,661 30,894 179,801 73,830 1,050 154,025 228,905 310,723 (6,711) 304,012 - 304,012
5271 USD 225 Fowler 1,625,596 14,124 27,019 43,657 106,071 190,871 42,045 598 202,169 244,812 176,950 (47,192) 129,758 - 129,758
5272 USD 230 Spring Hill 30,420,061 264,299 505,602 816,960 4,275,689 5,862,550 786,792 11,186 - 797,978 3,311,306 1,632,281 4,943,587 - 4,943,587
5274 USD 249 Frontenac 7,177,871 62,363 119,301 192,769 407,774 782,207 185,650 2,640 69,213 257,503 781,331 126,626 907,957 - 907,957
5275 USD 263 Mulvane 16,239,594 141,094 269,914 436,130 949,813 1,796,951 420,025 5,972 829,340 1,255,337 1,767,724 50,922 1,818,646 - 1,818,646
5276 USD 264 Clearwater 8,694,809 75,543 144,513 233,508 204,716 658,280 224,885 3,197 335,206 563,288 946,453 (62,463) 883,990 - 883,990
5278 USD 293 Quinter 2,245,850 19,513 37,328 60,314 279,660 396,815 58,087 826 501,824 560,737 244,467 (69,925) 174,542 - 174,542
5280 USD 308 Hutchinson 46,672,719 405,506 775,733 1,253,441 2,979,567 5,414,247 1,207,155 17,163 1,554,867 2,779,185 5,080,452 277,566 5,358,018 - 5,358,018
5281 USD 316 Golden Plains 2,259,949 19,635 37,562 60,693 417,841 535,731 58,452 831 99,060 158,343 246,002 80,424 326,426 - 326,426
5283 USD 325 Phillipsburg 4,619,113 40,132 76,773 124,051 103,343 344,299 119,470 1,699 219,411 340,580 502,803 (60,267) 442,536 - 442,536
5284 USD 340 Jefferson West 6,291,535 54,663 104,570 168,965 319,998 648,196 162,726 2,314 416,592 581,632 684,851 24,017 708,868 - 708,868
5285 USD 344 Pleasanton 3,584,473 31,143 59,577 96,265 115,195 302,180 92,710 1,318 6,703 100,731 390,180 96,995 487,175 - 487,175
5286 USD 350 St John-Hudson 2,800,456 24,331 46,545 75,209 254,703 400,788 72,432 1,030 569,829 643,291 304,837 (88,624) 216,213 - 216,213
5287 USD 357 Belle Plaine 5,326,358 46,277 88,527 143,045 276,860 554,709 137,762 1,959 168,034 307,755 579,788 (27,921) 551,867 - 551,867
5288 USD 358 Oxford 3,026,050 26,291 50,295 81,268 125,568 283,422 78,266 1,113 106,107 185,486 329,394 15,518 344,912 - 344,912
5289 USD 366 Woodson 3,550,776 30,850 59,016 95,360 97,983 283,209 91,838 1,306 499,673 592,817 386,512 (60,746) 325,766 - 325,766
5291 USD 374 Sublette 5,513,469 47,903 91,638 148,070 31,495 319,106 142,602 2,027 161,117 305,746 600,156 (93,255) 506,901 - 506,901
5292 USD 375 Circle 14,306,199 124,297 237,779 384,207 2,283 748,566 370,019 5,261 488,706 863,986 1,557,268 (359,283) 1,197,985 - 1,197,985
5293 USD 388 Ellis 3,521,154 30,593 58,524 94,564 184,324 368,005 91,072 1,295 124,807 217,174 383,287 13,459 396,746 - 396,746
5294 USD 407 Russell County 8,012,077 69,611 133,166 215,172 268,869 686,818 207,226 2,946 39,070 249,242 872,136 93,649 965,785 - 965,785
5295 USD 411 Goessel 2,564,449 22,281 42,623 68,871 226,966 360,741 66,328 943 45,749 113,020 279,147 23,584 302,731 - 302,731
5296 USD 435 Abilene 11,966,245 103,966 198,887 321,365 137,010 761,228 309,498 4,400 288,431 602,329 1,302,558 38,579 1,341,137 - 1,341,137
5297 USD 461 Neodesha 6,171,171 53,617 102,569 165,733 373,560 695,479 159,613 2,269 293,622 455,504 671,749 (13,476) 658,273 - 658,273
5298 USD 468 Healy 780,459 6,781 12,971 20,960 49,487 90,199 20,186 287 155,272 175,745 84,955 (62,155) 22,800 - 22,800
5299 USD 471 Dexter 1,654,054 14,371 27,492 44,421 135,713 221,997 42,781 608 63,577 106,966 180,048 8,357 188,405 - 188,405
5300 USD 484 Fredonia 5,718,754 49,686 95,050 153,583 191,099 489,418 147,911 2,103 81,533 231,547 622,502 (17,666) 604,836 - 604,836
5302 USD 489 Hays 32,716,488 284,251 543,771 878,633 4,656,099 6,362,754 846,187 12,031 747,824 1,606,042 3,561,278 532,585 4,093,863 1,840 4,095,703
5303 USD 490 El Dorado 16,042,393 139,381 266,636 430,834 820,152 1,657,003 414,924 5,899 3,728,590 4,149,413 1,746,258 (4,101,227) (2,354,969) - (2,354,969)
(continued)
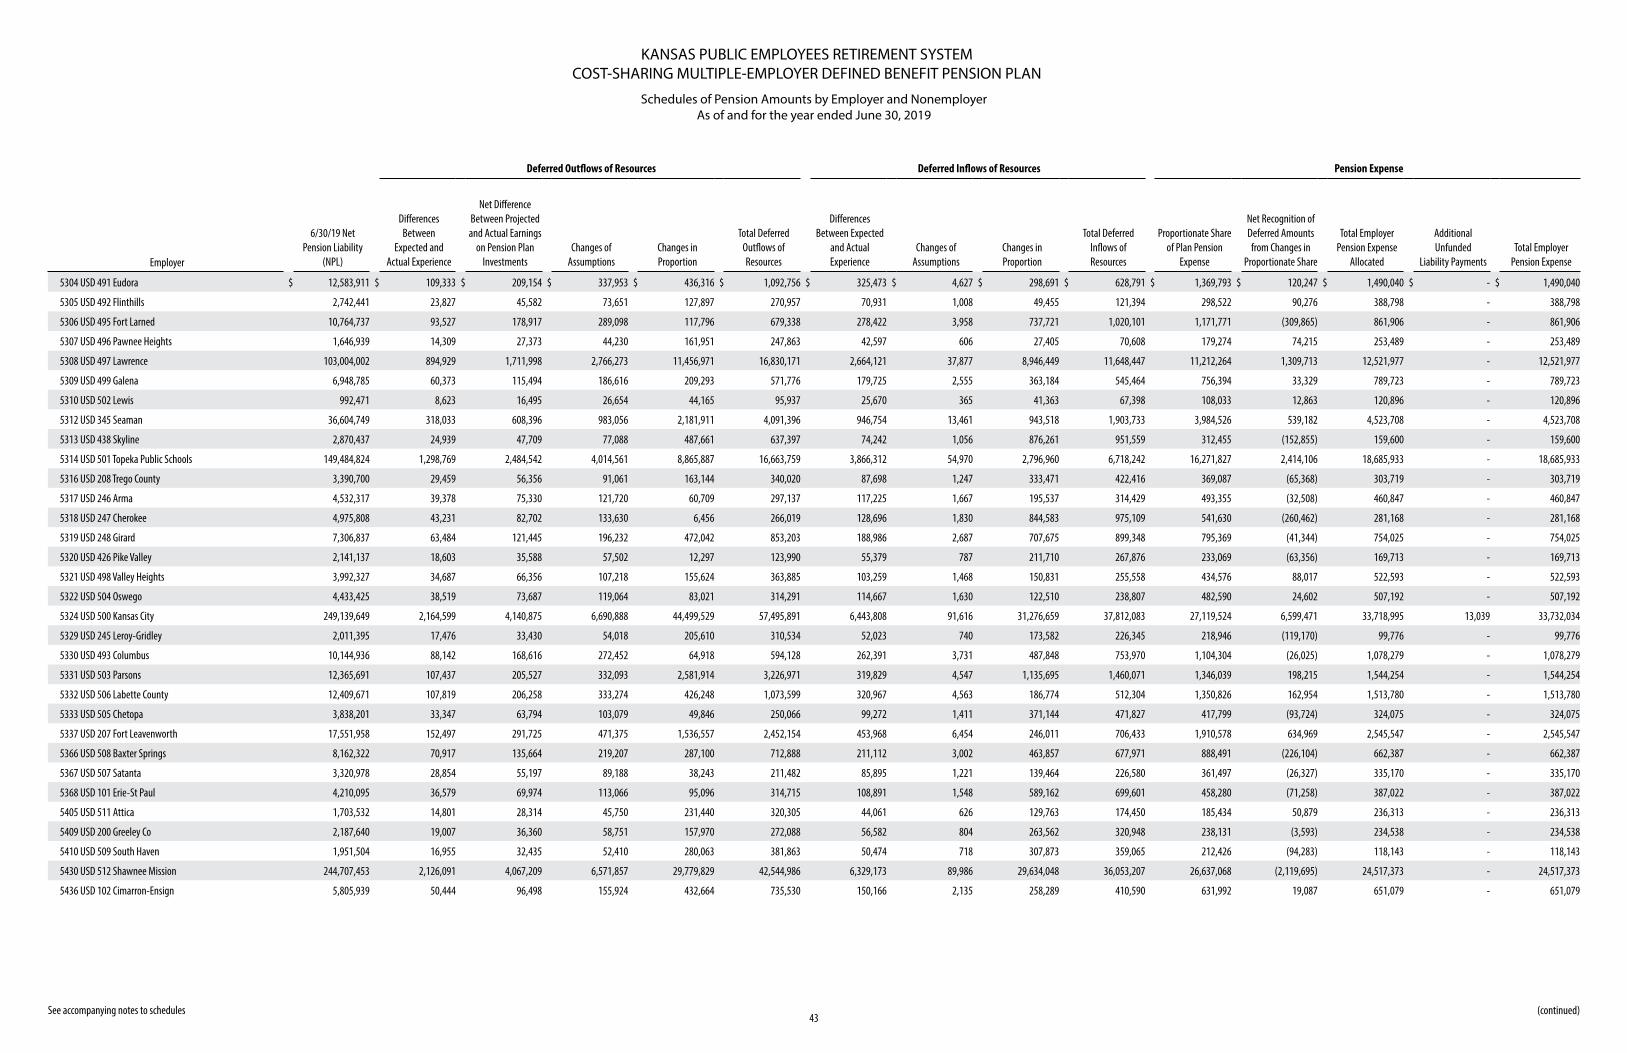
KANSAS PUBLIC EMPLOYEES RETIREMENT SYSTEMCOST-SHARING MULTIPLE-EMPLOYER DEFINED BENEFIT PENSION PLAN
Schedules of Pension Amounts by Employer and NonemployerAs of and for the year ended June 30, 2019
43 See accompanying notes to schedules
Deferred Outflows of Resources Deferred Inflows of Resources Pension Expense
Employer
6/30/19 Net Pension Liability
(NPL)
Differences Between
Expected and Actual Experience
Net Difference Between Projected and Actual Earnings
on Pension Plan Investments
Changes of Assumptions
Changes in Proportion
Total Deferred Outflows of Resources
Differences Between Expected
and Actual Experience
Changes of Assumptions
Changes in Proportion
Total Deferred Inflows of Resources
Proportionate Share of Plan Pension
Expense
Net Recognition of Deferred Amounts from Changes in
Proportionate Share
Total Employer Pension Expense
Allocated
Additional Unfunded
Liability PaymentsTotal Employer
Pension Expense
5304 USD 491 Eudora $ 12,583,911 $ 109,333 $ 209,154 $ 337,953 $ 436,316 $ 1,092,756 $ 325,473 $ 4,627 $ 298,691 $ 628,791 $ 1,369,793 $ 120,247 $ 1,490,040 $ - $ 1,490,040
5305 USD 492 Flinthills 2,742,441 23,827 45,582 73,651 127,897 270,957 70,931 1,008 49,455 121,394 298,522 90,276 388,798 - 388,798
5306 USD 495 Fort Larned 10,764,737 93,527 178,917 289,098 117,796 679,338 278,422 3,958 737,721 1,020,101 1,171,771 (309,865) 861,906 - 861,906
5307 USD 496 Pawnee Heights 1,646,939 14,309 27,373 44,230 161,951 247,863 42,597 606 27,405 70,608 179,274 74,215 253,489 - 253,489
5308 USD 497 Lawrence 103,004,002 894,929 1,711,998 2,766,273 11,456,971 16,830,171 2,664,121 37,877 8,946,449 11,648,447 11,212,264 1,309,713 12,521,977 - 12,521,977
5309 USD 499 Galena 6,948,785 60,373 115,494 186,616 209,293 571,776 179,725 2,555 363,184 545,464 756,394 33,329 789,723 - 789,723
5310 USD 502 Lewis 992,471 8,623 16,495 26,654 44,165 95,937 25,670 365 41,363 67,398 108,033 12,863 120,896 - 120,896
5312 USD 345 Seaman 36,604,749 318,033 608,396 983,056 2,181,911 4,091,396 946,754 13,461 943,518 1,903,733 3,984,526 539,182 4,523,708 - 4,523,708
5313 USD 438 Skyline 2,870,437 24,939 47,709 77,088 487,661 637,397 74,242 1,056 876,261 951,559 312,455 (152,855) 159,600 - 159,600
5314 USD 501 Topeka Public Schools 149,484,824 1,298,769 2,484,542 4,014,561 8,865,887 16,663,759 3,866,312 54,970 2,796,960 6,718,242 16,271,827 2,414,106 18,685,933 - 18,685,933
5316 USD 208 Trego County 3,390,700 29,459 56,356 91,061 163,144 340,020 87,698 1,247 333,471 422,416 369,087 (65,368) 303,719 - 303,719
5317 USD 246 Arma 4,532,317 39,378 75,330 121,720 60,709 297,137 117,225 1,667 195,537 314,429 493,355 (32,508) 460,847 - 460,847
5318 USD 247 Cherokee 4,975,808 43,231 82,702 133,630 6,456 266,019 128,696 1,830 844,583 975,109 541,630 (260,462) 281,168 - 281,168
5319 USD 248 Girard 7,306,837 63,484 121,445 196,232 472,042 853,203 188,986 2,687 707,675 899,348 795,369 (41,344) 754,025 - 754,025
5320 USD 426 Pike Valley 2,141,137 18,603 35,588 57,502 12,297 123,990 55,379 787 211,710 267,876 233,069 (63,356) 169,713 - 169,713
5321 USD 498 Valley Heights 3,992,327 34,687 66,356 107,218 155,624 363,885 103,259 1,468 150,831 255,558 434,576 88,017 522,593 - 522,593
5322 USD 504 Oswego 4,433,425 38,519 73,687 119,064 83,021 314,291 114,667 1,630 122,510 238,807 482,590 24,602 507,192 - 507,192
5324 USD 500 Kansas City 249,139,649 2,164,599 4,140,875 6,690,888 44,499,529 57,495,891 6,443,808 91,616 31,276,659 37,812,083 27,119,524 6,599,471 33,718,995 13,039 33,732,034
5329 USD 245 Leroy-Gridley 2,011,395 17,476 33,430 54,018 205,610 310,534 52,023 740 173,582 226,345 218,946 (119,170) 99,776 - 99,776
5330 USD 493 Columbus 10,144,936 88,142 168,616 272,452 64,918 594,128 262,391 3,731 487,848 753,970 1,104,304 (26,025) 1,078,279 - 1,078,279
5331 USD 503 Parsons 12,365,691 107,437 205,527 332,093 2,581,914 3,226,971 319,829 4,547 1,135,695 1,460,071 1,346,039 198,215 1,544,254 - 1,544,254
5332 USD 506 Labette County 12,409,671 107,819 206,258 333,274 426,248 1,073,599 320,967 4,563 186,774 512,304 1,350,826 162,954 1,513,780 - 1,513,780
5333 USD 505 Chetopa 3,838,201 33,347 63,794 103,079 49,846 250,066 99,272 1,411 371,144 471,827 417,799 (93,724) 324,075 - 324,075
5337 USD 207 Fort Leavenworth 17,551,958 152,497 291,725 471,375 1,536,557 2,452,154 453,968 6,454 246,011 706,433 1,910,578 634,969 2,545,547 - 2,545,547
5366 USD 508 Baxter Springs 8,162,322 70,917 135,664 219,207 287,100 712,888 211,112 3,002 463,857 677,971 888,491 (226,104) 662,387 - 662,387
5367 USD 507 Satanta 3,320,978 28,854 55,197 89,188 38,243 211,482 85,895 1,221 139,464 226,580 361,497 (26,327) 335,170 - 335,170
5368 USD 101 Erie-St Paul 4,210,095 36,579 69,974 113,066 95,096 314,715 108,891 1,548 589,162 699,601 458,280 (71,258) 387,022 - 387,022
5405 USD 511 Attica 1,703,532 14,801 28,314 45,750 231,440 320,305 44,061 626 129,763 174,450 185,434 50,879 236,313 - 236,313
5409 USD 200 Greeley Co 2,187,640 19,007 36,360 58,751 157,970 272,088 56,582 804 263,562 320,948 238,131 (3,593) 234,538 - 234,538
5410 USD 509 South Haven 1,951,504 16,955 32,435 52,410 280,063 381,863 50,474 718 307,873 359,065 212,426 (94,283) 118,143 - 118,143
5430 USD 512 Shawnee Mission 244,707,453 2,126,091 4,067,209 6,571,857 29,779,829 42,544,986 6,329,173 89,986 29,634,048 36,053,207 26,637,068 (2,119,695) 24,517,373 - 24,517,373
5436 USD 102 Cimarron-Ensign 5,805,939 50,444 96,498 155,924 432,664 735,530 150,166 2,135 258,289 410,590 631,992 19,087 651,079 - 651,079
(continued)
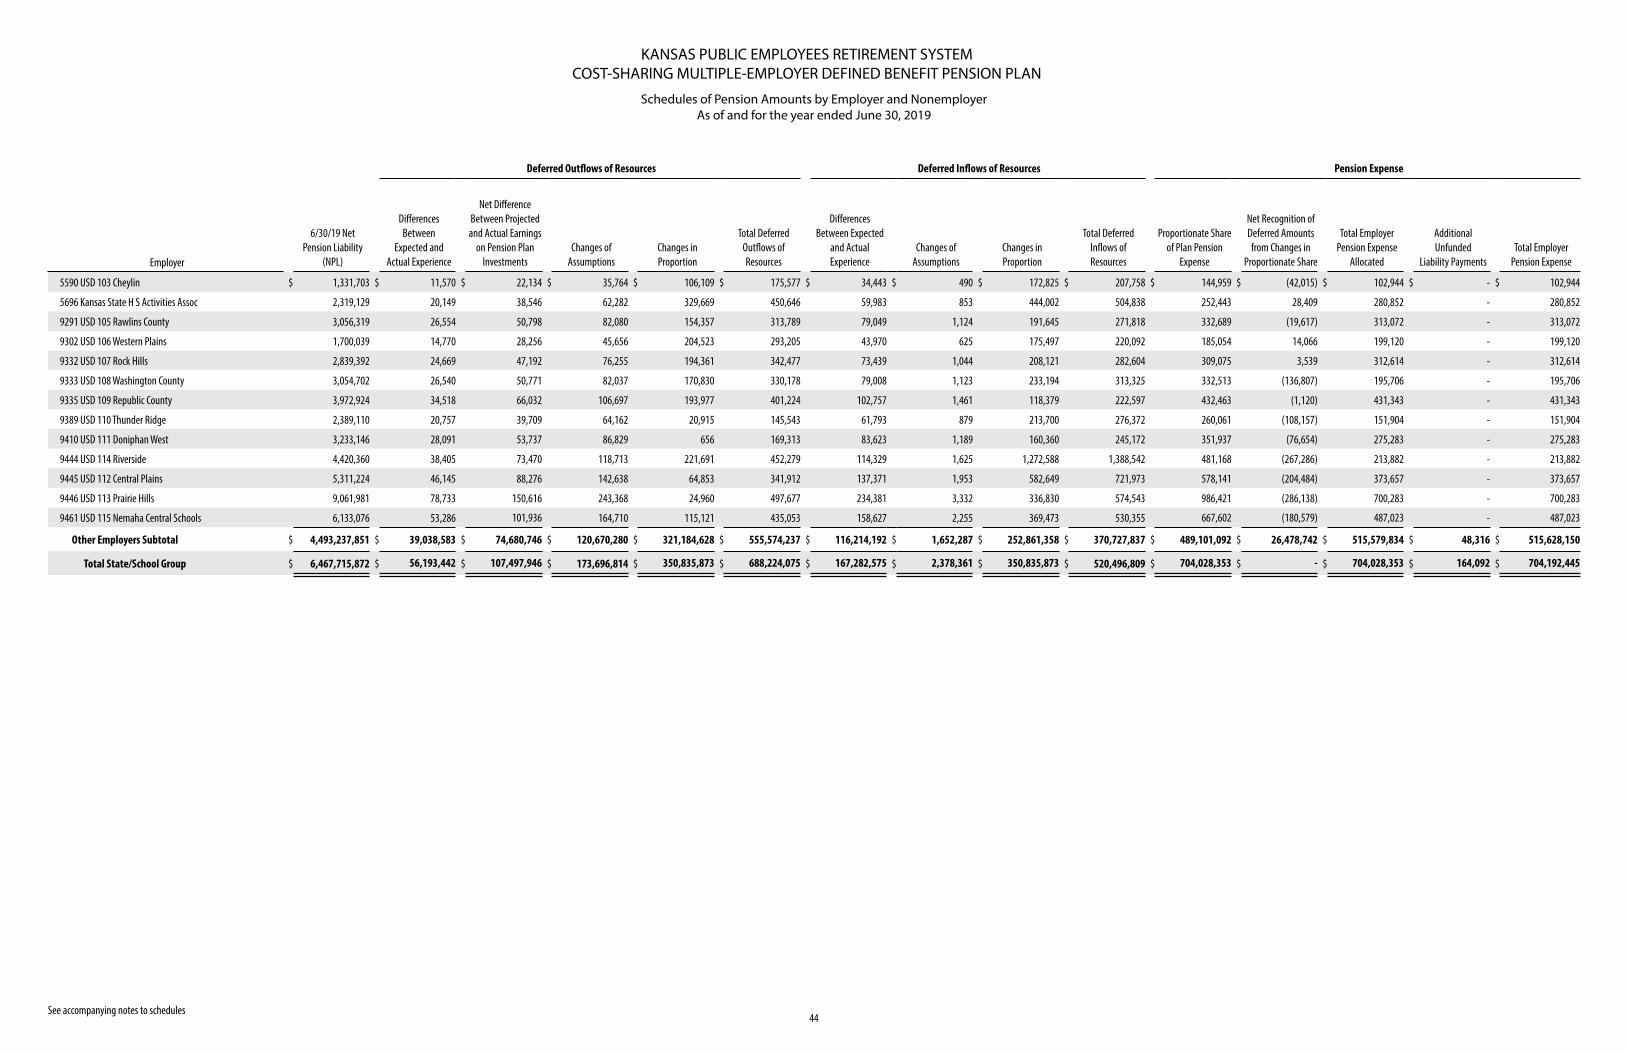
KANSAS PUBLIC EMPLOYEES RETIREMENT SYSTEMCOST-SHARING MULTIPLE-EMPLOYER DEFINED BENEFIT PENSION PLAN
Schedules of Pension Amounts by Employer and NonemployerAs of and for the year ended June 30, 2019
44 See accompanying notes to schedules
Deferred Outflows of Resources Deferred Inflows of Resources Pension Expense
Employer
6/30/19 Net Pension Liability
(NPL)
Differences Between
Expected and Actual Experience
Net Difference Between Projected and Actual Earnings
on Pension Plan Investments
Changes of Assumptions
Changes in Proportion
Total Deferred Outflows of Resources
Differences Between Expected
and Actual Experience
Changes of Assumptions
Changes in Proportion
Total Deferred Inflows of Resources
Proportionate Share of Plan Pension
Expense
Net Recognition of Deferred Amounts from Changes in
Proportionate Share
Total Employer Pension Expense
Allocated
Additional Unfunded
Liability PaymentsTotal Employer
Pension Expense
5590 USD 103 Cheylin $ 1,331,703 $ 11,570 $ 22,134 $ 35,764 $ 106,109 $ 175,577 $ 34,443 $ 490 $ 172,825 $ 207,758 $ 144,959 $ (42,015) $ 102,944 $ - $ 102,944
5696 Kansas State H S Activities Assoc 2,319,129 20,149 38,546 62,282 329,669 450,646 59,983 853 444,002 504,838 252,443 28,409 280,852 - 280,852
9291 USD 105 Rawlins County 3,056,319 26,554 50,798 82,080 154,357 313,789 79,049 1,124 191,645 271,818 332,689 (19,617) 313,072 - 313,072
9302 USD 106 Western Plains 1,700,039 14,770 28,256 45,656 204,523 293,205 43,970 625 175,497 220,092 185,054 14,066 199,120 - 199,120
9332 USD 107 Rock Hills 2,839,392 24,669 47,192 76,255 194,361 342,477 73,439 1,044 208,121 282,604 309,075 3,539 312,614 - 312,614
9333 USD 108 Washington County 3,054,702 26,540 50,771 82,037 170,830 330,178 79,008 1,123 233,194 313,325 332,513 (136,807) 195,706 - 195,706
9335 USD 109 Republic County 3,972,924 34,518 66,032 106,697 193,977 401,224 102,757 1,461 118,379 222,597 432,463 (1,120) 431,343 - 431,343
9389 USD 110 Thunder Ridge 2,389,110 20,757 39,709 64,162 20,915 145,543 61,793 879 213,700 276,372 260,061 (108,157) 151,904 - 151,904
9410 USD 111 Doniphan West 3,233,146 28,091 53,737 86,829 656 169,313 83,623 1,189 160,360 245,172 351,937 (76,654) 275,283 - 275,283
9444 USD 114 Riverside 4,420,360 38,405 73,470 118,713 221,691 452,279 114,329 1,625 1,272,588 1,388,542 481,168 (267,286) 213,882 - 213,882
9445 USD 112 Central Plains 5,311,224 46,145 88,276 142,638 64,853 341,912 137,371 1,953 582,649 721,973 578,141 (204,484) 373,657 - 373,657
9446 USD 113 Prairie Hills 9,061,981 78,733 150,616 243,368 24,960 497,677 234,381 3,332 336,830 574,543 986,421 (286,138) 700,283 - 700,283
9461 USD 115 Nemaha Central Schools 6,133,076 53,286 101,936 164,710 115,121 435,053 158,627 2,255 369,473 530,355 667,602 (180,579) 487,023 - 487,023
Other Employers Subtotal $ 4,493,237,851 $ 39,038,583 $ 74,680,746 $ 120,670,280 $ 321,184,628 $ 555,574,237 $ 116,214,192 $ 1,652,287 $ 252,861,358 $ 370,727,837 $ 489,101,092 $ 26,478,742 $ 515,579,834 $ 48,316 $ 515,628,150
Total State/School Group $ 6,467,715,872 $ 56,193,442 $ 107,497,946 $ 173,696,814 $ 350,835,873 $ 688,224,075 $ 167,282,575 $ 2,378,361 $ 350,835,873 $ 520,496,809 $ 704,028,353 $ - $ 704,028,353 $ 164,092 $ 704,192,445
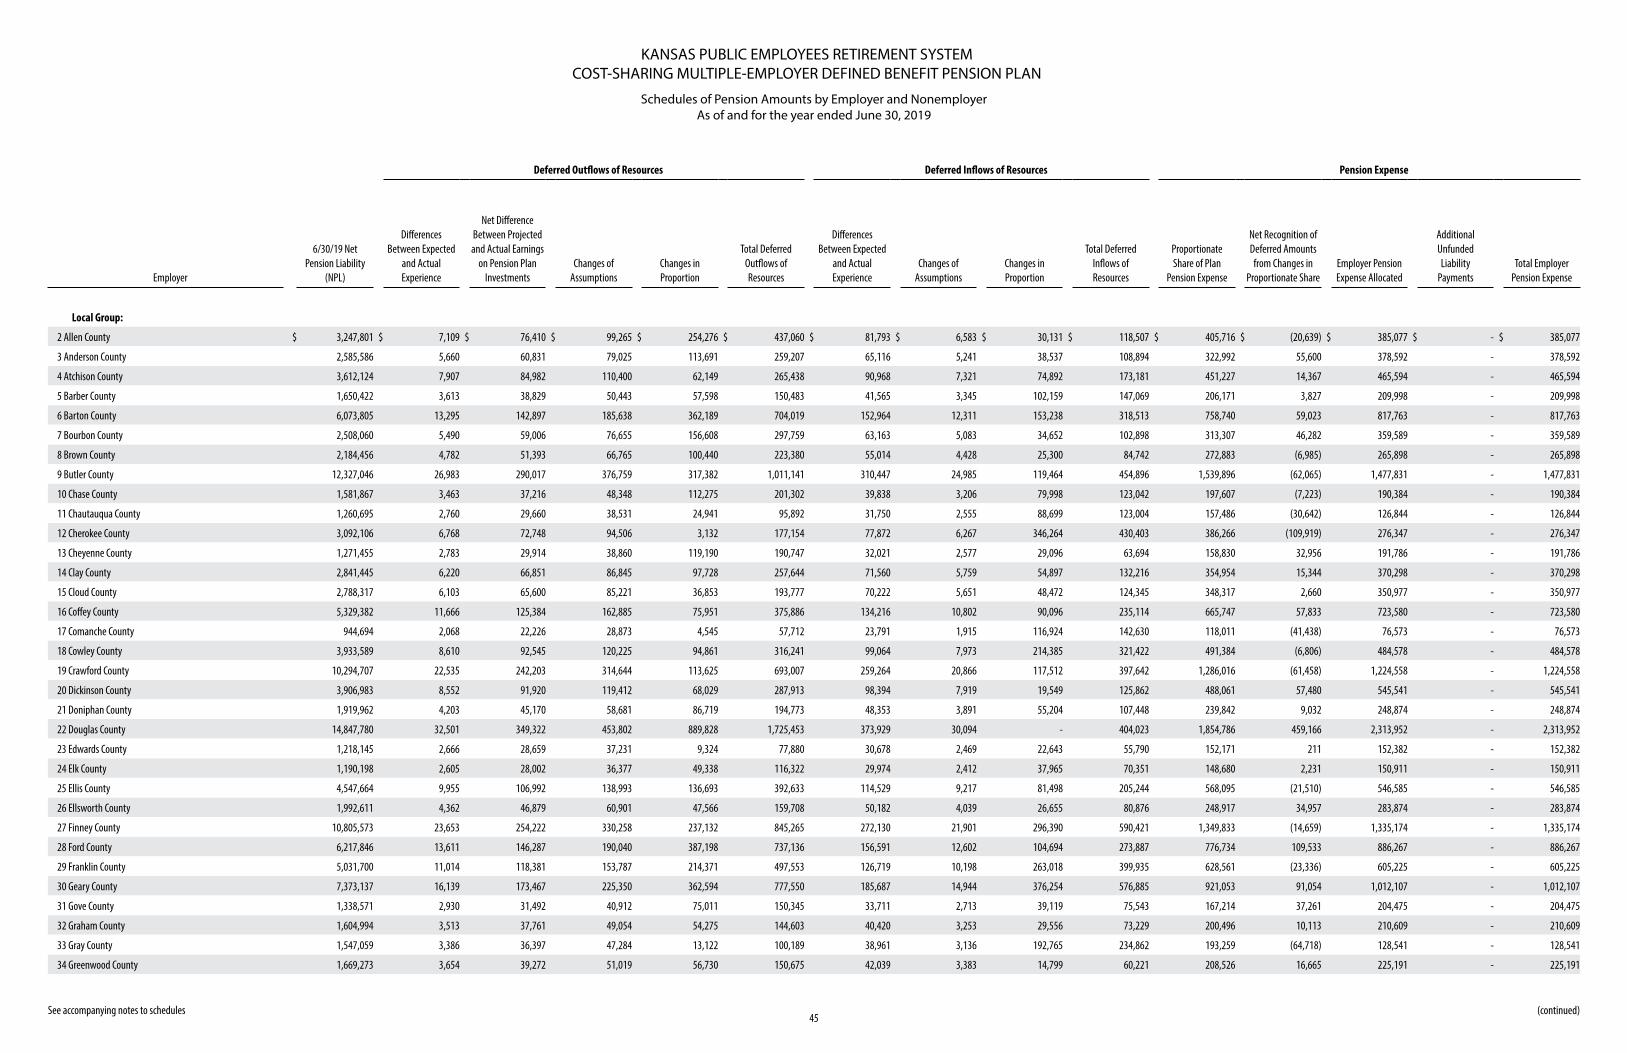
KANSAS PUBLIC EMPLOYEES RETIREMENT SYSTEMCOST-SHARING MULTIPLE-EMPLOYER DEFINED BENEFIT PENSION PLAN
Schedules of Pension Amounts by Employer and NonemployerAs of and for the year ended June 30, 2019
45 See accompanying notes to schedules
Deferred Outflows of Resources Deferred Inflows of Resources Pension Expense
Employer
6/30/19 Net Pension Liability
(NPL)
Differences Between Expected
and Actual Experience
Net Difference Between Projected and Actual Earnings
on Pension Plan Investments
Changes of Assumptions
Changes in Proportion
Total Deferred Outflows of Resources
Differences Between Expected
and Actual Experience
Changes of Assumptions
Changes in Proportion
Total Deferred Inflows of Resources
Proportionate Share of Plan
Pension Expense
Net Recognition of Deferred Amounts from Changes in
Proportionate ShareEmployer Pension Expense Allocated
Additional Unfunded Liability
PaymentsTotal Employer
Pension Expense
Local Group:
2 Allen County $ 3,247,801 $ 7,109 $ 76,410 $ 99,265 $ 254,276 $ 437,060 $ 81,793 $ 6,583 $ 30,131 $ 118,507 $ 405,716 $ (20,639) $ 385,077 $ - $ 385,077
3 Anderson County 2,585,586 5,660 60,831 79,025 113,691 259,207 65,116 5,241 38,537 108,894 322,992 55,600 378,592 - 378,592
4 Atchison County 3,612,124 7,907 84,982 110,400 62,149 265,438 90,968 7,321 74,892 173,181 451,227 14,367 465,594 - 465,594
5 Barber County 1,650,422 3,613 38,829 50,443 57,598 150,483 41,565 3,345 102,159 147,069 206,171 3,827 209,998 - 209,998
6 Barton County 6,073,805 13,295 142,897 185,638 362,189 704,019 152,964 12,311 153,238 318,513 758,740 59,023 817,763 - 817,763
7 Bourbon County 2,508,060 5,490 59,006 76,655 156,608 297,759 63,163 5,083 34,652 102,898 313,307 46,282 359,589 - 359,589
8 Brown County 2,184,456 4,782 51,393 66,765 100,440 223,380 55,014 4,428 25,300 84,742 272,883 (6,985) 265,898 - 265,898
9 Butler County 12,327,046 26,983 290,017 376,759 317,382 1,011,141 310,447 24,985 119,464 454,896 1,539,896 (62,065) 1,477,831 - 1,477,831
10 Chase County 1,581,867 3,463 37,216 48,348 112,275 201,302 39,838 3,206 79,998 123,042 197,607 (7,223) 190,384 - 190,384
11 Chautauqua County 1,260,695 2,760 29,660 38,531 24,941 95,892 31,750 2,555 88,699 123,004 157,486 (30,642) 126,844 - 126,844
12 Cherokee County 3,092,106 6,768 72,748 94,506 3,132 177,154 77,872 6,267 346,264 430,403 386,266 (109,919) 276,347 - 276,347
13 Cheyenne County 1,271,455 2,783 29,914 38,860 119,190 190,747 32,021 2,577 29,096 63,694 158,830 32,956 191,786 - 191,786
14 Clay County 2,841,445 6,220 66,851 86,845 97,728 257,644 71,560 5,759 54,897 132,216 354,954 15,344 370,298 - 370,298
15 Cloud County 2,788,317 6,103 65,600 85,221 36,853 193,777 70,222 5,651 48,472 124,345 348,317 2,660 350,977 - 350,977
16 Coffey County 5,329,382 11,666 125,384 162,885 75,951 375,886 134,216 10,802 90,096 235,114 665,747 57,833 723,580 - 723,580
17 Comanche County 944,694 2,068 22,226 28,873 4,545 57,712 23,791 1,915 116,924 142,630 118,011 (41,438) 76,573 - 76,573
18 Cowley County 3,933,589 8,610 92,545 120,225 94,861 316,241 99,064 7,973 214,385 321,422 491,384 (6,806) 484,578 - 484,578
19 Crawford County 10,294,707 22,535 242,203 314,644 113,625 693,007 259,264 20,866 117,512 397,642 1,286,016 (61,458) 1,224,558 - 1,224,558
20 Dickinson County 3,906,983 8,552 91,920 119,412 68,029 287,913 98,394 7,919 19,549 125,862 488,061 57,480 545,541 - 545,541
21 Doniphan County 1,919,962 4,203 45,170 58,681 86,719 194,773 48,353 3,891 55,204 107,448 239,842 9,032 248,874 - 248,874
22 Douglas County 14,847,780 32,501 349,322 453,802 889,828 1,725,453 373,929 30,094 - 404,023 1,854,786 459,166 2,313,952 - 2,313,952
23 Edwards County 1,218,145 2,666 28,659 37,231 9,324 77,880 30,678 2,469 22,643 55,790 152,171 211 152,382 - 152,382
24 Elk County 1,190,198 2,605 28,002 36,377 49,338 116,322 29,974 2,412 37,965 70,351 148,680 2,231 150,911 - 150,911
25 Ellis County 4,547,664 9,955 106,992 138,993 136,693 392,633 114,529 9,217 81,498 205,244 568,095 (21,510) 546,585 - 546,585
26 Ellsworth County 1,992,611 4,362 46,879 60,901 47,566 159,708 50,182 4,039 26,655 80,876 248,917 34,957 283,874 - 283,874
27 Finney County 10,805,573 23,653 254,222 330,258 237,132 845,265 272,130 21,901 296,390 590,421 1,349,833 (14,659) 1,335,174 - 1,335,174
28 Ford County 6,217,846 13,611 146,287 190,040 387,198 737,136 156,591 12,602 104,694 273,887 776,734 109,533 886,267 - 886,267
29 Franklin County 5,031,700 11,014 118,381 153,787 214,371 497,553 126,719 10,198 263,018 399,935 628,561 (23,336) 605,225 - 605,225
30 Geary County 7,373,137 16,139 173,467 225,350 362,594 777,550 185,687 14,944 376,254 576,885 921,053 91,054 1,012,107 - 1,012,107
31 Gove County 1,338,571 2,930 31,492 40,912 75,011 150,345 33,711 2,713 39,119 75,543 167,214 37,261 204,475 - 204,475
32 Graham County 1,604,994 3,513 37,761 49,054 54,275 144,603 40,420 3,253 29,556 73,229 200,496 10,113 210,609 - 210,609
33 Gray County 1,547,059 3,386 36,397 47,284 13,122 100,189 38,961 3,136 192,765 234,862 193,259 (64,718) 128,541 - 128,541
34 Greenwood County 1,669,273 3,654 39,272 51,019 56,730 150,675 42,039 3,383 14,799 60,221 208,526 16,665 225,191 - 225,191
(continued)
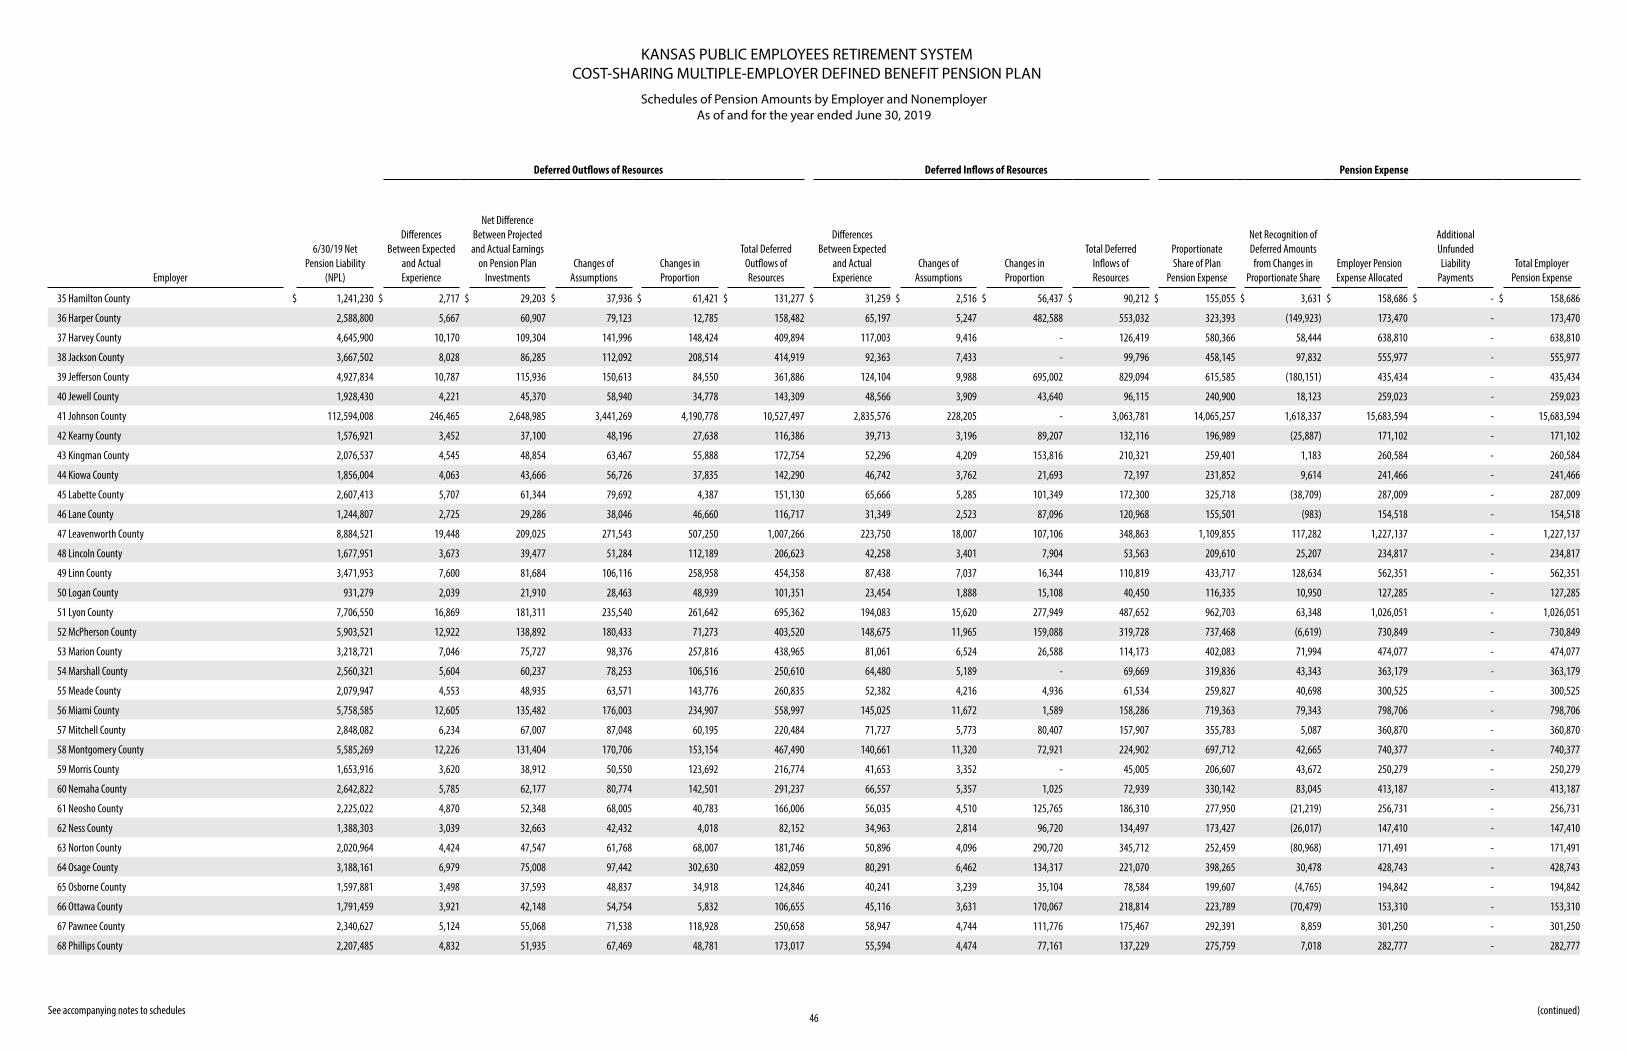
KANSAS PUBLIC EMPLOYEES RETIREMENT SYSTEMCOST-SHARING MULTIPLE-EMPLOYER DEFINED BENEFIT PENSION PLAN
Schedules of Pension Amounts by Employer and NonemployerAs of and for the year ended June 30, 2019
46 See accompanying notes to schedules
Deferred Outflows of Resources Deferred Inflows of Resources Pension Expense
Employer
6/30/19 Net Pension Liability
(NPL)
Differences Between Expected
and Actual Experience
Net Difference Between Projected and Actual Earnings
on Pension Plan Investments
Changes of Assumptions
Changes in Proportion
Total Deferred Outflows of Resources
Differences Between Expected
and Actual Experience
Changes of Assumptions
Changes in Proportion
Total Deferred Inflows of Resources
Proportionate Share of Plan
Pension Expense
Net Recognition of Deferred Amounts from Changes in
Proportionate ShareEmployer Pension Expense Allocated
Additional Unfunded Liability
PaymentsTotal Employer
Pension Expense
35 Hamilton County $ 1,241,230 $ 2,717 $ 29,203 $ 37,936 $ 61,421 $ 131,277 $ 31,259 $ 2,516 $ 56,437 $ 90,212 $ 155,055 $ 3,631 $ 158,686 $ - $ 158,686
36 Harper County 2,588,800 5,667 60,907 79,123 12,785 158,482 65,197 5,247 482,588 553,032 323,393 (149,923) 173,470 - 173,470
37 Harvey County 4,645,900 10,170 109,304 141,996 148,424 409,894 117,003 9,416 - 126,419 580,366 58,444 638,810 - 638,810
38 Jackson County 3,667,502 8,028 86,285 112,092 208,514 414,919 92,363 7,433 - 99,796 458,145 97,832 555,977 - 555,977
39 Jefferson County 4,927,834 10,787 115,936 150,613 84,550 361,886 124,104 9,988 695,002 829,094 615,585 (180,151) 435,434 - 435,434
40 Jewell County 1,928,430 4,221 45,370 58,940 34,778 143,309 48,566 3,909 43,640 96,115 240,900 18,123 259,023 - 259,023
41 Johnson County 112,594,008 246,465 2,648,985 3,441,269 4,190,778 10,527,497 2,835,576 228,205 - 3,063,781 14,065,257 1,618,337 15,683,594 - 15,683,594
42 Kearny County 1,576,921 3,452 37,100 48,196 27,638 116,386 39,713 3,196 89,207 132,116 196,989 (25,887) 171,102 - 171,102
43 Kingman County 2,076,537 4,545 48,854 63,467 55,888 172,754 52,296 4,209 153,816 210,321 259,401 1,183 260,584 - 260,584
44 Kiowa County 1,856,004 4,063 43,666 56,726 37,835 142,290 46,742 3,762 21,693 72,197 231,852 9,614 241,466 - 241,466
45 Labette County 2,607,413 5,707 61,344 79,692 4,387 151,130 65,666 5,285 101,349 172,300 325,718 (38,709) 287,009 - 287,009
46 Lane County 1,244,807 2,725 29,286 38,046 46,660 116,717 31,349 2,523 87,096 120,968 155,501 (983) 154,518 - 154,518
47 Leavenworth County 8,884,521 19,448 209,025 271,543 507,250 1,007,266 223,750 18,007 107,106 348,863 1,109,855 117,282 1,227,137 - 1,227,137
48 Lincoln County 1,677,951 3,673 39,477 51,284 112,189 206,623 42,258 3,401 7,904 53,563 209,610 25,207 234,817 - 234,817
49 Linn County 3,471,953 7,600 81,684 106,116 258,958 454,358 87,438 7,037 16,344 110,819 433,717 128,634 562,351 - 562,351
50 Logan County 931,279 2,039 21,910 28,463 48,939 101,351 23,454 1,888 15,108 40,450 116,335 10,950 127,285 - 127,285
51 Lyon County 7,706,550 16,869 181,311 235,540 261,642 695,362 194,083 15,620 277,949 487,652 962,703 63,348 1,026,051 - 1,026,051
52 McPherson County 5,903,521 12,922 138,892 180,433 71,273 403,520 148,675 11,965 159,088 319,728 737,468 (6,619) 730,849 - 730,849
53 Marion County 3,218,721 7,046 75,727 98,376 257,816 438,965 81,061 6,524 26,588 114,173 402,083 71,994 474,077 - 474,077
54 Marshall County 2,560,321 5,604 60,237 78,253 106,516 250,610 64,480 5,189 - 69,669 319,836 43,343 363,179 - 363,179
55 Meade County 2,079,947 4,553 48,935 63,571 143,776 260,835 52,382 4,216 4,936 61,534 259,827 40,698 300,525 - 300,525
56 Miami County 5,758,585 12,605 135,482 176,003 234,907 558,997 145,025 11,672 1,589 158,286 719,363 79,343 798,706 - 798,706
57 Mitchell County 2,848,082 6,234 67,007 87,048 60,195 220,484 71,727 5,773 80,407 157,907 355,783 5,087 360,870 - 360,870
58 Montgomery County 5,585,269 12,226 131,404 170,706 153,154 467,490 140,661 11,320 72,921 224,902 697,712 42,665 740,377 - 740,377
59 Morris County 1,653,916 3,620 38,912 50,550 123,692 216,774 41,653 3,352 - 45,005 206,607 43,672 250,279 - 250,279
60 Nemaha County 2,642,822 5,785 62,177 80,774 142,501 291,237 66,557 5,357 1,025 72,939 330,142 83,045 413,187 - 413,187
61 Neosho County 2,225,022 4,870 52,348 68,005 40,783 166,006 56,035 4,510 125,765 186,310 277,950 (21,219) 256,731 - 256,731
62 Ness County 1,388,303 3,039 32,663 42,432 4,018 82,152 34,963 2,814 96,720 134,497 173,427 (26,017) 147,410 - 147,410
63 Norton County 2,020,964 4,424 47,547 61,768 68,007 181,746 50,896 4,096 290,720 345,712 252,459 (80,968) 171,491 - 171,491
64 Osage County 3,188,161 6,979 75,008 97,442 302,630 482,059 80,291 6,462 134,317 221,070 398,265 30,478 428,743 - 428,743
65 Osborne County 1,597,881 3,498 37,593 48,837 34,918 124,846 40,241 3,239 35,104 78,584 199,607 (4,765) 194,842 - 194,842
66 Ottawa County 1,791,459 3,921 42,148 54,754 5,832 106,655 45,116 3,631 170,067 218,814 223,789 (70,479) 153,310 - 153,310
67 Pawnee County 2,340,627 5,124 55,068 71,538 118,928 250,658 58,947 4,744 111,776 175,467 292,391 8,859 301,250 - 301,250
68 Phillips County 2,207,485 4,832 51,935 67,469 48,781 173,017 55,594 4,474 77,161 137,229 275,759 7,018 282,777 - 282,777
(continued)
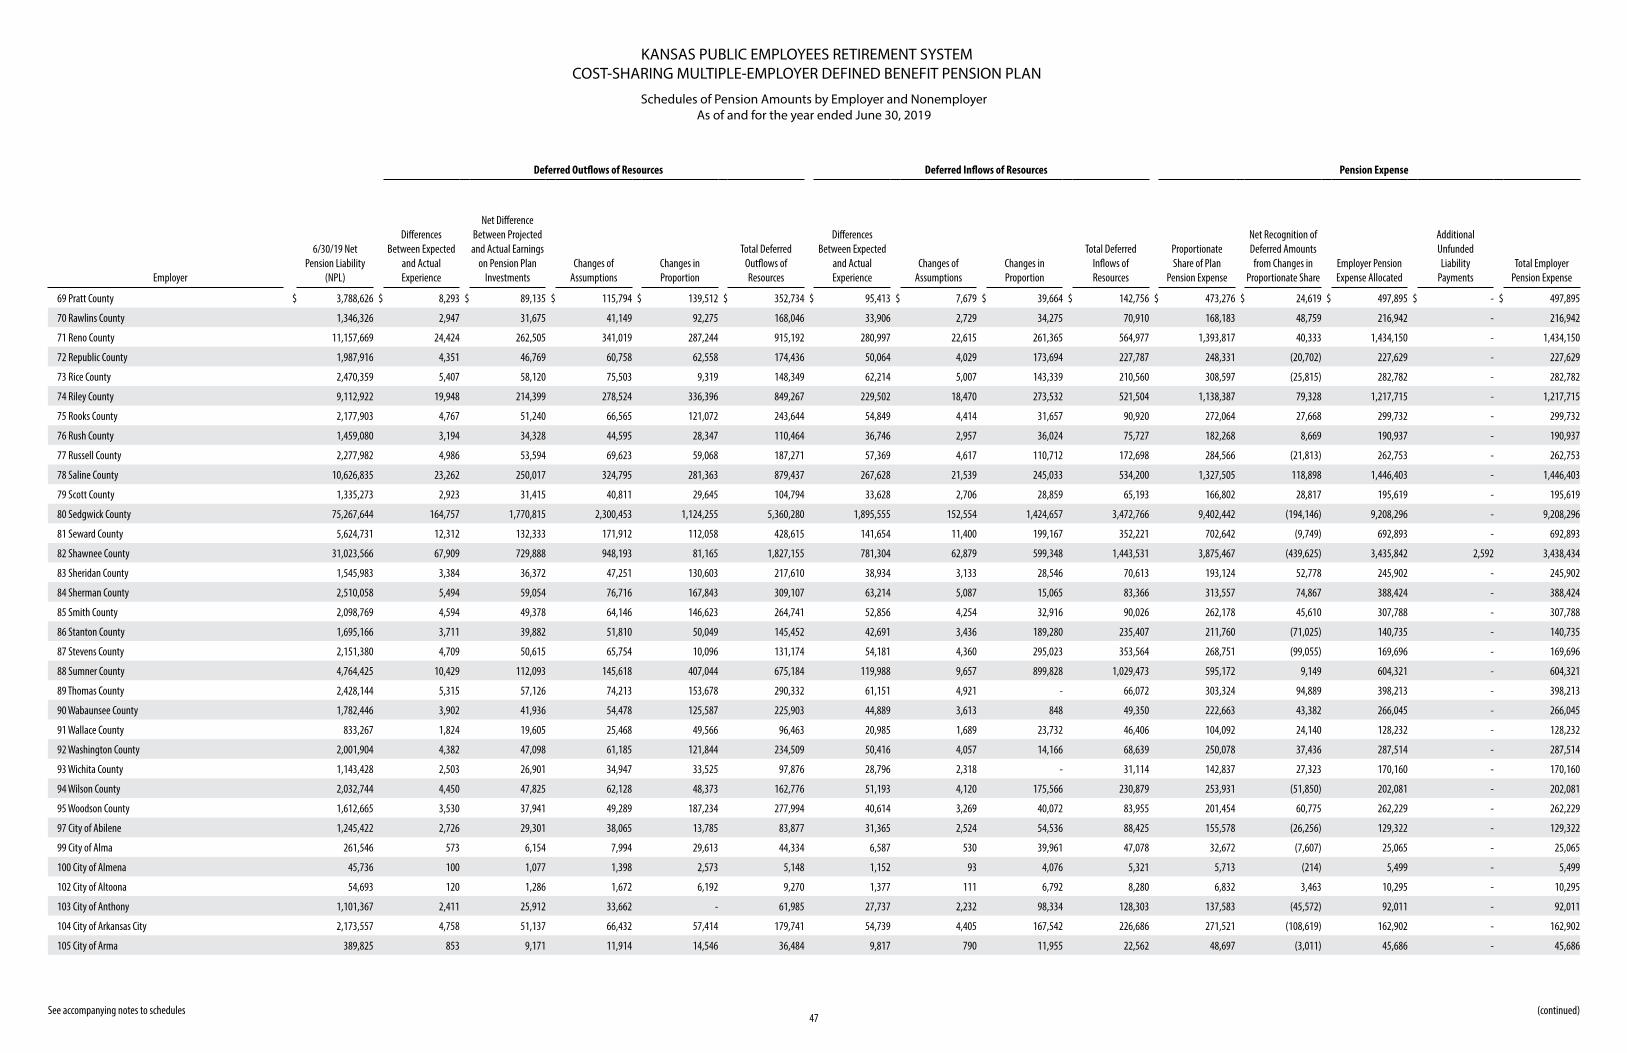
KANSAS PUBLIC EMPLOYEES RETIREMENT SYSTEMCOST-SHARING MULTIPLE-EMPLOYER DEFINED BENEFIT PENSION PLAN
Schedules of Pension Amounts by Employer and NonemployerAs of and for the year ended June 30, 2019
47 See accompanying notes to schedules
Deferred Outflows of Resources Deferred Inflows of Resources Pension Expense
Employer
6/30/19 Net Pension Liability
(NPL)
Differences Between Expected
and Actual Experience
Net Difference Between Projected and Actual Earnings
on Pension Plan Investments
Changes of Assumptions
Changes in Proportion
Total Deferred Outflows of Resources
Differences Between Expected
and Actual Experience
Changes of Assumptions
Changes in Proportion
Total Deferred Inflows of Resources
Proportionate Share of Plan
Pension Expense
Net Recognition of Deferred Amounts from Changes in
Proportionate ShareEmployer Pension Expense Allocated
Additional Unfunded Liability
PaymentsTotal Employer
Pension Expense
69 Pratt County $ 3,788,626 $ 8,293 $ 89,135 $ 115,794 $ 139,512 $ 352,734 $ 95,413 $ 7,679 $ 39,664 $ 142,756 $ 473,276 $ 24,619 $ 497,895 $ - $ 497,895
70 Rawlins County 1,346,326 2,947 31,675 41,149 92,275 168,046 33,906 2,729 34,275 70,910 168,183 48,759 216,942 - 216,942
71 Reno County 11,157,669 24,424 262,505 341,019 287,244 915,192 280,997 22,615 261,365 564,977 1,393,817 40,333 1,434,150 - 1,434,150
72 Republic County 1,987,916 4,351 46,769 60,758 62,558 174,436 50,064 4,029 173,694 227,787 248,331 (20,702) 227,629 - 227,629
73 Rice County 2,470,359 5,407 58,120 75,503 9,319 148,349 62,214 5,007 143,339 210,560 308,597 (25,815) 282,782 - 282,782
74 Riley County 9,112,922 19,948 214,399 278,524 336,396 849,267 229,502 18,470 273,532 521,504 1,138,387 79,328 1,217,715 - 1,217,715
75 Rooks County 2,177,903 4,767 51,240 66,565 121,072 243,644 54,849 4,414 31,657 90,920 272,064 27,668 299,732 - 299,732
76 Rush County 1,459,080 3,194 34,328 44,595 28,347 110,464 36,746 2,957 36,024 75,727 182,268 8,669 190,937 - 190,937
77 Russell County 2,277,982 4,986 53,594 69,623 59,068 187,271 57,369 4,617 110,712 172,698 284,566 (21,813) 262,753 - 262,753
78 Saline County 10,626,835 23,262 250,017 324,795 281,363 879,437 267,628 21,539 245,033 534,200 1,327,505 118,898 1,446,403 - 1,446,403
79 Scott County 1,335,273 2,923 31,415 40,811 29,645 104,794 33,628 2,706 28,859 65,193 166,802 28,817 195,619 - 195,619
80 Sedgwick County 75,267,644 164,757 1,770,815 2,300,453 1,124,255 5,360,280 1,895,555 152,554 1,424,657 3,472,766 9,402,442 (194,146) 9,208,296 - 9,208,296
81 Seward County 5,624,731 12,312 132,333 171,912 112,058 428,615 141,654 11,400 199,167 352,221 702,642 (9,749) 692,893 - 692,893
82 Shawnee County 31,023,566 67,909 729,888 948,193 81,165 1,827,155 781,304 62,879 599,348 1,443,531 3,875,467 (439,625) 3,435,842 2,592 3,438,434
83 Sheridan County 1,545,983 3,384 36,372 47,251 130,603 217,610 38,934 3,133 28,546 70,613 193,124 52,778 245,902 - 245,902
84 Sherman County 2,510,058 5,494 59,054 76,716 167,843 309,107 63,214 5,087 15,065 83,366 313,557 74,867 388,424 - 388,424
85 Smith County 2,098,769 4,594 49,378 64,146 146,623 264,741 52,856 4,254 32,916 90,026 262,178 45,610 307,788 - 307,788
86 Stanton County 1,695,166 3,711 39,882 51,810 50,049 145,452 42,691 3,436 189,280 235,407 211,760 (71,025) 140,735 - 140,735
87 Stevens County 2,151,380 4,709 50,615 65,754 10,096 131,174 54,181 4,360 295,023 353,564 268,751 (99,055) 169,696 - 169,696
88 Sumner County 4,764,425 10,429 112,093 145,618 407,044 675,184 119,988 9,657 899,828 1,029,473 595,172 9,149 604,321 - 604,321
89 Thomas County 2,428,144 5,315 57,126 74,213 153,678 290,332 61,151 4,921 - 66,072 303,324 94,889 398,213 - 398,213
90 Wabaunsee County 1,782,446 3,902 41,936 54,478 125,587 225,903 44,889 3,613 848 49,350 222,663 43,382 266,045 - 266,045
91 Wallace County 833,267 1,824 19,605 25,468 49,566 96,463 20,985 1,689 23,732 46,406 104,092 24,140 128,232 - 128,232
92 Washington County 2,001,904 4,382 47,098 61,185 121,844 234,509 50,416 4,057 14,166 68,639 250,078 37,436 287,514 - 287,514
93 Wichita County 1,143,428 2,503 26,901 34,947 33,525 97,876 28,796 2,318 - 31,114 142,837 27,323 170,160 - 170,160
94 Wilson County 2,032,744 4,450 47,825 62,128 48,373 162,776 51,193 4,120 175,566 230,879 253,931 (51,850) 202,081 - 202,081
95 Woodson County 1,612,665 3,530 37,941 49,289 187,234 277,994 40,614 3,269 40,072 83,955 201,454 60,775 262,229 - 262,229
97 City of Abilene 1,245,422 2,726 29,301 38,065 13,785 83,877 31,365 2,524 54,536 88,425 155,578 (26,256) 129,322 - 129,322
99 City of Alma 261,546 573 6,154 7,994 29,613 44,334 6,587 530 39,961 47,078 32,672 (7,607) 25,065 - 25,065
100 City of Almena 45,736 100 1,077 1,398 2,573 5,148 1,152 93 4,076 5,321 5,713 (214) 5,499 - 5,499
102 City of Altoona 54,693 120 1,286 1,672 6,192 9,270 1,377 111 6,792 8,280 6,832 3,463 10,295 - 10,295
103 City of Anthony 1,101,367 2,411 25,912 33,662 - 61,985 27,737 2,232 98,334 128,303 137,583 (45,572) 92,011 - 92,011
104 City of Arkansas City 2,173,557 4,758 51,137 66,432 57,414 179,741 54,739 4,405 167,542 226,686 271,521 (108,619) 162,902 - 162,902
105 City of Arma 389,825 853 9,171 11,914 14,546 36,484 9,817 790 11,955 22,562 48,697 (3,011) 45,686 - 45,686
(continued)
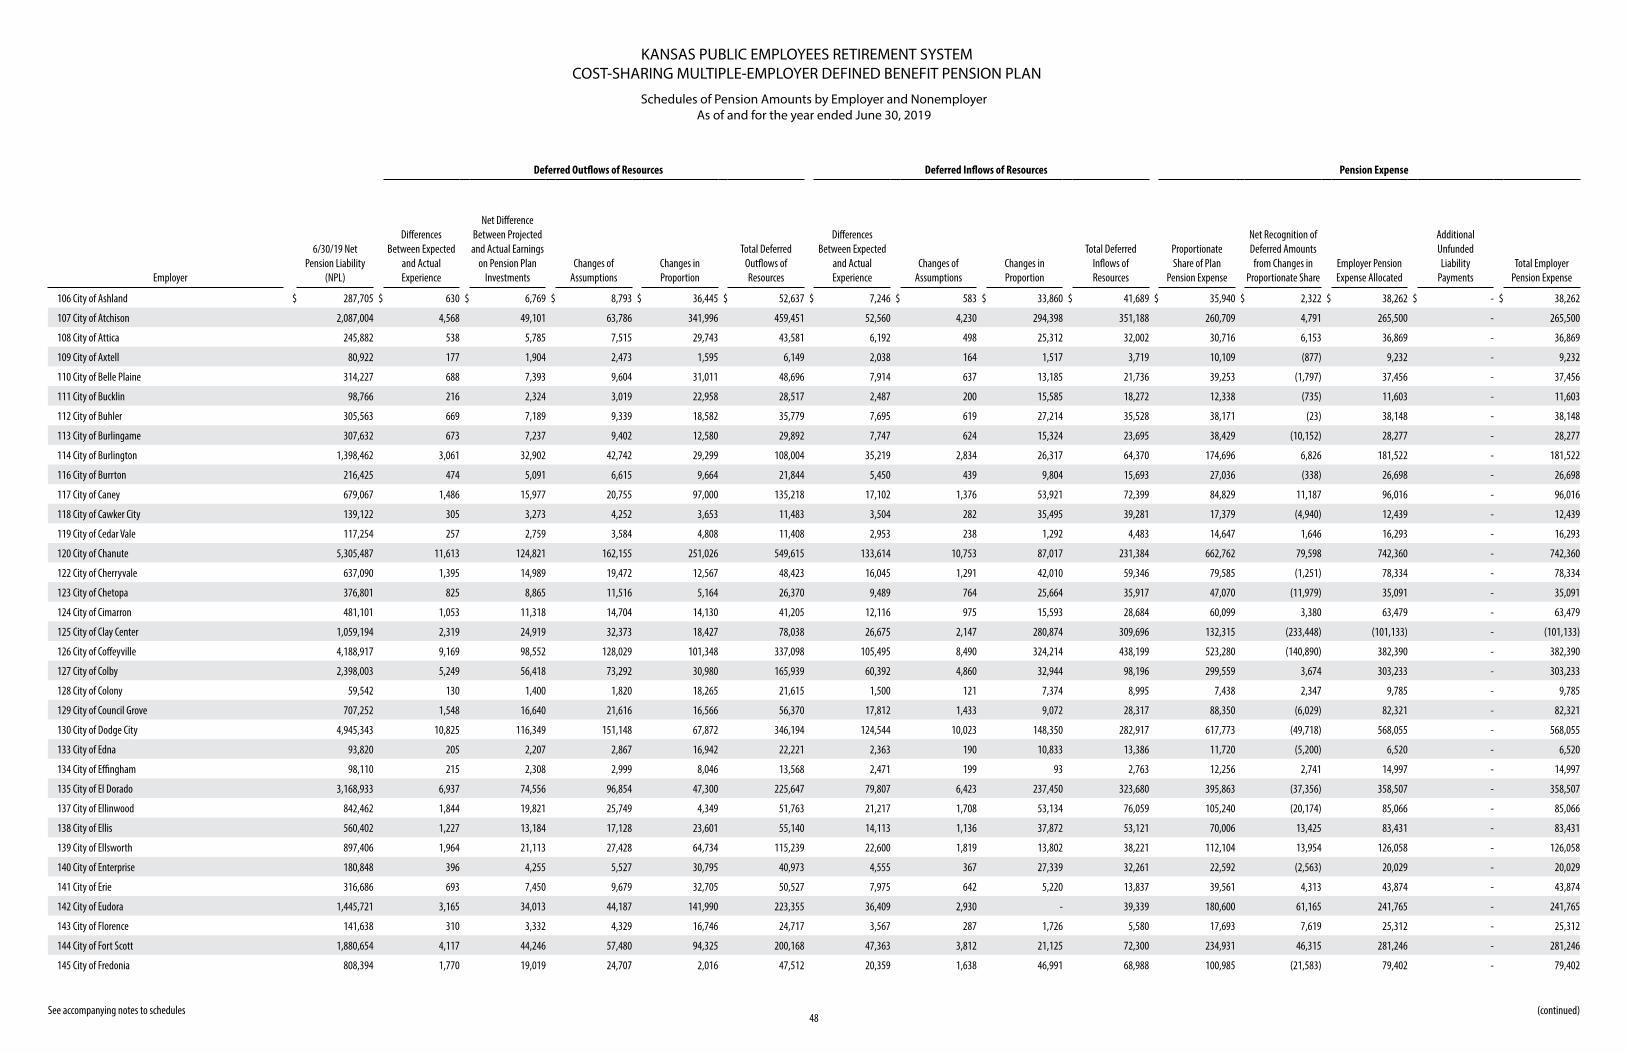
KANSAS PUBLIC EMPLOYEES RETIREMENT SYSTEMCOST-SHARING MULTIPLE-EMPLOYER DEFINED BENEFIT PENSION PLAN
Schedules of Pension Amounts by Employer and NonemployerAs of and for the year ended June 30, 2019
48 See accompanying notes to schedules
Deferred Outflows of Resources Deferred Inflows of Resources Pension Expense
Employer
6/30/19 Net Pension Liability
(NPL)
Differences Between Expected
and Actual Experience
Net Difference Between Projected and Actual Earnings
on Pension Plan Investments
Changes of Assumptions
Changes in Proportion
Total Deferred Outflows of Resources
Differences Between Expected
and Actual Experience
Changes of Assumptions
Changes in Proportion
Total Deferred Inflows of Resources
Proportionate Share of Plan
Pension Expense
Net Recognition of Deferred Amounts from Changes in
Proportionate ShareEmployer Pension Expense Allocated
Additional Unfunded Liability
PaymentsTotal Employer
Pension Expense
106 City of Ashland $ 287,705 $ 630 $ 6,769 $ 8,793 $ 36,445 $ 52,637 $ 7,246 $ 583 $ 33,860 $ 41,689 $ 35,940 $ 2,322 $ 38,262 $ - $ 38,262
107 City of Atchison 2,087,004 4,568 49,101 63,786 341,996 459,451 52,560 4,230 294,398 351,188 260,709 4,791 265,500 - 265,500
108 City of Attica 245,882 538 5,785 7,515 29,743 43,581 6,192 498 25,312 32,002 30,716 6,153 36,869 - 36,869
109 City of Axtell 80,922 177 1,904 2,473 1,595 6,149 2,038 164 1,517 3,719 10,109 (877) 9,232 - 9,232
110 City of Belle Plaine 314,227 688 7,393 9,604 31,011 48,696 7,914 637 13,185 21,736 39,253 (1,797) 37,456 - 37,456
111 City of Bucklin 98,766 216 2,324 3,019 22,958 28,517 2,487 200 15,585 18,272 12,338 (735) 11,603 - 11,603
112 City of Buhler 305,563 669 7,189 9,339 18,582 35,779 7,695 619 27,214 35,528 38,171 (23) 38,148 - 38,148
113 City of Burlingame 307,632 673 7,237 9,402 12,580 29,892 7,747 624 15,324 23,695 38,429 (10,152) 28,277 - 28,277
114 City of Burlington 1,398,462 3,061 32,902 42,742 29,299 108,004 35,219 2,834 26,317 64,370 174,696 6,826 181,522 - 181,522
116 City of Burrton 216,425 474 5,091 6,615 9,664 21,844 5,450 439 9,804 15,693 27,036 (338) 26,698 - 26,698
117 City of Caney 679,067 1,486 15,977 20,755 97,000 135,218 17,102 1,376 53,921 72,399 84,829 11,187 96,016 - 96,016
118 City of Cawker City 139,122 305 3,273 4,252 3,653 11,483 3,504 282 35,495 39,281 17,379 (4,940) 12,439 - 12,439
119 City of Cedar Vale 117,254 257 2,759 3,584 4,808 11,408 2,953 238 1,292 4,483 14,647 1,646 16,293 - 16,293
120 City of Chanute 5,305,487 11,613 124,821 162,155 251,026 549,615 133,614 10,753 87,017 231,384 662,762 79,598 742,360 - 742,360
122 City of Cherryvale 637,090 1,395 14,989 19,472 12,567 48,423 16,045 1,291 42,010 59,346 79,585 (1,251) 78,334 - 78,334
123 City of Chetopa 376,801 825 8,865 11,516 5,164 26,370 9,489 764 25,664 35,917 47,070 (11,979) 35,091 - 35,091
124 City of Cimarron 481,101 1,053 11,318 14,704 14,130 41,205 12,116 975 15,593 28,684 60,099 3,380 63,479 - 63,479
125 City of Clay Center 1,059,194 2,319 24,919 32,373 18,427 78,038 26,675 2,147 280,874 309,696 132,315 (233,448) (101,133) - (101,133)
126 City of Coffeyville 4,188,917 9,169 98,552 128,029 101,348 337,098 105,495 8,490 324,214 438,199 523,280 (140,890) 382,390 - 382,390
127 City of Colby 2,398,003 5,249 56,418 73,292 30,980 165,939 60,392 4,860 32,944 98,196 299,559 3,674 303,233 - 303,233
128 City of Colony 59,542 130 1,400 1,820 18,265 21,615 1,500 121 7,374 8,995 7,438 2,347 9,785 - 9,785
129 City of Council Grove 707,252 1,548 16,640 21,616 16,566 56,370 17,812 1,433 9,072 28,317 88,350 (6,029) 82,321 - 82,321
130 City of Dodge City 4,945,343 10,825 116,349 151,148 67,872 346,194 124,544 10,023 148,350 282,917 617,773 (49,718) 568,055 - 568,055
133 City of Edna 93,820 205 2,207 2,867 16,942 22,221 2,363 190 10,833 13,386 11,720 (5,200) 6,520 - 6,520
134 City of Effingham 98,110 215 2,308 2,999 8,046 13,568 2,471 199 93 2,763 12,256 2,741 14,997 - 14,997
135 City of El Dorado 3,168,933 6,937 74,556 96,854 47,300 225,647 79,807 6,423 237,450 323,680 395,863 (37,356) 358,507 - 358,507
137 City of Ellinwood 842,462 1,844 19,821 25,749 4,349 51,763 21,217 1,708 53,134 76,059 105,240 (20,174) 85,066 - 85,066
138 City of Ellis 560,402 1,227 13,184 17,128 23,601 55,140 14,113 1,136 37,872 53,121 70,006 13,425 83,431 - 83,431
139 City of Ellsworth 897,406 1,964 21,113 27,428 64,734 115,239 22,600 1,819 13,802 38,221 112,104 13,954 126,058 - 126,058
140 City of Enterprise 180,848 396 4,255 5,527 30,795 40,973 4,555 367 27,339 32,261 22,592 (2,563) 20,029 - 20,029
141 City of Erie 316,686 693 7,450 9,679 32,705 50,527 7,975 642 5,220 13,837 39,561 4,313 43,874 - 43,874
142 City of Eudora 1,445,721 3,165 34,013 44,187 141,990 223,355 36,409 2,930 - 39,339 180,600 61,165 241,765 - 241,765
143 City of Florence 141,638 310 3,332 4,329 16,746 24,717 3,567 287 1,726 5,580 17,693 7,619 25,312 - 25,312
144 City of Fort Scott 1,880,654 4,117 44,246 57,480 94,325 200,168 47,363 3,812 21,125 72,300 234,931 46,315 281,246 - 281,246
145 City of Fredonia 808,394 1,770 19,019 24,707 2,016 47,512 20,359 1,638 46,991 68,988 100,985 (21,583) 79,402 - 79,402
(continued)
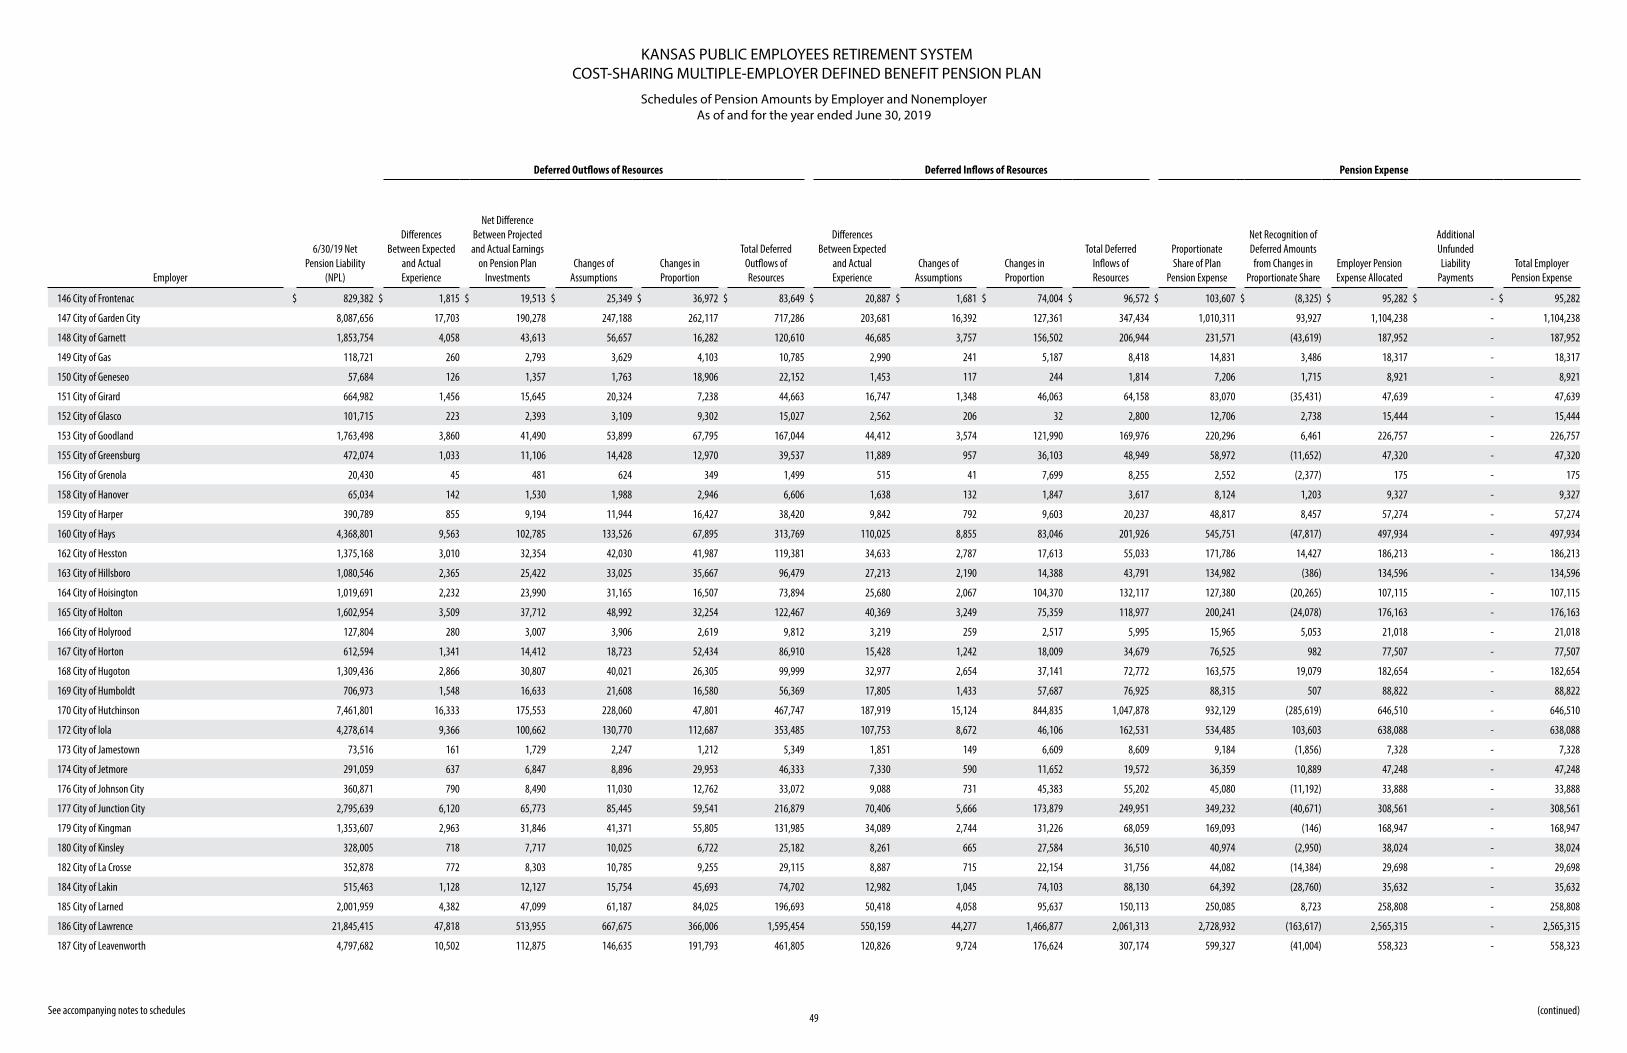
KANSAS PUBLIC EMPLOYEES RETIREMENT SYSTEMCOST-SHARING MULTIPLE-EMPLOYER DEFINED BENEFIT PENSION PLAN
Schedules of Pension Amounts by Employer and NonemployerAs of and for the year ended June 30, 2019
49 See accompanying notes to schedules
Deferred Outflows of Resources Deferred Inflows of Resources Pension Expense
Employer
6/30/19 Net Pension Liability
(NPL)
Differences Between Expected
and Actual Experience
Net Difference Between Projected and Actual Earnings
on Pension Plan Investments
Changes of Assumptions
Changes in Proportion
Total Deferred Outflows of Resources
Differences Between Expected
and Actual Experience
Changes of Assumptions
Changes in Proportion
Total Deferred Inflows of Resources
Proportionate Share of Plan
Pension Expense
Net Recognition of Deferred Amounts from Changes in
Proportionate ShareEmployer Pension Expense Allocated
Additional Unfunded Liability
PaymentsTotal Employer
Pension Expense
146 City of Frontenac $ 829,382 $ 1,815 $ 19,513 $ 25,349 $ 36,972 $ 83,649 $ 20,887 $ 1,681 $ 74,004 $ 96,572 $ 103,607 $ (8,325) $ 95,282 $ - $ 95,282
147 City of Garden City 8,087,656 17,703 190,278 247,188 262,117 717,286 203,681 16,392 127,361 347,434 1,010,311 93,927 1,104,238 - 1,104,238
148 City of Garnett 1,853,754 4,058 43,613 56,657 16,282 120,610 46,685 3,757 156,502 206,944 231,571 (43,619) 187,952 - 187,952
149 City of Gas 118,721 260 2,793 3,629 4,103 10,785 2,990 241 5,187 8,418 14,831 3,486 18,317 - 18,317
150 City of Geneseo 57,684 126 1,357 1,763 18,906 22,152 1,453 117 244 1,814 7,206 1,715 8,921 - 8,921
151 City of Girard 664,982 1,456 15,645 20,324 7,238 44,663 16,747 1,348 46,063 64,158 83,070 (35,431) 47,639 - 47,639
152 City of Glasco 101,715 223 2,393 3,109 9,302 15,027 2,562 206 32 2,800 12,706 2,738 15,444 - 15,444
153 City of Goodland 1,763,498 3,860 41,490 53,899 67,795 167,044 44,412 3,574 121,990 169,976 220,296 6,461 226,757 - 226,757
155 City of Greensburg 472,074 1,033 11,106 14,428 12,970 39,537 11,889 957 36,103 48,949 58,972 (11,652) 47,320 - 47,320
156 City of Grenola 20,430 45 481 624 349 1,499 515 41 7,699 8,255 2,552 (2,377) 175 - 175
158 City of Hanover 65,034 142 1,530 1,988 2,946 6,606 1,638 132 1,847 3,617 8,124 1,203 9,327 - 9,327
159 City of Harper 390,789 855 9,194 11,944 16,427 38,420 9,842 792 9,603 20,237 48,817 8,457 57,274 - 57,274
160 City of Hays 4,368,801 9,563 102,785 133,526 67,895 313,769 110,025 8,855 83,046 201,926 545,751 (47,817) 497,934 - 497,934
162 City of Hesston 1,375,168 3,010 32,354 42,030 41,987 119,381 34,633 2,787 17,613 55,033 171,786 14,427 186,213 - 186,213
163 City of Hillsboro 1,080,546 2,365 25,422 33,025 35,667 96,479 27,213 2,190 14,388 43,791 134,982 (386) 134,596 - 134,596
164 City of Hoisington 1,019,691 2,232 23,990 31,165 16,507 73,894 25,680 2,067 104,370 132,117 127,380 (20,265) 107,115 - 107,115
165 City of Holton 1,602,954 3,509 37,712 48,992 32,254 122,467 40,369 3,249 75,359 118,977 200,241 (24,078) 176,163 - 176,163
166 City of Holyrood 127,804 280 3,007 3,906 2,619 9,812 3,219 259 2,517 5,995 15,965 5,053 21,018 - 21,018
167 City of Horton 612,594 1,341 14,412 18,723 52,434 86,910 15,428 1,242 18,009 34,679 76,525 982 77,507 - 77,507
168 City of Hugoton 1,309,436 2,866 30,807 40,021 26,305 99,999 32,977 2,654 37,141 72,772 163,575 19,079 182,654 - 182,654
169 City of Humboldt 706,973 1,548 16,633 21,608 16,580 56,369 17,805 1,433 57,687 76,925 88,315 507 88,822 - 88,822
170 City of Hutchinson 7,461,801 16,333 175,553 228,060 47,801 467,747 187,919 15,124 844,835 1,047,878 932,129 (285,619) 646,510 - 646,510
172 City of Iola 4,278,614 9,366 100,662 130,770 112,687 353,485 107,753 8,672 46,106 162,531 534,485 103,603 638,088 - 638,088
173 City of Jamestown 73,516 161 1,729 2,247 1,212 5,349 1,851 149 6,609 8,609 9,184 (1,856) 7,328 - 7,328
174 City of Jetmore 291,059 637 6,847 8,896 29,953 46,333 7,330 590 11,652 19,572 36,359 10,889 47,248 - 47,248
176 City of Johnson City 360,871 790 8,490 11,030 12,762 33,072 9,088 731 45,383 55,202 45,080 (11,192) 33,888 - 33,888
177 City of Junction City 2,795,639 6,120 65,773 85,445 59,541 216,879 70,406 5,666 173,879 249,951 349,232 (40,671) 308,561 - 308,561
179 City of Kingman 1,353,607 2,963 31,846 41,371 55,805 131,985 34,089 2,744 31,226 68,059 169,093 (146) 168,947 - 168,947
180 City of Kinsley 328,005 718 7,717 10,025 6,722 25,182 8,261 665 27,584 36,510 40,974 (2,950) 38,024 - 38,024
182 City of La Crosse 352,878 772 8,303 10,785 9,255 29,115 8,887 715 22,154 31,756 44,082 (14,384) 29,698 - 29,698
184 City of Lakin 515,463 1,128 12,127 15,754 45,693 74,702 12,982 1,045 74,103 88,130 64,392 (28,760) 35,632 - 35,632
185 City of Larned 2,001,959 4,382 47,099 61,187 84,025 196,693 50,418 4,058 95,637 150,113 250,085 8,723 258,808 - 258,808
186 City of Lawrence 21,845,415 47,818 513,955 667,675 366,006 1,595,454 550,159 44,277 1,466,877 2,061,313 2,728,932 (163,617) 2,565,315 - 2,565,315
187 City of Leavenworth 4,797,682 10,502 112,875 146,635 191,793 461,805 120,826 9,724 176,624 307,174 599,327 (41,004) 558,323 - 558,323
(continued)
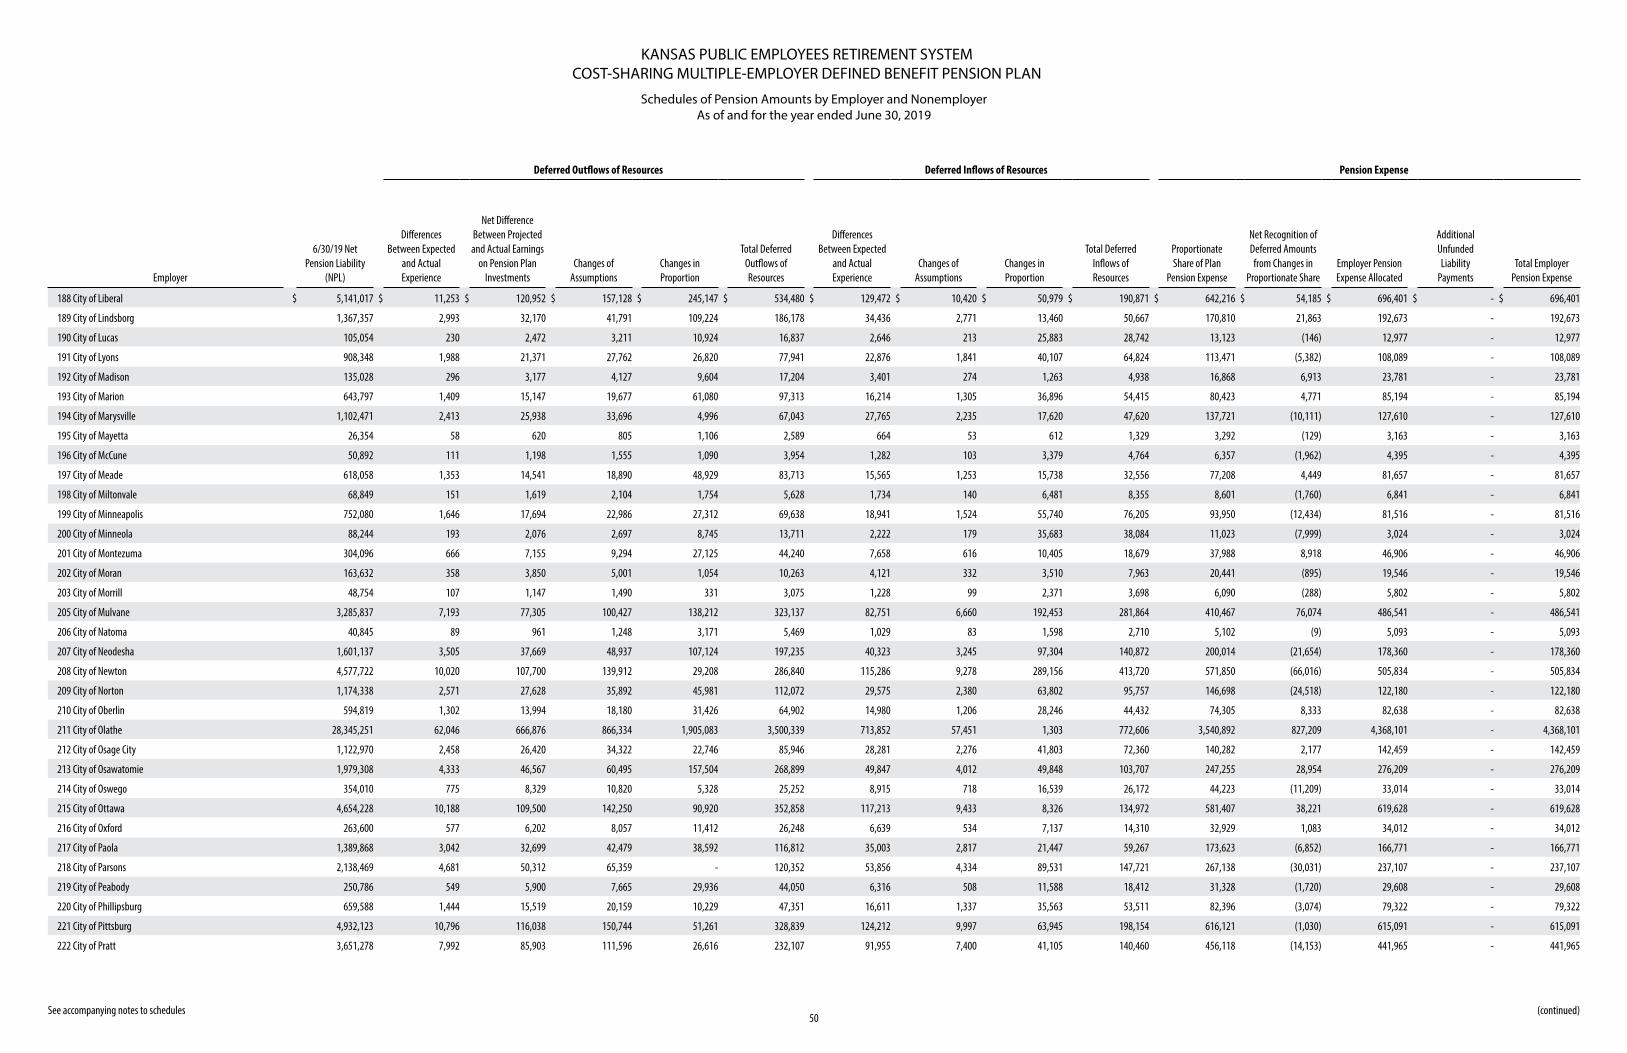
KANSAS PUBLIC EMPLOYEES RETIREMENT SYSTEMCOST-SHARING MULTIPLE-EMPLOYER DEFINED BENEFIT PENSION PLAN
Schedules of Pension Amounts by Employer and NonemployerAs of and for the year ended June 30, 2019
50 See accompanying notes to schedules
Deferred Outflows of Resources Deferred Inflows of Resources Pension Expense
Employer
6/30/19 Net Pension Liability
(NPL)
Differences Between Expected
and Actual Experience
Net Difference Between Projected and Actual Earnings
on Pension Plan Investments
Changes of Assumptions
Changes in Proportion
Total Deferred Outflows of Resources
Differences Between Expected
and Actual Experience
Changes of Assumptions
Changes in Proportion
Total Deferred Inflows of Resources
Proportionate Share of Plan
Pension Expense
Net Recognition of Deferred Amounts from Changes in
Proportionate ShareEmployer Pension Expense Allocated
Additional Unfunded Liability
PaymentsTotal Employer
Pension Expense
188 City of Liberal $ 5,141,017 $ 11,253 $ 120,952 $ 157,128 $ 245,147 $ 534,480 $ 129,472 $ 10,420 $ 50,979 $ 190,871 $ 642,216 $ 54,185 $ 696,401 $ - $ 696,401
189 City of Lindsborg 1,367,357 2,993 32,170 41,791 109,224 186,178 34,436 2,771 13,460 50,667 170,810 21,863 192,673 - 192,673
190 City of Lucas 105,054 230 2,472 3,211 10,924 16,837 2,646 213 25,883 28,742 13,123 (146) 12,977 - 12,977
191 City of Lyons 908,348 1,988 21,371 27,762 26,820 77,941 22,876 1,841 40,107 64,824 113,471 (5,382) 108,089 - 108,089
192 City of Madison 135,028 296 3,177 4,127 9,604 17,204 3,401 274 1,263 4,938 16,868 6,913 23,781 - 23,781
193 City of Marion 643,797 1,409 15,147 19,677 61,080 97,313 16,214 1,305 36,896 54,415 80,423 4,771 85,194 - 85,194
194 City of Marysville 1,102,471 2,413 25,938 33,696 4,996 67,043 27,765 2,235 17,620 47,620 137,721 (10,111) 127,610 - 127,610
195 City of Mayetta 26,354 58 620 805 1,106 2,589 664 53 612 1,329 3,292 (129) 3,163 - 3,163
196 City of McCune 50,892 111 1,198 1,555 1,090 3,954 1,282 103 3,379 4,764 6,357 (1,962) 4,395 - 4,395
197 City of Meade 618,058 1,353 14,541 18,890 48,929 83,713 15,565 1,253 15,738 32,556 77,208 4,449 81,657 - 81,657
198 City of Miltonvale 68,849 151 1,619 2,104 1,754 5,628 1,734 140 6,481 8,355 8,601 (1,760) 6,841 - 6,841
199 City of Minneapolis 752,080 1,646 17,694 22,986 27,312 69,638 18,941 1,524 55,740 76,205 93,950 (12,434) 81,516 - 81,516
200 City of Minneola 88,244 193 2,076 2,697 8,745 13,711 2,222 179 35,683 38,084 11,023 (7,999) 3,024 - 3,024
201 City of Montezuma 304,096 666 7,155 9,294 27,125 44,240 7,658 616 10,405 18,679 37,988 8,918 46,906 - 46,906
202 City of Moran 163,632 358 3,850 5,001 1,054 10,263 4,121 332 3,510 7,963 20,441 (895) 19,546 - 19,546
203 City of Morrill 48,754 107 1,147 1,490 331 3,075 1,228 99 2,371 3,698 6,090 (288) 5,802 - 5,802
205 City of Mulvane 3,285,837 7,193 77,305 100,427 138,212 323,137 82,751 6,660 192,453 281,864 410,467 76,074 486,541 - 486,541
206 City of Natoma 40,845 89 961 1,248 3,171 5,469 1,029 83 1,598 2,710 5,102 (9) 5,093 - 5,093
207 City of Neodesha 1,601,137 3,505 37,669 48,937 107,124 197,235 40,323 3,245 97,304 140,872 200,014 (21,654) 178,360 - 178,360
208 City of Newton 4,577,722 10,020 107,700 139,912 29,208 286,840 115,286 9,278 289,156 413,720 571,850 (66,016) 505,834 - 505,834
209 City of Norton 1,174,338 2,571 27,628 35,892 45,981 112,072 29,575 2,380 63,802 95,757 146,698 (24,518) 122,180 - 122,180
210 City of Oberlin 594,819 1,302 13,994 18,180 31,426 64,902 14,980 1,206 28,246 44,432 74,305 8,333 82,638 - 82,638
211 City of Olathe 28,345,251 62,046 666,876 866,334 1,905,083 3,500,339 713,852 57,451 1,303 772,606 3,540,892 827,209 4,368,101 - 4,368,101
212 City of Osage City 1,122,970 2,458 26,420 34,322 22,746 85,946 28,281 2,276 41,803 72,360 140,282 2,177 142,459 - 142,459
213 City of Osawatomie 1,979,308 4,333 46,567 60,495 157,504 268,899 49,847 4,012 49,848 103,707 247,255 28,954 276,209 - 276,209
214 City of Oswego 354,010 775 8,329 10,820 5,328 25,252 8,915 718 16,539 26,172 44,223 (11,209) 33,014 - 33,014
215 City of Ottawa 4,654,228 10,188 109,500 142,250 90,920 352,858 117,213 9,433 8,326 134,972 581,407 38,221 619,628 - 619,628
216 City of Oxford 263,600 577 6,202 8,057 11,412 26,248 6,639 534 7,137 14,310 32,929 1,083 34,012 - 34,012
217 City of Paola 1,389,868 3,042 32,699 42,479 38,592 116,812 35,003 2,817 21,447 59,267 173,623 (6,852) 166,771 - 166,771
218 City of Parsons 2,138,469 4,681 50,312 65,359 - 120,352 53,856 4,334 89,531 147,721 267,138 (30,031) 237,107 - 237,107
219 City of Peabody 250,786 549 5,900 7,665 29,936 44,050 6,316 508 11,588 18,412 31,328 (1,720) 29,608 - 29,608
220 City of Phillipsburg 659,588 1,444 15,519 20,159 10,229 47,351 16,611 1,337 35,563 53,511 82,396 (3,074) 79,322 - 79,322
221 City of Pittsburg 4,932,123 10,796 116,038 150,744 51,261 328,839 124,212 9,997 63,945 198,154 616,121 (1,030) 615,091 - 615,091
222 City of Pratt 3,651,278 7,992 85,903 111,596 26,616 232,107 91,955 7,400 41,105 140,460 456,118 (14,153) 441,965 - 441,965
(continued)
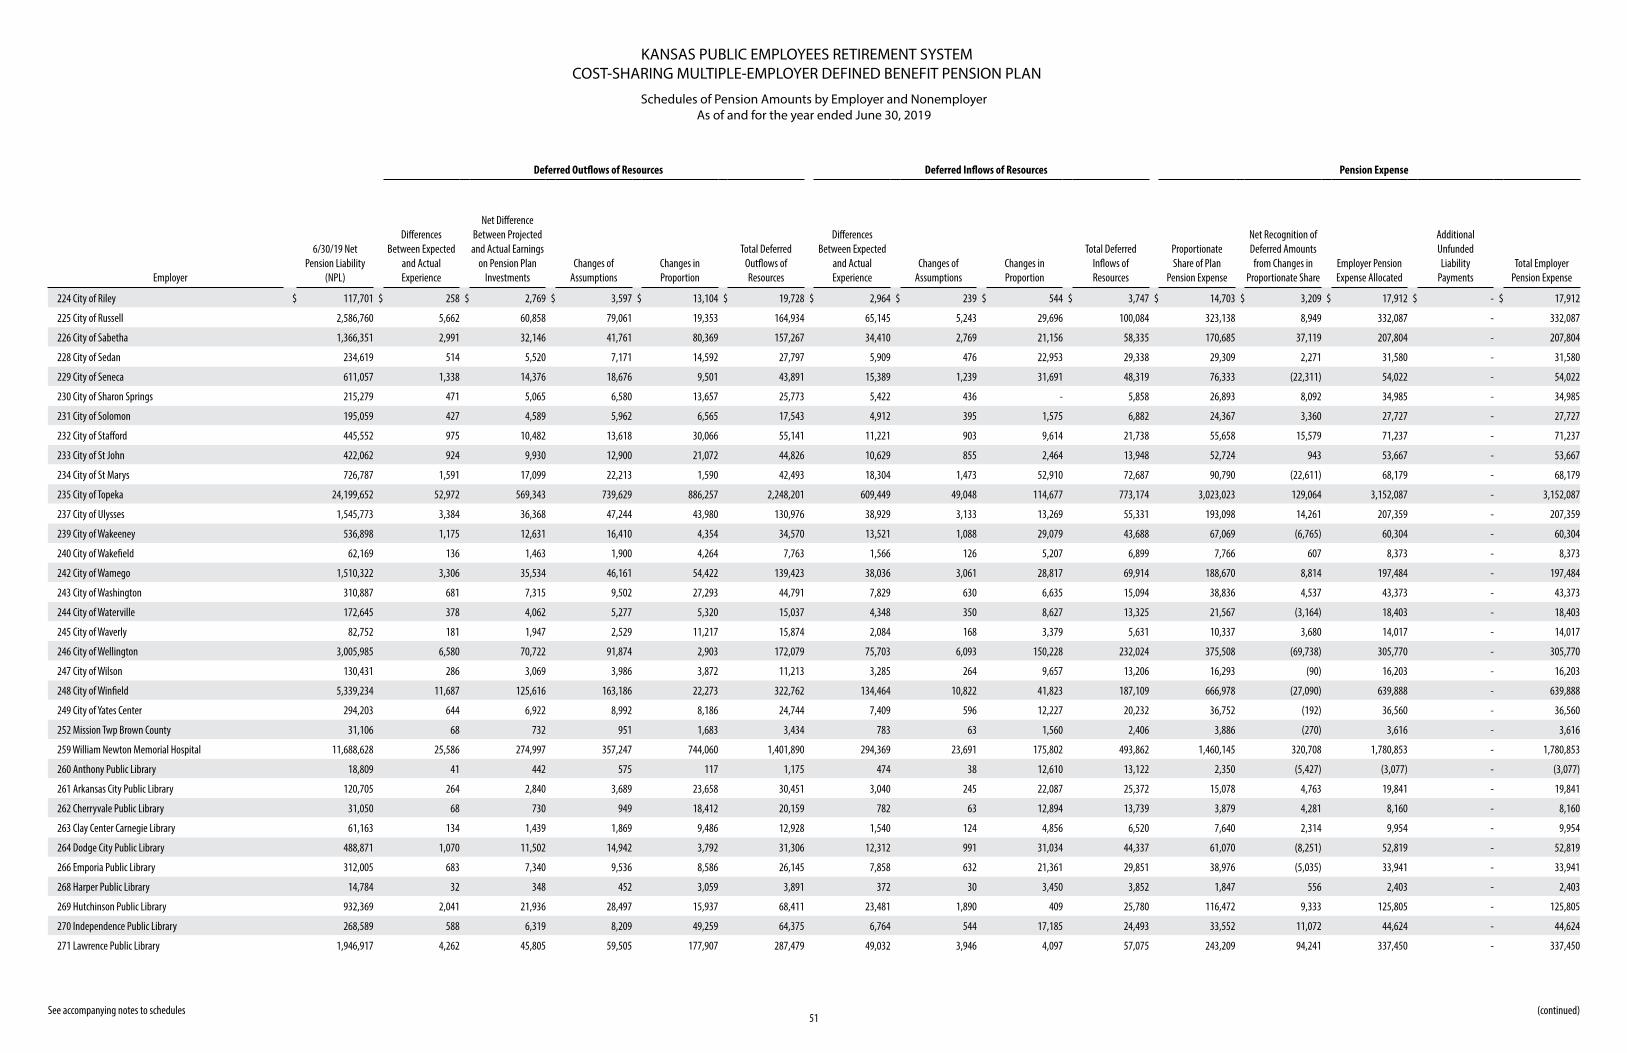
KANSAS PUBLIC EMPLOYEES RETIREMENT SYSTEMCOST-SHARING MULTIPLE-EMPLOYER DEFINED BENEFIT PENSION PLAN
Schedules of Pension Amounts by Employer and NonemployerAs of and for the year ended June 30, 2019
51 See accompanying notes to schedules
Deferred Outflows of Resources Deferred Inflows of Resources Pension Expense
Employer
6/30/19 Net Pension Liability
(NPL)
Differences Between Expected
and Actual Experience
Net Difference Between Projected and Actual Earnings
on Pension Plan Investments
Changes of Assumptions
Changes in Proportion
Total Deferred Outflows of Resources
Differences Between Expected
and Actual Experience
Changes of Assumptions
Changes in Proportion
Total Deferred Inflows of Resources
Proportionate Share of Plan
Pension Expense
Net Recognition of Deferred Amounts from Changes in
Proportionate ShareEmployer Pension Expense Allocated
Additional Unfunded Liability
PaymentsTotal Employer
Pension Expense
224 City of Riley $ 117,701 $ 258 $ 2,769 $ 3,597 $ 13,104 $ 19,728 $ 2,964 $ 239 $ 544 $ 3,747 $ 14,703 $ 3,209 $ 17,912 $ - $ 17,912
225 City of Russell 2,586,760 5,662 60,858 79,061 19,353 164,934 65,145 5,243 29,696 100,084 323,138 8,949 332,087 - 332,087
226 City of Sabetha 1,366,351 2,991 32,146 41,761 80,369 157,267 34,410 2,769 21,156 58,335 170,685 37,119 207,804 - 207,804
228 City of Sedan 234,619 514 5,520 7,171 14,592 27,797 5,909 476 22,953 29,338 29,309 2,271 31,580 - 31,580
229 City of Seneca 611,057 1,338 14,376 18,676 9,501 43,891 15,389 1,239 31,691 48,319 76,333 (22,311) 54,022 - 54,022
230 City of Sharon Springs 215,279 471 5,065 6,580 13,657 25,773 5,422 436 - 5,858 26,893 8,092 34,985 - 34,985
231 City of Solomon 195,059 427 4,589 5,962 6,565 17,543 4,912 395 1,575 6,882 24,367 3,360 27,727 - 27,727
232 City of Stafford 445,552 975 10,482 13,618 30,066 55,141 11,221 903 9,614 21,738 55,658 15,579 71,237 - 71,237
233 City of St John 422,062 924 9,930 12,900 21,072 44,826 10,629 855 2,464 13,948 52,724 943 53,667 - 53,667
234 City of St Marys 726,787 1,591 17,099 22,213 1,590 42,493 18,304 1,473 52,910 72,687 90,790 (22,611) 68,179 - 68,179
235 City of Topeka 24,199,652 52,972 569,343 739,629 886,257 2,248,201 609,449 49,048 114,677 773,174 3,023,023 129,064 3,152,087 - 3,152,087
237 City of Ulysses 1,545,773 3,384 36,368 47,244 43,980 130,976 38,929 3,133 13,269 55,331 193,098 14,261 207,359 - 207,359
239 City of Wakeeney 536,898 1,175 12,631 16,410 4,354 34,570 13,521 1,088 29,079 43,688 67,069 (6,765) 60,304 - 60,304
240 City of Wakefield 62,169 136 1,463 1,900 4,264 7,763 1,566 126 5,207 6,899 7,766 607 8,373 - 8,373
242 City of Wamego 1,510,322 3,306 35,534 46,161 54,422 139,423 38,036 3,061 28,817 69,914 188,670 8,814 197,484 - 197,484
243 City of Washington 310,887 681 7,315 9,502 27,293 44,791 7,829 630 6,635 15,094 38,836 4,537 43,373 - 43,373
244 City of Waterville 172,645 378 4,062 5,277 5,320 15,037 4,348 350 8,627 13,325 21,567 (3,164) 18,403 - 18,403
245 City of Waverly 82,752 181 1,947 2,529 11,217 15,874 2,084 168 3,379 5,631 10,337 3,680 14,017 - 14,017
246 City of Wellington 3,005,985 6,580 70,722 91,874 2,903 172,079 75,703 6,093 150,228 232,024 375,508 (69,738) 305,770 - 305,770
247 City of Wilson 130,431 286 3,069 3,986 3,872 11,213 3,285 264 9,657 13,206 16,293 (90) 16,203 - 16,203
248 City of Winfield 5,339,234 11,687 125,616 163,186 22,273 322,762 134,464 10,822 41,823 187,109 666,978 (27,090) 639,888 - 639,888
249 City of Yates Center 294,203 644 6,922 8,992 8,186 24,744 7,409 596 12,227 20,232 36,752 (192) 36,560 - 36,560
252 Mission Twp Brown County 31,106 68 732 951 1,683 3,434 783 63 1,560 2,406 3,886 (270) 3,616 - 3,616
259 William Newton Memorial Hospital 11,688,628 25,586 274,997 357,247 744,060 1,401,890 294,369 23,691 175,802 493,862 1,460,145 320,708 1,780,853 - 1,780,853
260 Anthony Public Library 18,809 41 442 575 117 1,175 474 38 12,610 13,122 2,350 (5,427) (3,077) - (3,077)
261 Arkansas City Public Library 120,705 264 2,840 3,689 23,658 30,451 3,040 245 22,087 25,372 15,078 4,763 19,841 - 19,841
262 Cherryvale Public Library 31,050 68 730 949 18,412 20,159 782 63 12,894 13,739 3,879 4,281 8,160 - 8,160
263 Clay Center Carnegie Library 61,163 134 1,439 1,869 9,486 12,928 1,540 124 4,856 6,520 7,640 2,314 9,954 - 9,954
264 Dodge City Public Library 488,871 1,070 11,502 14,942 3,792 31,306 12,312 991 31,034 44,337 61,070 (8,251) 52,819 - 52,819
266 Emporia Public Library 312,005 683 7,340 9,536 8,586 26,145 7,858 632 21,361 29,851 38,976 (5,035) 33,941 - 33,941
268 Harper Public Library 14,784 32 348 452 3,059 3,891 372 30 3,450 3,852 1,847 556 2,403 - 2,403
269 Hutchinson Public Library 932,369 2,041 21,936 28,497 15,937 68,411 23,481 1,890 409 25,780 116,472 9,333 125,805 - 125,805
270 Independence Public Library 268,589 588 6,319 8,209 49,259 64,375 6,764 544 17,185 24,493 33,552 11,072 44,624 - 44,624
271 Lawrence Public Library 1,946,917 4,262 45,805 59,505 177,907 287,479 49,032 3,946 4,097 57,075 243,209 94,241 337,450 - 337,450
(continued)
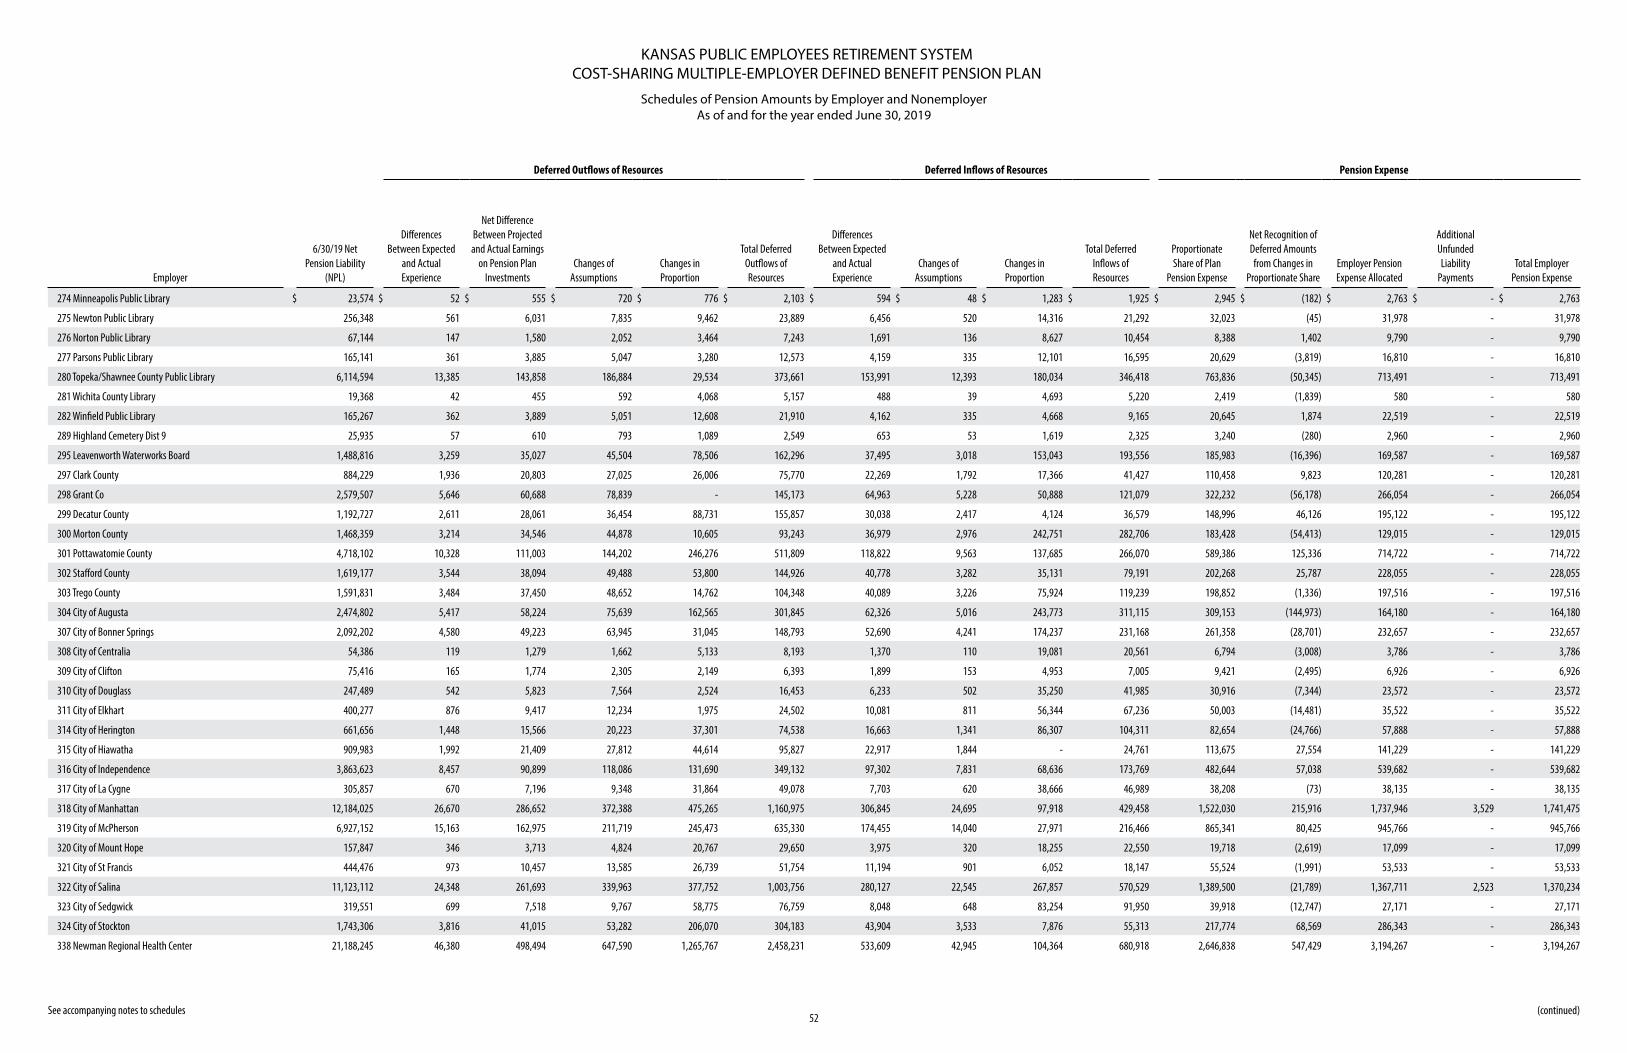
KANSAS PUBLIC EMPLOYEES RETIREMENT SYSTEMCOST-SHARING MULTIPLE-EMPLOYER DEFINED BENEFIT PENSION PLAN
Schedules of Pension Amounts by Employer and NonemployerAs of and for the year ended June 30, 2019
52 See accompanying notes to schedules
Deferred Outflows of Resources Deferred Inflows of Resources Pension Expense
Employer
6/30/19 Net Pension Liability
(NPL)
Differences Between Expected
and Actual Experience
Net Difference Between Projected and Actual Earnings
on Pension Plan Investments
Changes of Assumptions
Changes in Proportion
Total Deferred Outflows of Resources
Differences Between Expected
and Actual Experience
Changes of Assumptions
Changes in Proportion
Total Deferred Inflows of Resources
Proportionate Share of Plan
Pension Expense
Net Recognition of Deferred Amounts from Changes in
Proportionate ShareEmployer Pension Expense Allocated
Additional Unfunded Liability
PaymentsTotal Employer
Pension Expense
274 Minneapolis Public Library $ 23,574 $ 52 $ 555 $ 720 $ 776 $ 2,103 $ 594 $ 48 $ 1,283 $ 1,925 $ 2,945 $ (182) $ 2,763 $ - $ 2,763
275 Newton Public Library 256,348 561 6,031 7,835 9,462 23,889 6,456 520 14,316 21,292 32,023 (45) 31,978 - 31,978
276 Norton Public Library 67,144 147 1,580 2,052 3,464 7,243 1,691 136 8,627 10,454 8,388 1,402 9,790 - 9,790
277 Parsons Public Library 165,141 361 3,885 5,047 3,280 12,573 4,159 335 12,101 16,595 20,629 (3,819) 16,810 - 16,810
280 Topeka/Shawnee County Public Library 6,114,594 13,385 143,858 186,884 29,534 373,661 153,991 12,393 180,034 346,418 763,836 (50,345) 713,491 - 713,491
281 Wichita County Library 19,368 42 455 592 4,068 5,157 488 39 4,693 5,220 2,419 (1,839) 580 - 580
282 Winfield Public Library 165,267 362 3,889 5,051 12,608 21,910 4,162 335 4,668 9,165 20,645 1,874 22,519 - 22,519
289 Highland Cemetery Dist 9 25,935 57 610 793 1,089 2,549 653 53 1,619 2,325 3,240 (280) 2,960 - 2,960
295 Leavenworth Waterworks Board 1,488,816 3,259 35,027 45,504 78,506 162,296 37,495 3,018 153,043 193,556 185,983 (16,396) 169,587 - 169,587
297 Clark County 884,229 1,936 20,803 27,025 26,006 75,770 22,269 1,792 17,366 41,427 110,458 9,823 120,281 - 120,281
298 Grant Co 2,579,507 5,646 60,688 78,839 - 145,173 64,963 5,228 50,888 121,079 322,232 (56,178) 266,054 - 266,054
299 Decatur County 1,192,727 2,611 28,061 36,454 88,731 155,857 30,038 2,417 4,124 36,579 148,996 46,126 195,122 - 195,122
300 Morton County 1,468,359 3,214 34,546 44,878 10,605 93,243 36,979 2,976 242,751 282,706 183,428 (54,413) 129,015 - 129,015
301 Pottawatomie County 4,718,102 10,328 111,003 144,202 246,276 511,809 118,822 9,563 137,685 266,070 589,386 125,336 714,722 - 714,722
302 Stafford County 1,619,177 3,544 38,094 49,488 53,800 144,926 40,778 3,282 35,131 79,191 202,268 25,787 228,055 - 228,055
303 Trego County 1,591,831 3,484 37,450 48,652 14,762 104,348 40,089 3,226 75,924 119,239 198,852 (1,336) 197,516 - 197,516
304 City of Augusta 2,474,802 5,417 58,224 75,639 162,565 301,845 62,326 5,016 243,773 311,115 309,153 (144,973) 164,180 - 164,180
307 City of Bonner Springs 2,092,202 4,580 49,223 63,945 31,045 148,793 52,690 4,241 174,237 231,168 261,358 (28,701) 232,657 - 232,657
308 City of Centralia 54,386 119 1,279 1,662 5,133 8,193 1,370 110 19,081 20,561 6,794 (3,008) 3,786 - 3,786
309 City of Clifton 75,416 165 1,774 2,305 2,149 6,393 1,899 153 4,953 7,005 9,421 (2,495) 6,926 - 6,926
310 City of Douglass 247,489 542 5,823 7,564 2,524 16,453 6,233 502 35,250 41,985 30,916 (7,344) 23,572 - 23,572
311 City of Elkhart 400,277 876 9,417 12,234 1,975 24,502 10,081 811 56,344 67,236 50,003 (14,481) 35,522 - 35,522
314 City of Herington 661,656 1,448 15,566 20,223 37,301 74,538 16,663 1,341 86,307 104,311 82,654 (24,766) 57,888 - 57,888
315 City of Hiawatha 909,983 1,992 21,409 27,812 44,614 95,827 22,917 1,844 - 24,761 113,675 27,554 141,229 - 141,229
316 City of Independence 3,863,623 8,457 90,899 118,086 131,690 349,132 97,302 7,831 68,636 173,769 482,644 57,038 539,682 - 539,682
317 City of La Cygne 305,857 670 7,196 9,348 31,864 49,078 7,703 620 38,666 46,989 38,208 (73) 38,135 - 38,135
318 City of Manhattan 12,184,025 26,670 286,652 372,388 475,265 1,160,975 306,845 24,695 97,918 429,458 1,522,030 215,916 1,737,946 3,529 1,741,475
319 City of McPherson 6,927,152 15,163 162,975 211,719 245,473 635,330 174,455 14,040 27,971 216,466 865,341 80,425 945,766 - 945,766
320 City of Mount Hope 157,847 346 3,713 4,824 20,767 29,650 3,975 320 18,255 22,550 19,718 (2,619) 17,099 - 17,099
321 City of St Francis 444,476 973 10,457 13,585 26,739 51,754 11,194 901 6,052 18,147 55,524 (1,991) 53,533 - 53,533
322 City of Salina 11,123,112 24,348 261,693 339,963 377,752 1,003,756 280,127 22,545 267,857 570,529 1,389,500 (21,789) 1,367,711 2,523 1,370,234
323 City of Sedgwick 319,551 699 7,518 9,767 58,775 76,759 8,048 648 83,254 91,950 39,918 (12,747) 27,171 - 27,171
324 City of Stockton 1,743,306 3,816 41,015 53,282 206,070 304,183 43,904 3,533 7,876 55,313 217,774 68,569 286,343 - 286,343
338 Newman Regional Health Center 21,188,245 46,380 498,494 647,590 1,265,767 2,458,231 533,609 42,945 104,364 680,918 2,646,838 547,429 3,194,267 - 3,194,267
(continued)
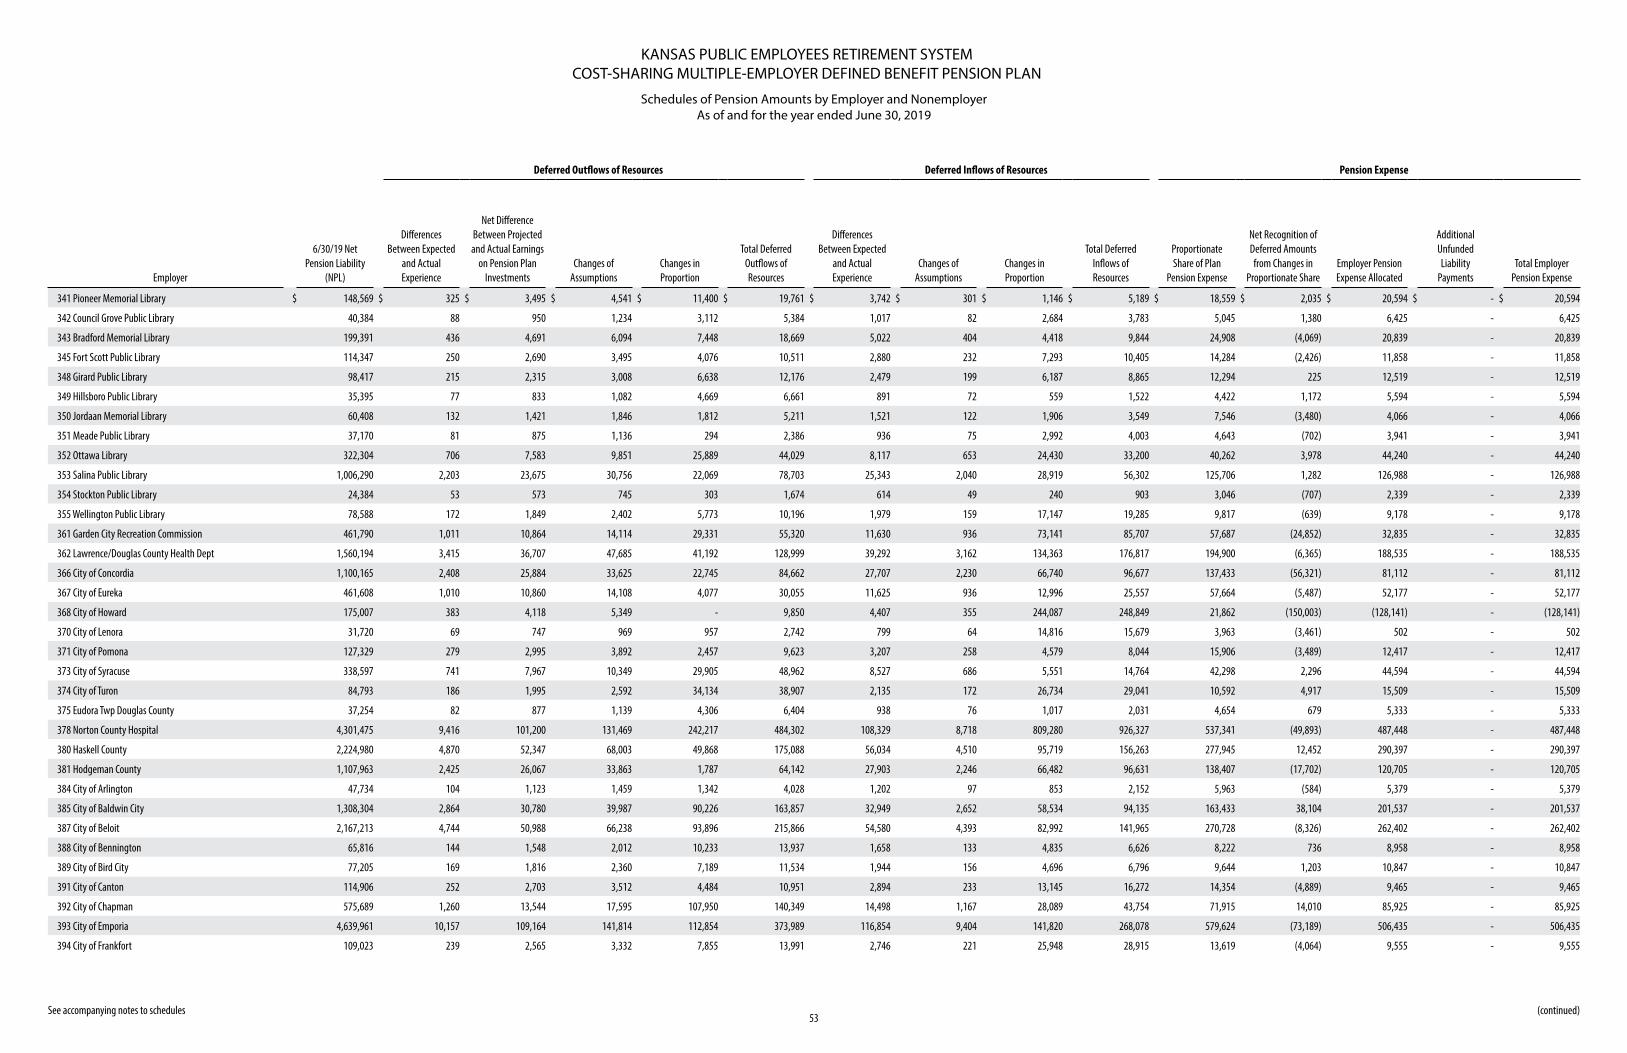
KANSAS PUBLIC EMPLOYEES RETIREMENT SYSTEMCOST-SHARING MULTIPLE-EMPLOYER DEFINED BENEFIT PENSION PLAN
Schedules of Pension Amounts by Employer and NonemployerAs of and for the year ended June 30, 2019
53 See accompanying notes to schedules
Deferred Outflows of Resources Deferred Inflows of Resources Pension Expense
Employer
6/30/19 Net Pension Liability
(NPL)
Differences Between Expected
and Actual Experience
Net Difference Between Projected and Actual Earnings
on Pension Plan Investments
Changes of Assumptions
Changes in Proportion
Total Deferred Outflows of Resources
Differences Between Expected
and Actual Experience
Changes of Assumptions
Changes in Proportion
Total Deferred Inflows of Resources
Proportionate Share of Plan
Pension Expense
Net Recognition of Deferred Amounts from Changes in
Proportionate ShareEmployer Pension Expense Allocated
Additional Unfunded Liability
PaymentsTotal Employer
Pension Expense
341 Pioneer Memorial Library $ 148,569 $ 325 $ 3,495 $ 4,541 $ 11,400 $ 19,761 $ 3,742 $ 301 $ 1,146 $ 5,189 $ 18,559 $ 2,035 $ 20,594 $ - $ 20,594
342 Council Grove Public Library 40,384 88 950 1,234 3,112 5,384 1,017 82 2,684 3,783 5,045 1,380 6,425 - 6,425
343 Bradford Memorial Library 199,391 436 4,691 6,094 7,448 18,669 5,022 404 4,418 9,844 24,908 (4,069) 20,839 - 20,839
345 Fort Scott Public Library 114,347 250 2,690 3,495 4,076 10,511 2,880 232 7,293 10,405 14,284 (2,426) 11,858 - 11,858
348 Girard Public Library 98,417 215 2,315 3,008 6,638 12,176 2,479 199 6,187 8,865 12,294 225 12,519 - 12,519
349 Hillsboro Public Library 35,395 77 833 1,082 4,669 6,661 891 72 559 1,522 4,422 1,172 5,594 - 5,594
350 Jordaan Memorial Library 60,408 132 1,421 1,846 1,812 5,211 1,521 122 1,906 3,549 7,546 (3,480) 4,066 - 4,066
351 Meade Public Library 37,170 81 875 1,136 294 2,386 936 75 2,992 4,003 4,643 (702) 3,941 - 3,941
352 Ottawa Library 322,304 706 7,583 9,851 25,889 44,029 8,117 653 24,430 33,200 40,262 3,978 44,240 - 44,240
353 Salina Public Library 1,006,290 2,203 23,675 30,756 22,069 78,703 25,343 2,040 28,919 56,302 125,706 1,282 126,988 - 126,988
354 Stockton Public Library 24,384 53 573 745 303 1,674 614 49 240 903 3,046 (707) 2,339 - 2,339
355 Wellington Public Library 78,588 172 1,849 2,402 5,773 10,196 1,979 159 17,147 19,285 9,817 (639) 9,178 - 9,178
361 Garden City Recreation Commission 461,790 1,011 10,864 14,114 29,331 55,320 11,630 936 73,141 85,707 57,687 (24,852) 32,835 - 32,835
362 Lawrence/Douglas County Health Dept 1,560,194 3,415 36,707 47,685 41,192 128,999 39,292 3,162 134,363 176,817 194,900 (6,365) 188,535 - 188,535
366 City of Concordia 1,100,165 2,408 25,884 33,625 22,745 84,662 27,707 2,230 66,740 96,677 137,433 (56,321) 81,112 - 81,112
367 City of Eureka 461,608 1,010 10,860 14,108 4,077 30,055 11,625 936 12,996 25,557 57,664 (5,487) 52,177 - 52,177
368 City of Howard 175,007 383 4,118 5,349 - 9,850 4,407 355 244,087 248,849 21,862 (150,003) (128,141) - (128,141)
370 City of Lenora 31,720 69 747 969 957 2,742 799 64 14,816 15,679 3,963 (3,461) 502 - 502
371 City of Pomona 127,329 279 2,995 3,892 2,457 9,623 3,207 258 4,579 8,044 15,906 (3,489) 12,417 - 12,417
373 City of Syracuse 338,597 741 7,967 10,349 29,905 48,962 8,527 686 5,551 14,764 42,298 2,296 44,594 - 44,594
374 City of Turon 84,793 186 1,995 2,592 34,134 38,907 2,135 172 26,734 29,041 10,592 4,917 15,509 - 15,509
375 Eudora Twp Douglas County 37,254 82 877 1,139 4,306 6,404 938 76 1,017 2,031 4,654 679 5,333 - 5,333
378 Norton County Hospital 4,301,475 9,416 101,200 131,469 242,217 484,302 108,329 8,718 809,280 926,327 537,341 (49,893) 487,448 - 487,448
380 Haskell County 2,224,980 4,870 52,347 68,003 49,868 175,088 56,034 4,510 95,719 156,263 277,945 12,452 290,397 - 290,397
381 Hodgeman County 1,107,963 2,425 26,067 33,863 1,787 64,142 27,903 2,246 66,482 96,631 138,407 (17,702) 120,705 - 120,705
384 City of Arlington 47,734 104 1,123 1,459 1,342 4,028 1,202 97 853 2,152 5,963 (584) 5,379 - 5,379
385 City of Baldwin City 1,308,304 2,864 30,780 39,987 90,226 163,857 32,949 2,652 58,534 94,135 163,433 38,104 201,537 - 201,537
387 City of Beloit 2,167,213 4,744 50,988 66,238 93,896 215,866 54,580 4,393 82,992 141,965 270,728 (8,326) 262,402 - 262,402
388 City of Bennington 65,816 144 1,548 2,012 10,233 13,937 1,658 133 4,835 6,626 8,222 736 8,958 - 8,958
389 City of Bird City 77,205 169 1,816 2,360 7,189 11,534 1,944 156 4,696 6,796 9,644 1,203 10,847 - 10,847
391 City of Canton 114,906 252 2,703 3,512 4,484 10,951 2,894 233 13,145 16,272 14,354 (4,889) 9,465 - 9,465
392 City of Chapman 575,689 1,260 13,544 17,595 107,950 140,349 14,498 1,167 28,089 43,754 71,915 14,010 85,925 - 85,925
393 City of Emporia 4,639,961 10,157 109,164 141,814 112,854 373,989 116,854 9,404 141,820 268,078 579,624 (73,189) 506,435 - 506,435
394 City of Frankfort 109,023 239 2,565 3,332 7,855 13,991 2,746 221 25,948 28,915 13,619 (4,064) 9,555 - 9,555
(continued)
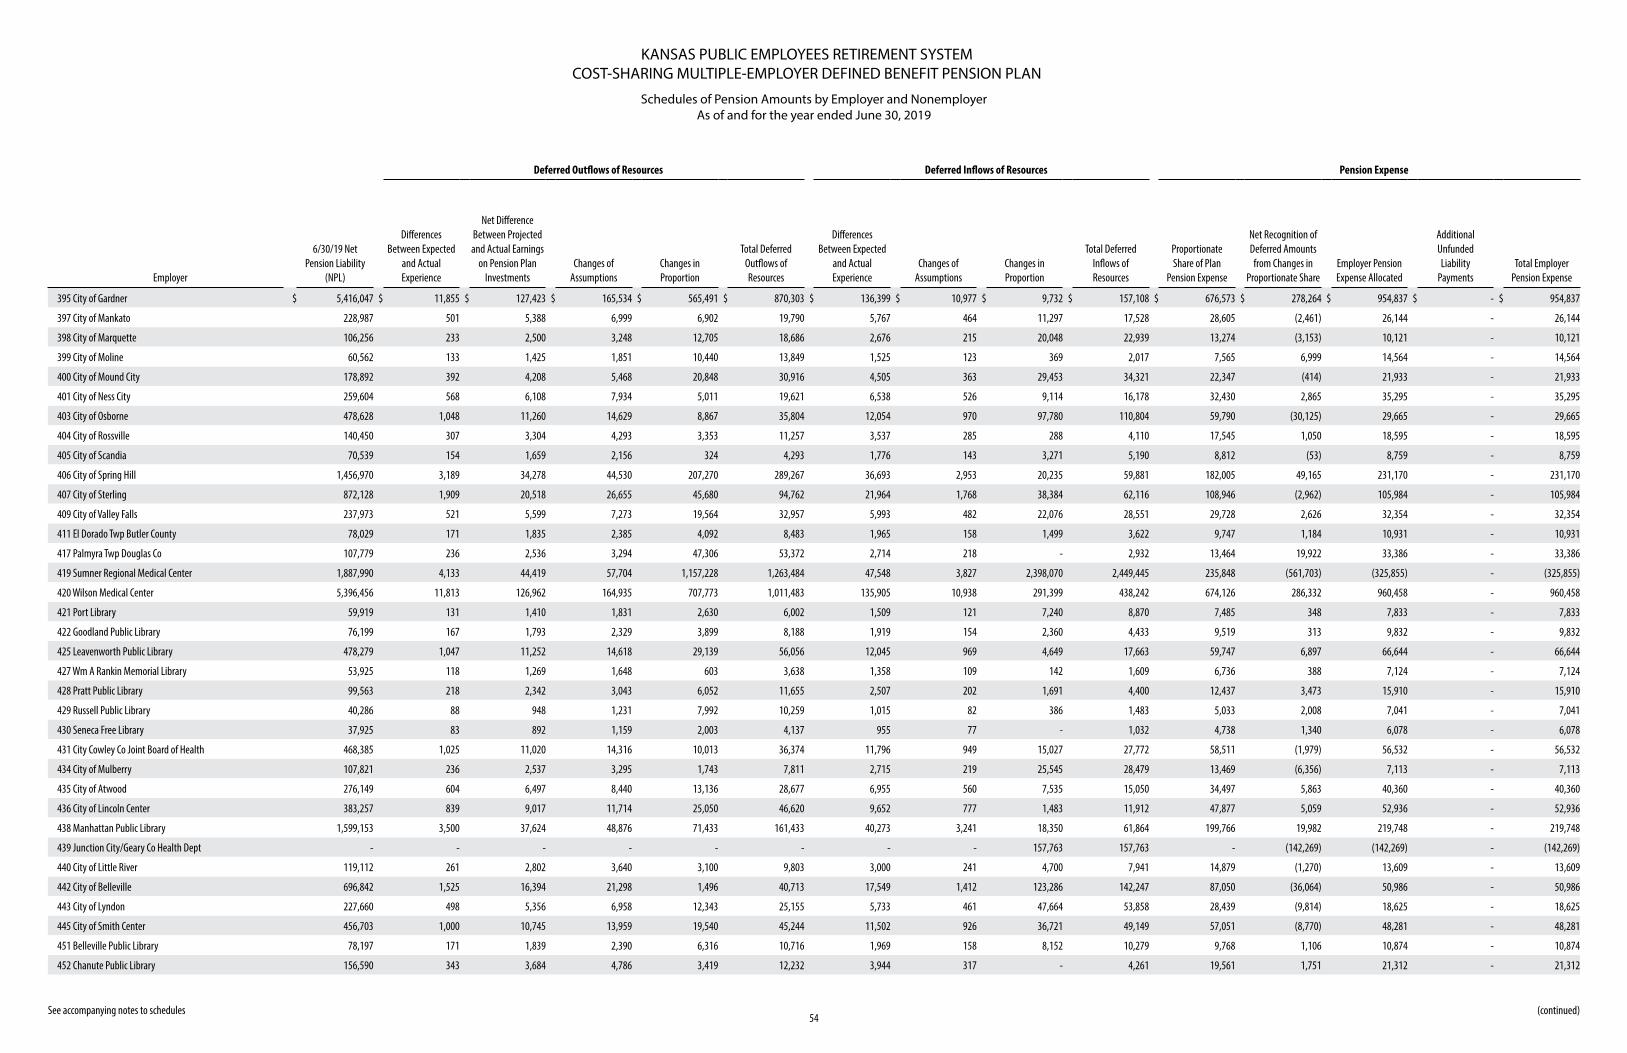
KANSAS PUBLIC EMPLOYEES RETIREMENT SYSTEMCOST-SHARING MULTIPLE-EMPLOYER DEFINED BENEFIT PENSION PLAN
Schedules of Pension Amounts by Employer and NonemployerAs of and for the year ended June 30, 2019
54 See accompanying notes to schedules
Deferred Outflows of Resources Deferred Inflows of Resources Pension Expense
Employer
6/30/19 Net Pension Liability
(NPL)
Differences Between Expected
and Actual Experience
Net Difference Between Projected and Actual Earnings
on Pension Plan Investments
Changes of Assumptions
Changes in Proportion
Total Deferred Outflows of Resources
Differences Between Expected
and Actual Experience
Changes of Assumptions
Changes in Proportion
Total Deferred Inflows of Resources
Proportionate Share of Plan
Pension Expense
Net Recognition of Deferred Amounts from Changes in
Proportionate ShareEmployer Pension Expense Allocated
Additional Unfunded Liability
PaymentsTotal Employer
Pension Expense
395 City of Gardner $ 5,416,047 $ 11,855 $ 127,423 $ 165,534 $ 565,491 $ 870,303 $ 136,399 $ 10,977 $ 9,732 $ 157,108 $ 676,573 $ 278,264 $ 954,837 $ - $ 954,837
397 City of Mankato 228,987 501 5,388 6,999 6,902 19,790 5,767 464 11,297 17,528 28,605 (2,461) 26,144 - 26,144
398 City of Marquette 106,256 233 2,500 3,248 12,705 18,686 2,676 215 20,048 22,939 13,274 (3,153) 10,121 - 10,121
399 City of Moline 60,562 133 1,425 1,851 10,440 13,849 1,525 123 369 2,017 7,565 6,999 14,564 - 14,564
400 City of Mound City 178,892 392 4,208 5,468 20,848 30,916 4,505 363 29,453 34,321 22,347 (414) 21,933 - 21,933
401 City of Ness City 259,604 568 6,108 7,934 5,011 19,621 6,538 526 9,114 16,178 32,430 2,865 35,295 - 35,295
403 City of Osborne 478,628 1,048 11,260 14,629 8,867 35,804 12,054 970 97,780 110,804 59,790 (30,125) 29,665 - 29,665
404 City of Rossville 140,450 307 3,304 4,293 3,353 11,257 3,537 285 288 4,110 17,545 1,050 18,595 - 18,595
405 City of Scandia 70,539 154 1,659 2,156 324 4,293 1,776 143 3,271 5,190 8,812 (53) 8,759 - 8,759
406 City of Spring Hill 1,456,970 3,189 34,278 44,530 207,270 289,267 36,693 2,953 20,235 59,881 182,005 49,165 231,170 - 231,170
407 City of Sterling 872,128 1,909 20,518 26,655 45,680 94,762 21,964 1,768 38,384 62,116 108,946 (2,962) 105,984 - 105,984
409 City of Valley Falls 237,973 521 5,599 7,273 19,564 32,957 5,993 482 22,076 28,551 29,728 2,626 32,354 - 32,354
411 El Dorado Twp Butler County 78,029 171 1,835 2,385 4,092 8,483 1,965 158 1,499 3,622 9,747 1,184 10,931 - 10,931
417 Palmyra Twp Douglas Co 107,779 236 2,536 3,294 47,306 53,372 2,714 218 - 2,932 13,464 19,922 33,386 - 33,386
419 Sumner Regional Medical Center 1,887,990 4,133 44,419 57,704 1,157,228 1,263,484 47,548 3,827 2,398,070 2,449,445 235,848 (561,703) (325,855) - (325,855)
420 Wilson Medical Center 5,396,456 11,813 126,962 164,935 707,773 1,011,483 135,905 10,938 291,399 438,242 674,126 286,332 960,458 - 960,458
421 Port Library 59,919 131 1,410 1,831 2,630 6,002 1,509 121 7,240 8,870 7,485 348 7,833 - 7,833
422 Goodland Public Library 76,199 167 1,793 2,329 3,899 8,188 1,919 154 2,360 4,433 9,519 313 9,832 - 9,832
425 Leavenworth Public Library 478,279 1,047 11,252 14,618 29,139 56,056 12,045 969 4,649 17,663 59,747 6,897 66,644 - 66,644
427 Wm A Rankin Memorial Library 53,925 118 1,269 1,648 603 3,638 1,358 109 142 1,609 6,736 388 7,124 - 7,124
428 Pratt Public Library 99,563 218 2,342 3,043 6,052 11,655 2,507 202 1,691 4,400 12,437 3,473 15,910 - 15,910
429 Russell Public Library 40,286 88 948 1,231 7,992 10,259 1,015 82 386 1,483 5,033 2,008 7,041 - 7,041
430 Seneca Free Library 37,925 83 892 1,159 2,003 4,137 955 77 - 1,032 4,738 1,340 6,078 - 6,078
431 City Cowley Co Joint Board of Health 468,385 1,025 11,020 14,316 10,013 36,374 11,796 949 15,027 27,772 58,511 (1,979) 56,532 - 56,532
434 City of Mulberry 107,821 236 2,537 3,295 1,743 7,811 2,715 219 25,545 28,479 13,469 (6,356) 7,113 - 7,113
435 City of Atwood 276,149 604 6,497 8,440 13,136 28,677 6,955 560 7,535 15,050 34,497 5,863 40,360 - 40,360
436 City of Lincoln Center 383,257 839 9,017 11,714 25,050 46,620 9,652 777 1,483 11,912 47,877 5,059 52,936 - 52,936
438 Manhattan Public Library 1,599,153 3,500 37,624 48,876 71,433 161,433 40,273 3,241 18,350 61,864 199,766 19,982 219,748 - 219,748
439 Junction City/Geary Co Health Dept - - - - - - - - 157,763 157,763 - (142,269) (142,269) - (142,269)
440 City of Little River 119,112 261 2,802 3,640 3,100 9,803 3,000 241 4,700 7,941 14,879 (1,270) 13,609 - 13,609
442 City of Belleville 696,842 1,525 16,394 21,298 1,496 40,713 17,549 1,412 123,286 142,247 87,050 (36,064) 50,986 - 50,986
443 City of Lyndon 227,660 498 5,356 6,958 12,343 25,155 5,733 461 47,664 53,858 28,439 (9,814) 18,625 - 18,625
445 City of Smith Center 456,703 1,000 10,745 13,959 19,540 45,244 11,502 926 36,721 49,149 57,051 (8,770) 48,281 - 48,281
451 Belleville Public Library 78,197 171 1,839 2,390 6,316 10,716 1,969 158 8,152 10,279 9,768 1,106 10,874 - 10,874
452 Chanute Public Library 156,590 343 3,684 4,786 3,419 12,232 3,944 317 - 4,261 19,561 1,751 21,312 - 21,312
(continued)
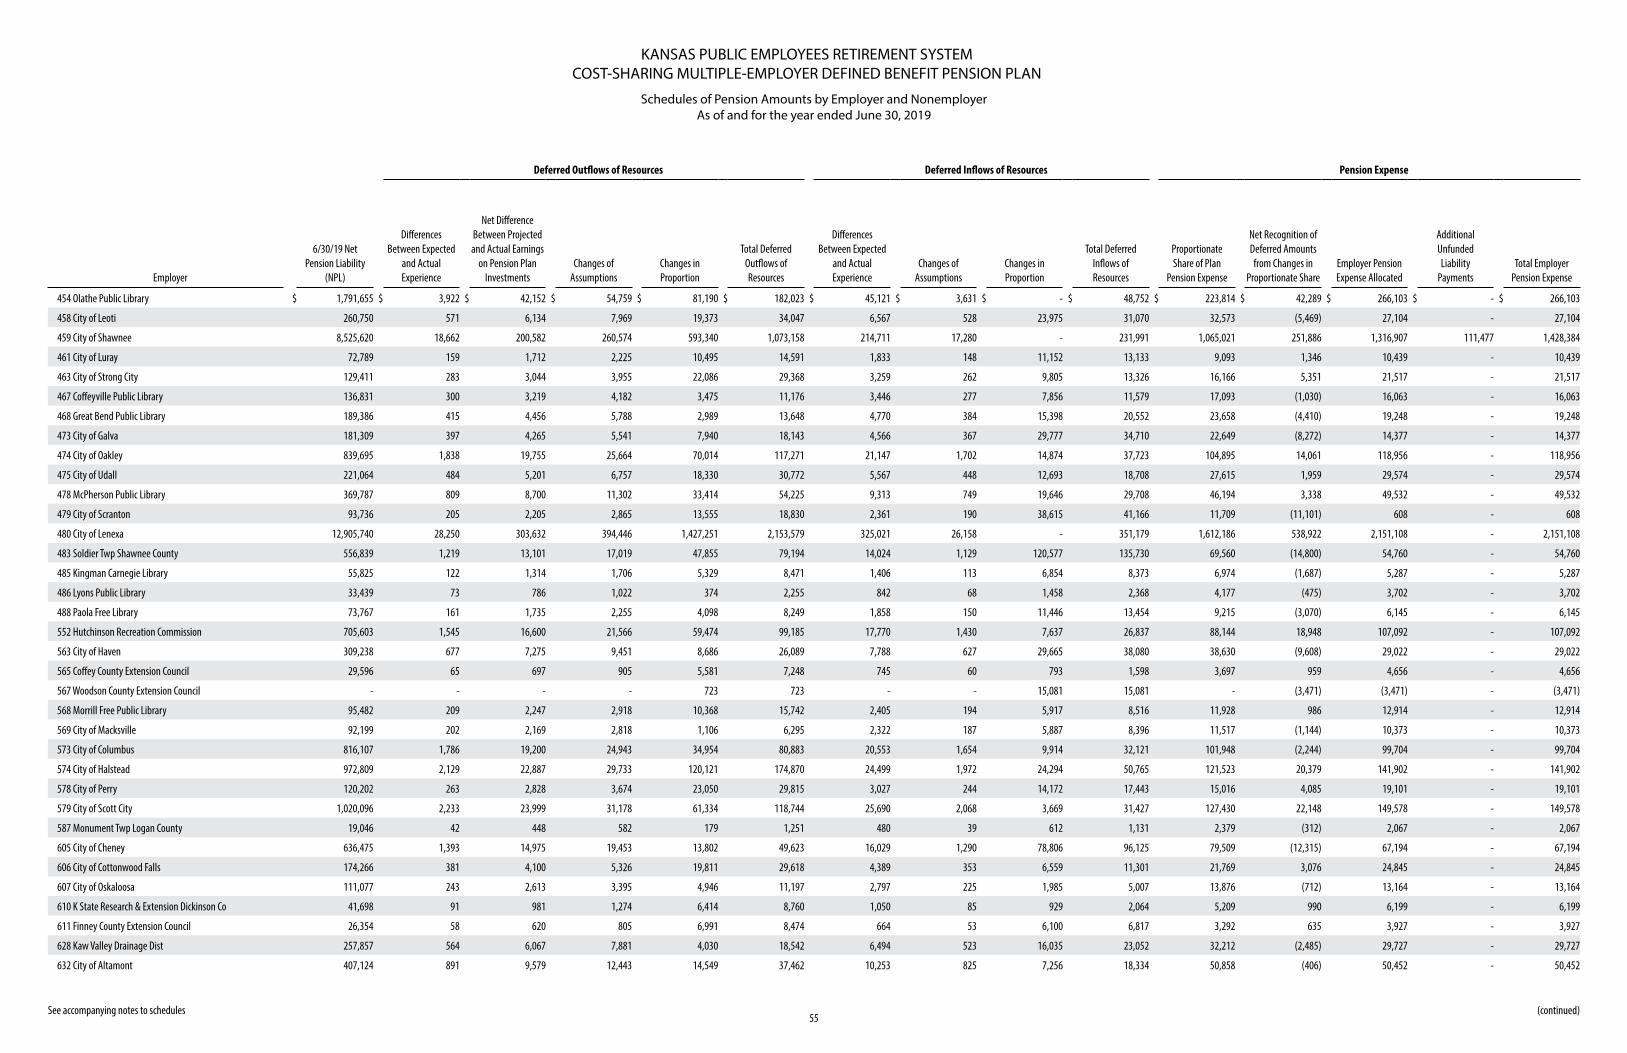
KANSAS PUBLIC EMPLOYEES RETIREMENT SYSTEMCOST-SHARING MULTIPLE-EMPLOYER DEFINED BENEFIT PENSION PLAN
Schedules of Pension Amounts by Employer and NonemployerAs of and for the year ended June 30, 2019
55 See accompanying notes to schedules
Deferred Outflows of Resources Deferred Inflows of Resources Pension Expense
Employer
6/30/19 Net Pension Liability
(NPL)
Differences Between Expected
and Actual Experience
Net Difference Between Projected and Actual Earnings
on Pension Plan Investments
Changes of Assumptions
Changes in Proportion
Total Deferred Outflows of Resources
Differences Between Expected
and Actual Experience
Changes of Assumptions
Changes in Proportion
Total Deferred Inflows of Resources
Proportionate Share of Plan
Pension Expense
Net Recognition of Deferred Amounts from Changes in
Proportionate ShareEmployer Pension Expense Allocated
Additional Unfunded Liability
PaymentsTotal Employer
Pension Expense
454 Olathe Public Library $ 1,791,655 $ 3,922 $ 42,152 $ 54,759 $ 81,190 $ 182,023 $ 45,121 $ 3,631 $ - $ 48,752 $ 223,814 $ 42,289 $ 266,103 $ - $ 266,103
458 City of Leoti 260,750 571 6,134 7,969 19,373 34,047 6,567 528 23,975 31,070 32,573 (5,469) 27,104 - 27,104
459 City of Shawnee 8,525,620 18,662 200,582 260,574 593,340 1,073,158 214,711 17,280 - 231,991 1,065,021 251,886 1,316,907 111,477 1,428,384
461 City of Luray 72,789 159 1,712 2,225 10,495 14,591 1,833 148 11,152 13,133 9,093 1,346 10,439 - 10,439
463 City of Strong City 129,411 283 3,044 3,955 22,086 29,368 3,259 262 9,805 13,326 16,166 5,351 21,517 - 21,517
467 Coffeyville Public Library 136,831 300 3,219 4,182 3,475 11,176 3,446 277 7,856 11,579 17,093 (1,030) 16,063 - 16,063
468 Great Bend Public Library 189,386 415 4,456 5,788 2,989 13,648 4,770 384 15,398 20,552 23,658 (4,410) 19,248 - 19,248
473 City of Galva 181,309 397 4,265 5,541 7,940 18,143 4,566 367 29,777 34,710 22,649 (8,272) 14,377 - 14,377
474 City of Oakley 839,695 1,838 19,755 25,664 70,014 117,271 21,147 1,702 14,874 37,723 104,895 14,061 118,956 - 118,956
475 City of Udall 221,064 484 5,201 6,757 18,330 30,772 5,567 448 12,693 18,708 27,615 1,959 29,574 - 29,574
478 McPherson Public Library 369,787 809 8,700 11,302 33,414 54,225 9,313 749 19,646 29,708 46,194 3,338 49,532 - 49,532
479 City of Scranton 93,736 205 2,205 2,865 13,555 18,830 2,361 190 38,615 41,166 11,709 (11,101) 608 - 608
480 City of Lenexa 12,905,740 28,250 303,632 394,446 1,427,251 2,153,579 325,021 26,158 - 351,179 1,612,186 538,922 2,151,108 - 2,151,108
483 Soldier Twp Shawnee County 556,839 1,219 13,101 17,019 47,855 79,194 14,024 1,129 120,577 135,730 69,560 (14,800) 54,760 - 54,760
485 Kingman Carnegie Library 55,825 122 1,314 1,706 5,329 8,471 1,406 113 6,854 8,373 6,974 (1,687) 5,287 - 5,287
486 Lyons Public Library 33,439 73 786 1,022 374 2,255 842 68 1,458 2,368 4,177 (475) 3,702 - 3,702
488 Paola Free Library 73,767 161 1,735 2,255 4,098 8,249 1,858 150 11,446 13,454 9,215 (3,070) 6,145 - 6,145
552 Hutchinson Recreation Commission 705,603 1,545 16,600 21,566 59,474 99,185 17,770 1,430 7,637 26,837 88,144 18,948 107,092 - 107,092
563 City of Haven 309,238 677 7,275 9,451 8,686 26,089 7,788 627 29,665 38,080 38,630 (9,608) 29,022 - 29,022
565 Coffey County Extension Council 29,596 65 697 905 5,581 7,248 745 60 793 1,598 3,697 959 4,656 - 4,656
567 Woodson County Extension Council - - - - 723 723 - - 15,081 15,081 - (3,471) (3,471) - (3,471)
568 Morrill Free Public Library 95,482 209 2,247 2,918 10,368 15,742 2,405 194 5,917 8,516 11,928 986 12,914 - 12,914
569 City of Macksville 92,199 202 2,169 2,818 1,106 6,295 2,322 187 5,887 8,396 11,517 (1,144) 10,373 - 10,373
573 City of Columbus 816,107 1,786 19,200 24,943 34,954 80,883 20,553 1,654 9,914 32,121 101,948 (2,244) 99,704 - 99,704
574 City of Halstead 972,809 2,129 22,887 29,733 120,121 174,870 24,499 1,972 24,294 50,765 121,523 20,379 141,902 - 141,902
578 City of Perry 120,202 263 2,828 3,674 23,050 29,815 3,027 244 14,172 17,443 15,016 4,085 19,101 - 19,101
579 City of Scott City 1,020,096 2,233 23,999 31,178 61,334 118,744 25,690 2,068 3,669 31,427 127,430 22,148 149,578 - 149,578
587 Monument Twp Logan County 19,046 42 448 582 179 1,251 480 39 612 1,131 2,379 (312) 2,067 - 2,067
605 City of Cheney 636,475 1,393 14,975 19,453 13,802 49,623 16,029 1,290 78,806 96,125 79,509 (12,315) 67,194 - 67,194
606 City of Cottonwood Falls 174,266 381 4,100 5,326 19,811 29,618 4,389 353 6,559 11,301 21,769 3,076 24,845 - 24,845
607 City of Oskaloosa 111,077 243 2,613 3,395 4,946 11,197 2,797 225 1,985 5,007 13,876 (712) 13,164 - 13,164
610 K State Research & Extension Dickinson Co 41,698 91 981 1,274 6,414 8,760 1,050 85 929 2,064 5,209 990 6,199 - 6,199
611 Finney County Extension Council 26,354 58 620 805 6,991 8,474 664 53 6,100 6,817 3,292 635 3,927 - 3,927
628 Kaw Valley Drainage Dist 257,857 564 6,067 7,881 4,030 18,542 6,494 523 16,035 23,052 32,212 (2,485) 29,727 - 29,727
632 City of Altamont 407,124 891 9,579 12,443 14,549 37,462 10,253 825 7,256 18,334 50,858 (406) 50,452 - 50,452
(continued)
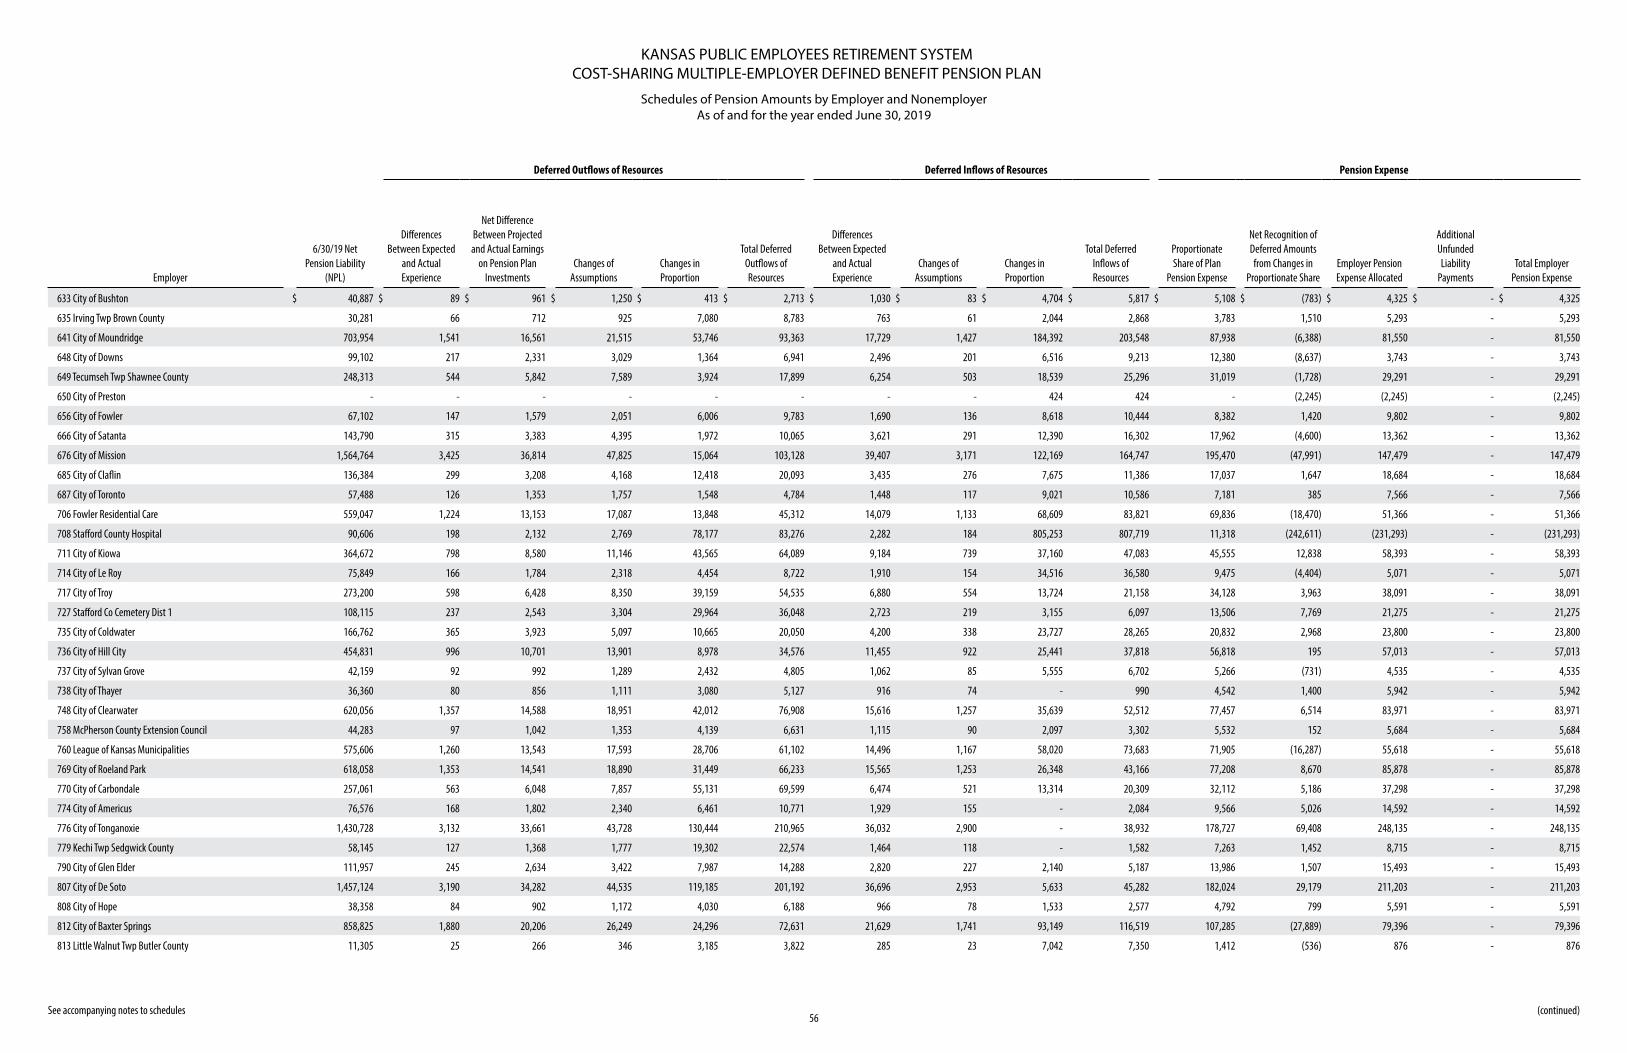
KANSAS PUBLIC EMPLOYEES RETIREMENT SYSTEMCOST-SHARING MULTIPLE-EMPLOYER DEFINED BENEFIT PENSION PLAN
Schedules of Pension Amounts by Employer and NonemployerAs of and for the year ended June 30, 2019
56 See accompanying notes to schedules
Deferred Outflows of Resources Deferred Inflows of Resources Pension Expense
Employer
6/30/19 Net Pension Liability
(NPL)
Differences Between Expected
and Actual Experience
Net Difference Between Projected and Actual Earnings
on Pension Plan Investments
Changes of Assumptions
Changes in Proportion
Total Deferred Outflows of Resources
Differences Between Expected
and Actual Experience
Changes of Assumptions
Changes in Proportion
Total Deferred Inflows of Resources
Proportionate Share of Plan
Pension Expense
Net Recognition of Deferred Amounts from Changes in
Proportionate ShareEmployer Pension Expense Allocated
Additional Unfunded Liability
PaymentsTotal Employer
Pension Expense
633 City of Bushton $ 40,887 $ 89 $ 961 $ 1,250 $ 413 $ 2,713 $ 1,030 $ 83 $ 4,704 $ 5,817 $ 5,108 $ (783) $ 4,325 $ - $ 4,325
635 Irving Twp Brown County 30,281 66 712 925 7,080 8,783 763 61 2,044 2,868 3,783 1,510 5,293 - 5,293
641 City of Moundridge 703,954 1,541 16,561 21,515 53,746 93,363 17,729 1,427 184,392 203,548 87,938 (6,388) 81,550 - 81,550
648 City of Downs 99,102 217 2,331 3,029 1,364 6,941 2,496 201 6,516 9,213 12,380 (8,637) 3,743 - 3,743
649 Tecumseh Twp Shawnee County 248,313 544 5,842 7,589 3,924 17,899 6,254 503 18,539 25,296 31,019 (1,728) 29,291 - 29,291
650 City of Preston - - - - - - - - 424 424 - (2,245) (2,245) - (2,245)
656 City of Fowler 67,102 147 1,579 2,051 6,006 9,783 1,690 136 8,618 10,444 8,382 1,420 9,802 - 9,802
666 City of Satanta 143,790 315 3,383 4,395 1,972 10,065 3,621 291 12,390 16,302 17,962 (4,600) 13,362 - 13,362
676 City of Mission 1,564,764 3,425 36,814 47,825 15,064 103,128 39,407 3,171 122,169 164,747 195,470 (47,991) 147,479 - 147,479
685 City of Claflin 136,384 299 3,208 4,168 12,418 20,093 3,435 276 7,675 11,386 17,037 1,647 18,684 - 18,684
687 City of Toronto 57,488 126 1,353 1,757 1,548 4,784 1,448 117 9,021 10,586 7,181 385 7,566 - 7,566
706 Fowler Residential Care 559,047 1,224 13,153 17,087 13,848 45,312 14,079 1,133 68,609 83,821 69,836 (18,470) 51,366 - 51,366
708 Stafford County Hospital 90,606 198 2,132 2,769 78,177 83,276 2,282 184 805,253 807,719 11,318 (242,611) (231,293) - (231,293)
711 City of Kiowa 364,672 798 8,580 11,146 43,565 64,089 9,184 739 37,160 47,083 45,555 12,838 58,393 - 58,393
714 City of Le Roy 75,849 166 1,784 2,318 4,454 8,722 1,910 154 34,516 36,580 9,475 (4,404) 5,071 - 5,071
717 City of Troy 273,200 598 6,428 8,350 39,159 54,535 6,880 554 13,724 21,158 34,128 3,963 38,091 - 38,091
727 Stafford Co Cemetery Dist 1 108,115 237 2,543 3,304 29,964 36,048 2,723 219 3,155 6,097 13,506 7,769 21,275 - 21,275
735 City of Coldwater 166,762 365 3,923 5,097 10,665 20,050 4,200 338 23,727 28,265 20,832 2,968 23,800 - 23,800
736 City of Hill City 454,831 996 10,701 13,901 8,978 34,576 11,455 922 25,441 37,818 56,818 195 57,013 - 57,013
737 City of Sylvan Grove 42,159 92 992 1,289 2,432 4,805 1,062 85 5,555 6,702 5,266 (731) 4,535 - 4,535
738 City of Thayer 36,360 80 856 1,111 3,080 5,127 916 74 - 990 4,542 1,400 5,942 - 5,942
748 City of Clearwater 620,056 1,357 14,588 18,951 42,012 76,908 15,616 1,257 35,639 52,512 77,457 6,514 83,971 - 83,971
758 McPherson County Extension Council 44,283 97 1,042 1,353 4,139 6,631 1,115 90 2,097 3,302 5,532 152 5,684 - 5,684
760 League of Kansas Municipalities 575,606 1,260 13,543 17,593 28,706 61,102 14,496 1,167 58,020 73,683 71,905 (16,287) 55,618 - 55,618
769 City of Roeland Park 618,058 1,353 14,541 18,890 31,449 66,233 15,565 1,253 26,348 43,166 77,208 8,670 85,878 - 85,878
770 City of Carbondale 257,061 563 6,048 7,857 55,131 69,599 6,474 521 13,314 20,309 32,112 5,186 37,298 - 37,298
774 City of Americus 76,576 168 1,802 2,340 6,461 10,771 1,929 155 - 2,084 9,566 5,026 14,592 - 14,592
776 City of Tonganoxie 1,430,728 3,132 33,661 43,728 130,444 210,965 36,032 2,900 - 38,932 178,727 69,408 248,135 - 248,135
779 Kechi Twp Sedgwick County 58,145 127 1,368 1,777 19,302 22,574 1,464 118 - 1,582 7,263 1,452 8,715 - 8,715
790 City of Glen Elder 111,957 245 2,634 3,422 7,987 14,288 2,820 227 2,140 5,187 13,986 1,507 15,493 - 15,493
807 City of De Soto 1,457,124 3,190 34,282 44,535 119,185 201,192 36,696 2,953 5,633 45,282 182,024 29,179 211,203 - 211,203
808 City of Hope 38,358 84 902 1,172 4,030 6,188 966 78 1,533 2,577 4,792 799 5,591 - 5,591
812 City of Baxter Springs 858,825 1,880 20,206 26,249 24,296 72,631 21,629 1,741 93,149 116,519 107,285 (27,889) 79,396 - 79,396
813 Little Walnut Twp Butler County 11,305 25 266 346 3,185 3,822 285 23 7,042 7,350 1,412 (536) 876 - 876
(continued)
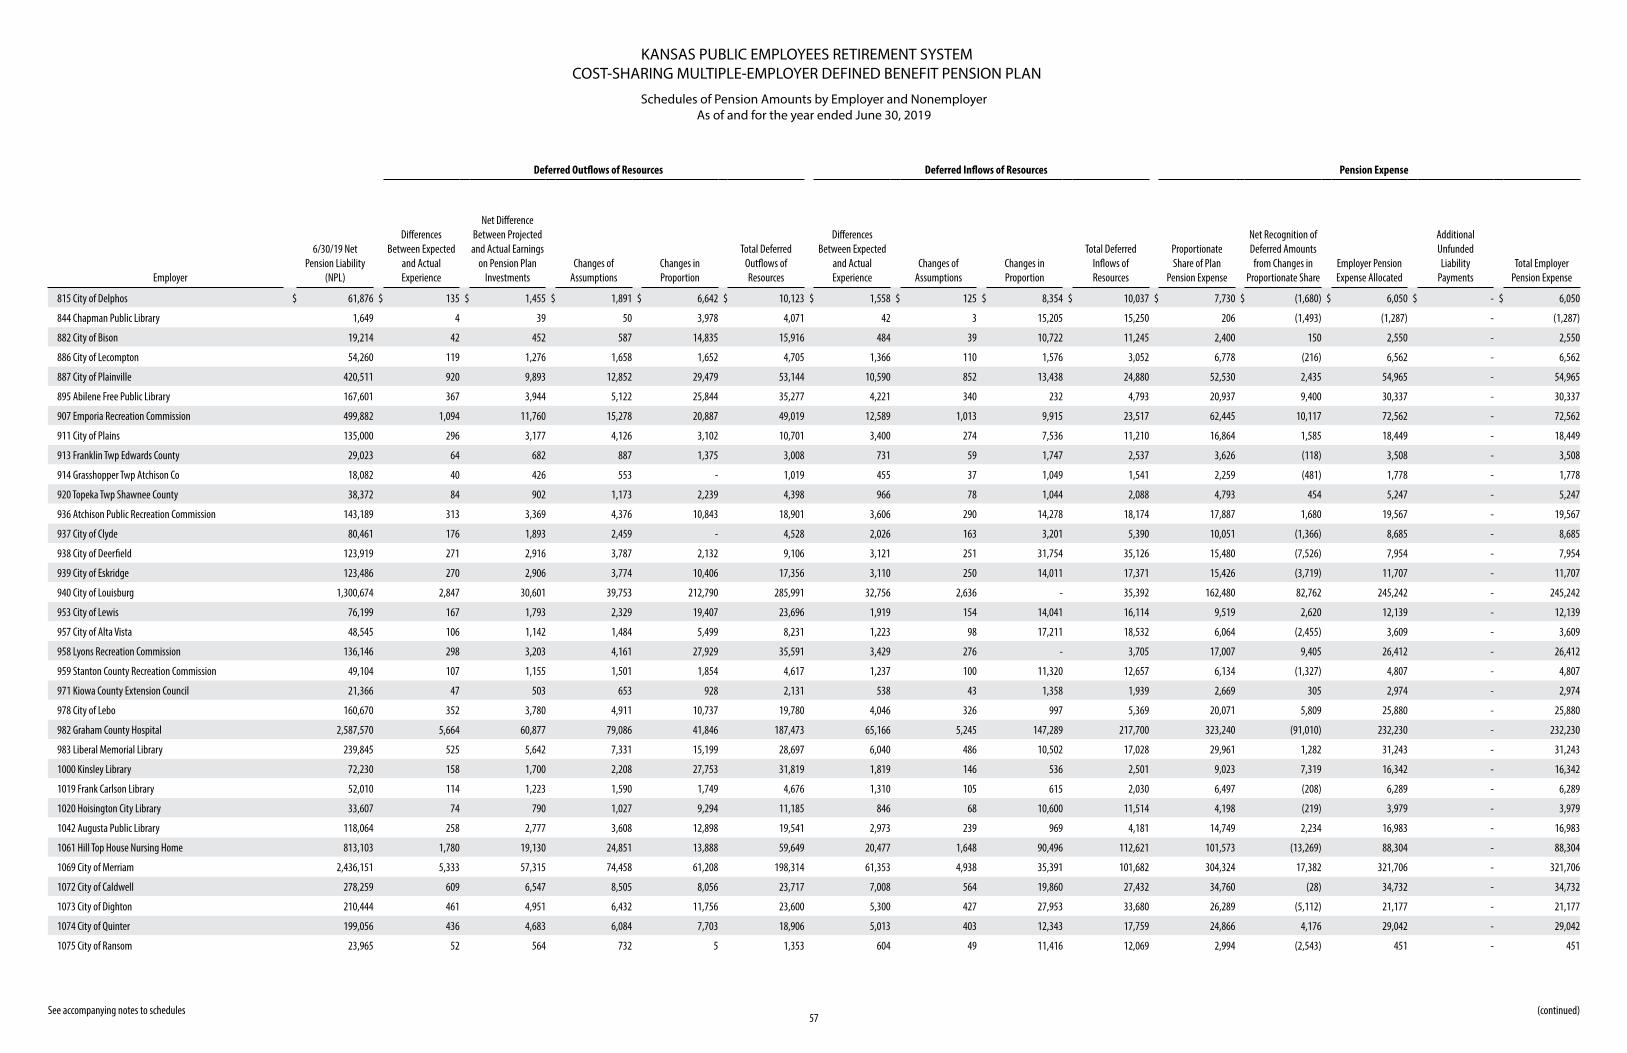
KANSAS PUBLIC EMPLOYEES RETIREMENT SYSTEMCOST-SHARING MULTIPLE-EMPLOYER DEFINED BENEFIT PENSION PLAN
Schedules of Pension Amounts by Employer and NonemployerAs of and for the year ended June 30, 2019
57 See accompanying notes to schedules
Deferred Outflows of Resources Deferred Inflows of Resources Pension Expense
Employer
6/30/19 Net Pension Liability
(NPL)
Differences Between Expected
and Actual Experience
Net Difference Between Projected and Actual Earnings
on Pension Plan Investments
Changes of Assumptions
Changes in Proportion
Total Deferred Outflows of Resources
Differences Between Expected
and Actual Experience
Changes of Assumptions
Changes in Proportion
Total Deferred Inflows of Resources
Proportionate Share of Plan
Pension Expense
Net Recognition of Deferred Amounts from Changes in
Proportionate ShareEmployer Pension Expense Allocated
Additional Unfunded Liability
PaymentsTotal Employer
Pension Expense
815 City of Delphos $ 61,876 $ 135 $ 1,455 $ 1,891 $ 6,642 $ 10,123 $ 1,558 $ 125 $ 8,354 $ 10,037 $ 7,730 $ (1,680) $ 6,050 $ - $ 6,050
844 Chapman Public Library 1,649 4 39 50 3,978 4,071 42 3 15,205 15,250 206 (1,493) (1,287) - (1,287)
882 City of Bison 19,214 42 452 587 14,835 15,916 484 39 10,722 11,245 2,400 150 2,550 - 2,550
886 City of Lecompton 54,260 119 1,276 1,658 1,652 4,705 1,366 110 1,576 3,052 6,778 (216) 6,562 - 6,562
887 City of Plainville 420,511 920 9,893 12,852 29,479 53,144 10,590 852 13,438 24,880 52,530 2,435 54,965 - 54,965
895 Abilene Free Public Library 167,601 367 3,944 5,122 25,844 35,277 4,221 340 232 4,793 20,937 9,400 30,337 - 30,337
907 Emporia Recreation Commission 499,882 1,094 11,760 15,278 20,887 49,019 12,589 1,013 9,915 23,517 62,445 10,117 72,562 - 72,562
911 City of Plains 135,000 296 3,177 4,126 3,102 10,701 3,400 274 7,536 11,210 16,864 1,585 18,449 - 18,449
913 Franklin Twp Edwards County 29,023 64 682 887 1,375 3,008 731 59 1,747 2,537 3,626 (118) 3,508 - 3,508
914 Grasshopper Twp Atchison Co 18,082 40 426 553 - 1,019 455 37 1,049 1,541 2,259 (481) 1,778 - 1,778
920 Topeka Twp Shawnee County 38,372 84 902 1,173 2,239 4,398 966 78 1,044 2,088 4,793 454 5,247 - 5,247
936 Atchison Public Recreation Commission 143,189 313 3,369 4,376 10,843 18,901 3,606 290 14,278 18,174 17,887 1,680 19,567 - 19,567
937 City of Clyde 80,461 176 1,893 2,459 - 4,528 2,026 163 3,201 5,390 10,051 (1,366) 8,685 - 8,685
938 City of Deerfield 123,919 271 2,916 3,787 2,132 9,106 3,121 251 31,754 35,126 15,480 (7,526) 7,954 - 7,954
939 City of Eskridge 123,486 270 2,906 3,774 10,406 17,356 3,110 250 14,011 17,371 15,426 (3,719) 11,707 - 11,707
940 City of Louisburg 1,300,674 2,847 30,601 39,753 212,790 285,991 32,756 2,636 - 35,392 162,480 82,762 245,242 - 245,242
953 City of Lewis 76,199 167 1,793 2,329 19,407 23,696 1,919 154 14,041 16,114 9,519 2,620 12,139 - 12,139
957 City of Alta Vista 48,545 106 1,142 1,484 5,499 8,231 1,223 98 17,211 18,532 6,064 (2,455) 3,609 - 3,609
958 Lyons Recreation Commission 136,146 298 3,203 4,161 27,929 35,591 3,429 276 - 3,705 17,007 9,405 26,412 - 26,412
959 Stanton County Recreation Commission 49,104 107 1,155 1,501 1,854 4,617 1,237 100 11,320 12,657 6,134 (1,327) 4,807 - 4,807
971 Kiowa County Extension Council 21,366 47 503 653 928 2,131 538 43 1,358 1,939 2,669 305 2,974 - 2,974
978 City of Lebo 160,670 352 3,780 4,911 10,737 19,780 4,046 326 997 5,369 20,071 5,809 25,880 - 25,880
982 Graham County Hospital 2,587,570 5,664 60,877 79,086 41,846 187,473 65,166 5,245 147,289 217,700 323,240 (91,010) 232,230 - 232,230
983 Liberal Memorial Library 239,845 525 5,642 7,331 15,199 28,697 6,040 486 10,502 17,028 29,961 1,282 31,243 - 31,243
1000 Kinsley Library 72,230 158 1,700 2,208 27,753 31,819 1,819 146 536 2,501 9,023 7,319 16,342 - 16,342
1019 Frank Carlson Library 52,010 114 1,223 1,590 1,749 4,676 1,310 105 615 2,030 6,497 (208) 6,289 - 6,289
1020 Hoisington City Library 33,607 74 790 1,027 9,294 11,185 846 68 10,600 11,514 4,198 (219) 3,979 - 3,979
1042 Augusta Public Library 118,064 258 2,777 3,608 12,898 19,541 2,973 239 969 4,181 14,749 2,234 16,983 - 16,983
1061 Hill Top House Nursing Home 813,103 1,780 19,130 24,851 13,888 59,649 20,477 1,648 90,496 112,621 101,573 (13,269) 88,304 - 88,304
1069 City of Merriam 2,436,151 5,333 57,315 74,458 61,208 198,314 61,353 4,938 35,391 101,682 304,324 17,382 321,706 - 321,706
1072 City of Caldwell 278,259 609 6,547 8,505 8,056 23,717 7,008 564 19,860 27,432 34,760 (28) 34,732 - 34,732
1073 City of Dighton 210,444 461 4,951 6,432 11,756 23,600 5,300 427 27,953 33,680 26,289 (5,112) 21,177 - 21,177
1074 City of Quinter 199,056 436 4,683 6,084 7,703 18,906 5,013 403 12,343 17,759 24,866 4,176 29,042 - 29,042
1075 City of Ransom 23,965 52 564 732 5 1,353 604 49 11,416 12,069 2,994 (2,543) 451 - 451
(continued)
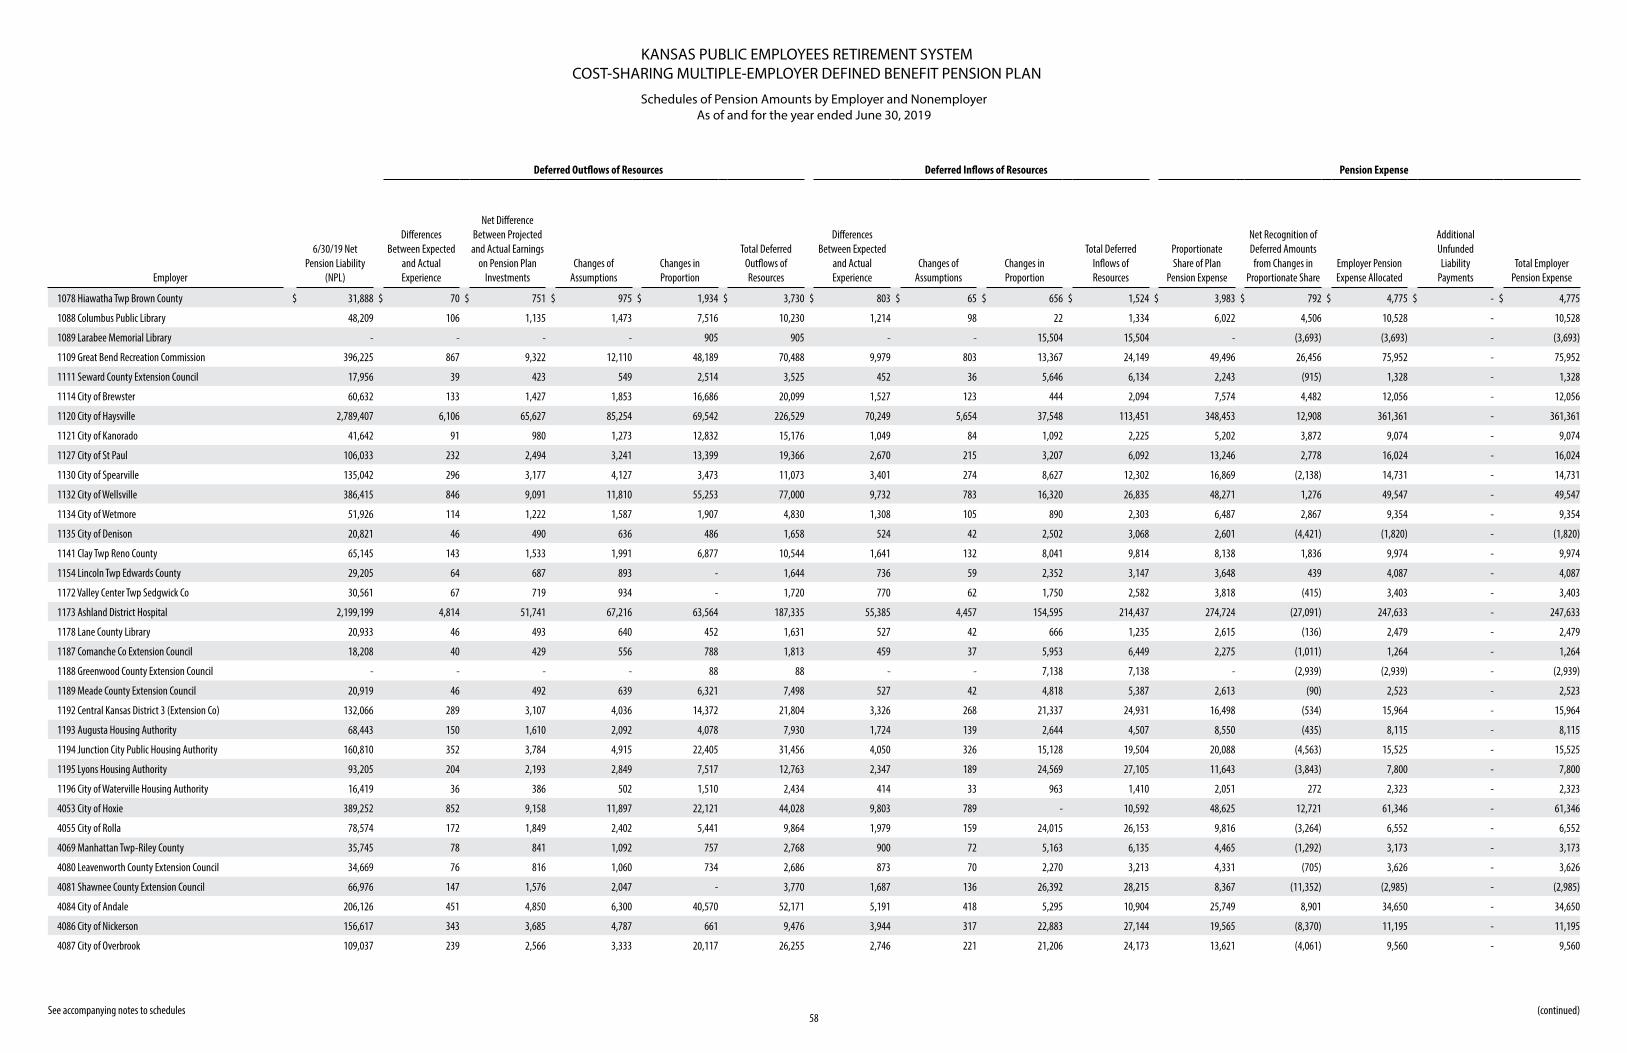
KANSAS PUBLIC EMPLOYEES RETIREMENT SYSTEMCOST-SHARING MULTIPLE-EMPLOYER DEFINED BENEFIT PENSION PLAN
Schedules of Pension Amounts by Employer and NonemployerAs of and for the year ended June 30, 2019
58 See accompanying notes to schedules
Deferred Outflows of Resources Deferred Inflows of Resources Pension Expense
Employer
6/30/19 Net Pension Liability
(NPL)
Differences Between Expected
and Actual Experience
Net Difference Between Projected and Actual Earnings
on Pension Plan Investments
Changes of Assumptions
Changes in Proportion
Total Deferred Outflows of Resources
Differences Between Expected
and Actual Experience
Changes of Assumptions
Changes in Proportion
Total Deferred Inflows of Resources
Proportionate Share of Plan
Pension Expense
Net Recognition of Deferred Amounts from Changes in
Proportionate ShareEmployer Pension Expense Allocated
Additional Unfunded Liability
PaymentsTotal Employer
Pension Expense
1078 Hiawatha Twp Brown County $ 31,888 $ 70 $ 751 $ 975 $ 1,934 $ 3,730 $ 803 $ 65 $ 656 $ 1,524 $ 3,983 $ 792 $ 4,775 $ - $ 4,775
1088 Columbus Public Library 48,209 106 1,135 1,473 7,516 10,230 1,214 98 22 1,334 6,022 4,506 10,528 - 10,528
1089 Larabee Memorial Library - - - - 905 905 - - 15,504 15,504 - (3,693) (3,693) - (3,693)
1109 Great Bend Recreation Commission 396,225 867 9,322 12,110 48,189 70,488 9,979 803 13,367 24,149 49,496 26,456 75,952 - 75,952
1111 Seward County Extension Council 17,956 39 423 549 2,514 3,525 452 36 5,646 6,134 2,243 (915) 1,328 - 1,328
1114 City of Brewster 60,632 133 1,427 1,853 16,686 20,099 1,527 123 444 2,094 7,574 4,482 12,056 - 12,056
1120 City of Haysville 2,789,407 6,106 65,627 85,254 69,542 226,529 70,249 5,654 37,548 113,451 348,453 12,908 361,361 - 361,361
1121 City of Kanorado 41,642 91 980 1,273 12,832 15,176 1,049 84 1,092 2,225 5,202 3,872 9,074 - 9,074
1127 City of St Paul 106,033 232 2,494 3,241 13,399 19,366 2,670 215 3,207 6,092 13,246 2,778 16,024 - 16,024
1130 City of Spearville 135,042 296 3,177 4,127 3,473 11,073 3,401 274 8,627 12,302 16,869 (2,138) 14,731 - 14,731
1132 City of Wellsville 386,415 846 9,091 11,810 55,253 77,000 9,732 783 16,320 26,835 48,271 1,276 49,547 - 49,547
1134 City of Wetmore 51,926 114 1,222 1,587 1,907 4,830 1,308 105 890 2,303 6,487 2,867 9,354 - 9,354
1135 City of Denison 20,821 46 490 636 486 1,658 524 42 2,502 3,068 2,601 (4,421) (1,820) - (1,820)
1141 Clay Twp Reno County 65,145 143 1,533 1,991 6,877 10,544 1,641 132 8,041 9,814 8,138 1,836 9,974 - 9,974
1154 Lincoln Twp Edwards County 29,205 64 687 893 - 1,644 736 59 2,352 3,147 3,648 439 4,087 - 4,087
1172 Valley Center Twp Sedgwick Co 30,561 67 719 934 - 1,720 770 62 1,750 2,582 3,818 (415) 3,403 - 3,403
1173 Ashland District Hospital 2,199,199 4,814 51,741 67,216 63,564 187,335 55,385 4,457 154,595 214,437 274,724 (27,091) 247,633 - 247,633
1178 Lane County Library 20,933 46 493 640 452 1,631 527 42 666 1,235 2,615 (136) 2,479 - 2,479
1187 Comanche Co Extension Council 18,208 40 429 556 788 1,813 459 37 5,953 6,449 2,275 (1,011) 1,264 - 1,264
1188 Greenwood County Extension Council - - - - 88 88 - - 7,138 7,138 - (2,939) (2,939) - (2,939)
1189 Meade County Extension Council 20,919 46 492 639 6,321 7,498 527 42 4,818 5,387 2,613 (90) 2,523 - 2,523
1192 Central Kansas District 3 (Extension Co) 132,066 289 3,107 4,036 14,372 21,804 3,326 268 21,337 24,931 16,498 (534) 15,964 - 15,964
1193 Augusta Housing Authority 68,443 150 1,610 2,092 4,078 7,930 1,724 139 2,644 4,507 8,550 (435) 8,115 - 8,115
1194 Junction City Public Housing Authority 160,810 352 3,784 4,915 22,405 31,456 4,050 326 15,128 19,504 20,088 (4,563) 15,525 - 15,525
1195 Lyons Housing Authority 93,205 204 2,193 2,849 7,517 12,763 2,347 189 24,569 27,105 11,643 (3,843) 7,800 - 7,800
1196 City of Waterville Housing Authority 16,419 36 386 502 1,510 2,434 414 33 963 1,410 2,051 272 2,323 - 2,323
4053 City of Hoxie 389,252 852 9,158 11,897 22,121 44,028 9,803 789 - 10,592 48,625 12,721 61,346 - 61,346
4055 City of Rolla 78,574 172 1,849 2,402 5,441 9,864 1,979 159 24,015 26,153 9,816 (3,264) 6,552 - 6,552
4069 Manhattan Twp-Riley County 35,745 78 841 1,092 757 2,768 900 72 5,163 6,135 4,465 (1,292) 3,173 - 3,173
4080 Leavenworth County Extension Council 34,669 76 816 1,060 734 2,686 873 70 2,270 3,213 4,331 (705) 3,626 - 3,626
4081 Shawnee County Extension Council 66,976 147 1,576 2,047 - 3,770 1,687 136 26,392 28,215 8,367 (11,352) (2,985) - (2,985)
4084 City of Andale 206,126 451 4,850 6,300 40,570 52,171 5,191 418 5,295 10,904 25,749 8,901 34,650 - 34,650
4086 City of Nickerson 156,617 343 3,685 4,787 661 9,476 3,944 317 22,883 27,144 19,565 (8,370) 11,195 - 11,195
4087 City of Overbrook 109,037 239 2,566 3,333 20,117 26,255 2,746 221 21,206 24,173 13,621 (4,061) 9,560 - 9,560
(continued)
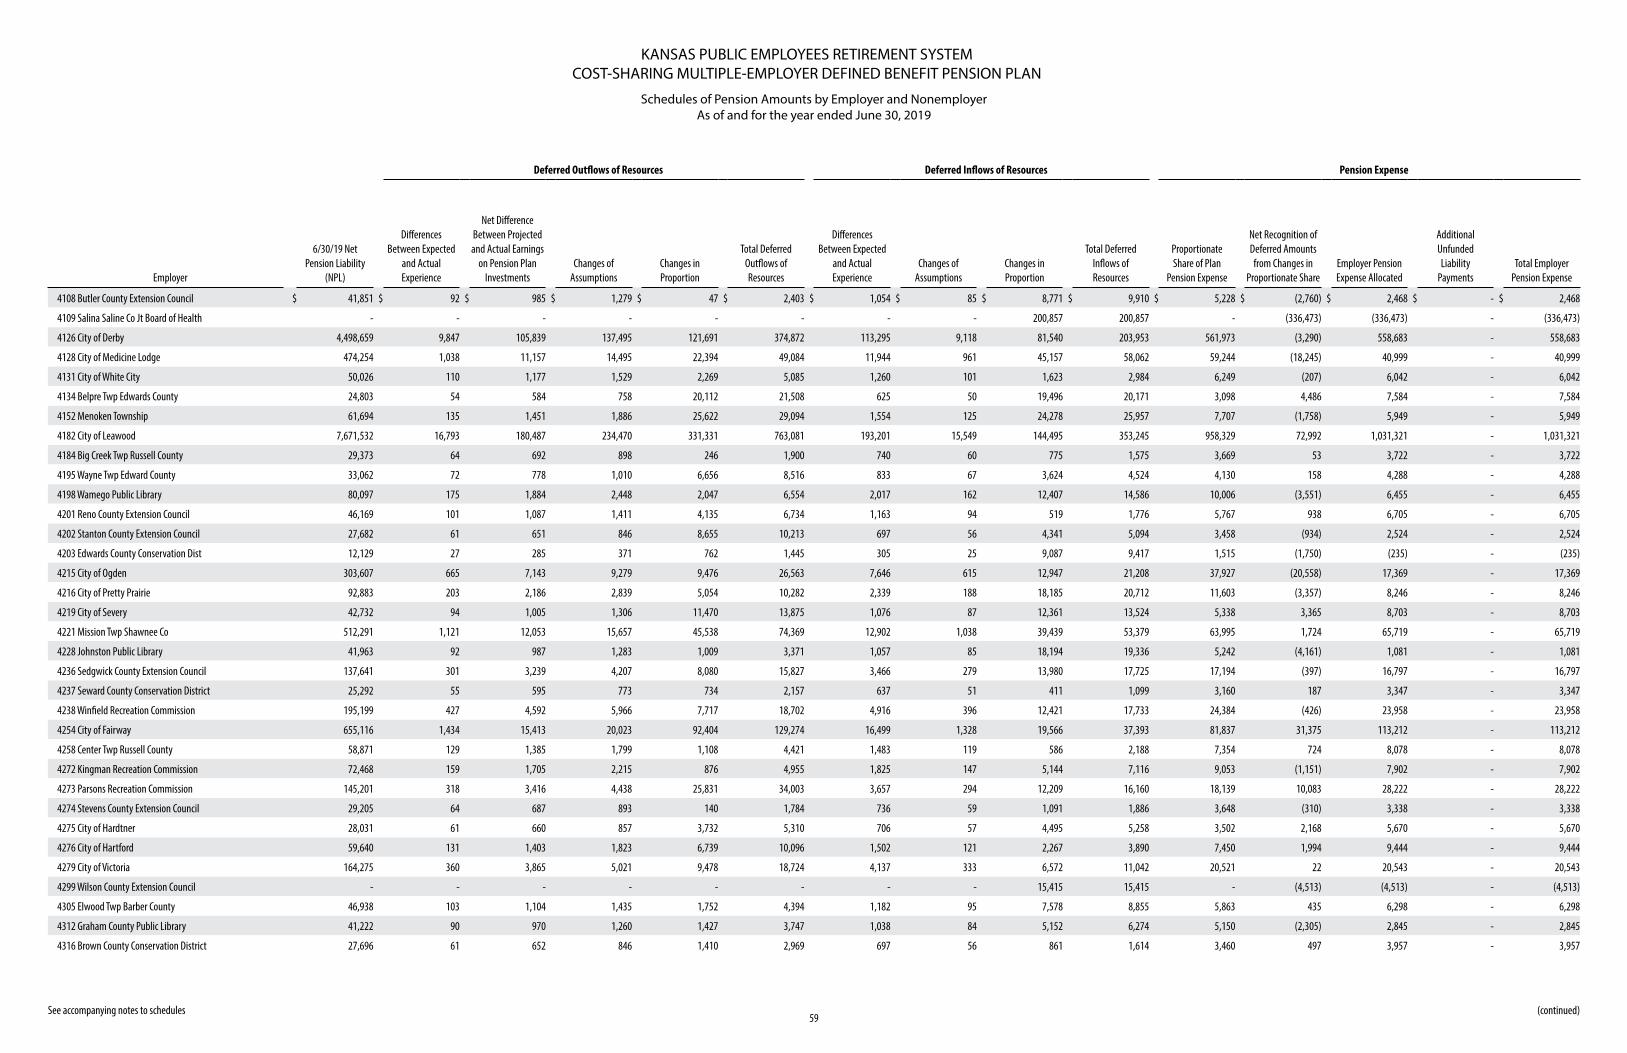
KANSAS PUBLIC EMPLOYEES RETIREMENT SYSTEMCOST-SHARING MULTIPLE-EMPLOYER DEFINED BENEFIT PENSION PLAN
Schedules of Pension Amounts by Employer and NonemployerAs of and for the year ended June 30, 2019
59 See accompanying notes to schedules
Deferred Outflows of Resources Deferred Inflows of Resources Pension Expense
Employer
6/30/19 Net Pension Liability
(NPL)
Differences Between Expected
and Actual Experience
Net Difference Between Projected and Actual Earnings
on Pension Plan Investments
Changes of Assumptions
Changes in Proportion
Total Deferred Outflows of Resources
Differences Between Expected
and Actual Experience
Changes of Assumptions
Changes in Proportion
Total Deferred Inflows of Resources
Proportionate Share of Plan
Pension Expense
Net Recognition of Deferred Amounts from Changes in
Proportionate ShareEmployer Pension Expense Allocated
Additional Unfunded Liability
PaymentsTotal Employer
Pension Expense
4108 Butler County Extension Council $ 41,851 $ 92 $ 985 $ 1,279 $ 47 $ 2,403 $ 1,054 $ 85 $ 8,771 $ 9,910 $ 5,228 $ (2,760) $ 2,468 $ - $ 2,468
4109 Salina Saline Co Jt Board of Health - - - - - - - - 200,857 200,857 - (336,473) (336,473) - (336,473)
4126 City of Derby 4,498,659 9,847 105,839 137,495 121,691 374,872 113,295 9,118 81,540 203,953 561,973 (3,290) 558,683 - 558,683
4128 City of Medicine Lodge 474,254 1,038 11,157 14,495 22,394 49,084 11,944 961 45,157 58,062 59,244 (18,245) 40,999 - 40,999
4131 City of White City 50,026 110 1,177 1,529 2,269 5,085 1,260 101 1,623 2,984 6,249 (207) 6,042 - 6,042
4134 Belpre Twp Edwards County 24,803 54 584 758 20,112 21,508 625 50 19,496 20,171 3,098 4,486 7,584 - 7,584
4152 Menoken Township 61,694 135 1,451 1,886 25,622 29,094 1,554 125 24,278 25,957 7,707 (1,758) 5,949 - 5,949
4182 City of Leawood 7,671,532 16,793 180,487 234,470 331,331 763,081 193,201 15,549 144,495 353,245 958,329 72,992 1,031,321 - 1,031,321
4184 Big Creek Twp Russell County 29,373 64 692 898 246 1,900 740 60 775 1,575 3,669 53 3,722 - 3,722
4195 Wayne Twp Edward County 33,062 72 778 1,010 6,656 8,516 833 67 3,624 4,524 4,130 158 4,288 - 4,288
4198 Wamego Public Library 80,097 175 1,884 2,448 2,047 6,554 2,017 162 12,407 14,586 10,006 (3,551) 6,455 - 6,455
4201 Reno County Extension Council 46,169 101 1,087 1,411 4,135 6,734 1,163 94 519 1,776 5,767 938 6,705 - 6,705
4202 Stanton County Extension Council 27,682 61 651 846 8,655 10,213 697 56 4,341 5,094 3,458 (934) 2,524 - 2,524
4203 Edwards County Conservation Dist 12,129 27 285 371 762 1,445 305 25 9,087 9,417 1,515 (1,750) (235) - (235)
4215 City of Ogden 303,607 665 7,143 9,279 9,476 26,563 7,646 615 12,947 21,208 37,927 (20,558) 17,369 - 17,369
4216 City of Pretty Prairie 92,883 203 2,186 2,839 5,054 10,282 2,339 188 18,185 20,712 11,603 (3,357) 8,246 - 8,246
4219 City of Severy 42,732 94 1,005 1,306 11,470 13,875 1,076 87 12,361 13,524 5,338 3,365 8,703 - 8,703
4221 Mission Twp Shawnee Co 512,291 1,121 12,053 15,657 45,538 74,369 12,902 1,038 39,439 53,379 63,995 1,724 65,719 - 65,719
4228 Johnston Public Library 41,963 92 987 1,283 1,009 3,371 1,057 85 18,194 19,336 5,242 (4,161) 1,081 - 1,081
4236 Sedgwick County Extension Council 137,641 301 3,239 4,207 8,080 15,827 3,466 279 13,980 17,725 17,194 (397) 16,797 - 16,797
4237 Seward County Conservation District 25,292 55 595 773 734 2,157 637 51 411 1,099 3,160 187 3,347 - 3,347
4238 Winfield Recreation Commission 195,199 427 4,592 5,966 7,717 18,702 4,916 396 12,421 17,733 24,384 (426) 23,958 - 23,958
4254 City of Fairway 655,116 1,434 15,413 20,023 92,404 129,274 16,499 1,328 19,566 37,393 81,837 31,375 113,212 - 113,212
4258 Center Twp Russell County 58,871 129 1,385 1,799 1,108 4,421 1,483 119 586 2,188 7,354 724 8,078 - 8,078
4272 Kingman Recreation Commission 72,468 159 1,705 2,215 876 4,955 1,825 147 5,144 7,116 9,053 (1,151) 7,902 - 7,902
4273 Parsons Recreation Commission 145,201 318 3,416 4,438 25,831 34,003 3,657 294 12,209 16,160 18,139 10,083 28,222 - 28,222
4274 Stevens County Extension Council 29,205 64 687 893 140 1,784 736 59 1,091 1,886 3,648 (310) 3,338 - 3,338
4275 City of Hardtner 28,031 61 660 857 3,732 5,310 706 57 4,495 5,258 3,502 2,168 5,670 - 5,670
4276 City of Hartford 59,640 131 1,403 1,823 6,739 10,096 1,502 121 2,267 3,890 7,450 1,994 9,444 - 9,444
4279 City of Victoria 164,275 360 3,865 5,021 9,478 18,724 4,137 333 6,572 11,042 20,521 22 20,543 - 20,543
4299 Wilson County Extension Council - - - - - - - - 15,415 15,415 - (4,513) (4,513) - (4,513)
4305 Elwood Twp Barber County 46,938 103 1,104 1,435 1,752 4,394 1,182 95 7,578 8,855 5,863 435 6,298 - 6,298
4312 Graham County Public Library 41,222 90 970 1,260 1,427 3,747 1,038 84 5,152 6,274 5,150 (2,305) 2,845 - 2,845
4316 Brown County Conservation District 27,696 61 652 846 1,410 2,969 697 56 861 1,614 3,460 497 3,957 - 3,957
(continued)
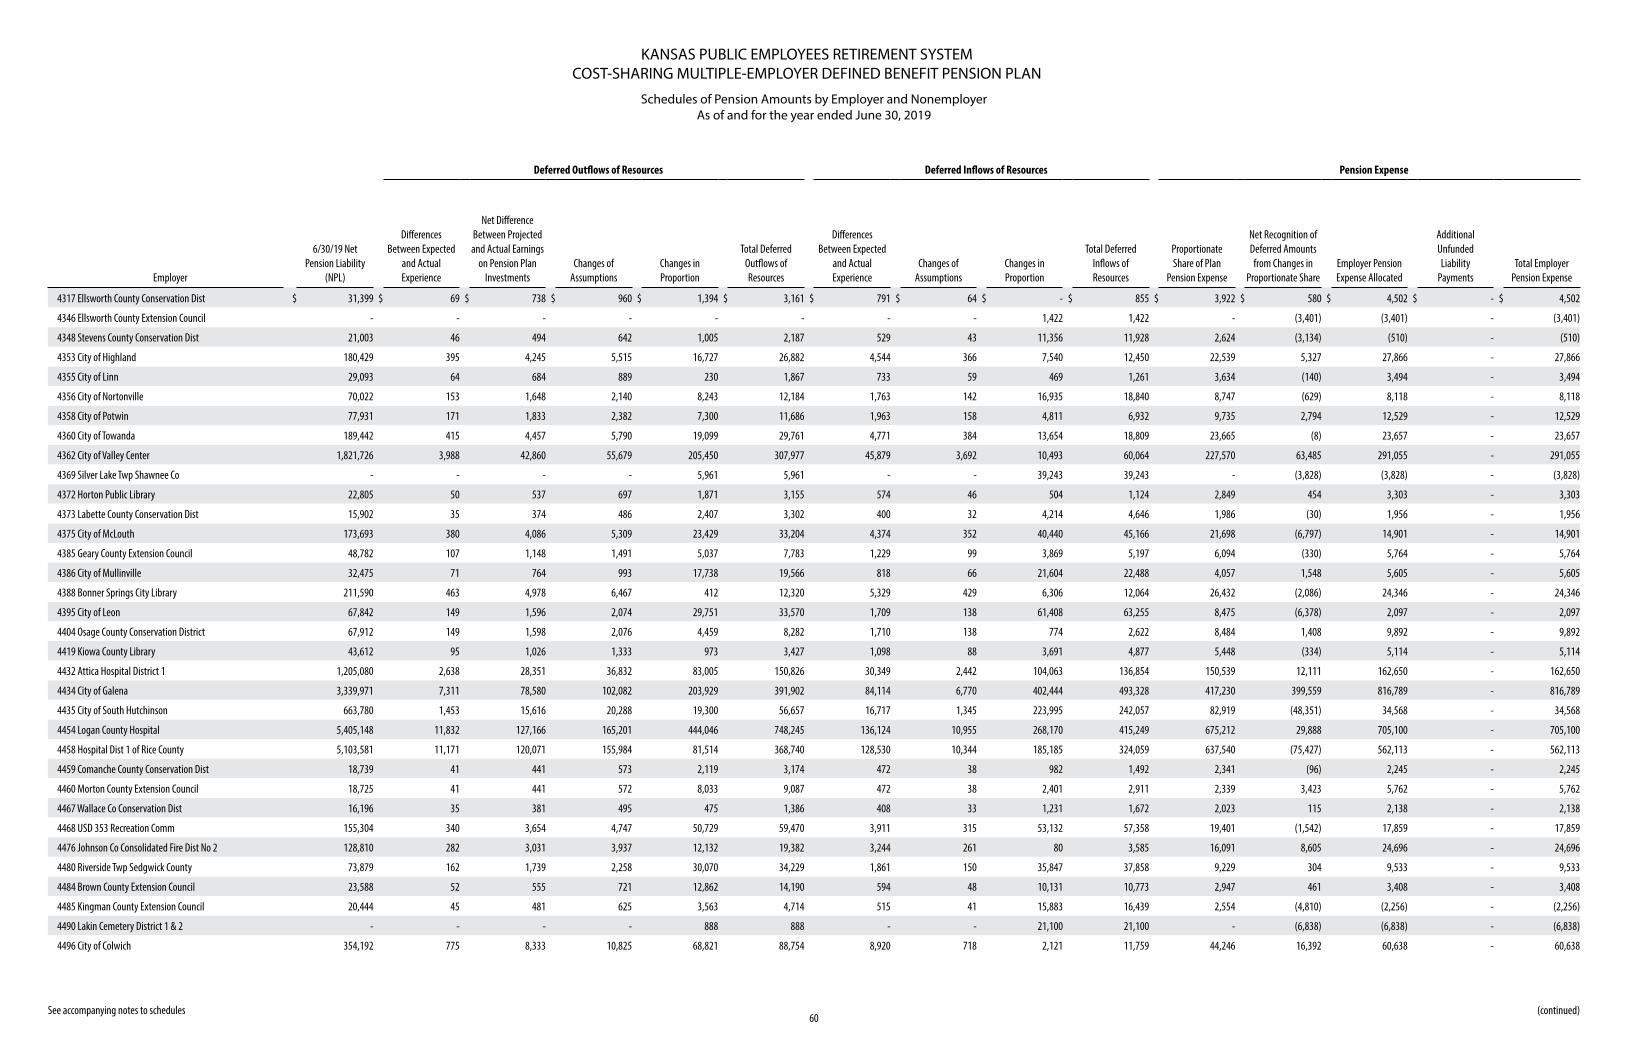
KANSAS PUBLIC EMPLOYEES RETIREMENT SYSTEMCOST-SHARING MULTIPLE-EMPLOYER DEFINED BENEFIT PENSION PLAN
Schedules of Pension Amounts by Employer and NonemployerAs of and for the year ended June 30, 2019
60 See accompanying notes to schedules
Deferred Outflows of Resources Deferred Inflows of Resources Pension Expense
Employer
6/30/19 Net Pension Liability
(NPL)
Differences Between Expected
and Actual Experience
Net Difference Between Projected and Actual Earnings
on Pension Plan Investments
Changes of Assumptions
Changes in Proportion
Total Deferred Outflows of Resources
Differences Between Expected
and Actual Experience
Changes of Assumptions
Changes in Proportion
Total Deferred Inflows of Resources
Proportionate Share of Plan
Pension Expense
Net Recognition of Deferred Amounts from Changes in
Proportionate ShareEmployer Pension Expense Allocated
Additional Unfunded Liability
PaymentsTotal Employer
Pension Expense
4317 Ellsworth County Conservation Dist $ 31,399 $ 69 $ 738 $ 960 $ 1,394 $ 3,161 $ 791 $ 64 $ - $ 855 $ 3,922 $ 580 $ 4,502 $ - $ 4,502
4346 Ellsworth County Extension Council - - - - - - - - 1,422 1,422 - (3,401) (3,401) - (3,401)
4348 Stevens County Conservation Dist 21,003 46 494 642 1,005 2,187 529 43 11,356 11,928 2,624 (3,134) (510) - (510)
4353 City of Highland 180,429 395 4,245 5,515 16,727 26,882 4,544 366 7,540 12,450 22,539 5,327 27,866 - 27,866
4355 City of Linn 29,093 64 684 889 230 1,867 733 59 469 1,261 3,634 (140) 3,494 - 3,494
4356 City of Nortonville 70,022 153 1,648 2,140 8,243 12,184 1,763 142 16,935 18,840 8,747 (629) 8,118 - 8,118
4358 City of Potwin 77,931 171 1,833 2,382 7,300 11,686 1,963 158 4,811 6,932 9,735 2,794 12,529 - 12,529
4360 City of Towanda 189,442 415 4,457 5,790 19,099 29,761 4,771 384 13,654 18,809 23,665 (8) 23,657 - 23,657
4362 City of Valley Center 1,821,726 3,988 42,860 55,679 205,450 307,977 45,879 3,692 10,493 60,064 227,570 63,485 291,055 - 291,055
4369 Silver Lake Twp Shawnee Co - - - - 5,961 5,961 - - 39,243 39,243 - (3,828) (3,828) - (3,828)
4372 Horton Public Library 22,805 50 537 697 1,871 3,155 574 46 504 1,124 2,849 454 3,303 - 3,303
4373 Labette County Conservation Dist 15,902 35 374 486 2,407 3,302 400 32 4,214 4,646 1,986 (30) 1,956 - 1,956
4375 City of McLouth 173,693 380 4,086 5,309 23,429 33,204 4,374 352 40,440 45,166 21,698 (6,797) 14,901 - 14,901
4385 Geary County Extension Council 48,782 107 1,148 1,491 5,037 7,783 1,229 99 3,869 5,197 6,094 (330) 5,764 - 5,764
4386 City of Mullinville 32,475 71 764 993 17,738 19,566 818 66 21,604 22,488 4,057 1,548 5,605 - 5,605
4388 Bonner Springs City Library 211,590 463 4,978 6,467 412 12,320 5,329 429 6,306 12,064 26,432 (2,086) 24,346 - 24,346
4395 City of Leon 67,842 149 1,596 2,074 29,751 33,570 1,709 138 61,408 63,255 8,475 (6,378) 2,097 - 2,097
4404 Osage County Conservation District 67,912 149 1,598 2,076 4,459 8,282 1,710 138 774 2,622 8,484 1,408 9,892 - 9,892
4419 Kiowa County Library 43,612 95 1,026 1,333 973 3,427 1,098 88 3,691 4,877 5,448 (334) 5,114 - 5,114
4432 Attica Hospital District 1 1,205,080 2,638 28,351 36,832 83,005 150,826 30,349 2,442 104,063 136,854 150,539 12,111 162,650 - 162,650
4434 City of Galena 3,339,971 7,311 78,580 102,082 203,929 391,902 84,114 6,770 402,444 493,328 417,230 399,559 816,789 - 816,789
4435 City of South Hutchinson 663,780 1,453 15,616 20,288 19,300 56,657 16,717 1,345 223,995 242,057 82,919 (48,351) 34,568 - 34,568
4454 Logan County Hospital 5,405,148 11,832 127,166 165,201 444,046 748,245 136,124 10,955 268,170 415,249 675,212 29,888 705,100 - 705,100
4458 Hospital Dist 1 of Rice County 5,103,581 11,171 120,071 155,984 81,514 368,740 128,530 10,344 185,185 324,059 637,540 (75,427) 562,113 - 562,113
4459 Comanche County Conservation Dist 18,739 41 441 573 2,119 3,174 472 38 982 1,492 2,341 (96) 2,245 - 2,245
4460 Morton County Extension Council 18,725 41 441 572 8,033 9,087 472 38 2,401 2,911 2,339 3,423 5,762 - 5,762
4467 Wallace Co Conservation Dist 16,196 35 381 495 475 1,386 408 33 1,231 1,672 2,023 115 2,138 - 2,138
4468 USD 353 Recreation Comm 155,304 340 3,654 4,747 50,729 59,470 3,911 315 53,132 57,358 19,401 (1,542) 17,859 - 17,859
4476 Johnson Co Consolidated Fire Dist No 2 128,810 282 3,031 3,937 12,132 19,382 3,244 261 80 3,585 16,091 8,605 24,696 - 24,696
4480 Riverside Twp Sedgwick County 73,879 162 1,739 2,258 30,070 34,229 1,861 150 35,847 37,858 9,229 304 9,533 - 9,533
4484 Brown County Extension Council 23,588 52 555 721 12,862 14,190 594 48 10,131 10,773 2,947 461 3,408 - 3,408
4485 Kingman County Extension Council 20,444 45 481 625 3,563 4,714 515 41 15,883 16,439 2,554 (4,810) (2,256) - (2,256)
4490 Lakin Cemetery District 1 & 2 - - - - 888 888 - - 21,100 21,100 - (6,838) (6,838) - (6,838)
4496 City of Colwich 354,192 775 8,333 10,825 68,821 88,754 8,920 718 2,121 11,759 44,246 16,392 60,638 - 60,638
(continued)
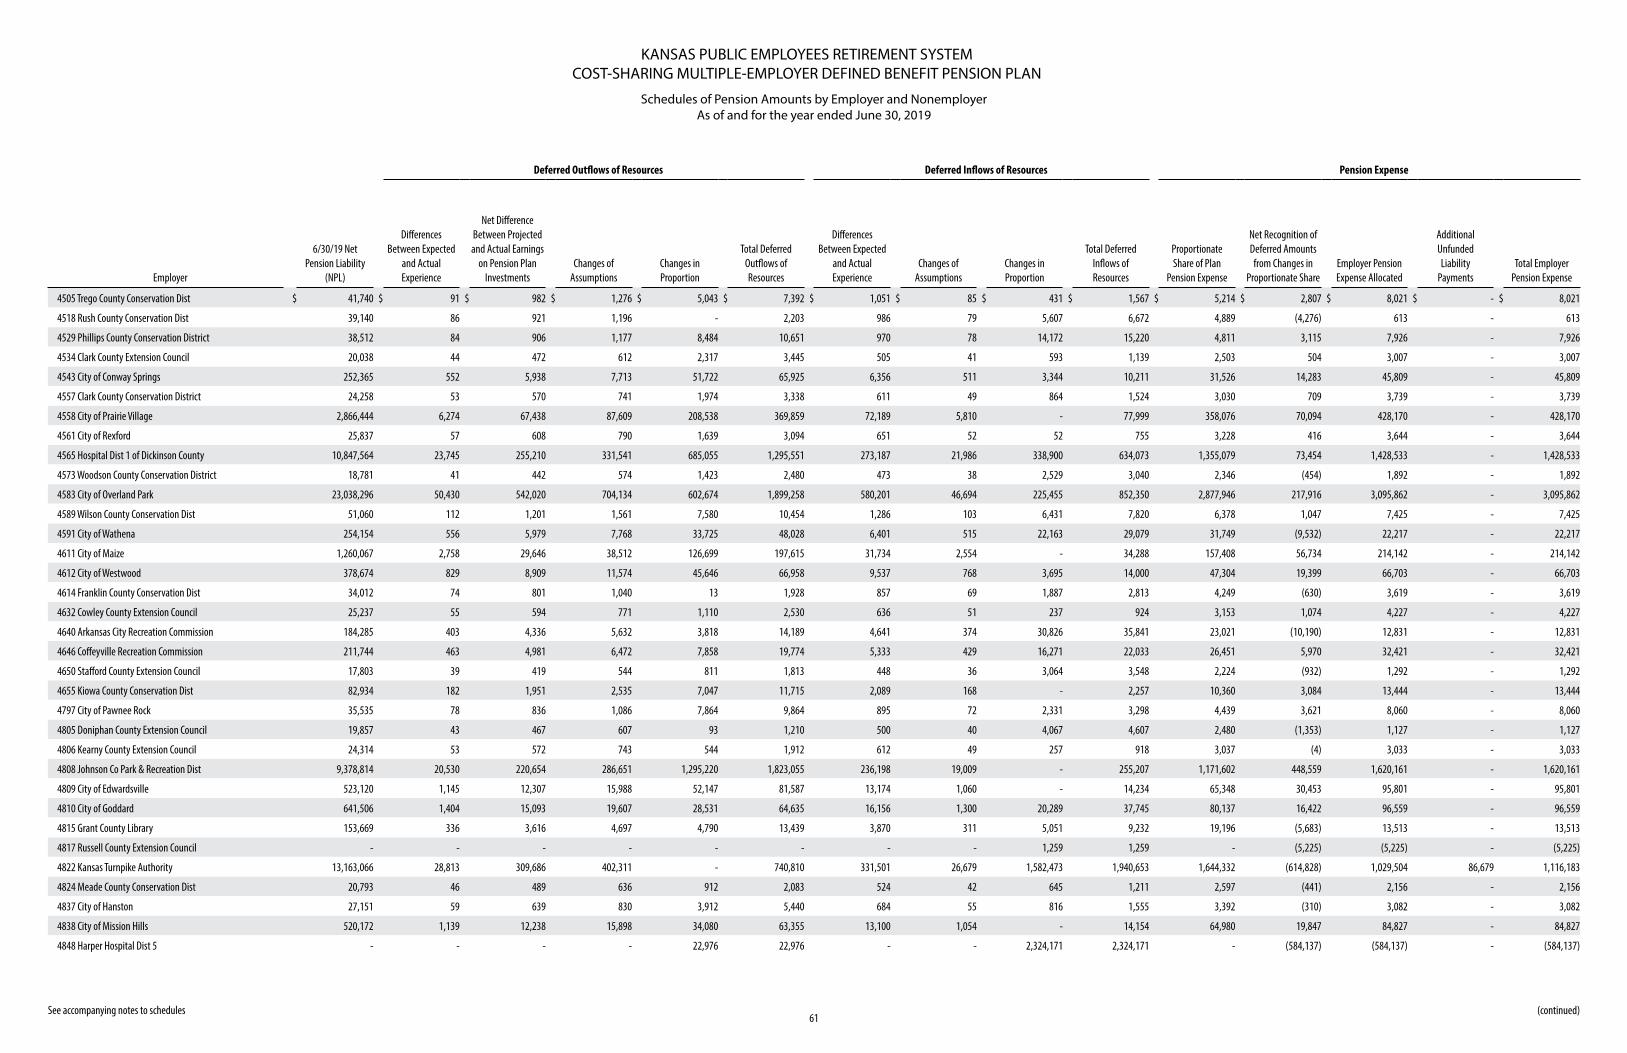
KANSAS PUBLIC EMPLOYEES RETIREMENT SYSTEMCOST-SHARING MULTIPLE-EMPLOYER DEFINED BENEFIT PENSION PLAN
Schedules of Pension Amounts by Employer and NonemployerAs of and for the year ended June 30, 2019
61 See accompanying notes to schedules
Deferred Outflows of Resources Deferred Inflows of Resources Pension Expense
Employer
6/30/19 Net Pension Liability
(NPL)
Differences Between Expected
and Actual Experience
Net Difference Between Projected and Actual Earnings
on Pension Plan Investments
Changes of Assumptions
Changes in Proportion
Total Deferred Outflows of Resources
Differences Between Expected
and Actual Experience
Changes of Assumptions
Changes in Proportion
Total Deferred Inflows of Resources
Proportionate Share of Plan
Pension Expense
Net Recognition of Deferred Amounts from Changes in
Proportionate ShareEmployer Pension Expense Allocated
Additional Unfunded Liability
PaymentsTotal Employer
Pension Expense
4505 Trego County Conservation Dist $ 41,740 $ 91 $ 982 $ 1,276 $ 5,043 $ 7,392 $ 1,051 $ 85 $ 431 $ 1,567 $ 5,214 $ 2,807 $ 8,021 $ - $ 8,021
4518 Rush County Conservation Dist 39,140 86 921 1,196 - 2,203 986 79 5,607 6,672 4,889 (4,276) 613 - 613
4529 Phillips County Conservation District 38,512 84 906 1,177 8,484 10,651 970 78 14,172 15,220 4,811 3,115 7,926 - 7,926
4534 Clark County Extension Council 20,038 44 472 612 2,317 3,445 505 41 593 1,139 2,503 504 3,007 - 3,007
4543 City of Conway Springs 252,365 552 5,938 7,713 51,722 65,925 6,356 511 3,344 10,211 31,526 14,283 45,809 - 45,809
4557 Clark County Conservation District 24,258 53 570 741 1,974 3,338 611 49 864 1,524 3,030 709 3,739 - 3,739
4558 City of Prairie Village 2,866,444 6,274 67,438 87,609 208,538 369,859 72,189 5,810 - 77,999 358,076 70,094 428,170 - 428,170
4561 City of Rexford 25,837 57 608 790 1,639 3,094 651 52 52 755 3,228 416 3,644 - 3,644
4565 Hospital Dist 1 of Dickinson County 10,847,564 23,745 255,210 331,541 685,055 1,295,551 273,187 21,986 338,900 634,073 1,355,079 73,454 1,428,533 - 1,428,533
4573 Woodson County Conservation District 18,781 41 442 574 1,423 2,480 473 38 2,529 3,040 2,346 (454) 1,892 - 1,892
4583 City of Overland Park 23,038,296 50,430 542,020 704,134 602,674 1,899,258 580,201 46,694 225,455 852,350 2,877,946 217,916 3,095,862 - 3,095,862
4589 Wilson County Conservation Dist 51,060 112 1,201 1,561 7,580 10,454 1,286 103 6,431 7,820 6,378 1,047 7,425 - 7,425
4591 City of Wathena 254,154 556 5,979 7,768 33,725 48,028 6,401 515 22,163 29,079 31,749 (9,532) 22,217 - 22,217
4611 City of Maize 1,260,067 2,758 29,646 38,512 126,699 197,615 31,734 2,554 - 34,288 157,408 56,734 214,142 - 214,142
4612 City of Westwood 378,674 829 8,909 11,574 45,646 66,958 9,537 768 3,695 14,000 47,304 19,399 66,703 - 66,703
4614 Franklin County Conservation Dist 34,012 74 801 1,040 13 1,928 857 69 1,887 2,813 4,249 (630) 3,619 - 3,619
4632 Cowley County Extension Council 25,237 55 594 771 1,110 2,530 636 51 237 924 3,153 1,074 4,227 - 4,227
4640 Arkansas City Recreation Commission 184,285 403 4,336 5,632 3,818 14,189 4,641 374 30,826 35,841 23,021 (10,190) 12,831 - 12,831
4646 Coffeyville Recreation Commission 211,744 463 4,981 6,472 7,858 19,774 5,333 429 16,271 22,033 26,451 5,970 32,421 - 32,421
4650 Stafford County Extension Council 17,803 39 419 544 811 1,813 448 36 3,064 3,548 2,224 (932) 1,292 - 1,292
4655 Kiowa County Conservation Dist 82,934 182 1,951 2,535 7,047 11,715 2,089 168 - 2,257 10,360 3,084 13,444 - 13,444
4797 City of Pawnee Rock 35,535 78 836 1,086 7,864 9,864 895 72 2,331 3,298 4,439 3,621 8,060 - 8,060
4805 Doniphan County Extension Council 19,857 43 467 607 93 1,210 500 40 4,067 4,607 2,480 (1,353) 1,127 - 1,127
4806 Kearny County Extension Council 24,314 53 572 743 544 1,912 612 49 257 918 3,037 (4) 3,033 - 3,033
4808 Johnson Co Park & Recreation Dist 9,378,814 20,530 220,654 286,651 1,295,220 1,823,055 236,198 19,009 - 255,207 1,171,602 448,559 1,620,161 - 1,620,161
4809 City of Edwardsville 523,120 1,145 12,307 15,988 52,147 81,587 13,174 1,060 - 14,234 65,348 30,453 95,801 - 95,801
4810 City of Goddard 641,506 1,404 15,093 19,607 28,531 64,635 16,156 1,300 20,289 37,745 80,137 16,422 96,559 - 96,559
4815 Grant County Library 153,669 336 3,616 4,697 4,790 13,439 3,870 311 5,051 9,232 19,196 (5,683) 13,513 - 13,513
4817 Russell County Extension Council - - - - - - - - 1,259 1,259 - (5,225) (5,225) - (5,225)
4822 Kansas Turnpike Authority 13,163,066 28,813 309,686 402,311 - 740,810 331,501 26,679 1,582,473 1,940,653 1,644,332 (614,828) 1,029,504 86,679 1,116,183
4824 Meade County Conservation Dist 20,793 46 489 636 912 2,083 524 42 645 1,211 2,597 (441) 2,156 - 2,156
4837 City of Hanston 27,151 59 639 830 3,912 5,440 684 55 816 1,555 3,392 (310) 3,082 - 3,082
4838 City of Mission Hills 520,172 1,139 12,238 15,898 34,080 63,355 13,100 1,054 - 14,154 64,980 19,847 84,827 - 84,827
4848 Harper Hospital Dist 5 - - - - 22,976 22,976 - - 2,324,171 2,324,171 - (584,137) (584,137) - (584,137)
(continued)
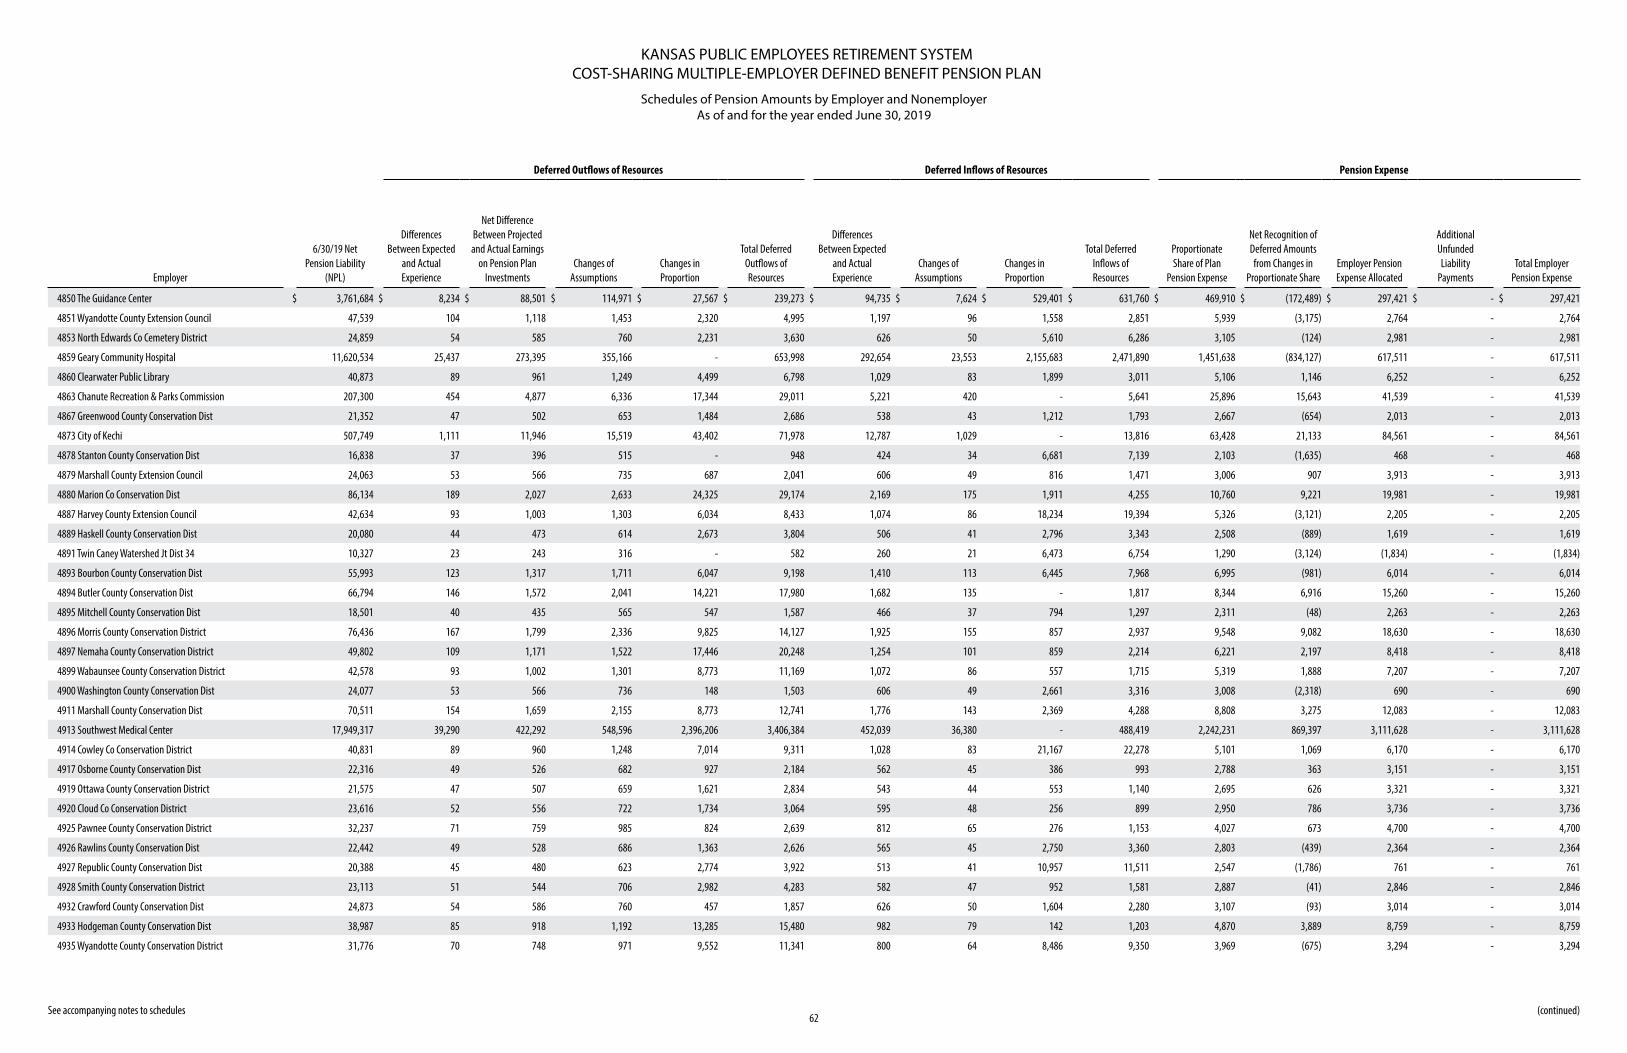
KANSAS PUBLIC EMPLOYEES RETIREMENT SYSTEMCOST-SHARING MULTIPLE-EMPLOYER DEFINED BENEFIT PENSION PLAN
Schedules of Pension Amounts by Employer and NonemployerAs of and for the year ended June 30, 2019
62 See accompanying notes to schedules
Deferred Outflows of Resources Deferred Inflows of Resources Pension Expense
Employer
6/30/19 Net Pension Liability
(NPL)
Differences Between Expected
and Actual Experience
Net Difference Between Projected and Actual Earnings
on Pension Plan Investments
Changes of Assumptions
Changes in Proportion
Total Deferred Outflows of Resources
Differences Between Expected
and Actual Experience
Changes of Assumptions
Changes in Proportion
Total Deferred Inflows of Resources
Proportionate Share of Plan
Pension Expense
Net Recognition of Deferred Amounts from Changes in
Proportionate ShareEmployer Pension Expense Allocated
Additional Unfunded Liability
PaymentsTotal Employer
Pension Expense
4850 The Guidance Center $ 3,761,684 $ 8,234 $ 88,501 $ 114,971 $ 27,567 $ 239,273 $ 94,735 $ 7,624 $ 529,401 $ 631,760 $ 469,910 $ (172,489) $ 297,421 $ - $ 297,421
4851 Wyandotte County Extension Council 47,539 104 1,118 1,453 2,320 4,995 1,197 96 1,558 2,851 5,939 (3,175) 2,764 - 2,764
4853 North Edwards Co Cemetery District 24,859 54 585 760 2,231 3,630 626 50 5,610 6,286 3,105 (124) 2,981 - 2,981
4859 Geary Community Hospital 11,620,534 25,437 273,395 355,166 - 653,998 292,654 23,553 2,155,683 2,471,890 1,451,638 (834,127) 617,511 - 617,511
4860 Clearwater Public Library 40,873 89 961 1,249 4,499 6,798 1,029 83 1,899 3,011 5,106 1,146 6,252 - 6,252
4863 Chanute Recreation & Parks Commission 207,300 454 4,877 6,336 17,344 29,011 5,221 420 - 5,641 25,896 15,643 41,539 - 41,539
4867 Greenwood County Conservation Dist 21,352 47 502 653 1,484 2,686 538 43 1,212 1,793 2,667 (654) 2,013 - 2,013
4873 City of Kechi 507,749 1,111 11,946 15,519 43,402 71,978 12,787 1,029 - 13,816 63,428 21,133 84,561 - 84,561
4878 Stanton County Conservation Dist 16,838 37 396 515 - 948 424 34 6,681 7,139 2,103 (1,635) 468 - 468
4879 Marshall County Extension Council 24,063 53 566 735 687 2,041 606 49 816 1,471 3,006 907 3,913 - 3,913
4880 Marion Co Conservation Dist 86,134 189 2,027 2,633 24,325 29,174 2,169 175 1,911 4,255 10,760 9,221 19,981 - 19,981
4887 Harvey County Extension Council 42,634 93 1,003 1,303 6,034 8,433 1,074 86 18,234 19,394 5,326 (3,121) 2,205 - 2,205
4889 Haskell County Conservation Dist 20,080 44 473 614 2,673 3,804 506 41 2,796 3,343 2,508 (889) 1,619 - 1,619
4891 Twin Caney Watershed Jt Dist 34 10,327 23 243 316 - 582 260 21 6,473 6,754 1,290 (3,124) (1,834) - (1,834)
4893 Bourbon County Conservation Dist 55,993 123 1,317 1,711 6,047 9,198 1,410 113 6,445 7,968 6,995 (981) 6,014 - 6,014
4894 Butler County Conservation Dist 66,794 146 1,572 2,041 14,221 17,980 1,682 135 - 1,817 8,344 6,916 15,260 - 15,260
4895 Mitchell County Conservation Dist 18,501 40 435 565 547 1,587 466 37 794 1,297 2,311 (48) 2,263 - 2,263
4896 Morris County Conservation District 76,436 167 1,799 2,336 9,825 14,127 1,925 155 857 2,937 9,548 9,082 18,630 - 18,630
4897 Nemaha County Conservation District 49,802 109 1,171 1,522 17,446 20,248 1,254 101 859 2,214 6,221 2,197 8,418 - 8,418
4899 Wabaunsee County Conservation District 42,578 93 1,002 1,301 8,773 11,169 1,072 86 557 1,715 5,319 1,888 7,207 - 7,207
4900 Washington County Conservation Dist 24,077 53 566 736 148 1,503 606 49 2,661 3,316 3,008 (2,318) 690 - 690
4911 Marshall County Conservation Dist 70,511 154 1,659 2,155 8,773 12,741 1,776 143 2,369 4,288 8,808 3,275 12,083 - 12,083
4913 Southwest Medical Center 17,949,317 39,290 422,292 548,596 2,396,206 3,406,384 452,039 36,380 - 488,419 2,242,231 869,397 3,111,628 - 3,111,628
4914 Cowley Co Conservation District 40,831 89 960 1,248 7,014 9,311 1,028 83 21,167 22,278 5,101 1,069 6,170 - 6,170
4917 Osborne County Conservation Dist 22,316 49 526 682 927 2,184 562 45 386 993 2,788 363 3,151 - 3,151
4919 Ottawa County Conservation District 21,575 47 507 659 1,621 2,834 543 44 553 1,140 2,695 626 3,321 - 3,321
4920 Cloud Co Conservation District 23,616 52 556 722 1,734 3,064 595 48 256 899 2,950 786 3,736 - 3,736
4925 Pawnee County Conservation District 32,237 71 759 985 824 2,639 812 65 276 1,153 4,027 673 4,700 - 4,700
4926 Rawlins County Conservation Dist 22,442 49 528 686 1,363 2,626 565 45 2,750 3,360 2,803 (439) 2,364 - 2,364
4927 Republic County Conservation Dist 20,388 45 480 623 2,774 3,922 513 41 10,957 11,511 2,547 (1,786) 761 - 761
4928 Smith County Conservation District 23,113 51 544 706 2,982 4,283 582 47 952 1,581 2,887 (41) 2,846 - 2,846
4932 Crawford County Conservation Dist 24,873 54 586 760 457 1,857 626 50 1,604 2,280 3,107 (93) 3,014 - 3,014
4933 Hodgeman County Conservation Dist 38,987 85 918 1,192 13,285 15,480 982 79 142 1,203 4,870 3,889 8,759 - 8,759
4935 Wyandotte County Conservation District 31,776 70 748 971 9,552 11,341 800 64 8,486 9,350 3,969 (675) 3,294 - 3,294
(continued)
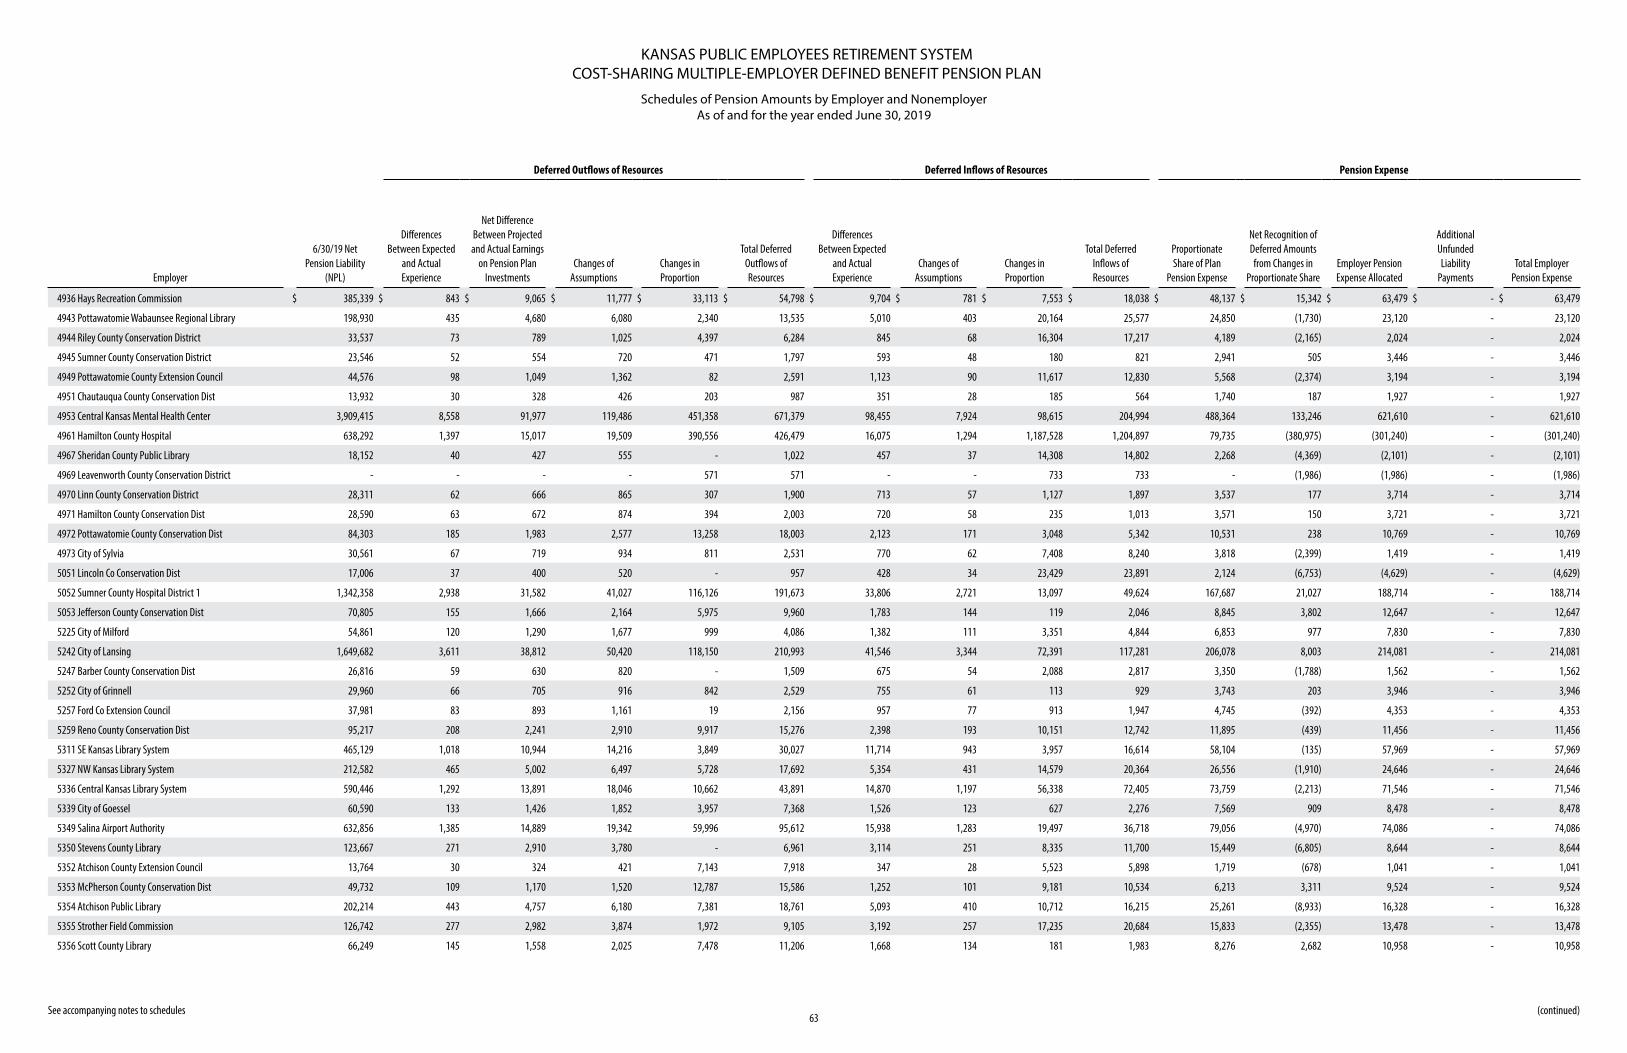
KANSAS PUBLIC EMPLOYEES RETIREMENT SYSTEMCOST-SHARING MULTIPLE-EMPLOYER DEFINED BENEFIT PENSION PLAN
Schedules of Pension Amounts by Employer and NonemployerAs of and for the year ended June 30, 2019
63 See accompanying notes to schedules
Deferred Outflows of Resources Deferred Inflows of Resources Pension Expense
Employer
6/30/19 Net Pension Liability
(NPL)
Differences Between Expected
and Actual Experience
Net Difference Between Projected and Actual Earnings
on Pension Plan Investments
Changes of Assumptions
Changes in Proportion
Total Deferred Outflows of Resources
Differences Between Expected
and Actual Experience
Changes of Assumptions
Changes in Proportion
Total Deferred Inflows of Resources
Proportionate Share of Plan
Pension Expense
Net Recognition of Deferred Amounts from Changes in
Proportionate ShareEmployer Pension Expense Allocated
Additional Unfunded Liability
PaymentsTotal Employer
Pension Expense
4936 Hays Recreation Commission $ 385,339 $ 843 $ 9,065 $ 11,777 $ 33,113 $ 54,798 $ 9,704 $ 781 $ 7,553 $ 18,038 $ 48,137 $ 15,342 $ 63,479 $ - $ 63,479
4943 Pottawatomie Wabaunsee Regional Library 198,930 435 4,680 6,080 2,340 13,535 5,010 403 20,164 25,577 24,850 (1,730) 23,120 - 23,120
4944 Riley County Conservation District 33,537 73 789 1,025 4,397 6,284 845 68 16,304 17,217 4,189 (2,165) 2,024 - 2,024
4945 Sumner County Conservation District 23,546 52 554 720 471 1,797 593 48 180 821 2,941 505 3,446 - 3,446
4949 Pottawatomie County Extension Council 44,576 98 1,049 1,362 82 2,591 1,123 90 11,617 12,830 5,568 (2,374) 3,194 - 3,194
4951 Chautauqua County Conservation Dist 13,932 30 328 426 203 987 351 28 185 564 1,740 187 1,927 - 1,927
4953 Central Kansas Mental Health Center 3,909,415 8,558 91,977 119,486 451,358 671,379 98,455 7,924 98,615 204,994 488,364 133,246 621,610 - 621,610
4961 Hamilton County Hospital 638,292 1,397 15,017 19,509 390,556 426,479 16,075 1,294 1,187,528 1,204,897 79,735 (380,975) (301,240) - (301,240)
4967 Sheridan County Public Library 18,152 40 427 555 - 1,022 457 37 14,308 14,802 2,268 (4,369) (2,101) - (2,101)
4969 Leavenworth County Conservation District - - - - 571 571 - - 733 733 - (1,986) (1,986) - (1,986)
4970 Linn County Conservation District 28,311 62 666 865 307 1,900 713 57 1,127 1,897 3,537 177 3,714 - 3,714
4971 Hamilton County Conservation Dist 28,590 63 672 874 394 2,003 720 58 235 1,013 3,571 150 3,721 - 3,721
4972 Pottawatomie County Conservation Dist 84,303 185 1,983 2,577 13,258 18,003 2,123 171 3,048 5,342 10,531 238 10,769 - 10,769
4973 City of Sylvia 30,561 67 719 934 811 2,531 770 62 7,408 8,240 3,818 (2,399) 1,419 - 1,419
5051 Lincoln Co Conservation Dist 17,006 37 400 520 - 957 428 34 23,429 23,891 2,124 (6,753) (4,629) - (4,629)
5052 Sumner County Hospital District 1 1,342,358 2,938 31,582 41,027 116,126 191,673 33,806 2,721 13,097 49,624 167,687 21,027 188,714 - 188,714
5053 Jefferson County Conservation Dist 70,805 155 1,666 2,164 5,975 9,960 1,783 144 119 2,046 8,845 3,802 12,647 - 12,647
5225 City of Milford 54,861 120 1,290 1,677 999 4,086 1,382 111 3,351 4,844 6,853 977 7,830 - 7,830
5242 City of Lansing 1,649,682 3,611 38,812 50,420 118,150 210,993 41,546 3,344 72,391 117,281 206,078 8,003 214,081 - 214,081
5247 Barber County Conservation Dist 26,816 59 630 820 - 1,509 675 54 2,088 2,817 3,350 (1,788) 1,562 - 1,562
5252 City of Grinnell 29,960 66 705 916 842 2,529 755 61 113 929 3,743 203 3,946 - 3,946
5257 Ford Co Extension Council 37,981 83 893 1,161 19 2,156 957 77 913 1,947 4,745 (392) 4,353 - 4,353
5259 Reno County Conservation Dist 95,217 208 2,241 2,910 9,917 15,276 2,398 193 10,151 12,742 11,895 (439) 11,456 - 11,456
5311 SE Kansas Library System 465,129 1,018 10,944 14,216 3,849 30,027 11,714 943 3,957 16,614 58,104 (135) 57,969 - 57,969
5327 NW Kansas Library System 212,582 465 5,002 6,497 5,728 17,692 5,354 431 14,579 20,364 26,556 (1,910) 24,646 - 24,646
5336 Central Kansas Library System 590,446 1,292 13,891 18,046 10,662 43,891 14,870 1,197 56,338 72,405 73,759 (2,213) 71,546 - 71,546
5339 City of Goessel 60,590 133 1,426 1,852 3,957 7,368 1,526 123 627 2,276 7,569 909 8,478 - 8,478
5349 Salina Airport Authority 632,856 1,385 14,889 19,342 59,996 95,612 15,938 1,283 19,497 36,718 79,056 (4,970) 74,086 - 74,086
5350 Stevens County Library 123,667 271 2,910 3,780 - 6,961 3,114 251 8,335 11,700 15,449 (6,805) 8,644 - 8,644
5352 Atchison County Extension Council 13,764 30 324 421 7,143 7,918 347 28 5,523 5,898 1,719 (678) 1,041 - 1,041
5353 McPherson County Conservation Dist 49,732 109 1,170 1,520 12,787 15,586 1,252 101 9,181 10,534 6,213 3,311 9,524 - 9,524
5354 Atchison Public Library 202,214 443 4,757 6,180 7,381 18,761 5,093 410 10,712 16,215 25,261 (8,933) 16,328 - 16,328
5355 Strother Field Commission 126,742 277 2,982 3,874 1,972 9,105 3,192 257 17,235 20,684 15,833 (2,355) 13,478 - 13,478
5356 Scott County Library 66,249 145 1,558 2,025 7,478 11,206 1,668 134 181 1,983 8,276 2,682 10,958 - 10,958
(continued)

KANSAS PUBLIC EMPLOYEES RETIREMENT SYSTEMCOST-SHARING MULTIPLE-EMPLOYER DEFINED BENEFIT PENSION PLAN
Schedules of Pension Amounts by Employer and NonemployerAs of and for the year ended June 30, 2019
64 See accompanying notes to schedules
Deferred Outflows of Resources Deferred Inflows of Resources Pension Expense
Employer
6/30/19 Net Pension Liability
(NPL)
Differences Between Expected
and Actual Experience
Net Difference Between Projected and Actual Earnings
on Pension Plan Investments
Changes of Assumptions
Changes in Proportion
Total Deferred Outflows of Resources
Differences Between Expected
and Actual Experience
Changes of Assumptions
Changes in Proportion
Total Deferred Inflows of Resources
Proportionate Share of Plan
Pension Expense
Net Recognition of Deferred Amounts from Changes in
Proportionate ShareEmployer Pension Expense Allocated
Additional Unfunded Liability
PaymentsTotal Employer
Pension Expense
5357 Marion County Extension Council $ 24,901 $ 55 $ 586 $ 761 $ 473 $ 1,875 $ 627 $ 50 $ 4,057 $ 4,734 $ 3,111 $ (857) $ 2,254 $ - $ 2,254
5363 Allen County Conservation District 22,861 50 538 699 3,634 4,921 576 46 1,437 2,059 2,856 517 3,373 - 3,373
5369 Ness County Conservation Dist 50,878 111 1,197 1,555 8,917 11,780 1,281 103 5,630 7,014 6,356 340 6,696 - 6,696
5371 Southwest Guidance Center 757,012 1,657 17,810 23,137 7,985 50,589 19,065 1,534 79,236 99,835 94,566 (16,269) 78,297 - 78,297
5380 Kearny County Library 66,878 146 1,574 2,044 2,627 6,391 1,684 136 32,293 34,113 8,354 (8,848) (494) - (494)
5381 Wellsville City Library 43,961 96 1,035 1,344 1,836 4,311 1,107 89 451 1,647 5,492 420 5,912 - 5,912
5384 Cherokee County Conservation Dist 12,101 26 285 370 - 681 305 25 697 1,027 1,512 (370) 1,142 - 1,142
5389 City of Edgerton 929,839 2,035 21,876 28,419 252,759 305,089 23,417 1,885 - 25,302 116,156 91,464 207,620 - 207,620
5390 Independence Recreation Commission 195,786 429 4,607 5,984 830 11,850 4,931 397 4,956 10,284 24,458 (278) 24,180 - 24,180
5391 Neosho County Conservation District 21,673 47 510 662 1,295 2,514 546 44 789 1,379 2,707 16 2,723 - 2,723
5408 NE Kansas Library System 431,606 945 10,154 13,191 15,597 39,887 10,870 875 21,409 33,154 53,916 (3,180) 50,736 - 50,736
5413 Library Dist 1 Miami County 197,574 432 4,648 6,039 4,140 15,259 4,976 400 20,042 25,418 24,681 (622) 24,059 - 24,059
5414 Southwest Kansas Library System 264,173 578 6,215 8,074 42,774 57,641 6,653 535 49,947 57,135 33,001 (3,407) 29,594 - 29,594
5421 City of Grandview Plaza 489,332 1,071 11,513 14,956 30,113 57,653 12,323 992 1,227 14,542 61,127 15,486 76,613 - 76,613
5427 Lyon County Conservation District 37,981 83 893 1,161 11,391 13,528 957 77 3,034 4,068 4,745 (1,787) 2,958 - 2,958
5433 Riley County Extension Council 108,394 237 2,550 3,313 1,118 7,218 2,730 220 915 3,865 13,541 545 14,086 - 14,086
5438 City of Holcomb 186,423 408 4,386 5,698 11,518 22,010 4,695 378 77,211 82,284 23,288 (17,170) 6,118 - 6,118
5440 Newton Recreation Comm 447,313 979 10,524 13,672 10,890 36,065 11,265 907 21,060 33,232 55,878 (2,351) 53,527 - 53,527
5441 Southeast Kansas Mental Health Center 3,275,525 7,170 77,063 100,112 165,521 349,866 82,491 6,639 186,858 275,988 409,179 32,512 441,691 - 441,691
5446 Saline County/City Building Authority 204,324 447 4,807 6,245 4,057 15,556 5,146 414 24,273 29,833 25,524 (9,286) 16,238 - 16,238
5454 RWD 2 Miami Co 487,459 1,067 11,468 14,899 60,911 88,345 12,276 988 5,422 18,686 60,893 17,030 77,923 - 77,923
5463 City of Leonardville 57,879 127 1,362 1,769 3,931 7,189 1,458 117 59 1,634 7,230 1,167 8,397 - 8,397
5466 Grant County Cemetery District 29,582 65 696 904 16,375 18,040 745 60 409 1,214 3,695 4,310 8,005 - 8,005
5470 Pawnee Watershed District 81 102,092 223 2,402 3,120 32,920 38,665 2,571 207 5,802 8,580 12,753 9,514 22,267 - 22,267
5471 City of Walton 55,713 122 1,311 1,703 22,744 25,880 1,403 113 17,967 19,483 6,960 1,399 8,359 - 8,359
5472 Grant County Conservation Dist 17,872 39 421 546 1,247 2,253 450 36 3,496 3,982 2,233 (1,036) 1,197 - 1,197
5475 North East Animal Control Commission 43,416 95 1,022 1,327 1,638 4,082 1,093 88 25,217 26,398 5,424 (5,573) (149) - (149)
5478 RWD 3 Miami Co 49,439 108 1,163 1,511 2,378 5,160 1,245 100 6,786 8,131 6,176 (530) 5,646 - 5,646
5479 Wyandotte County Law Library 6,162 13 145 188 343 689 155 12 14,200 14,367 770 (8,176) (7,406) - (7,406)
5489 Sumner County Extension Council 24,664 54 581 754 3,593 4,982 621 50 1,496 2,167 3,081 412 3,493 - 3,493
5494 Pratt County Conservation Dist 24,161 53 568 738 357 1,716 608 49 780 1,437 3,018 (135) 2,883 - 2,883
5497 Morton County Library 76,297 167 1,795 2,332 1,354 5,648 1,921 155 23,568 25,644 9,531 (11,432) (1,901) - (1,901)
5498 Kingman County Conservation Dist 56,985 125 1,340 1,742 14,814 18,021 1,435 115 437 1,987 7,119 3,895 11,014 - 11,014
5501 Wakarusa Watershed Dist 35 52,932 116 1,246 1,618 3,413 6,393 1,333 107 505 1,945 6,612 2,039 8,651 - 8,651
(continued)
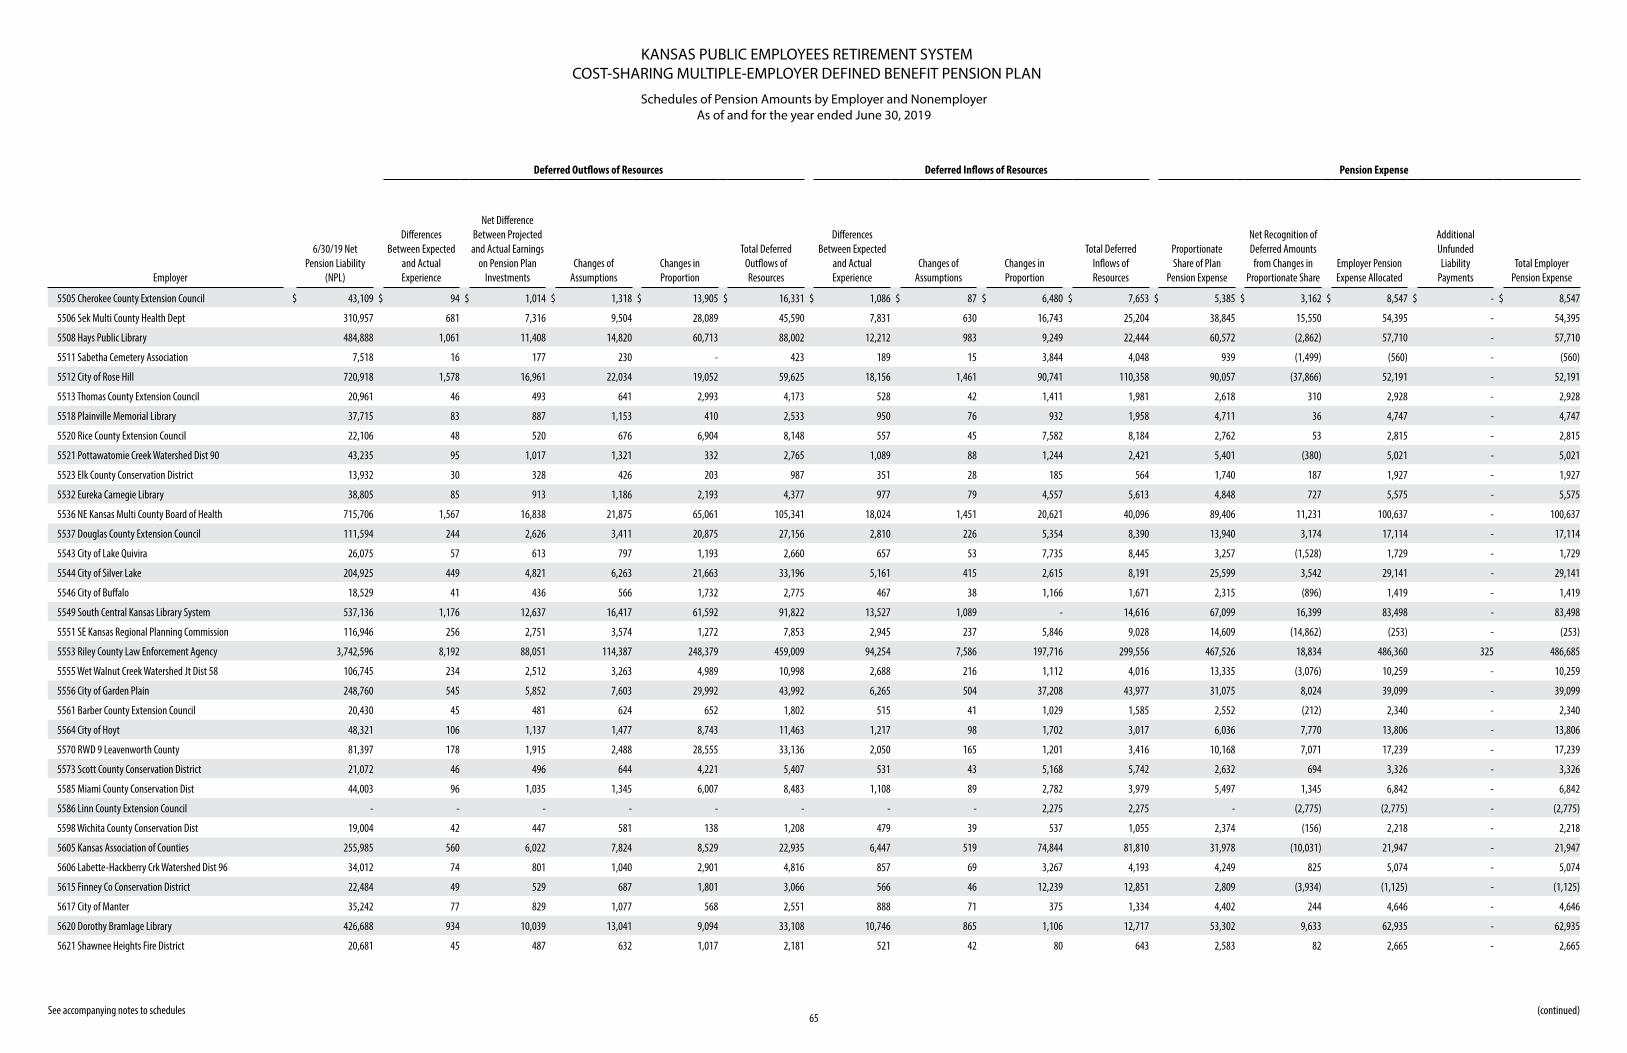
KANSAS PUBLIC EMPLOYEES RETIREMENT SYSTEMCOST-SHARING MULTIPLE-EMPLOYER DEFINED BENEFIT PENSION PLAN
Schedules of Pension Amounts by Employer and NonemployerAs of and for the year ended June 30, 2019
65 See accompanying notes to schedules
Deferred Outflows of Resources Deferred Inflows of Resources Pension Expense
Employer
6/30/19 Net Pension Liability
(NPL)
Differences Between Expected
and Actual Experience
Net Difference Between Projected and Actual Earnings
on Pension Plan Investments
Changes of Assumptions
Changes in Proportion
Total Deferred Outflows of Resources
Differences Between Expected
and Actual Experience
Changes of Assumptions
Changes in Proportion
Total Deferred Inflows of Resources
Proportionate Share of Plan
Pension Expense
Net Recognition of Deferred Amounts from Changes in
Proportionate ShareEmployer Pension Expense Allocated
Additional Unfunded Liability
PaymentsTotal Employer
Pension Expense
5505 Cherokee County Extension Council $ 43,109 $ 94 $ 1,014 $ 1,318 $ 13,905 $ 16,331 $ 1,086 $ 87 $ 6,480 $ 7,653 $ 5,385 $ 3,162 $ 8,547 $ - $ 8,547
5506 Sek Multi County Health Dept 310,957 681 7,316 9,504 28,089 45,590 7,831 630 16,743 25,204 38,845 15,550 54,395 - 54,395
5508 Hays Public Library 484,888 1,061 11,408 14,820 60,713 88,002 12,212 983 9,249 22,444 60,572 (2,862) 57,710 - 57,710
5511 Sabetha Cemetery Association 7,518 16 177 230 - 423 189 15 3,844 4,048 939 (1,499) (560) - (560)
5512 City of Rose Hill 720,918 1,578 16,961 22,034 19,052 59,625 18,156 1,461 90,741 110,358 90,057 (37,866) 52,191 - 52,191
5513 Thomas County Extension Council 20,961 46 493 641 2,993 4,173 528 42 1,411 1,981 2,618 310 2,928 - 2,928
5518 Plainville Memorial Library 37,715 83 887 1,153 410 2,533 950 76 932 1,958 4,711 36 4,747 - 4,747
5520 Rice County Extension Council 22,106 48 520 676 6,904 8,148 557 45 7,582 8,184 2,762 53 2,815 - 2,815
5521 Pottawatomie Creek Watershed Dist 90 43,235 95 1,017 1,321 332 2,765 1,089 88 1,244 2,421 5,401 (380) 5,021 - 5,021
5523 Elk County Conservation District 13,932 30 328 426 203 987 351 28 185 564 1,740 187 1,927 - 1,927
5532 Eureka Carnegie Library 38,805 85 913 1,186 2,193 4,377 977 79 4,557 5,613 4,848 727 5,575 - 5,575
5536 NE Kansas Multi County Board of Health 715,706 1,567 16,838 21,875 65,061 105,341 18,024 1,451 20,621 40,096 89,406 11,231 100,637 - 100,637
5537 Douglas County Extension Council 111,594 244 2,626 3,411 20,875 27,156 2,810 226 5,354 8,390 13,940 3,174 17,114 - 17,114
5543 City of Lake Quivira 26,075 57 613 797 1,193 2,660 657 53 7,735 8,445 3,257 (1,528) 1,729 - 1,729
5544 City of Silver Lake 204,925 449 4,821 6,263 21,663 33,196 5,161 415 2,615 8,191 25,599 3,542 29,141 - 29,141
5546 City of Buffalo 18,529 41 436 566 1,732 2,775 467 38 1,166 1,671 2,315 (896) 1,419 - 1,419
5549 South Central Kansas Library System 537,136 1,176 12,637 16,417 61,592 91,822 13,527 1,089 - 14,616 67,099 16,399 83,498 - 83,498
5551 SE Kansas Regional Planning Commission 116,946 256 2,751 3,574 1,272 7,853 2,945 237 5,846 9,028 14,609 (14,862) (253) - (253)
5553 Riley County Law Enforcement Agency 3,742,596 8,192 88,051 114,387 248,379 459,009 94,254 7,586 197,716 299,556 467,526 18,834 486,360 325 486,685
5555 Wet Walnut Creek Watershed Jt Dist 58 106,745 234 2,512 3,263 4,989 10,998 2,688 216 1,112 4,016 13,335 (3,076) 10,259 - 10,259
5556 City of Garden Plain 248,760 545 5,852 7,603 29,992 43,992 6,265 504 37,208 43,977 31,075 8,024 39,099 - 39,099
5561 Barber County Extension Council 20,430 45 481 624 652 1,802 515 41 1,029 1,585 2,552 (212) 2,340 - 2,340
5564 City of Hoyt 48,321 106 1,137 1,477 8,743 11,463 1,217 98 1,702 3,017 6,036 7,770 13,806 - 13,806
5570 RWD 9 Leavenworth County 81,397 178 1,915 2,488 28,555 33,136 2,050 165 1,201 3,416 10,168 7,071 17,239 - 17,239
5573 Scott County Conservation District 21,072 46 496 644 4,221 5,407 531 43 5,168 5,742 2,632 694 3,326 - 3,326
5585 Miami County Conservation Dist 44,003 96 1,035 1,345 6,007 8,483 1,108 89 2,782 3,979 5,497 1,345 6,842 - 6,842
5586 Linn County Extension Council - - - - - - - - 2,275 2,275 - (2,775) (2,775) - (2,775)
5598 Wichita County Conservation Dist 19,004 42 447 581 138 1,208 479 39 537 1,055 2,374 (156) 2,218 - 2,218
5605 Kansas Association of Counties 255,985 560 6,022 7,824 8,529 22,935 6,447 519 74,844 81,810 31,978 (10,031) 21,947 - 21,947
5606 Labette-Hackberry Crk Watershed Dist 96 34,012 74 801 1,040 2,901 4,816 857 69 3,267 4,193 4,249 825 5,074 - 5,074
5615 Finney Co Conservation District 22,484 49 529 687 1,801 3,066 566 46 12,239 12,851 2,809 (3,934) (1,125) - (1,125)
5617 City of Manter 35,242 77 829 1,077 568 2,551 888 71 375 1,334 4,402 244 4,646 - 4,646
5620 Dorothy Bramlage Library 426,688 934 10,039 13,041 9,094 33,108 10,746 865 1,106 12,717 53,302 9,633 62,935 - 62,935
5621 Shawnee Heights Fire District 20,681 45 487 632 1,017 2,181 521 42 80 643 2,583 82 2,665 - 2,665
(continued)

KANSAS PUBLIC EMPLOYEES RETIREMENT SYSTEMCOST-SHARING MULTIPLE-EMPLOYER DEFINED BENEFIT PENSION PLAN
Schedules of Pension Amounts by Employer and NonemployerAs of and for the year ended June 30, 2019
66 See accompanying notes to schedules
Deferred Outflows of Resources Deferred Inflows of Resources Pension Expense
Employer
6/30/19 Net Pension Liability
(NPL)
Differences Between Expected
and Actual Experience
Net Difference Between Projected and Actual Earnings
on Pension Plan Investments
Changes of Assumptions
Changes in Proportion
Total Deferred Outflows of Resources
Differences Between Expected
and Actual Experience
Changes of Assumptions
Changes in Proportion
Total Deferred Inflows of Resources
Proportionate Share of Plan
Pension Expense
Net Recognition of Deferred Amounts from Changes in
Proportionate ShareEmployer Pension Expense Allocated
Additional Unfunded Liability
PaymentsTotal Employer
Pension Expense
5622 Doniphan Co Rural Fire District 2 $ 97,634 $ 214 $ 2,297 $ 2,984 $ 20,380 $ 25,875 $ 2,459 $ 198 $ 3,887 $ 6,544 $ 12,197 $ 6,323 $ 18,520 $ - $ 18,520
5632 Stafford County Conservation Dist 21,016 46 494 642 3,826 5,008 529 43 2,930 3,502 2,625 207 2,832 - 2,832
5635 City of Melvern 62,141 136 1,462 1,899 - 3,497 1,565 126 10,310 12,001 7,763 (1,315) 6,448 - 6,448
5636 Geary County Conservation District 26,005 57 612 795 - 1,464 655 53 1,754 2,462 3,249 195 3,444 - 3,444
5641 Hamilton County Extension Council - - - - 37 37 - - 4,468 4,468 - (3,328) (3,328) - (3,328)
5642 Stafford Recreation Commission 33,020 72 777 1,009 1,814 3,672 832 67 924 1,823 4,125 260 4,385 - 4,385
5643 RWD 3 Marshall Co 47,888 105 1,126 1,464 11,199 13,894 1,206 97 15,949 17,252 5,982 564 6,546 - 6,546
5647 Metropolitan Topeka Airport Auth 1,429,582 3,129 33,633 43,693 10,277 90,732 36,003 2,898 50,413 89,314 178,584 545 179,129 - 179,129
5648 Dickinson Co Conservation Dist 25,418 56 598 777 756 2,187 640 52 1,072 1,764 3,175 (2,416) 759 - 759
5649 Burlington Recreation Commission 284,519 623 6,693 8,696 45,636 61,648 7,165 577 247 7,989 35,542 14,756 50,298 - 50,298
5654 Harper County Extension Council 23,154 51 545 708 478 1,782 583 47 1,835 2,465 2,892 130 3,022 - 3,022
5656 RWD 3 Nemaha Co 103,434 226 2,433 3,161 4,699 10,519 2,605 210 97 2,912 12,921 2,126 15,047 - 15,047
5661 Kansas Municipal Energy Agency 1,488,229 3,258 35,013 45,486 110,366 194,123 37,480 3,016 12,779 53,275 185,910 50,287 236,197 - 236,197
5662 Atchison County Conservation Dist 49,621 109 1,167 1,517 21,630 24,423 1,250 101 18,890 20,241 6,199 (135) 6,064 - 6,064
5665 Holcomb Recreation Commission 242,849 532 5,714 7,422 25,893 39,561 6,116 492 9,922 16,530 30,337 2,179 32,516 - 32,516
5668 City of Auburn 185,306 406 4,360 5,664 18,136 28,566 4,667 376 3,621 8,664 23,148 3,487 26,635 - 26,635
5674 RWD 1 Consolidated Shawnee Co 126,281 276 2,971 3,860 4,549 11,656 3,180 256 110 3,546 15,775 (786) 14,989 - 14,989
5675 Derby Recreation Commission 1,432,153 3,135 33,694 43,772 120,852 201,453 36,068 2,903 86,358 125,329 178,905 24,396 203,301 - 203,301
5676 RWD 2 Mitchell Co 126,420 277 2,974 3,864 46,257 53,372 3,184 256 3,611 7,051 15,792 9,910 25,702 - 25,702
5677 South Central Kansas Reg Medical Center 4,064,495 8,897 95,625 124,226 146,121 374,869 102,361 8,238 1,032,886 1,143,485 507,737 (352,289) 155,448 - 155,448
5680 Ellis County Conservation District 65,229 143 1,535 1,994 3,534 7,206 1,643 132 486 2,261 8,148 856 9,004 - 9,004
5681 Pratt County Extension Council 27,808 61 654 850 2,035 3,600 700 56 11,359 12,115 3,474 (3,789) (315) - (315)
5686 City of Park City 1,162,600 2,545 27,352 35,533 97,821 163,251 29,279 2,356 6,395 38,030 145,232 7,754 152,986 - 152,986
5687 City of Bel Aire 1,369,676 2,998 32,225 41,862 135,889 212,974 34,494 2,776 - 37,270 171,100 69,961 241,061 - 241,061
5690 Grant County Recreation Comm 362,674 794 8,533 11,085 21,716 42,128 9,134 735 23,203 33,072 45,305 (2,583) 42,722 - 42,722
5702 City of Meriden 122,074 267 2,872 3,731 8,259 15,129 3,074 247 10,153 13,474 15,250 (163) 15,087 - 15,087
5704 Highland Cemetery 33,998 74 800 1,039 9,702 11,615 856 69 4,195 5,120 4,247 (1,247) 3,000 - 3,000
5710 Public Wholesale Water District No 4 183,657 402 4,320 5,613 2,871 13,206 4,625 372 1,025 6,022 22,942 1,478 24,420 - 24,420
5715 Public Wholesale Water Supply Dist 5 119,028 261 2,801 3,638 11,585 18,285 2,998 241 583 3,822 14,869 6,381 21,250 - 21,250
5717 Kearny County Conservation District 26,313 58 619 804 1,984 3,465 663 53 4,838 5,554 3,287 (1,616) 1,671 - 1,671
5724 Marion County Rural Water District 4 54,959 120 1,293 1,680 64,507 67,600 1,384 111 61,046 62,541 6,865 6,630 13,495 - 13,495
5725 Crawford County RWD 2 45,890 100 1,080 1,403 8,713 11,296 1,156 93 2,241 3,490 5,733 3,113 8,846 - 8,846
9000 Topeka Metropolitan Transit Authority 3,284,384 7,189 77,272 100,383 213,861 398,705 82,715 6,657 42,539 131,911 410,286 97,210 507,496 - 507,496
9035 Coffey County Library 453,084 992 10,659 13,848 10,878 36,377 11,411 918 6,096 18,425 56,599 (4,496) 52,103 - 52,103
(continued)
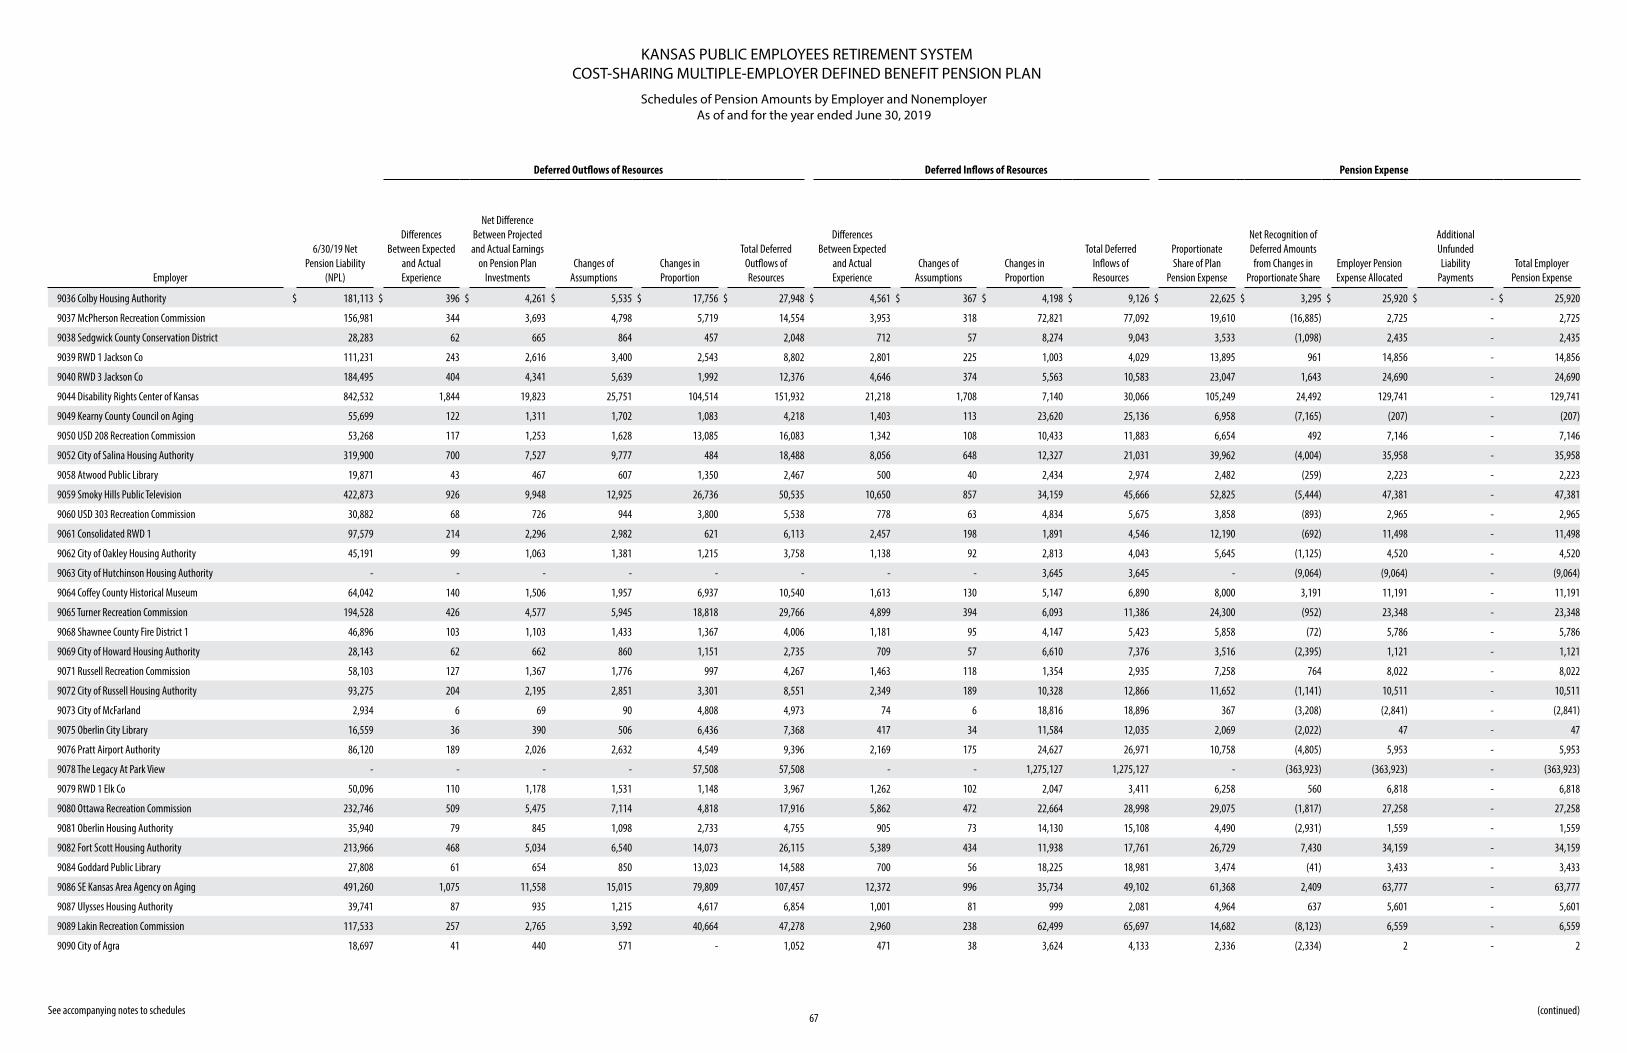
KANSAS PUBLIC EMPLOYEES RETIREMENT SYSTEMCOST-SHARING MULTIPLE-EMPLOYER DEFINED BENEFIT PENSION PLAN
Schedules of Pension Amounts by Employer and NonemployerAs of and for the year ended June 30, 2019
67 See accompanying notes to schedules
Deferred Outflows of Resources Deferred Inflows of Resources Pension Expense
Employer
6/30/19 Net Pension Liability
(NPL)
Differences Between Expected
and Actual Experience
Net Difference Between Projected and Actual Earnings
on Pension Plan Investments
Changes of Assumptions
Changes in Proportion
Total Deferred Outflows of Resources
Differences Between Expected
and Actual Experience
Changes of Assumptions
Changes in Proportion
Total Deferred Inflows of Resources
Proportionate Share of Plan
Pension Expense
Net Recognition of Deferred Amounts from Changes in
Proportionate ShareEmployer Pension Expense Allocated
Additional Unfunded Liability
PaymentsTotal Employer
Pension Expense
9036 Colby Housing Authority $ 181,113 $ 396 $ 4,261 $ 5,535 $ 17,756 $ 27,948 $ 4,561 $ 367 $ 4,198 $ 9,126 $ 22,625 $ 3,295 $ 25,920 $ - $ 25,920
9037 McPherson Recreation Commission 156,981 344 3,693 4,798 5,719 14,554 3,953 318 72,821 77,092 19,610 (16,885) 2,725 - 2,725
9038 Sedgwick County Conservation District 28,283 62 665 864 457 2,048 712 57 8,274 9,043 3,533 (1,098) 2,435 - 2,435
9039 RWD 1 Jackson Co 111,231 243 2,616 3,400 2,543 8,802 2,801 225 1,003 4,029 13,895 961 14,856 - 14,856
9040 RWD 3 Jackson Co 184,495 404 4,341 5,639 1,992 12,376 4,646 374 5,563 10,583 23,047 1,643 24,690 - 24,690
9044 Disability Rights Center of Kansas 842,532 1,844 19,823 25,751 104,514 151,932 21,218 1,708 7,140 30,066 105,249 24,492 129,741 - 129,741
9049 Kearny County Council on Aging 55,699 122 1,311 1,702 1,083 4,218 1,403 113 23,620 25,136 6,958 (7,165) (207) - (207)
9050 USD 208 Recreation Commission 53,268 117 1,253 1,628 13,085 16,083 1,342 108 10,433 11,883 6,654 492 7,146 - 7,146
9052 City of Salina Housing Authority 319,900 700 7,527 9,777 484 18,488 8,056 648 12,327 21,031 39,962 (4,004) 35,958 - 35,958
9058 Atwood Public Library 19,871 43 467 607 1,350 2,467 500 40 2,434 2,974 2,482 (259) 2,223 - 2,223
9059 Smoky Hills Public Television 422,873 926 9,948 12,925 26,736 50,535 10,650 857 34,159 45,666 52,825 (5,444) 47,381 - 47,381
9060 USD 303 Recreation Commission 30,882 68 726 944 3,800 5,538 778 63 4,834 5,675 3,858 (893) 2,965 - 2,965
9061 Consolidated RWD 1 97,579 214 2,296 2,982 621 6,113 2,457 198 1,891 4,546 12,190 (692) 11,498 - 11,498
9062 City of Oakley Housing Authority 45,191 99 1,063 1,381 1,215 3,758 1,138 92 2,813 4,043 5,645 (1,125) 4,520 - 4,520
9063 City of Hutchinson Housing Authority - - - - - - - - 3,645 3,645 - (9,064) (9,064) - (9,064)
9064 Coffey County Historical Museum 64,042 140 1,506 1,957 6,937 10,540 1,613 130 5,147 6,890 8,000 3,191 11,191 - 11,191
9065 Turner Recreation Commission 194,528 426 4,577 5,945 18,818 29,766 4,899 394 6,093 11,386 24,300 (952) 23,348 - 23,348
9068 Shawnee County Fire District 1 46,896 103 1,103 1,433 1,367 4,006 1,181 95 4,147 5,423 5,858 (72) 5,786 - 5,786
9069 City of Howard Housing Authority 28,143 62 662 860 1,151 2,735 709 57 6,610 7,376 3,516 (2,395) 1,121 - 1,121
9071 Russell Recreation Commission 58,103 127 1,367 1,776 997 4,267 1,463 118 1,354 2,935 7,258 764 8,022 - 8,022
9072 City of Russell Housing Authority 93,275 204 2,195 2,851 3,301 8,551 2,349 189 10,328 12,866 11,652 (1,141) 10,511 - 10,511
9073 City of McFarland 2,934 6 69 90 4,808 4,973 74 6 18,816 18,896 367 (3,208) (2,841) - (2,841)
9075 Oberlin City Library 16,559 36 390 506 6,436 7,368 417 34 11,584 12,035 2,069 (2,022) 47 - 47
9076 Pratt Airport Authority 86,120 189 2,026 2,632 4,549 9,396 2,169 175 24,627 26,971 10,758 (4,805) 5,953 - 5,953
9078 The Legacy At Park View - - - - 57,508 57,508 - - 1,275,127 1,275,127 - (363,923) (363,923) - (363,923)
9079 RWD 1 Elk Co 50,096 110 1,178 1,531 1,148 3,967 1,262 102 2,047 3,411 6,258 560 6,818 - 6,818
9080 Ottawa Recreation Commission 232,746 509 5,475 7,114 4,818 17,916 5,862 472 22,664 28,998 29,075 (1,817) 27,258 - 27,258
9081 Oberlin Housing Authority 35,940 79 845 1,098 2,733 4,755 905 73 14,130 15,108 4,490 (2,931) 1,559 - 1,559
9082 Fort Scott Housing Authority 213,966 468 5,034 6,540 14,073 26,115 5,389 434 11,938 17,761 26,729 7,430 34,159 - 34,159
9084 Goddard Public Library 27,808 61 654 850 13,023 14,588 700 56 18,225 18,981 3,474 (41) 3,433 - 3,433
9086 SE Kansas Area Agency on Aging 491,260 1,075 11,558 15,015 79,809 107,457 12,372 996 35,734 49,102 61,368 2,409 63,777 - 63,777
9087 Ulysses Housing Authority 39,741 87 935 1,215 4,617 6,854 1,001 81 999 2,081 4,964 637 5,601 - 5,601
9089 Lakin Recreation Commission 117,533 257 2,765 3,592 40,664 47,278 2,960 238 62,499 65,697 14,682 (8,123) 6,559 - 6,559
9090 City of Agra 18,697 41 440 571 - 1,052 471 38 3,624 4,133 2,336 (2,334) 2 - 2
(continued)
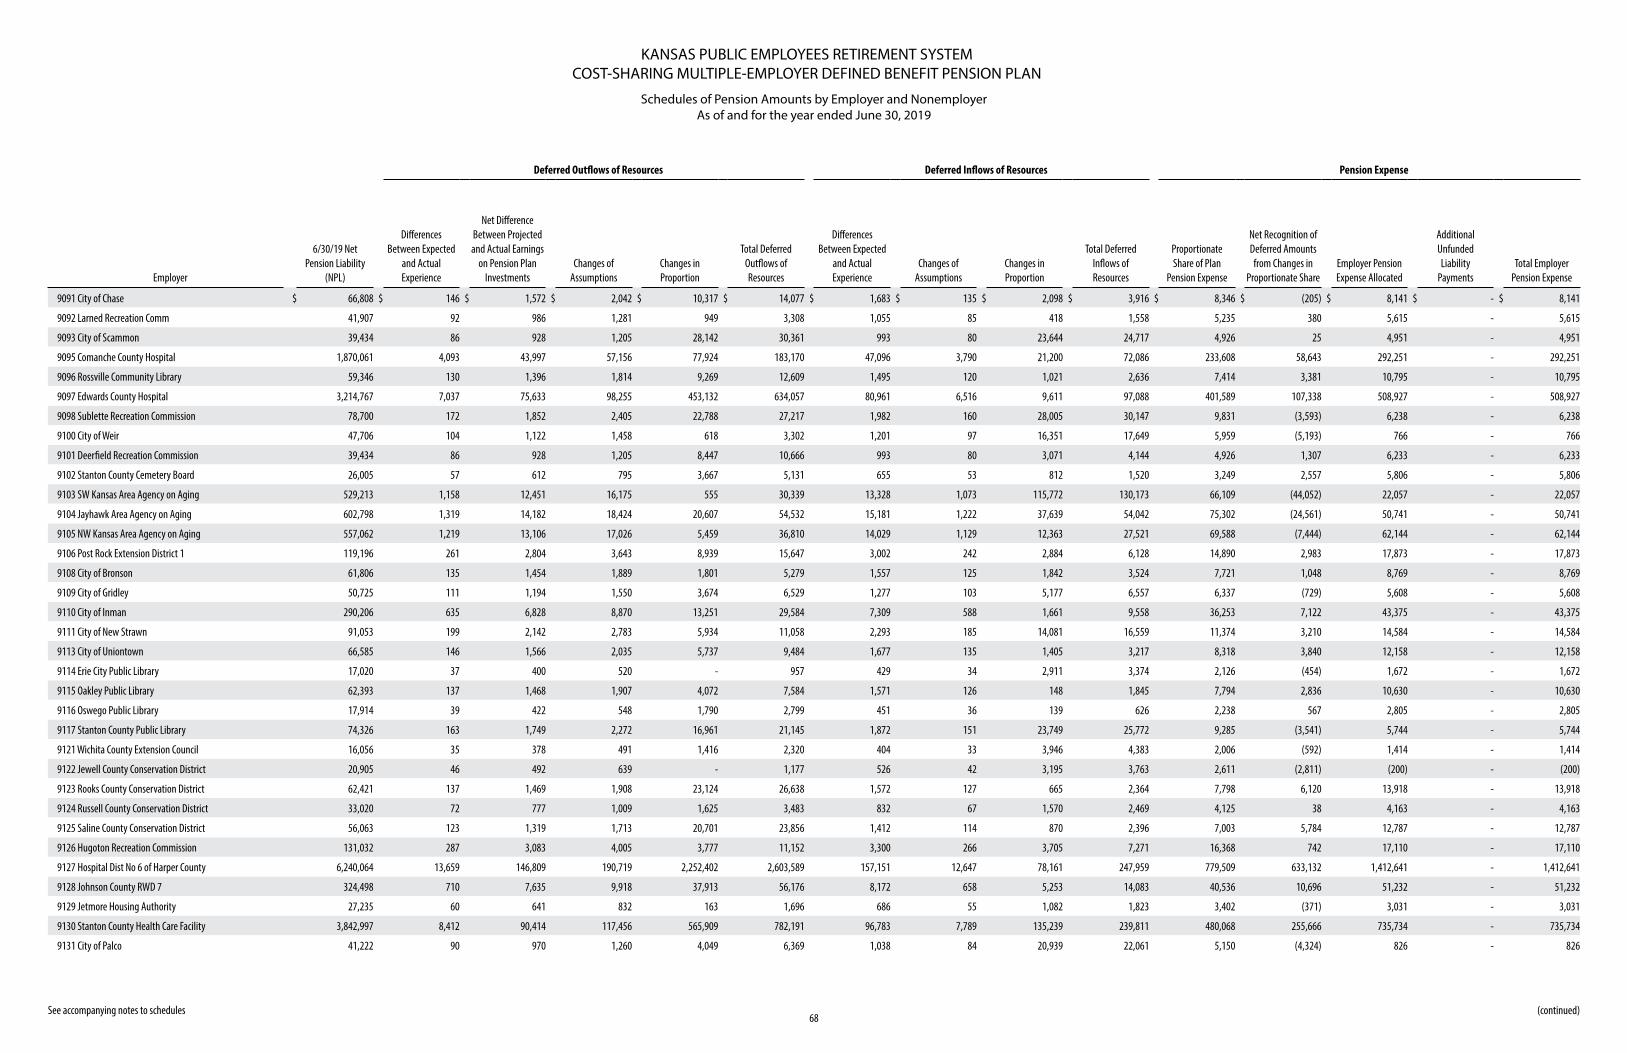
KANSAS PUBLIC EMPLOYEES RETIREMENT SYSTEMCOST-SHARING MULTIPLE-EMPLOYER DEFINED BENEFIT PENSION PLAN
Schedules of Pension Amounts by Employer and NonemployerAs of and for the year ended June 30, 2019
68 See accompanying notes to schedules
Deferred Outflows of Resources Deferred Inflows of Resources Pension Expense
Employer
6/30/19 Net Pension Liability
(NPL)
Differences Between Expected
and Actual Experience
Net Difference Between Projected and Actual Earnings
on Pension Plan Investments
Changes of Assumptions
Changes in Proportion
Total Deferred Outflows of Resources
Differences Between Expected
and Actual Experience
Changes of Assumptions
Changes in Proportion
Total Deferred Inflows of Resources
Proportionate Share of Plan
Pension Expense
Net Recognition of Deferred Amounts from Changes in
Proportionate ShareEmployer Pension Expense Allocated
Additional Unfunded Liability
PaymentsTotal Employer
Pension Expense
9091 City of Chase $ 66,808 $ 146 $ 1,572 $ 2,042 $ 10,317 $ 14,077 $ 1,683 $ 135 $ 2,098 $ 3,916 $ 8,346 $ (205) $ 8,141 $ - $ 8,141
9092 Larned Recreation Comm 41,907 92 986 1,281 949 3,308 1,055 85 418 1,558 5,235 380 5,615 - 5,615
9093 City of Scammon 39,434 86 928 1,205 28,142 30,361 993 80 23,644 24,717 4,926 25 4,951 - 4,951
9095 Comanche County Hospital 1,870,061 4,093 43,997 57,156 77,924 183,170 47,096 3,790 21,200 72,086 233,608 58,643 292,251 - 292,251
9096 Rossville Community Library 59,346 130 1,396 1,814 9,269 12,609 1,495 120 1,021 2,636 7,414 3,381 10,795 - 10,795
9097 Edwards County Hospital 3,214,767 7,037 75,633 98,255 453,132 634,057 80,961 6,516 9,611 97,088 401,589 107,338 508,927 - 508,927
9098 Sublette Recreation Commission 78,700 172 1,852 2,405 22,788 27,217 1,982 160 28,005 30,147 9,831 (3,593) 6,238 - 6,238
9100 City of Weir 47,706 104 1,122 1,458 618 3,302 1,201 97 16,351 17,649 5,959 (5,193) 766 - 766
9101 Deerfield Recreation Commission 39,434 86 928 1,205 8,447 10,666 993 80 3,071 4,144 4,926 1,307 6,233 - 6,233
9102 Stanton County Cemetery Board 26,005 57 612 795 3,667 5,131 655 53 812 1,520 3,249 2,557 5,806 - 5,806
9103 SW Kansas Area Agency on Aging 529,213 1,158 12,451 16,175 555 30,339 13,328 1,073 115,772 130,173 66,109 (44,052) 22,057 - 22,057
9104 Jayhawk Area Agency on Aging 602,798 1,319 14,182 18,424 20,607 54,532 15,181 1,222 37,639 54,042 75,302 (24,561) 50,741 - 50,741
9105 NW Kansas Area Agency on Aging 557,062 1,219 13,106 17,026 5,459 36,810 14,029 1,129 12,363 27,521 69,588 (7,444) 62,144 - 62,144
9106 Post Rock Extension District 1 119,196 261 2,804 3,643 8,939 15,647 3,002 242 2,884 6,128 14,890 2,983 17,873 - 17,873
9108 City of Bronson 61,806 135 1,454 1,889 1,801 5,279 1,557 125 1,842 3,524 7,721 1,048 8,769 - 8,769
9109 City of Gridley 50,725 111 1,194 1,550 3,674 6,529 1,277 103 5,177 6,557 6,337 (729) 5,608 - 5,608
9110 City of Inman 290,206 635 6,828 8,870 13,251 29,584 7,309 588 1,661 9,558 36,253 7,122 43,375 - 43,375
9111 City of New Strawn 91,053 199 2,142 2,783 5,934 11,058 2,293 185 14,081 16,559 11,374 3,210 14,584 - 14,584
9113 City of Uniontown 66,585 146 1,566 2,035 5,737 9,484 1,677 135 1,405 3,217 8,318 3,840 12,158 - 12,158
9114 Erie City Public Library 17,020 37 400 520 - 957 429 34 2,911 3,374 2,126 (454) 1,672 - 1,672
9115 Oakley Public Library 62,393 137 1,468 1,907 4,072 7,584 1,571 126 148 1,845 7,794 2,836 10,630 - 10,630
9116 Oswego Public Library 17,914 39 422 548 1,790 2,799 451 36 139 626 2,238 567 2,805 - 2,805
9117 Stanton County Public Library 74,326 163 1,749 2,272 16,961 21,145 1,872 151 23,749 25,772 9,285 (3,541) 5,744 - 5,744
9121 Wichita County Extension Council 16,056 35 378 491 1,416 2,320 404 33 3,946 4,383 2,006 (592) 1,414 - 1,414
9122 Jewell County Conservation District 20,905 46 492 639 - 1,177 526 42 3,195 3,763 2,611 (2,811) (200) - (200)
9123 Rooks County Conservation District 62,421 137 1,469 1,908 23,124 26,638 1,572 127 665 2,364 7,798 6,120 13,918 - 13,918
9124 Russell County Conservation District 33,020 72 777 1,009 1,625 3,483 832 67 1,570 2,469 4,125 38 4,163 - 4,163
9125 Saline County Conservation District 56,063 123 1,319 1,713 20,701 23,856 1,412 114 870 2,396 7,003 5,784 12,787 - 12,787
9126 Hugoton Recreation Commission 131,032 287 3,083 4,005 3,777 11,152 3,300 266 3,705 7,271 16,368 742 17,110 - 17,110
9127 Hospital Dist No 6 of Harper County 6,240,064 13,659 146,809 190,719 2,252,402 2,603,589 157,151 12,647 78,161 247,959 779,509 633,132 1,412,641 - 1,412,641
9128 Johnson County RWD 7 324,498 710 7,635 9,918 37,913 56,176 8,172 658 5,253 14,083 40,536 10,696 51,232 - 51,232
9129 Jetmore Housing Authority 27,235 60 641 832 163 1,696 686 55 1,082 1,823 3,402 (371) 3,031 - 3,031
9130 Stanton County Health Care Facility 3,842,997 8,412 90,414 117,456 565,909 782,191 96,783 7,789 135,239 239,811 480,068 255,666 735,734 - 735,734
9131 City of Palco 41,222 90 970 1,260 4,049 6,369 1,038 84 20,939 22,061 5,150 (4,324) 826 - 826
(continued)
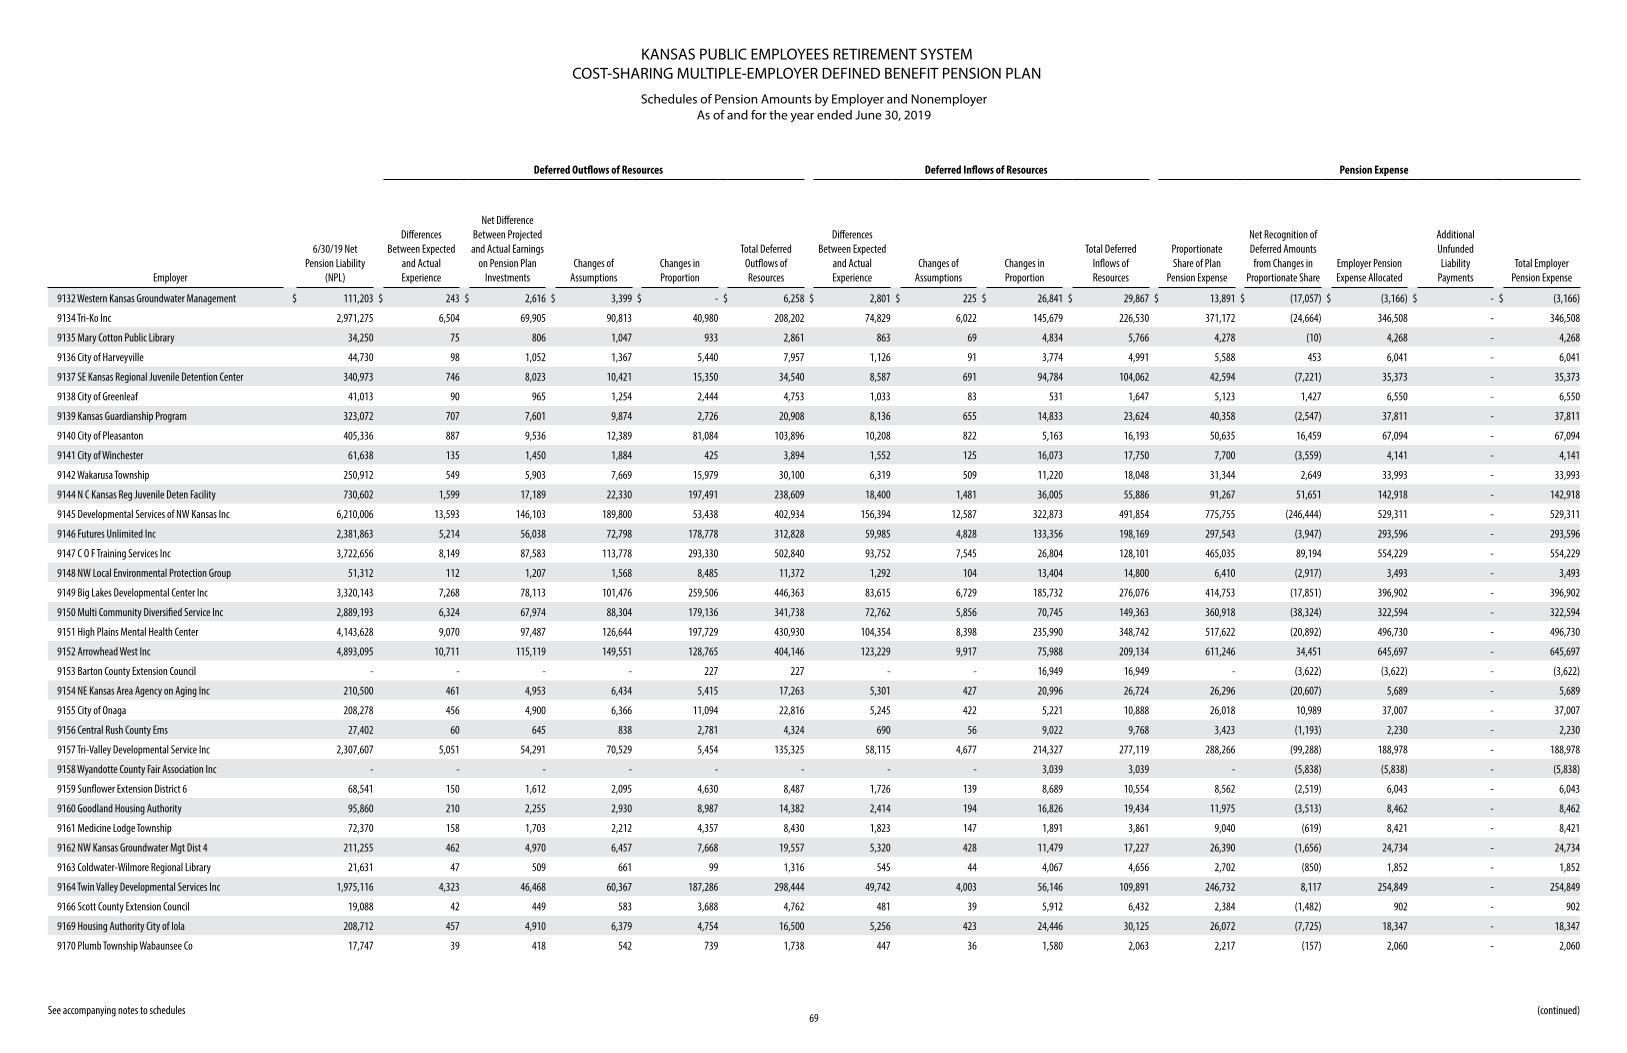
KANSAS PUBLIC EMPLOYEES RETIREMENT SYSTEMCOST-SHARING MULTIPLE-EMPLOYER DEFINED BENEFIT PENSION PLAN
Schedules of Pension Amounts by Employer and NonemployerAs of and for the year ended June 30, 2019
69 See accompanying notes to schedules
Deferred Outflows of Resources Deferred Inflows of Resources Pension Expense
Employer
6/30/19 Net Pension Liability
(NPL)
Differences Between Expected
and Actual Experience
Net Difference Between Projected and Actual Earnings
on Pension Plan Investments
Changes of Assumptions
Changes in Proportion
Total Deferred Outflows of Resources
Differences Between Expected
and Actual Experience
Changes of Assumptions
Changes in Proportion
Total Deferred Inflows of Resources
Proportionate Share of Plan
Pension Expense
Net Recognition of Deferred Amounts from Changes in
Proportionate ShareEmployer Pension Expense Allocated
Additional Unfunded Liability
PaymentsTotal Employer
Pension Expense
9132 Western Kansas Groundwater Management $ 111,203 $ 243 $ 2,616 $ 3,399 $ - $ 6,258 $ 2,801 $ 225 $ 26,841 $ 29,867 $ 13,891 $ (17,057) $ (3,166) $ - $ (3,166)
9134 Tri-Ko Inc 2,971,275 6,504 69,905 90,813 40,980 208,202 74,829 6,022 145,679 226,530 371,172 (24,664) 346,508 - 346,508
9135 Mary Cotton Public Library 34,250 75 806 1,047 933 2,861 863 69 4,834 5,766 4,278 (10) 4,268 - 4,268
9136 City of Harveyville 44,730 98 1,052 1,367 5,440 7,957 1,126 91 3,774 4,991 5,588 453 6,041 - 6,041
9137 SE Kansas Regional Juvenile Detention Center 340,973 746 8,023 10,421 15,350 34,540 8,587 691 94,784 104,062 42,594 (7,221) 35,373 - 35,373
9138 City of Greenleaf 41,013 90 965 1,254 2,444 4,753 1,033 83 531 1,647 5,123 1,427 6,550 - 6,550
9139 Kansas Guardianship Program 323,072 707 7,601 9,874 2,726 20,908 8,136 655 14,833 23,624 40,358 (2,547) 37,811 - 37,811
9140 City of Pleasanton 405,336 887 9,536 12,389 81,084 103,896 10,208 822 5,163 16,193 50,635 16,459 67,094 - 67,094
9141 City of Winchester 61,638 135 1,450 1,884 425 3,894 1,552 125 16,073 17,750 7,700 (3,559) 4,141 - 4,141
9142 Wakarusa Township 250,912 549 5,903 7,669 15,979 30,100 6,319 509 11,220 18,048 31,344 2,649 33,993 - 33,993
9144 N C Kansas Reg Juvenile Deten Facility 730,602 1,599 17,189 22,330 197,491 238,609 18,400 1,481 36,005 55,886 91,267 51,651 142,918 - 142,918
9145 Developmental Services of NW Kansas Inc 6,210,006 13,593 146,103 189,800 53,438 402,934 156,394 12,587 322,873 491,854 775,755 (246,444) 529,311 - 529,311
9146 Futures Unlimited Inc 2,381,863 5,214 56,038 72,798 178,778 312,828 59,985 4,828 133,356 198,169 297,543 (3,947) 293,596 - 293,596
9147 C O F Training Services Inc 3,722,656 8,149 87,583 113,778 293,330 502,840 93,752 7,545 26,804 128,101 465,035 89,194 554,229 - 554,229
9148 NW Local Environmental Protection Group 51,312 112 1,207 1,568 8,485 11,372 1,292 104 13,404 14,800 6,410 (2,917) 3,493 - 3,493
9149 Big Lakes Developmental Center Inc 3,320,143 7,268 78,113 101,476 259,506 446,363 83,615 6,729 185,732 276,076 414,753 (17,851) 396,902 - 396,902
9150 Multi Community Diversified Service Inc 2,889,193 6,324 67,974 88,304 179,136 341,738 72,762 5,856 70,745 149,363 360,918 (38,324) 322,594 - 322,594
9151 High Plains Mental Health Center 4,143,628 9,070 97,487 126,644 197,729 430,930 104,354 8,398 235,990 348,742 517,622 (20,892) 496,730 - 496,730
9152 Arrowhead West Inc 4,893,095 10,711 115,119 149,551 128,765 404,146 123,229 9,917 75,988 209,134 611,246 34,451 645,697 - 645,697
9153 Barton County Extension Council - - - - 227 227 - - 16,949 16,949 - (3,622) (3,622) - (3,622)
9154 NE Kansas Area Agency on Aging Inc 210,500 461 4,953 6,434 5,415 17,263 5,301 427 20,996 26,724 26,296 (20,607) 5,689 - 5,689
9155 City of Onaga 208,278 456 4,900 6,366 11,094 22,816 5,245 422 5,221 10,888 26,018 10,989 37,007 - 37,007
9156 Central Rush County Ems 27,402 60 645 838 2,781 4,324 690 56 9,022 9,768 3,423 (1,193) 2,230 - 2,230
9157 Tri-Valley Developmental Service Inc 2,307,607 5,051 54,291 70,529 5,454 135,325 58,115 4,677 214,327 277,119 288,266 (99,288) 188,978 - 188,978
9158 Wyandotte County Fair Association Inc - - - - - - - - 3,039 3,039 - (5,838) (5,838) - (5,838)
9159 Sunflower Extension District 6 68,541 150 1,612 2,095 4,630 8,487 1,726 139 8,689 10,554 8,562 (2,519) 6,043 - 6,043
9160 Goodland Housing Authority 95,860 210 2,255 2,930 8,987 14,382 2,414 194 16,826 19,434 11,975 (3,513) 8,462 - 8,462
9161 Medicine Lodge Township 72,370 158 1,703 2,212 4,357 8,430 1,823 147 1,891 3,861 9,040 (619) 8,421 - 8,421
9162 NW Kansas Groundwater Mgt Dist 4 211,255 462 4,970 6,457 7,668 19,557 5,320 428 11,479 17,227 26,390 (1,656) 24,734 - 24,734
9163 Coldwater-Wilmore Regional Library 21,631 47 509 661 99 1,316 545 44 4,067 4,656 2,702 (850) 1,852 - 1,852
9164 Twin Valley Developmental Services Inc 1,975,116 4,323 46,468 60,367 187,286 298,444 49,742 4,003 56,146 109,891 246,732 8,117 254,849 - 254,849
9166 Scott County Extension Council 19,088 42 449 583 3,688 4,762 481 39 5,912 6,432 2,384 (1,482) 902 - 902
9169 Housing Authority City of Iola 208,712 457 4,910 6,379 4,754 16,500 5,256 423 24,446 30,125 26,072 (7,725) 18,347 - 18,347
9170 Plumb Township Wabaunsee Co 17,747 39 418 542 739 1,738 447 36 1,580 2,063 2,217 (157) 2,060 - 2,060
(continued)
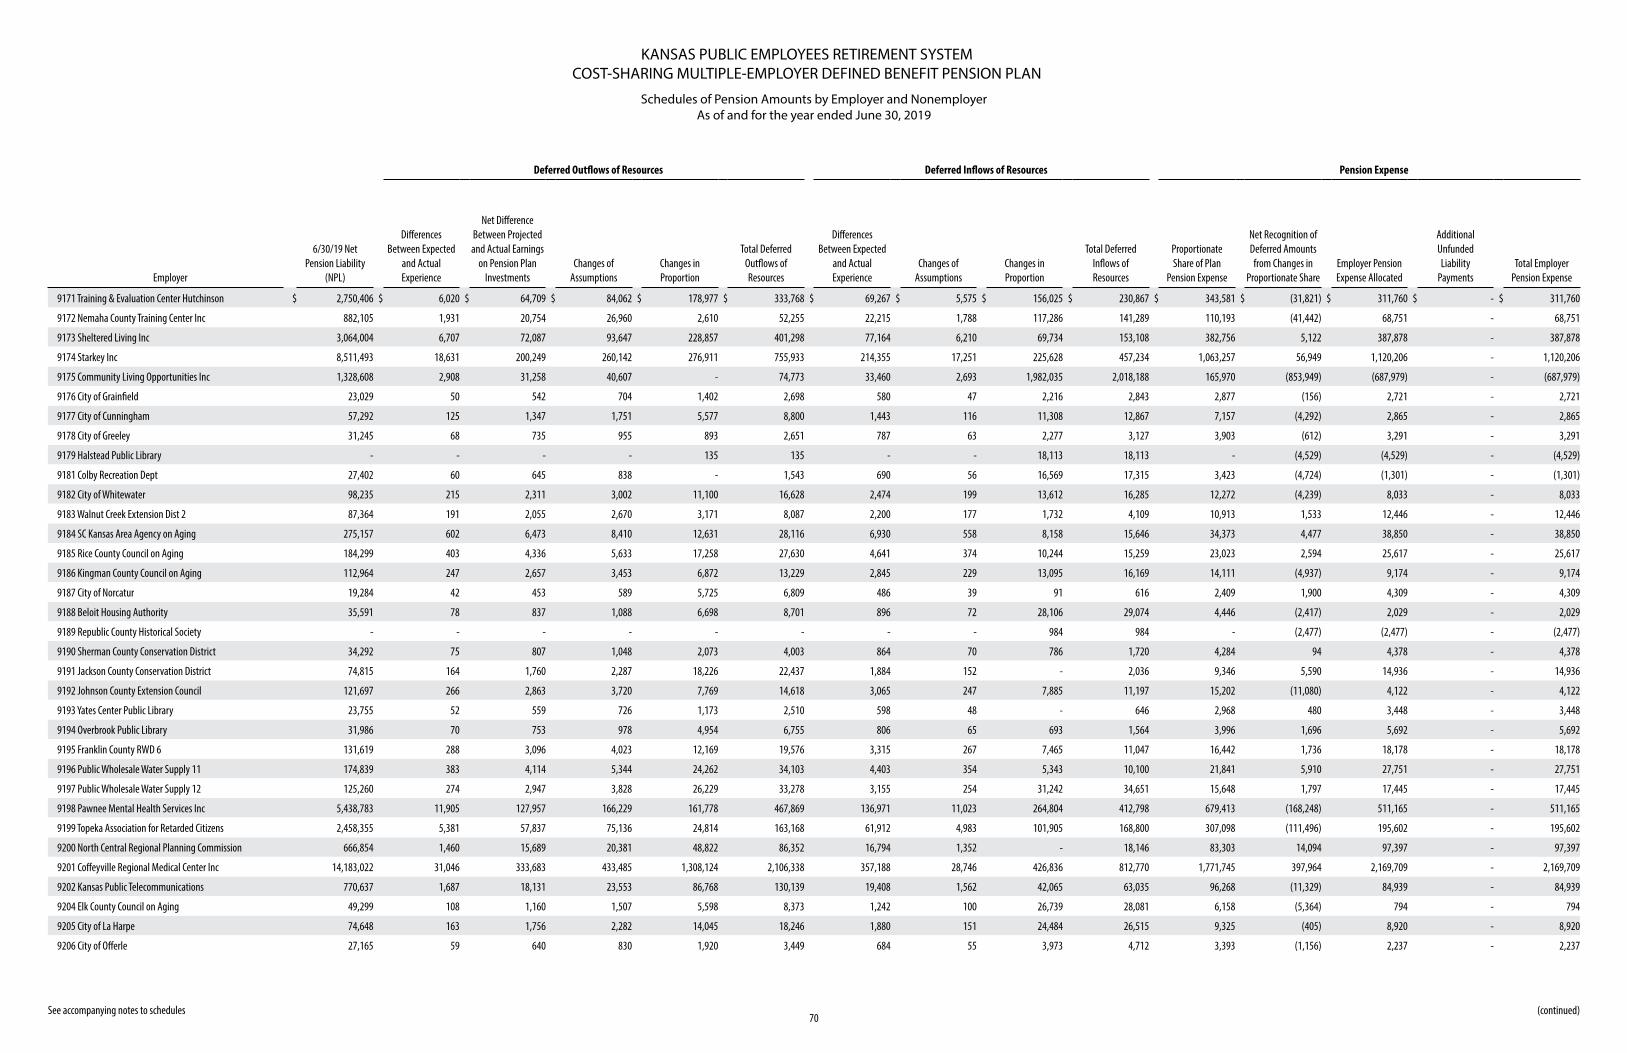
KANSAS PUBLIC EMPLOYEES RETIREMENT SYSTEMCOST-SHARING MULTIPLE-EMPLOYER DEFINED BENEFIT PENSION PLAN
Schedules of Pension Amounts by Employer and NonemployerAs of and for the year ended June 30, 2019
70 See accompanying notes to schedules
Deferred Outflows of Resources Deferred Inflows of Resources Pension Expense
Employer
6/30/19 Net Pension Liability
(NPL)
Differences Between Expected
and Actual Experience
Net Difference Between Projected and Actual Earnings
on Pension Plan Investments
Changes of Assumptions
Changes in Proportion
Total Deferred Outflows of Resources
Differences Between Expected
and Actual Experience
Changes of Assumptions
Changes in Proportion
Total Deferred Inflows of Resources
Proportionate Share of Plan
Pension Expense
Net Recognition of Deferred Amounts from Changes in
Proportionate ShareEmployer Pension Expense Allocated
Additional Unfunded Liability
PaymentsTotal Employer
Pension Expense
9171 Training & Evaluation Center Hutchinson $ 2,750,406 $ 6,020 $ 64,709 $ 84,062 $ 178,977 $ 333,768 $ 69,267 $ 5,575 $ 156,025 $ 230,867 $ 343,581 $ (31,821) $ 311,760 $ - $ 311,760
9172 Nemaha County Training Center Inc 882,105 1,931 20,754 26,960 2,610 52,255 22,215 1,788 117,286 141,289 110,193 (41,442) 68,751 - 68,751
9173 Sheltered Living Inc 3,064,004 6,707 72,087 93,647 228,857 401,298 77,164 6,210 69,734 153,108 382,756 5,122 387,878 - 387,878
9174 Starkey Inc 8,511,493 18,631 200,249 260,142 276,911 755,933 214,355 17,251 225,628 457,234 1,063,257 56,949 1,120,206 - 1,120,206
9175 Community Living Opportunities Inc 1,328,608 2,908 31,258 40,607 - 74,773 33,460 2,693 1,982,035 2,018,188 165,970 (853,949) (687,979) - (687,979)
9176 City of Grainfield 23,029 50 542 704 1,402 2,698 580 47 2,216 2,843 2,877 (156) 2,721 - 2,721
9177 City of Cunningham 57,292 125 1,347 1,751 5,577 8,800 1,443 116 11,308 12,867 7,157 (4,292) 2,865 - 2,865
9178 City of Greeley 31,245 68 735 955 893 2,651 787 63 2,277 3,127 3,903 (612) 3,291 - 3,291
9179 Halstead Public Library - - - - 135 135 - - 18,113 18,113 - (4,529) (4,529) - (4,529)
9181 Colby Recreation Dept 27,402 60 645 838 - 1,543 690 56 16,569 17,315 3,423 (4,724) (1,301) - (1,301)
9182 City of Whitewater 98,235 215 2,311 3,002 11,100 16,628 2,474 199 13,612 16,285 12,272 (4,239) 8,033 - 8,033
9183 Walnut Creek Extension Dist 2 87,364 191 2,055 2,670 3,171 8,087 2,200 177 1,732 4,109 10,913 1,533 12,446 - 12,446
9184 SC Kansas Area Agency on Aging 275,157 602 6,473 8,410 12,631 28,116 6,930 558 8,158 15,646 34,373 4,477 38,850 - 38,850
9185 Rice County Council on Aging 184,299 403 4,336 5,633 17,258 27,630 4,641 374 10,244 15,259 23,023 2,594 25,617 - 25,617
9186 Kingman County Council on Aging 112,964 247 2,657 3,453 6,872 13,229 2,845 229 13,095 16,169 14,111 (4,937) 9,174 - 9,174
9187 City of Norcatur 19,284 42 453 589 5,725 6,809 486 39 91 616 2,409 1,900 4,309 - 4,309
9188 Beloit Housing Authority 35,591 78 837 1,088 6,698 8,701 896 72 28,106 29,074 4,446 (2,417) 2,029 - 2,029
9189 Republic County Historical Society - - - - - - - - 984 984 - (2,477) (2,477) - (2,477)
9190 Sherman County Conservation District 34,292 75 807 1,048 2,073 4,003 864 70 786 1,720 4,284 94 4,378 - 4,378
9191 Jackson County Conservation District 74,815 164 1,760 2,287 18,226 22,437 1,884 152 - 2,036 9,346 5,590 14,936 - 14,936
9192 Johnson County Extension Council 121,697 266 2,863 3,720 7,769 14,618 3,065 247 7,885 11,197 15,202 (11,080) 4,122 - 4,122
9193 Yates Center Public Library 23,755 52 559 726 1,173 2,510 598 48 - 646 2,968 480 3,448 - 3,448
9194 Overbrook Public Library 31,986 70 753 978 4,954 6,755 806 65 693 1,564 3,996 1,696 5,692 - 5,692
9195 Franklin County RWD 6 131,619 288 3,096 4,023 12,169 19,576 3,315 267 7,465 11,047 16,442 1,736 18,178 - 18,178
9196 Public Wholesale Water Supply 11 174,839 383 4,114 5,344 24,262 34,103 4,403 354 5,343 10,100 21,841 5,910 27,751 - 27,751
9197 Public Wholesale Water Supply 12 125,260 274 2,947 3,828 26,229 33,278 3,155 254 31,242 34,651 15,648 1,797 17,445 - 17,445
9198 Pawnee Mental Health Services Inc 5,438,783 11,905 127,957 166,229 161,778 467,869 136,971 11,023 264,804 412,798 679,413 (168,248) 511,165 - 511,165
9199 Topeka Association for Retarded Citizens 2,458,355 5,381 57,837 75,136 24,814 163,168 61,912 4,983 101,905 168,800 307,098 (111,496) 195,602 - 195,602
9200 North Central Regional Planning Commission 666,854 1,460 15,689 20,381 48,822 86,352 16,794 1,352 - 18,146 83,303 14,094 97,397 - 97,397
9201 Coffeyville Regional Medical Center Inc 14,183,022 31,046 333,683 433,485 1,308,124 2,106,338 357,188 28,746 426,836 812,770 1,771,745 397,964 2,169,709 - 2,169,709
9202 Kansas Public Telecommunications 770,637 1,687 18,131 23,553 86,768 130,139 19,408 1,562 42,065 63,035 96,268 (11,329) 84,939 - 84,939
9204 Elk County Council on Aging 49,299 108 1,160 1,507 5,598 8,373 1,242 100 26,739 28,081 6,158 (5,364) 794 - 794
9205 City of La Harpe 74,648 163 1,756 2,282 14,045 18,246 1,880 151 24,484 26,515 9,325 (405) 8,920 - 8,920
9206 City of Offerle 27,165 59 640 830 1,920 3,449 684 55 3,973 4,712 3,393 (1,156) 2,237 - 2,237
(continued)
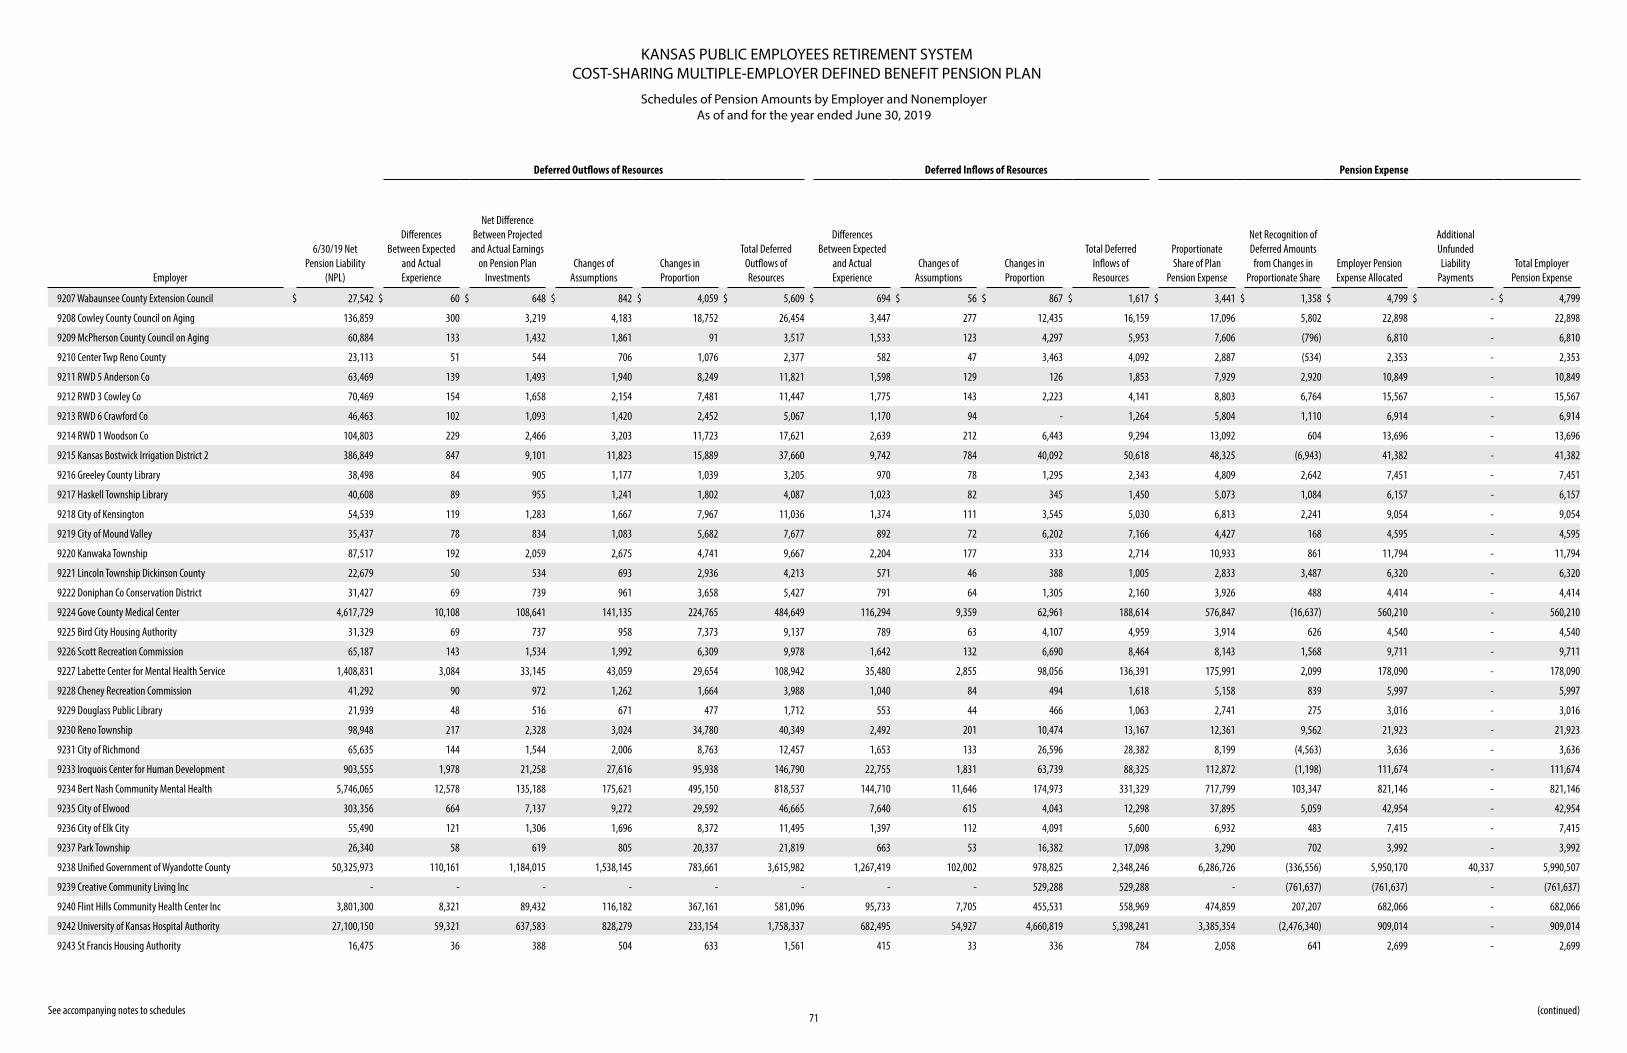
KANSAS PUBLIC EMPLOYEES RETIREMENT SYSTEMCOST-SHARING MULTIPLE-EMPLOYER DEFINED BENEFIT PENSION PLAN
Schedules of Pension Amounts by Employer and NonemployerAs of and for the year ended June 30, 2019
71 See accompanying notes to schedules
Deferred Outflows of Resources Deferred Inflows of Resources Pension Expense
Employer
6/30/19 Net Pension Liability
(NPL)
Differences Between Expected
and Actual Experience
Net Difference Between Projected and Actual Earnings
on Pension Plan Investments
Changes of Assumptions
Changes in Proportion
Total Deferred Outflows of Resources
Differences Between Expected
and Actual Experience
Changes of Assumptions
Changes in Proportion
Total Deferred Inflows of Resources
Proportionate Share of Plan
Pension Expense
Net Recognition of Deferred Amounts from Changes in
Proportionate ShareEmployer Pension Expense Allocated
Additional Unfunded Liability
PaymentsTotal Employer
Pension Expense
9207 Wabaunsee County Extension Council $ 27,542 $ 60 $ 648 $ 842 $ 4,059 $ 5,609 $ 694 $ 56 $ 867 $ 1,617 $ 3,441 $ 1,358 $ 4,799 $ - $ 4,799
9208 Cowley County Council on Aging 136,859 300 3,219 4,183 18,752 26,454 3,447 277 12,435 16,159 17,096 5,802 22,898 - 22,898
9209 McPherson County Council on Aging 60,884 133 1,432 1,861 91 3,517 1,533 123 4,297 5,953 7,606 (796) 6,810 - 6,810
9210 Center Twp Reno County 23,113 51 544 706 1,076 2,377 582 47 3,463 4,092 2,887 (534) 2,353 - 2,353
9211 RWD 5 Anderson Co 63,469 139 1,493 1,940 8,249 11,821 1,598 129 126 1,853 7,929 2,920 10,849 - 10,849
9212 RWD 3 Cowley Co 70,469 154 1,658 2,154 7,481 11,447 1,775 143 2,223 4,141 8,803 6,764 15,567 - 15,567
9213 RWD 6 Crawford Co 46,463 102 1,093 1,420 2,452 5,067 1,170 94 - 1,264 5,804 1,110 6,914 - 6,914
9214 RWD 1 Woodson Co 104,803 229 2,466 3,203 11,723 17,621 2,639 212 6,443 9,294 13,092 604 13,696 - 13,696
9215 Kansas Bostwick Irrigation District 2 386,849 847 9,101 11,823 15,889 37,660 9,742 784 40,092 50,618 48,325 (6,943) 41,382 - 41,382
9216 Greeley County Library 38,498 84 905 1,177 1,039 3,205 970 78 1,295 2,343 4,809 2,642 7,451 - 7,451
9217 Haskell Township Library 40,608 89 955 1,241 1,802 4,087 1,023 82 345 1,450 5,073 1,084 6,157 - 6,157
9218 City of Kensington 54,539 119 1,283 1,667 7,967 11,036 1,374 111 3,545 5,030 6,813 2,241 9,054 - 9,054
9219 City of Mound Valley 35,437 78 834 1,083 5,682 7,677 892 72 6,202 7,166 4,427 168 4,595 - 4,595
9220 Kanwaka Township 87,517 192 2,059 2,675 4,741 9,667 2,204 177 333 2,714 10,933 861 11,794 - 11,794
9221 Lincoln Township Dickinson County 22,679 50 534 693 2,936 4,213 571 46 388 1,005 2,833 3,487 6,320 - 6,320
9222 Doniphan Co Conservation District 31,427 69 739 961 3,658 5,427 791 64 1,305 2,160 3,926 488 4,414 - 4,414
9224 Gove County Medical Center 4,617,729 10,108 108,641 141,135 224,765 484,649 116,294 9,359 62,961 188,614 576,847 (16,637) 560,210 - 560,210
9225 Bird City Housing Authority 31,329 69 737 958 7,373 9,137 789 63 4,107 4,959 3,914 626 4,540 - 4,540
9226 Scott Recreation Commission 65,187 143 1,534 1,992 6,309 9,978 1,642 132 6,690 8,464 8,143 1,568 9,711 - 9,711
9227 Labette Center for Mental Health Service 1,408,831 3,084 33,145 43,059 29,654 108,942 35,480 2,855 98,056 136,391 175,991 2,099 178,090 - 178,090
9228 Cheney Recreation Commission 41,292 90 972 1,262 1,664 3,988 1,040 84 494 1,618 5,158 839 5,997 - 5,997
9229 Douglass Public Library 21,939 48 516 671 477 1,712 553 44 466 1,063 2,741 275 3,016 - 3,016
9230 Reno Township 98,948 217 2,328 3,024 34,780 40,349 2,492 201 10,474 13,167 12,361 9,562 21,923 - 21,923
9231 City of Richmond 65,635 144 1,544 2,006 8,763 12,457 1,653 133 26,596 28,382 8,199 (4,563) 3,636 - 3,636
9233 Iroquois Center for Human Development 903,555 1,978 21,258 27,616 95,938 146,790 22,755 1,831 63,739 88,325 112,872 (1,198) 111,674 - 111,674
9234 Bert Nash Community Mental Health 5,746,065 12,578 135,188 175,621 495,150 818,537 144,710 11,646 174,973 331,329 717,799 103,347 821,146 - 821,146
9235 City of Elwood 303,356 664 7,137 9,272 29,592 46,665 7,640 615 4,043 12,298 37,895 5,059 42,954 - 42,954
9236 City of Elk City 55,490 121 1,306 1,696 8,372 11,495 1,397 112 4,091 5,600 6,932 483 7,415 - 7,415
9237 Park Township 26,340 58 619 805 20,337 21,819 663 53 16,382 17,098 3,290 702 3,992 - 3,992
9238 Unified Government of Wyandotte County 50,325,973 110,161 1,184,015 1,538,145 783,661 3,615,982 1,267,419 102,002 978,825 2,348,246 6,286,726 (336,556) 5,950,170 40,337 5,990,507
9239 Creative Community Living Inc - - - - - - - - 529,288 529,288 - (761,637) (761,637) - (761,637)
9240 Flint Hills Community Health Center Inc 3,801,300 8,321 89,432 116,182 367,161 581,096 95,733 7,705 455,531 558,969 474,859 207,207 682,066 - 682,066
9242 University of Kansas Hospital Authority 27,100,150 59,321 637,583 828,279 233,154 1,758,337 682,495 54,927 4,660,819 5,398,241 3,385,354 (2,476,340) 909,014 - 909,014
9243 St Francis Housing Authority 16,475 36 388 504 633 1,561 415 33 336 784 2,058 641 2,699 - 2,699
(continued)
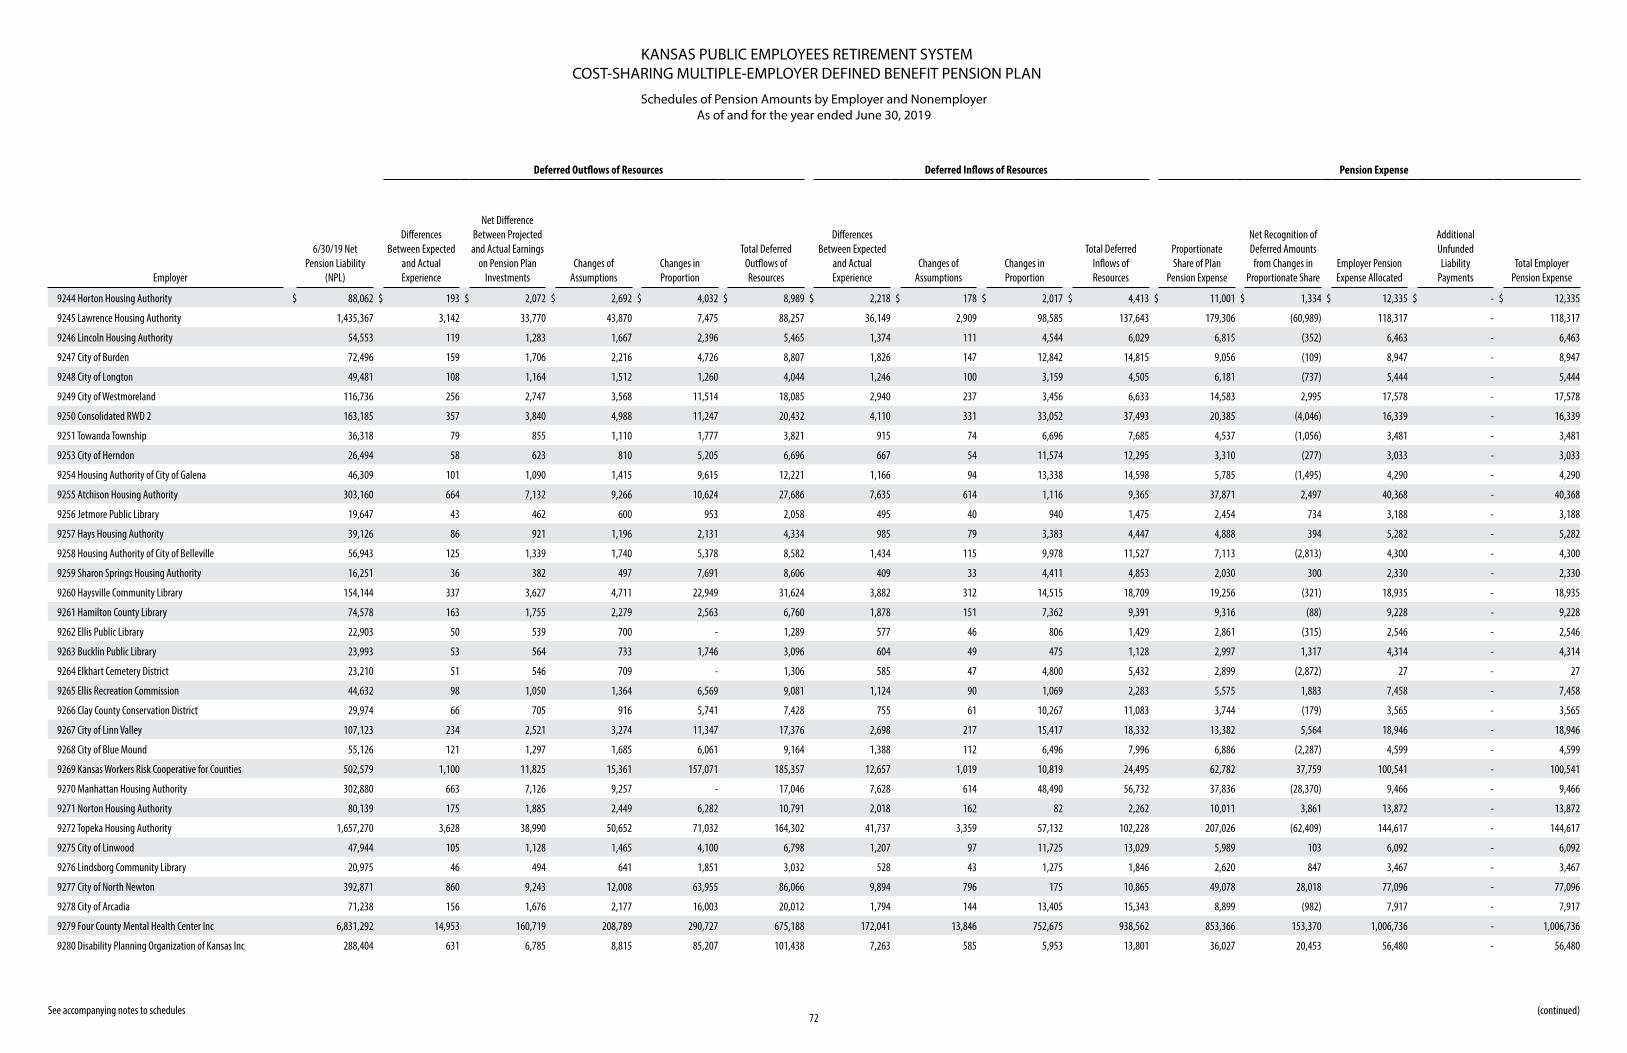
KANSAS PUBLIC EMPLOYEES RETIREMENT SYSTEMCOST-SHARING MULTIPLE-EMPLOYER DEFINED BENEFIT PENSION PLAN
Schedules of Pension Amounts by Employer and NonemployerAs of and for the year ended June 30, 2019
72 See accompanying notes to schedules
Deferred Outflows of Resources Deferred Inflows of Resources Pension Expense
Employer
6/30/19 Net Pension Liability
(NPL)
Differences Between Expected
and Actual Experience
Net Difference Between Projected and Actual Earnings
on Pension Plan Investments
Changes of Assumptions
Changes in Proportion
Total Deferred Outflows of Resources
Differences Between Expected
and Actual Experience
Changes of Assumptions
Changes in Proportion
Total Deferred Inflows of Resources
Proportionate Share of Plan
Pension Expense
Net Recognition of Deferred Amounts from Changes in
Proportionate ShareEmployer Pension Expense Allocated
Additional Unfunded Liability
PaymentsTotal Employer
Pension Expense
9244 Horton Housing Authority $ 88,062 $ 193 $ 2,072 $ 2,692 $ 4,032 $ 8,989 $ 2,218 $ 178 $ 2,017 $ 4,413 $ 11,001 $ 1,334 $ 12,335 $ - $ 12,335
9245 Lawrence Housing Authority 1,435,367 3,142 33,770 43,870 7,475 88,257 36,149 2,909 98,585 137,643 179,306 (60,989) 118,317 - 118,317
9246 Lincoln Housing Authority 54,553 119 1,283 1,667 2,396 5,465 1,374 111 4,544 6,029 6,815 (352) 6,463 - 6,463
9247 City of Burden 72,496 159 1,706 2,216 4,726 8,807 1,826 147 12,842 14,815 9,056 (109) 8,947 - 8,947
9248 City of Longton 49,481 108 1,164 1,512 1,260 4,044 1,246 100 3,159 4,505 6,181 (737) 5,444 - 5,444
9249 City of Westmoreland 116,736 256 2,747 3,568 11,514 18,085 2,940 237 3,456 6,633 14,583 2,995 17,578 - 17,578
9250 Consolidated RWD 2 163,185 357 3,840 4,988 11,247 20,432 4,110 331 33,052 37,493 20,385 (4,046) 16,339 - 16,339
9251 Towanda Township 36,318 79 855 1,110 1,777 3,821 915 74 6,696 7,685 4,537 (1,056) 3,481 - 3,481
9253 City of Herndon 26,494 58 623 810 5,205 6,696 667 54 11,574 12,295 3,310 (277) 3,033 - 3,033
9254 Housing Authority of City of Galena 46,309 101 1,090 1,415 9,615 12,221 1,166 94 13,338 14,598 5,785 (1,495) 4,290 - 4,290
9255 Atchison Housing Authority 303,160 664 7,132 9,266 10,624 27,686 7,635 614 1,116 9,365 37,871 2,497 40,368 - 40,368
9256 Jetmore Public Library 19,647 43 462 600 953 2,058 495 40 940 1,475 2,454 734 3,188 - 3,188
9257 Hays Housing Authority 39,126 86 921 1,196 2,131 4,334 985 79 3,383 4,447 4,888 394 5,282 - 5,282
9258 Housing Authority of City of Belleville 56,943 125 1,339 1,740 5,378 8,582 1,434 115 9,978 11,527 7,113 (2,813) 4,300 - 4,300
9259 Sharon Springs Housing Authority 16,251 36 382 497 7,691 8,606 409 33 4,411 4,853 2,030 300 2,330 - 2,330
9260 Haysville Community Library 154,144 337 3,627 4,711 22,949 31,624 3,882 312 14,515 18,709 19,256 (321) 18,935 - 18,935
9261 Hamilton County Library 74,578 163 1,755 2,279 2,563 6,760 1,878 151 7,362 9,391 9,316 (88) 9,228 - 9,228
9262 Ellis Public Library 22,903 50 539 700 - 1,289 577 46 806 1,429 2,861 (315) 2,546 - 2,546
9263 Bucklin Public Library 23,993 53 564 733 1,746 3,096 604 49 475 1,128 2,997 1,317 4,314 - 4,314
9264 Elkhart Cemetery District 23,210 51 546 709 - 1,306 585 47 4,800 5,432 2,899 (2,872) 27 - 27
9265 Ellis Recreation Commission 44,632 98 1,050 1,364 6,569 9,081 1,124 90 1,069 2,283 5,575 1,883 7,458 - 7,458
9266 Clay County Conservation District 29,974 66 705 916 5,741 7,428 755 61 10,267 11,083 3,744 (179) 3,565 - 3,565
9267 City of Linn Valley 107,123 234 2,521 3,274 11,347 17,376 2,698 217 15,417 18,332 13,382 5,564 18,946 - 18,946
9268 City of Blue Mound 55,126 121 1,297 1,685 6,061 9,164 1,388 112 6,496 7,996 6,886 (2,287) 4,599 - 4,599
9269 Kansas Workers Risk Cooperative for Counties 502,579 1,100 11,825 15,361 157,071 185,357 12,657 1,019 10,819 24,495 62,782 37,759 100,541 - 100,541
9270 Manhattan Housing Authority 302,880 663 7,126 9,257 - 17,046 7,628 614 48,490 56,732 37,836 (28,370) 9,466 - 9,466
9271 Norton Housing Authority 80,139 175 1,885 2,449 6,282 10,791 2,018 162 82 2,262 10,011 3,861 13,872 - 13,872
9272 Topeka Housing Authority 1,657,270 3,628 38,990 50,652 71,032 164,302 41,737 3,359 57,132 102,228 207,026 (62,409) 144,617 - 144,617
9275 City of Linwood 47,944 105 1,128 1,465 4,100 6,798 1,207 97 11,725 13,029 5,989 103 6,092 - 6,092
9276 Lindsborg Community Library 20,975 46 494 641 1,851 3,032 528 43 1,275 1,846 2,620 847 3,467 - 3,467
9277 City of North Newton 392,871 860 9,243 12,008 63,955 86,066 9,894 796 175 10,865 49,078 28,018 77,096 - 77,096
9278 City of Arcadia 71,238 156 1,676 2,177 16,003 20,012 1,794 144 13,405 15,343 8,899 (982) 7,917 - 7,917
9279 Four County Mental Health Center Inc 6,831,292 14,953 160,719 208,789 290,727 675,188 172,041 13,846 752,675 938,562 853,366 153,370 1,006,736 - 1,006,736
9280 Disability Planning Organization of Kansas Inc 288,404 631 6,785 8,815 85,207 101,438 7,263 585 5,953 13,801 36,027 20,453 56,480 - 56,480
(continued)
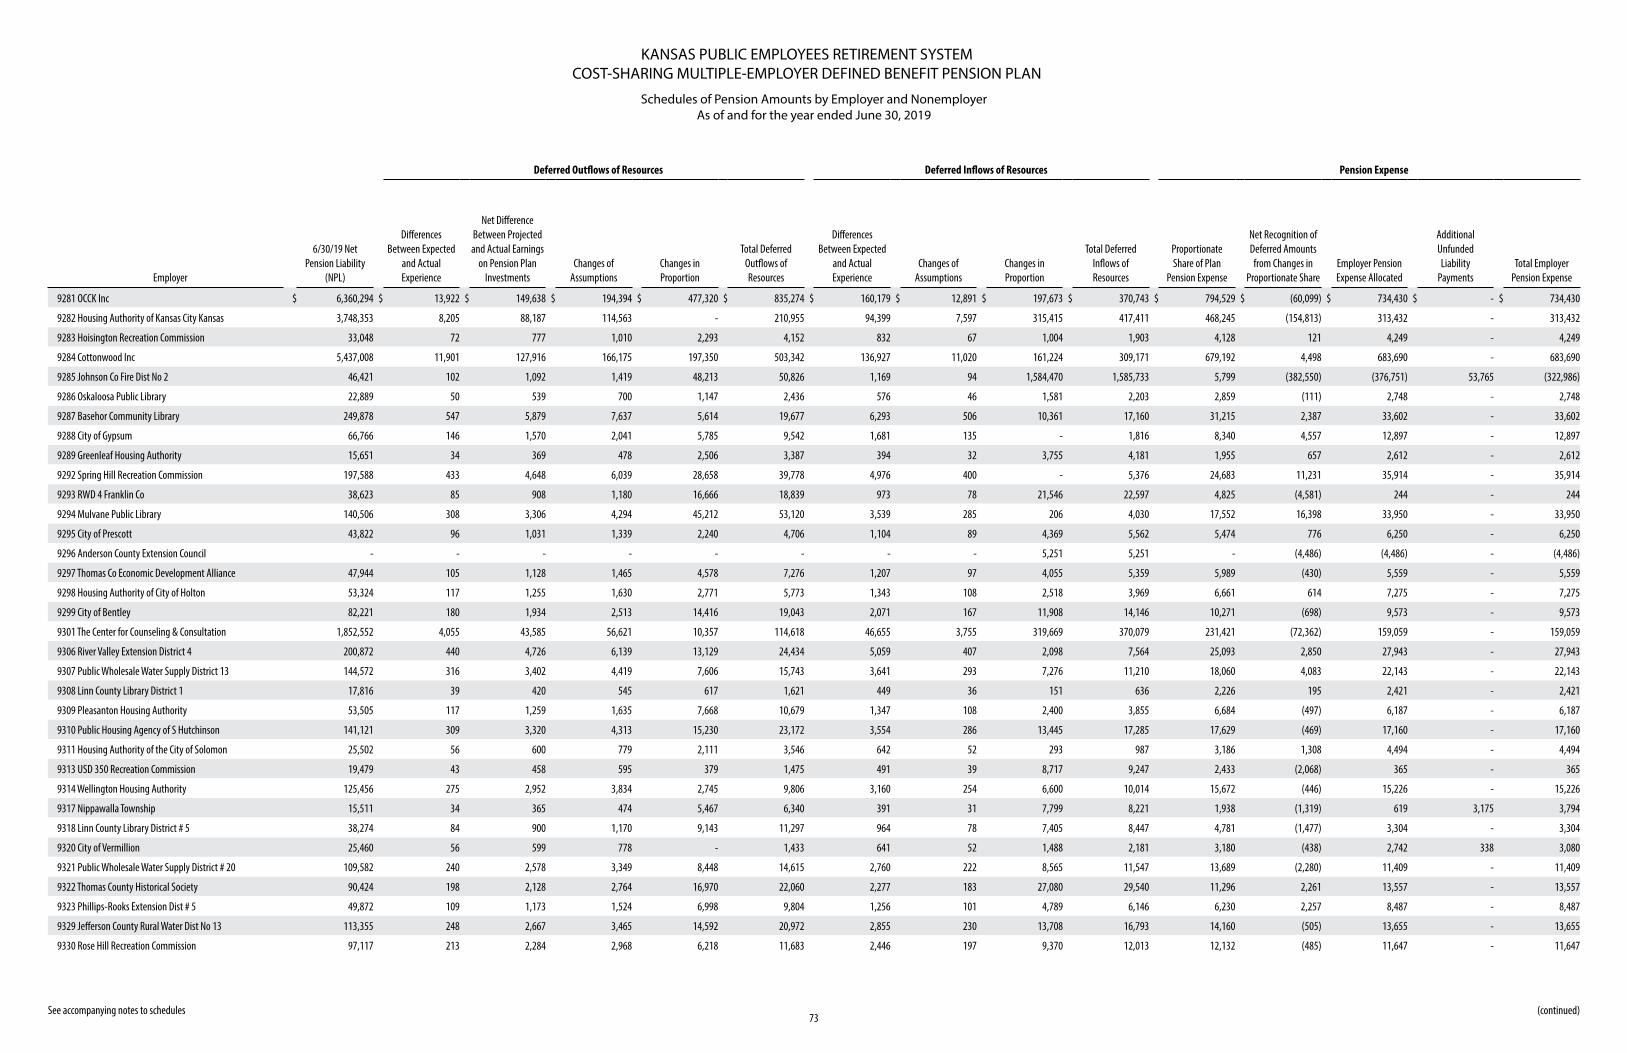
KANSAS PUBLIC EMPLOYEES RETIREMENT SYSTEMCOST-SHARING MULTIPLE-EMPLOYER DEFINED BENEFIT PENSION PLAN
Schedules of Pension Amounts by Employer and NonemployerAs of and for the year ended June 30, 2019
73 See accompanying notes to schedules
Deferred Outflows of Resources Deferred Inflows of Resources Pension Expense
Employer
6/30/19 Net Pension Liability
(NPL)
Differences Between Expected
and Actual Experience
Net Difference Between Projected and Actual Earnings
on Pension Plan Investments
Changes of Assumptions
Changes in Proportion
Total Deferred Outflows of Resources
Differences Between Expected
and Actual Experience
Changes of Assumptions
Changes in Proportion
Total Deferred Inflows of Resources
Proportionate Share of Plan
Pension Expense
Net Recognition of Deferred Amounts from Changes in
Proportionate ShareEmployer Pension Expense Allocated
Additional Unfunded Liability
PaymentsTotal Employer
Pension Expense
9281 OCCK Inc $ 6,360,294 $ 13,922 $ 149,638 $ 194,394 $ 477,320 $ 835,274 $ 160,179 $ 12,891 $ 197,673 $ 370,743 $ 794,529 $ (60,099) $ 734,430 $ - $ 734,430
9282 Housing Authority of Kansas City Kansas 3,748,353 8,205 88,187 114,563 - 210,955 94,399 7,597 315,415 417,411 468,245 (154,813) 313,432 - 313,432
9283 Hoisington Recreation Commission 33,048 72 777 1,010 2,293 4,152 832 67 1,004 1,903 4,128 121 4,249 - 4,249
9284 Cottonwood Inc 5,437,008 11,901 127,916 166,175 197,350 503,342 136,927 11,020 161,224 309,171 679,192 4,498 683,690 - 683,690
9285 Johnson Co Fire Dist No 2 46,421 102 1,092 1,419 48,213 50,826 1,169 94 1,584,470 1,585,733 5,799 (382,550) (376,751) 53,765 (322,986)
9286 Oskaloosa Public Library 22,889 50 539 700 1,147 2,436 576 46 1,581 2,203 2,859 (111) 2,748 - 2,748
9287 Basehor Community Library 249,878 547 5,879 7,637 5,614 19,677 6,293 506 10,361 17,160 31,215 2,387 33,602 - 33,602
9288 City of Gypsum 66,766 146 1,570 2,041 5,785 9,542 1,681 135 - 1,816 8,340 4,557 12,897 - 12,897
9289 Greenleaf Housing Authority 15,651 34 369 478 2,506 3,387 394 32 3,755 4,181 1,955 657 2,612 - 2,612
9292 Spring Hill Recreation Commission 197,588 433 4,648 6,039 28,658 39,778 4,976 400 - 5,376 24,683 11,231 35,914 - 35,914
9293 RWD 4 Franklin Co 38,623 85 908 1,180 16,666 18,839 973 78 21,546 22,597 4,825 (4,581) 244 - 244
9294 Mulvane Public Library 140,506 308 3,306 4,294 45,212 53,120 3,539 285 206 4,030 17,552 16,398 33,950 - 33,950
9295 City of Prescott 43,822 96 1,031 1,339 2,240 4,706 1,104 89 4,369 5,562 5,474 776 6,250 - 6,250
9296 Anderson County Extension Council - - - - - - - - 5,251 5,251 - (4,486) (4,486) - (4,486)
9297 Thomas Co Economic Development Alliance 47,944 105 1,128 1,465 4,578 7,276 1,207 97 4,055 5,359 5,989 (430) 5,559 - 5,559
9298 Housing Authority of City of Holton 53,324 117 1,255 1,630 2,771 5,773 1,343 108 2,518 3,969 6,661 614 7,275 - 7,275
9299 City of Bentley 82,221 180 1,934 2,513 14,416 19,043 2,071 167 11,908 14,146 10,271 (698) 9,573 - 9,573
9301 The Center for Counseling & Consultation 1,852,552 4,055 43,585 56,621 10,357 114,618 46,655 3,755 319,669 370,079 231,421 (72,362) 159,059 - 159,059
9306 River Valley Extension District 4 200,872 440 4,726 6,139 13,129 24,434 5,059 407 2,098 7,564 25,093 2,850 27,943 - 27,943
9307 Public Wholesale Water Supply District 13 144,572 316 3,402 4,419 7,606 15,743 3,641 293 7,276 11,210 18,060 4,083 22,143 - 22,143
9308 Linn County Library District 1 17,816 39 420 545 617 1,621 449 36 151 636 2,226 195 2,421 - 2,421
9309 Pleasanton Housing Authority 53,505 117 1,259 1,635 7,668 10,679 1,347 108 2,400 3,855 6,684 (497) 6,187 - 6,187
9310 Public Housing Agency of S Hutchinson 141,121 309 3,320 4,313 15,230 23,172 3,554 286 13,445 17,285 17,629 (469) 17,160 - 17,160
9311 Housing Authority of the City of Solomon 25,502 56 600 779 2,111 3,546 642 52 293 987 3,186 1,308 4,494 - 4,494
9313 USD 350 Recreation Commission 19,479 43 458 595 379 1,475 491 39 8,717 9,247 2,433 (2,068) 365 - 365
9314 Wellington Housing Authority 125,456 275 2,952 3,834 2,745 9,806 3,160 254 6,600 10,014 15,672 (446) 15,226 - 15,226
9317 Nippawalla Township 15,511 34 365 474 5,467 6,340 391 31 7,799 8,221 1,938 (1,319) 619 3,175 3,794
9318 Linn County Library District # 5 38,274 84 900 1,170 9,143 11,297 964 78 7,405 8,447 4,781 (1,477) 3,304 - 3,304
9320 City of Vermillion 25,460 56 599 778 - 1,433 641 52 1,488 2,181 3,180 (438) 2,742 338 3,080
9321 Public Wholesale Water Supply District # 20 109,582 240 2,578 3,349 8,448 14,615 2,760 222 8,565 11,547 13,689 (2,280) 11,409 - 11,409
9322 Thomas County Historical Society 90,424 198 2,128 2,764 16,970 22,060 2,277 183 27,080 29,540 11,296 2,261 13,557 - 13,557
9323 Phillips-Rooks Extension Dist # 5 49,872 109 1,173 1,524 6,998 9,804 1,256 101 4,789 6,146 6,230 2,257 8,487 - 8,487
9329 Jefferson County Rural Water Dist No 13 113,355 248 2,667 3,465 14,592 20,972 2,855 230 13,708 16,793 14,160 (505) 13,655 - 13,655
9330 Rose Hill Recreation Commission 97,117 213 2,284 2,968 6,218 11,683 2,446 197 9,370 12,013 12,132 (485) 11,647 - 11,647
(continued)
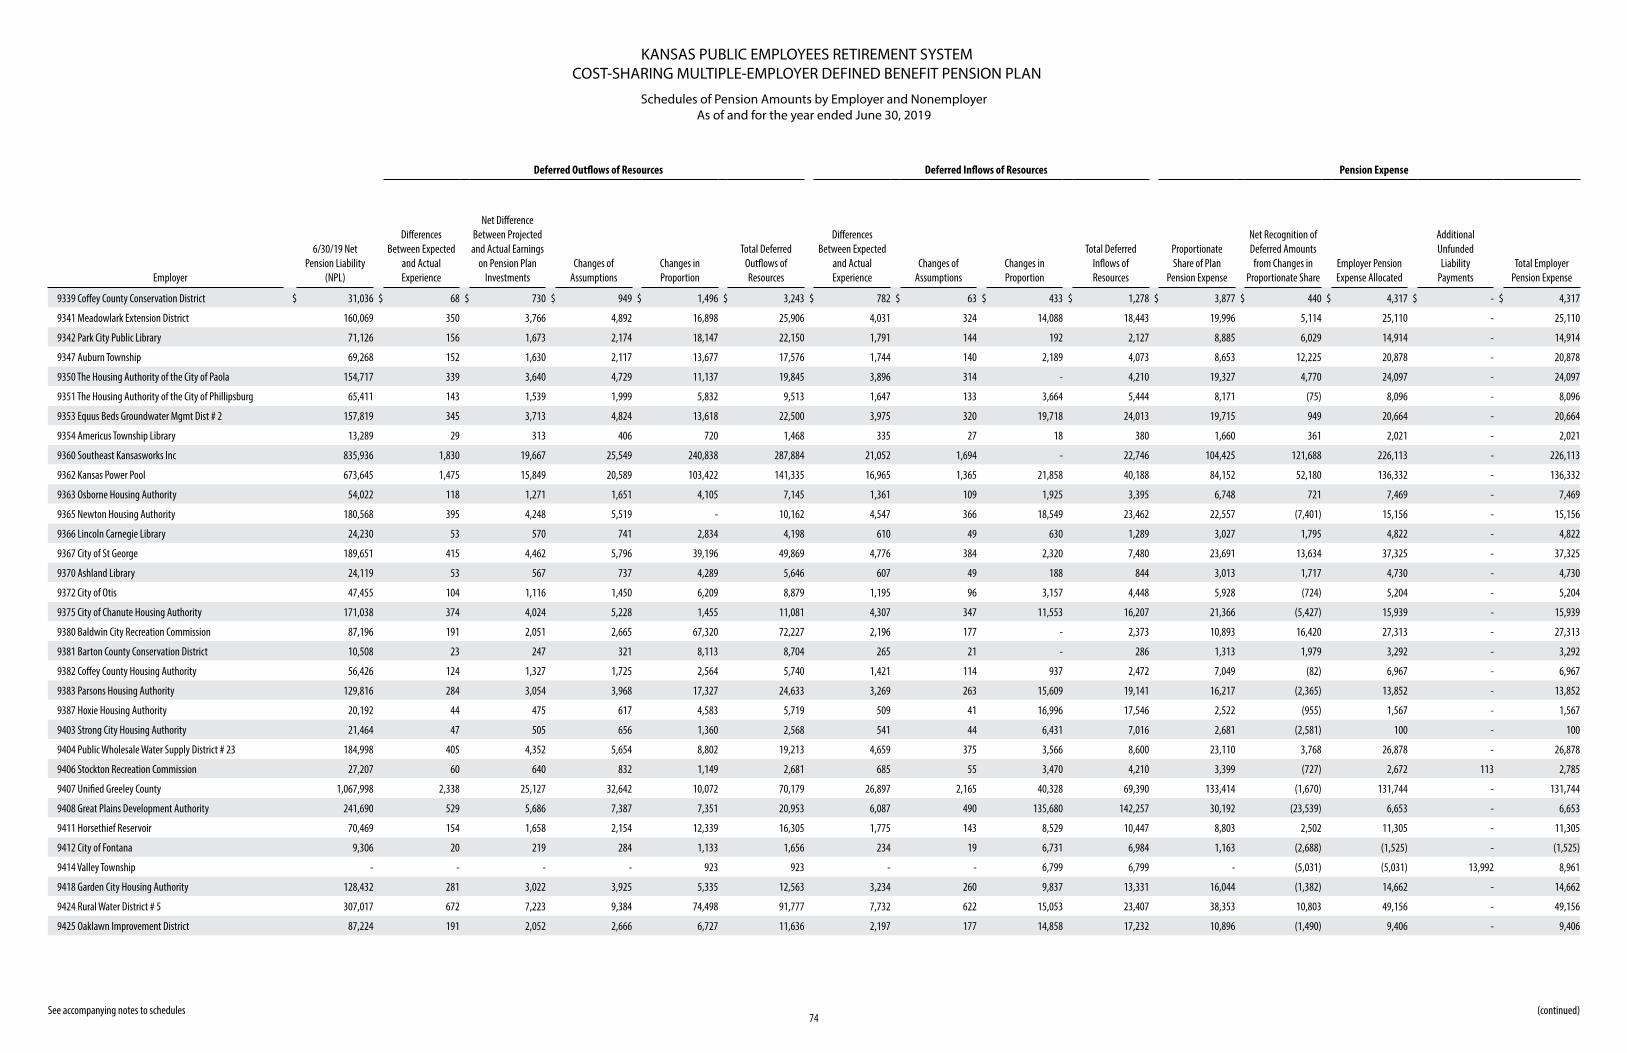
KANSAS PUBLIC EMPLOYEES RETIREMENT SYSTEMCOST-SHARING MULTIPLE-EMPLOYER DEFINED BENEFIT PENSION PLAN
Schedules of Pension Amounts by Employer and NonemployerAs of and for the year ended June 30, 2019
74 See accompanying notes to schedules
Deferred Outflows of Resources Deferred Inflows of Resources Pension Expense
Employer
6/30/19 Net Pension Liability
(NPL)
Differences Between Expected
and Actual Experience
Net Difference Between Projected and Actual Earnings
on Pension Plan Investments
Changes of Assumptions
Changes in Proportion
Total Deferred Outflows of Resources
Differences Between Expected
and Actual Experience
Changes of Assumptions
Changes in Proportion
Total Deferred Inflows of Resources
Proportionate Share of Plan
Pension Expense
Net Recognition of Deferred Amounts from Changes in
Proportionate ShareEmployer Pension Expense Allocated
Additional Unfunded Liability
PaymentsTotal Employer
Pension Expense
9339 Coffey County Conservation District $ 31,036 $ 68 $ 730 $ 949 $ 1,496 $ 3,243 $ 782 $ 63 $ 433 $ 1,278 $ 3,877 $ 440 $ 4,317 $ - $ 4,317
9341 Meadowlark Extension District 160,069 350 3,766 4,892 16,898 25,906 4,031 324 14,088 18,443 19,996 5,114 25,110 - 25,110
9342 Park City Public Library 71,126 156 1,673 2,174 18,147 22,150 1,791 144 192 2,127 8,885 6,029 14,914 - 14,914
9347 Auburn Township 69,268 152 1,630 2,117 13,677 17,576 1,744 140 2,189 4,073 8,653 12,225 20,878 - 20,878
9350 The Housing Authority of the City of Paola 154,717 339 3,640 4,729 11,137 19,845 3,896 314 - 4,210 19,327 4,770 24,097 - 24,097
9351 The Housing Authority of the City of Phillipsburg 65,411 143 1,539 1,999 5,832 9,513 1,647 133 3,664 5,444 8,171 (75) 8,096 - 8,096
9353 Equus Beds Groundwater Mgmt Dist # 2 157,819 345 3,713 4,824 13,618 22,500 3,975 320 19,718 24,013 19,715 949 20,664 - 20,664
9354 Americus Township Library 13,289 29 313 406 720 1,468 335 27 18 380 1,660 361 2,021 - 2,021
9360 Southeast Kansasworks Inc 835,936 1,830 19,667 25,549 240,838 287,884 21,052 1,694 - 22,746 104,425 121,688 226,113 - 226,113
9362 Kansas Power Pool 673,645 1,475 15,849 20,589 103,422 141,335 16,965 1,365 21,858 40,188 84,152 52,180 136,332 - 136,332
9363 Osborne Housing Authority 54,022 118 1,271 1,651 4,105 7,145 1,361 109 1,925 3,395 6,748 721 7,469 - 7,469
9365 Newton Housing Authority 180,568 395 4,248 5,519 - 10,162 4,547 366 18,549 23,462 22,557 (7,401) 15,156 - 15,156
9366 Lincoln Carnegie Library 24,230 53 570 741 2,834 4,198 610 49 630 1,289 3,027 1,795 4,822 - 4,822
9367 City of St George 189,651 415 4,462 5,796 39,196 49,869 4,776 384 2,320 7,480 23,691 13,634 37,325 - 37,325
9370 Ashland Library 24,119 53 567 737 4,289 5,646 607 49 188 844 3,013 1,717 4,730 - 4,730
9372 City of Otis 47,455 104 1,116 1,450 6,209 8,879 1,195 96 3,157 4,448 5,928 (724) 5,204 - 5,204
9375 City of Chanute Housing Authority 171,038 374 4,024 5,228 1,455 11,081 4,307 347 11,553 16,207 21,366 (5,427) 15,939 - 15,939
9380 Baldwin City Recreation Commission 87,196 191 2,051 2,665 67,320 72,227 2,196 177 - 2,373 10,893 16,420 27,313 - 27,313
9381 Barton County Conservation District 10,508 23 247 321 8,113 8,704 265 21 - 286 1,313 1,979 3,292 - 3,292
9382 Coffey County Housing Authority 56,426 124 1,327 1,725 2,564 5,740 1,421 114 937 2,472 7,049 (82) 6,967 - 6,967
9383 Parsons Housing Authority 129,816 284 3,054 3,968 17,327 24,633 3,269 263 15,609 19,141 16,217 (2,365) 13,852 - 13,852
9387 Hoxie Housing Authority 20,192 44 475 617 4,583 5,719 509 41 16,996 17,546 2,522 (955) 1,567 - 1,567
9403 Strong City Housing Authority 21,464 47 505 656 1,360 2,568 541 44 6,431 7,016 2,681 (2,581) 100 - 100
9404 Public Wholesale Water Supply District # 23 184,998 405 4,352 5,654 8,802 19,213 4,659 375 3,566 8,600 23,110 3,768 26,878 - 26,878
9406 Stockton Recreation Commission 27,207 60 640 832 1,149 2,681 685 55 3,470 4,210 3,399 (727) 2,672 113 2,785
9407 Unified Greeley County 1,067,998 2,338 25,127 32,642 10,072 70,179 26,897 2,165 40,328 69,390 133,414 (1,670) 131,744 - 131,744
9408 Great Plains Development Authority 241,690 529 5,686 7,387 7,351 20,953 6,087 490 135,680 142,257 30,192 (23,539) 6,653 - 6,653
9411 Horsethief Reservoir 70,469 154 1,658 2,154 12,339 16,305 1,775 143 8,529 10,447 8,803 2,502 11,305 - 11,305
9412 City of Fontana 9,306 20 219 284 1,133 1,656 234 19 6,731 6,984 1,163 (2,688) (1,525) - (1,525)
9414 Valley Township - - - - 923 923 - - 6,799 6,799 - (5,031) (5,031) 13,992 8,961
9418 Garden City Housing Authority 128,432 281 3,022 3,925 5,335 12,563 3,234 260 9,837 13,331 16,044 (1,382) 14,662 - 14,662
9424 Rural Water District # 5 307,017 672 7,223 9,384 74,498 91,777 7,732 622 15,053 23,407 38,353 10,803 49,156 - 49,156
9425 Oaklawn Improvement District 87,224 191 2,052 2,666 6,727 11,636 2,197 177 14,858 17,232 10,896 (1,490) 9,406 - 9,406
(continued)
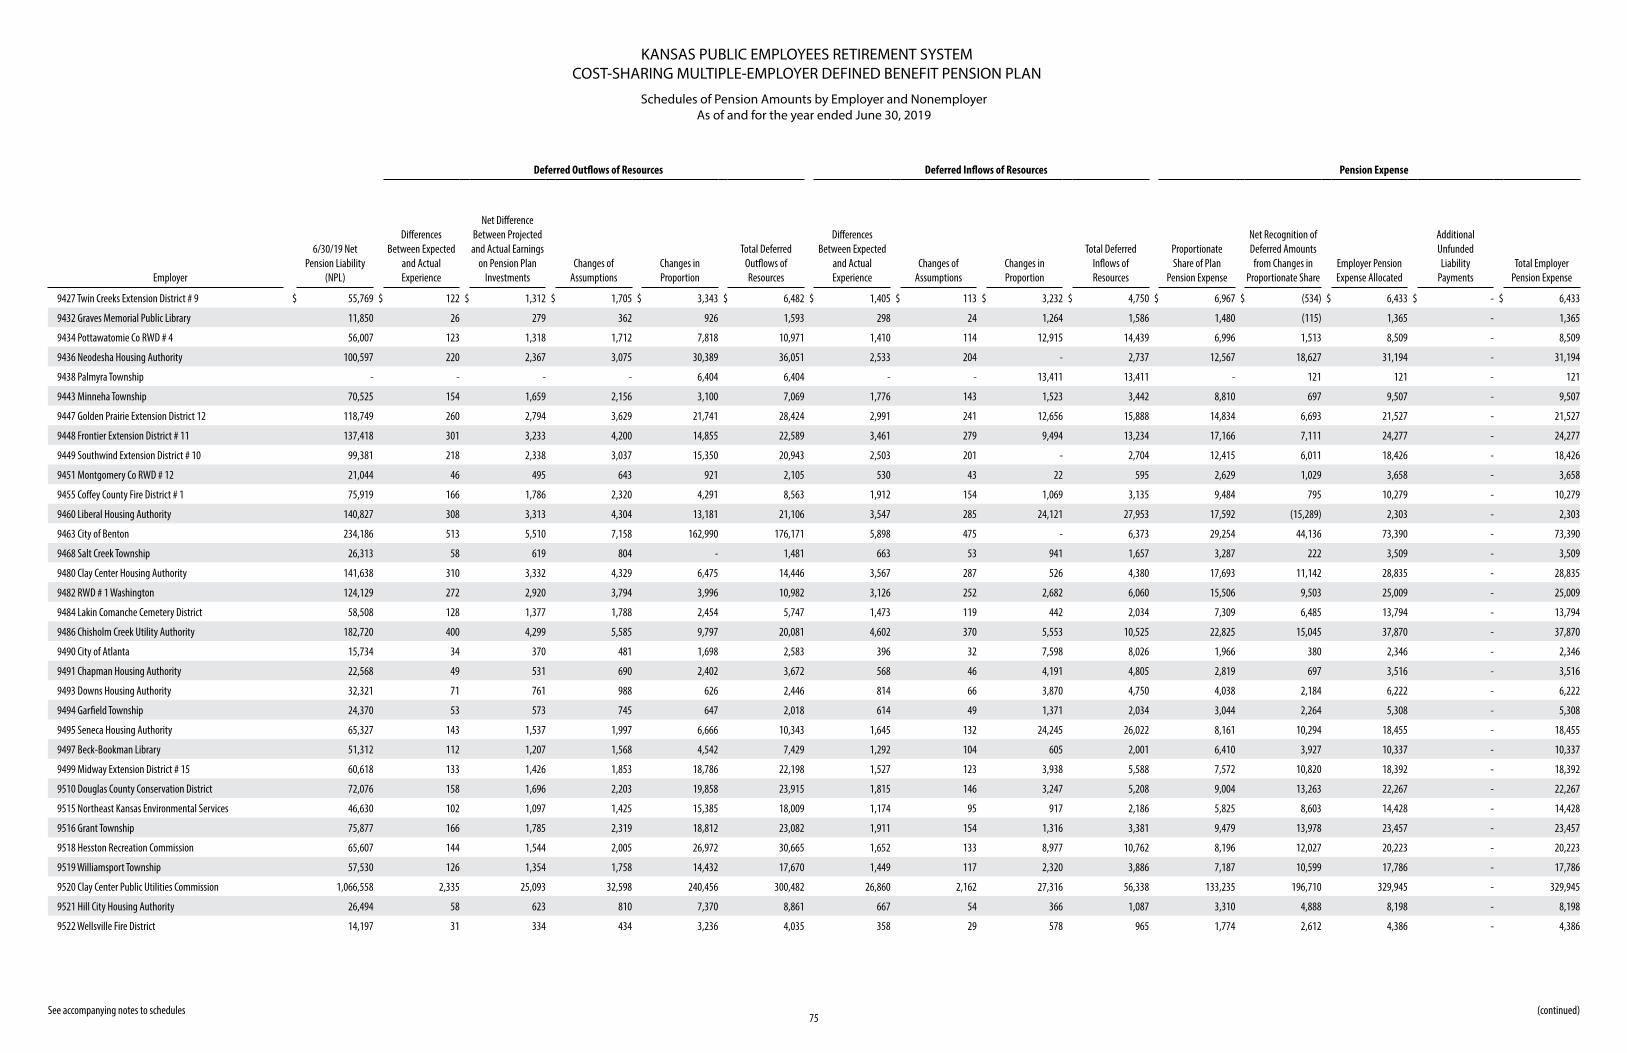
KANSAS PUBLIC EMPLOYEES RETIREMENT SYSTEMCOST-SHARING MULTIPLE-EMPLOYER DEFINED BENEFIT PENSION PLAN
Schedules of Pension Amounts by Employer and NonemployerAs of and for the year ended June 30, 2019
75 See accompanying notes to schedules
Deferred Outflows of Resources Deferred Inflows of Resources Pension Expense
Employer
6/30/19 Net Pension Liability
(NPL)
Differences Between Expected
and Actual Experience
Net Difference Between Projected and Actual Earnings
on Pension Plan Investments
Changes of Assumptions
Changes in Proportion
Total Deferred Outflows of Resources
Differences Between Expected
and Actual Experience
Changes of Assumptions
Changes in Proportion
Total Deferred Inflows of Resources
Proportionate Share of Plan
Pension Expense
Net Recognition of Deferred Amounts from Changes in
Proportionate ShareEmployer Pension Expense Allocated
Additional Unfunded Liability
PaymentsTotal Employer
Pension Expense
9427 Twin Creeks Extension District # 9 $ 55,769 $ 122 $ 1,312 $ 1,705 $ 3,343 $ 6,482 $ 1,405 $ 113 $ 3,232 $ 4,750 $ 6,967 $ (534) $ 6,433 $ - $ 6,433
9432 Graves Memorial Public Library 11,850 26 279 362 926 1,593 298 24 1,264 1,586 1,480 (115) 1,365 - 1,365
9434 Pottawatomie Co RWD # 4 56,007 123 1,318 1,712 7,818 10,971 1,410 114 12,915 14,439 6,996 1,513 8,509 - 8,509
9436 Neodesha Housing Authority 100,597 220 2,367 3,075 30,389 36,051 2,533 204 - 2,737 12,567 18,627 31,194 - 31,194
9438 Palmyra Township - - - - 6,404 6,404 - - 13,411 13,411 - 121 121 - 121
9443 Minneha Township 70,525 154 1,659 2,156 3,100 7,069 1,776 143 1,523 3,442 8,810 697 9,507 - 9,507
9447 Golden Prairie Extension District 12 118,749 260 2,794 3,629 21,741 28,424 2,991 241 12,656 15,888 14,834 6,693 21,527 - 21,527
9448 Frontier Extension District # 11 137,418 301 3,233 4,200 14,855 22,589 3,461 279 9,494 13,234 17,166 7,111 24,277 - 24,277
9449 Southwind Extension District # 10 99,381 218 2,338 3,037 15,350 20,943 2,503 201 - 2,704 12,415 6,011 18,426 - 18,426
9451 Montgomery Co RWD # 12 21,044 46 495 643 921 2,105 530 43 22 595 2,629 1,029 3,658 - 3,658
9455 Coffey County Fire District # 1 75,919 166 1,786 2,320 4,291 8,563 1,912 154 1,069 3,135 9,484 795 10,279 - 10,279
9460 Liberal Housing Authority 140,827 308 3,313 4,304 13,181 21,106 3,547 285 24,121 27,953 17,592 (15,289) 2,303 - 2,303
9463 City of Benton 234,186 513 5,510 7,158 162,990 176,171 5,898 475 - 6,373 29,254 44,136 73,390 - 73,390
9468 Salt Creek Township 26,313 58 619 804 - 1,481 663 53 941 1,657 3,287 222 3,509 - 3,509
9480 Clay Center Housing Authority 141,638 310 3,332 4,329 6,475 14,446 3,567 287 526 4,380 17,693 11,142 28,835 - 28,835
9482 RWD # 1 Washington 124,129 272 2,920 3,794 3,996 10,982 3,126 252 2,682 6,060 15,506 9,503 25,009 - 25,009
9484 Lakin Comanche Cemetery District 58,508 128 1,377 1,788 2,454 5,747 1,473 119 442 2,034 7,309 6,485 13,794 - 13,794
9486 Chisholm Creek Utility Authority 182,720 400 4,299 5,585 9,797 20,081 4,602 370 5,553 10,525 22,825 15,045 37,870 - 37,870
9490 City of Atlanta 15,734 34 370 481 1,698 2,583 396 32 7,598 8,026 1,966 380 2,346 - 2,346
9491 Chapman Housing Authority 22,568 49 531 690 2,402 3,672 568 46 4,191 4,805 2,819 697 3,516 - 3,516
9493 Downs Housing Authority 32,321 71 761 988 626 2,446 814 66 3,870 4,750 4,038 2,184 6,222 - 6,222
9494 Garfield Township 24,370 53 573 745 647 2,018 614 49 1,371 2,034 3,044 2,264 5,308 - 5,308
9495 Seneca Housing Authority 65,327 143 1,537 1,997 6,666 10,343 1,645 132 24,245 26,022 8,161 10,294 18,455 - 18,455
9497 Beck-Bookman Library 51,312 112 1,207 1,568 4,542 7,429 1,292 104 605 2,001 6,410 3,927 10,337 - 10,337
9499 Midway Extension District # 15 60,618 133 1,426 1,853 18,786 22,198 1,527 123 3,938 5,588 7,572 10,820 18,392 - 18,392
9510 Douglas County Conservation District 72,076 158 1,696 2,203 19,858 23,915 1,815 146 3,247 5,208 9,004 13,263 22,267 - 22,267
9515 Northeast Kansas Environmental Services 46,630 102 1,097 1,425 15,385 18,009 1,174 95 917 2,186 5,825 8,603 14,428 - 14,428
9516 Grant Township 75,877 166 1,785 2,319 18,812 23,082 1,911 154 1,316 3,381 9,479 13,978 23,457 - 23,457
9518 Hesston Recreation Commission 65,607 144 1,544 2,005 26,972 30,665 1,652 133 8,977 10,762 8,196 12,027 20,223 - 20,223
9519 Williamsport Township 57,530 126 1,354 1,758 14,432 17,670 1,449 117 2,320 3,886 7,187 10,599 17,786 - 17,786
9520 Clay Center Public Utilities Commission 1,066,558 2,335 25,093 32,598 240,456 300,482 26,860 2,162 27,316 56,338 133,235 196,710 329,945 - 329,945
9521 Hill City Housing Authority 26,494 58 623 810 7,370 8,861 667 54 366 1,087 3,310 4,888 8,198 - 8,198
9522 Wellsville Fire District 14,197 31 334 434 3,236 4,035 358 29 578 965 1,774 2,612 4,386 - 4,386
(continued)
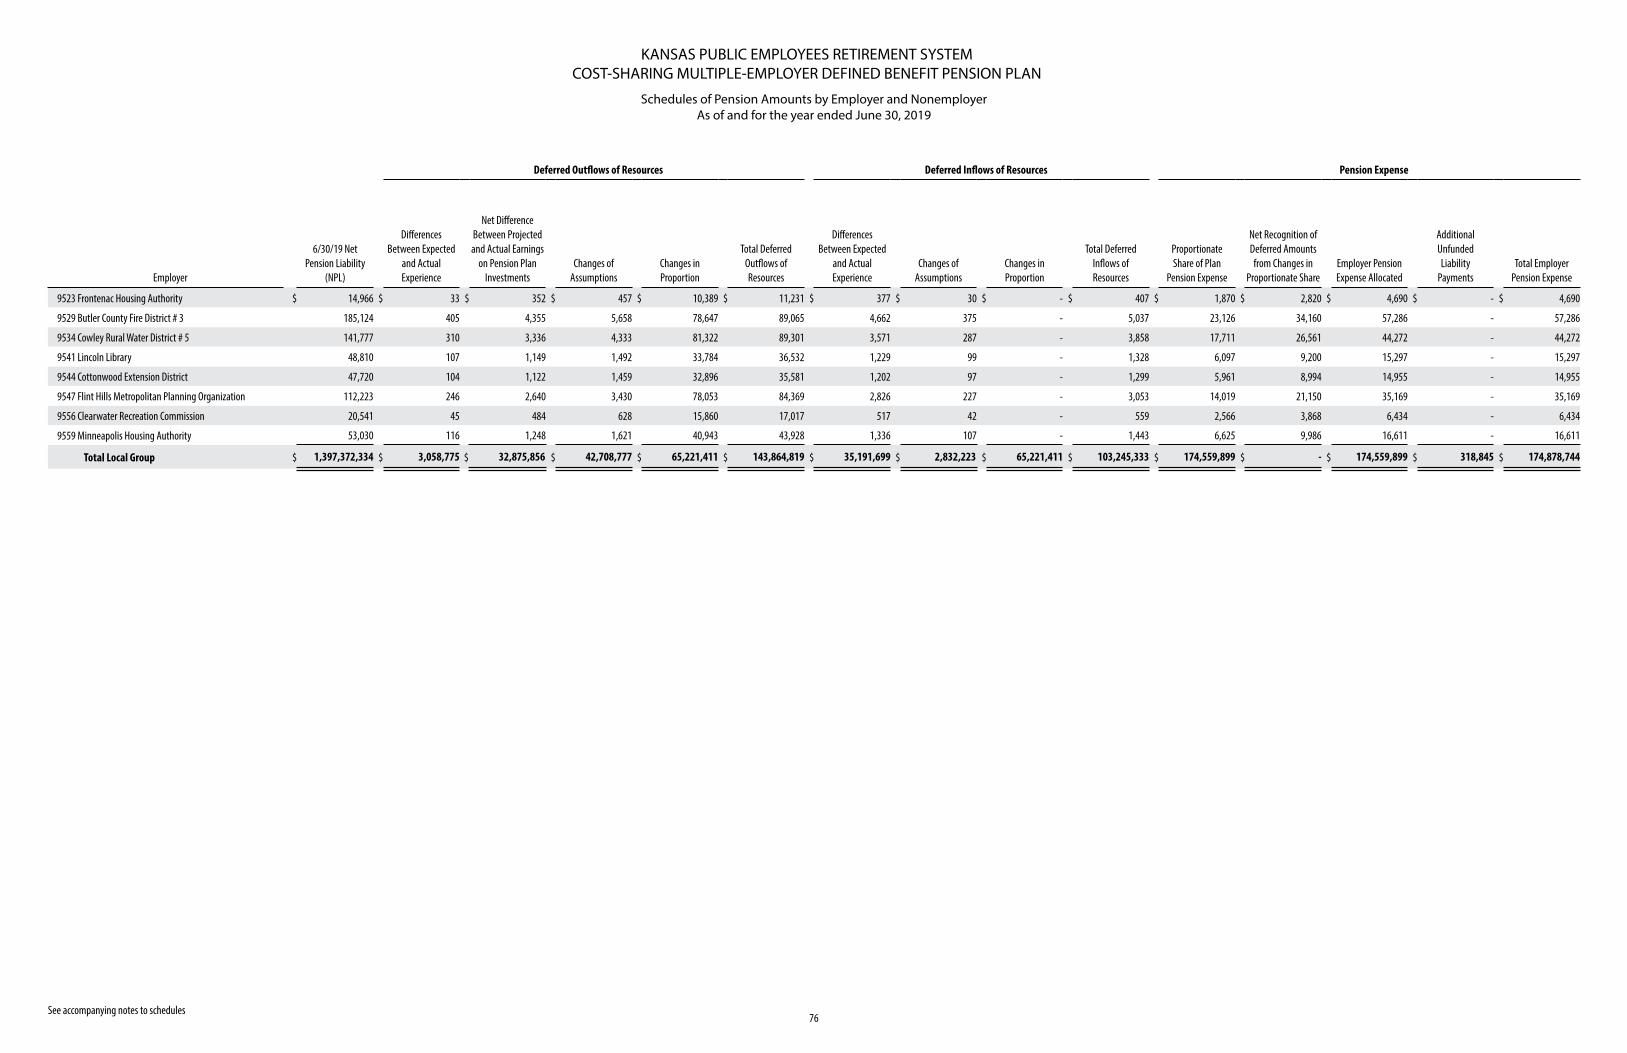
KANSAS PUBLIC EMPLOYEES RETIREMENT SYSTEMCOST-SHARING MULTIPLE-EMPLOYER DEFINED BENEFIT PENSION PLAN
Schedules of Pension Amounts by Employer and NonemployerAs of and for the year ended June 30, 2019
76 See accompanying notes to schedules
Deferred Outflows of Resources Deferred Inflows of Resources Pension Expense
Employer
6/30/19 Net Pension Liability
(NPL)
Differences Between Expected
and Actual Experience
Net Difference Between Projected and Actual Earnings
on Pension Plan Investments
Changes of Assumptions
Changes in Proportion
Total Deferred Outflows of Resources
Differences Between Expected
and Actual Experience
Changes of Assumptions
Changes in Proportion
Total Deferred Inflows of Resources
Proportionate Share of Plan
Pension Expense
Net Recognition of Deferred Amounts from Changes in
Proportionate ShareEmployer Pension Expense Allocated
Additional Unfunded Liability
PaymentsTotal Employer
Pension Expense
9523 Frontenac Housing Authority $ 14,966 $ 33 $ 352 $ 457 $ 10,389 $ 11,231 $ 377 $ 30 $ - $ 407 $ 1,870 $ 2,820 $ 4,690 $ - $ 4,690
9529 Butler County Fire District # 3 185,124 405 4,355 5,658 78,647 89,065 4,662 375 - 5,037 23,126 34,160 57,286 - 57,286
9534 Cowley Rural Water District # 5 141,777 310 3,336 4,333 81,322 89,301 3,571 287 - 3,858 17,711 26,561 44,272 - 44,272
9541 Lincoln Library 48,810 107 1,149 1,492 33,784 36,532 1,229 99 - 1,328 6,097 9,200 15,297 - 15,297
9544 Cottonwood Extension District 47,720 104 1,122 1,459 32,896 35,581 1,202 97 - 1,299 5,961 8,994 14,955 - 14,955
9547 Flint Hills Metropolitan Planning Organization 112,223 246 2,640 3,430 78,053 84,369 2,826 227 - 3,053 14,019 21,150 35,169 - 35,169
9556 Clearwater Recreation Commission 20,541 45 484 628 15,860 17,017 517 42 - 559 2,566 3,868 6,434 - 6,434
9559 Minneapolis Housing Authority 53,030 116 1,248 1,621 40,943 43,928 1,336 107 - 1,443 6,625 9,986 16,611 - 16,611
Total Local Group $ 1,397,372,334 $ 3,058,775 $ 32,875,856 $ 42,708,777 $ 65,221,411 $ 143,864,819 $ 35,191,699 $ 2,832,223 $ 65,221,411 $ 103,245,333 $ 174,559,899 $ - $ 174,559,899 $ 318,845 $ 174,878,744
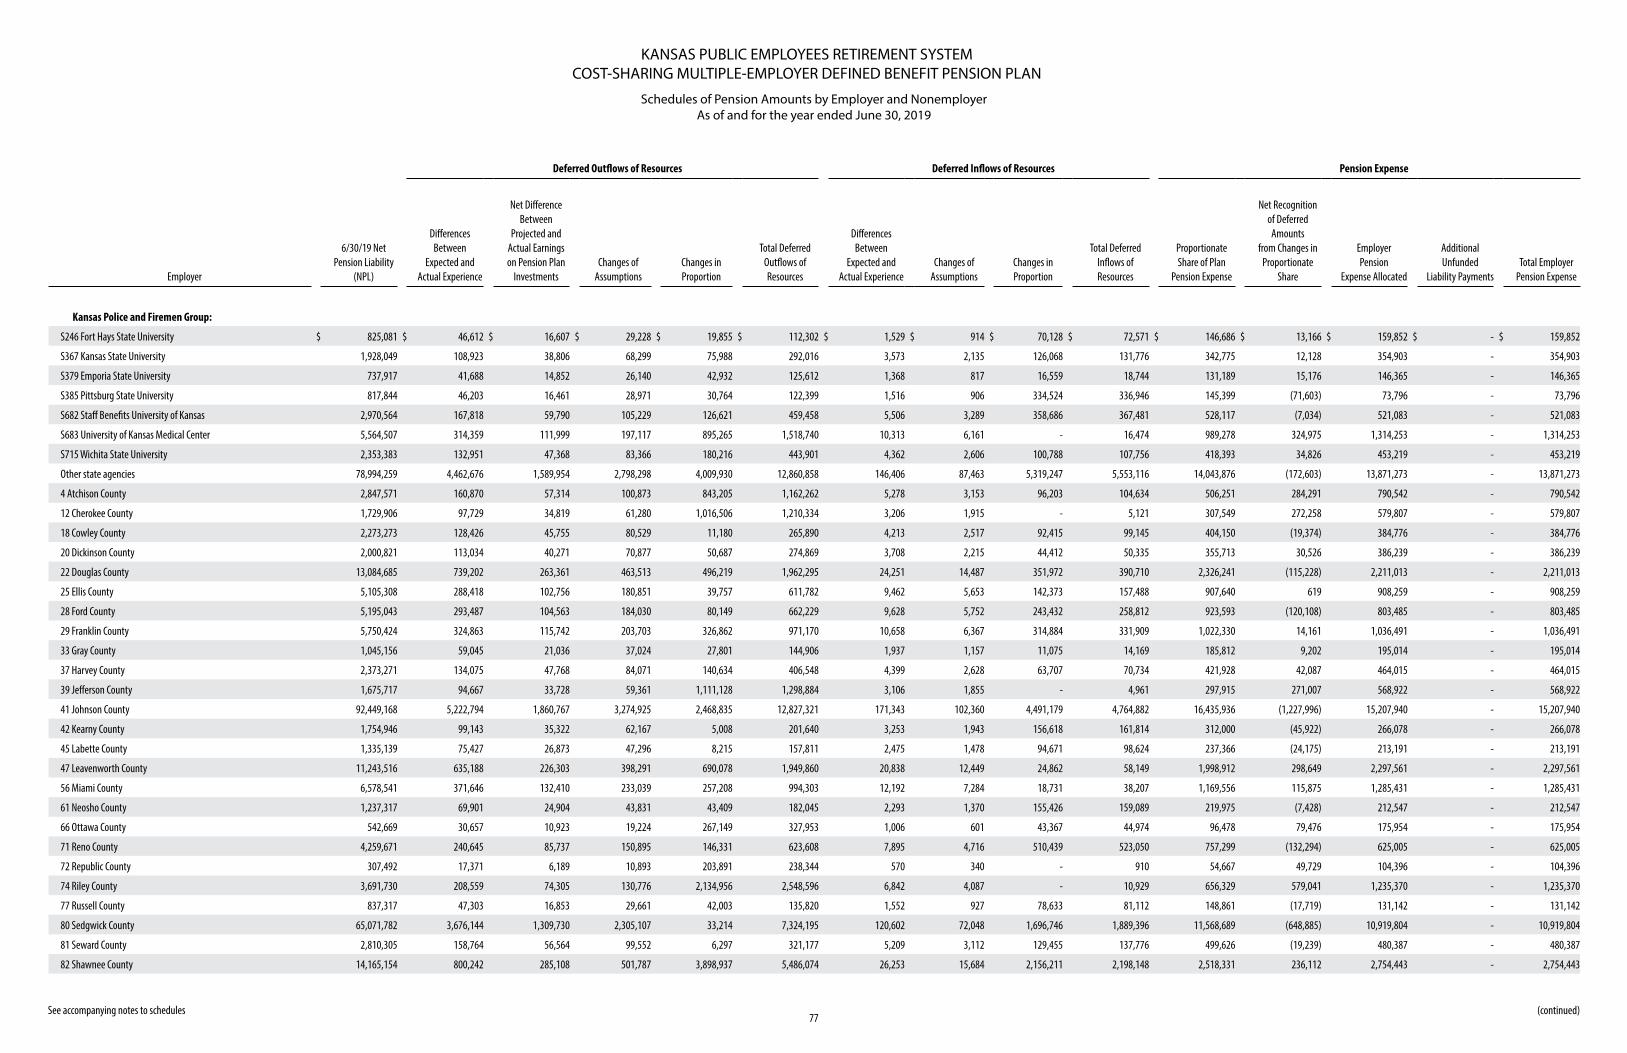
KANSAS PUBLIC EMPLOYEES RETIREMENT SYSTEMCOST-SHARING MULTIPLE-EMPLOYER DEFINED BENEFIT PENSION PLAN
Schedules of Pension Amounts by Employer and NonemployerAs of and for the year ended June 30, 2019
77 See accompanying notes to schedules
Deferred Outflows of Resources Deferred Inflows of Resources Pension Expense
Employer
6/30/19 Net Pension Liability
(NPL)
Differences Between
Expected and Actual Experience
Net Difference Between
Projected and Actual Earnings on Pension Plan
InvestmentsChanges of
AssumptionsChanges in Proportion
Total Deferred Outflows of Resources
Differences Between
Expected and Actual Experience
Changes of Assumptions
Changes in Proportion
Total Deferred Inflows of Resources
Proportionate Share of Plan
Pension Expense
Net Recognition of Deferred
Amounts from Changes in
Proportionate Share
Employer Pension
Expense Allocated
Additional Unfunded
Liability PaymentsTotal Employer
Pension Expense
Kansas Police and Firemen Group:
S246 Fort Hays State University $ 825,081 $ 46,612 $ 16,607 $ 29,228 $ 19,855 $ 112,302 $ 1,529 $ 914 $ 70,128 $ 72,571 $ 146,686 $ 13,166 $ 159,852 $ - $ 159,852
S367 Kansas State University 1,928,049 108,923 38,806 68,299 75,988 292,016 3,573 2,135 126,068 131,776 342,775 12,128 354,903 - 354,903
S379 Emporia State University 737,917 41,688 14,852 26,140 42,932 125,612 1,368 817 16,559 18,744 131,189 15,176 146,365 - 146,365
S385 Pittsburg State University 817,844 46,203 16,461 28,971 30,764 122,399 1,516 906 334,524 336,946 145,399 (71,603) 73,796 - 73,796
S682 Staff Benefits University of Kansas 2,970,564 167,818 59,790 105,229 126,621 459,458 5,506 3,289 358,686 367,481 528,117 (7,034) 521,083 - 521,083
S683 University of Kansas Medical Center 5,564,507 314,359 111,999 197,117 895,265 1,518,740 10,313 6,161 - 16,474 989,278 324,975 1,314,253 - 1,314,253
S715 Wichita State University 2,353,383 132,951 47,368 83,366 180,216 443,901 4,362 2,606 100,788 107,756 418,393 34,826 453,219 - 453,219
Other state agencies 78,994,259 4,462,676 1,589,954 2,798,298 4,009,930 12,860,858 146,406 87,463 5,319,247 5,553,116 14,043,876 (172,603) 13,871,273 - 13,871,273
4 Atchison County 2,847,571 160,870 57,314 100,873 843,205 1,162,262 5,278 3,153 96,203 104,634 506,251 284,291 790,542 - 790,542
12 Cherokee County 1,729,906 97,729 34,819 61,280 1,016,506 1,210,334 3,206 1,915 - 5,121 307,549 272,258 579,807 - 579,807
18 Cowley County 2,273,273 128,426 45,755 80,529 11,180 265,890 4,213 2,517 92,415 99,145 404,150 (19,374) 384,776 - 384,776
20 Dickinson County 2,000,821 113,034 40,271 70,877 50,687 274,869 3,708 2,215 44,412 50,335 355,713 30,526 386,239 - 386,239
22 Douglas County 13,084,685 739,202 263,361 463,513 496,219 1,962,295 24,251 14,487 351,972 390,710 2,326,241 (115,228) 2,211,013 - 2,211,013
25 Ellis County 5,105,308 288,418 102,756 180,851 39,757 611,782 9,462 5,653 142,373 157,488 907,640 619 908,259 - 908,259
28 Ford County 5,195,043 293,487 104,563 184,030 80,149 662,229 9,628 5,752 243,432 258,812 923,593 (120,108) 803,485 - 803,485
29 Franklin County 5,750,424 324,863 115,742 203,703 326,862 971,170 10,658 6,367 314,884 331,909 1,022,330 14,161 1,036,491 - 1,036,491
33 Gray County 1,045,156 59,045 21,036 37,024 27,801 144,906 1,937 1,157 11,075 14,169 185,812 9,202 195,014 - 195,014
37 Harvey County 2,373,271 134,075 47,768 84,071 140,634 406,548 4,399 2,628 63,707 70,734 421,928 42,087 464,015 - 464,015
39 Jefferson County 1,675,717 94,667 33,728 59,361 1,111,128 1,298,884 3,106 1,855 - 4,961 297,915 271,007 568,922 - 568,922
41 Johnson County 92,449,168 5,222,794 1,860,767 3,274,925 2,468,835 12,827,321 171,343 102,360 4,491,179 4,764,882 16,435,936 (1,227,996) 15,207,940 - 15,207,940
42 Kearny County 1,754,946 99,143 35,322 62,167 5,008 201,640 3,253 1,943 156,618 161,814 312,000 (45,922) 266,078 - 266,078
45 Labette County 1,335,139 75,427 26,873 47,296 8,215 157,811 2,475 1,478 94,671 98,624 237,366 (24,175) 213,191 - 213,191
47 Leavenworth County 11,243,516 635,188 226,303 398,291 690,078 1,949,860 20,838 12,449 24,862 58,149 1,998,912 298,649 2,297,561 - 2,297,561
56 Miami County 6,578,541 371,646 132,410 233,039 257,208 994,303 12,192 7,284 18,731 38,207 1,169,556 115,875 1,285,431 - 1,285,431
61 Neosho County 1,237,317 69,901 24,904 43,831 43,409 182,045 2,293 1,370 155,426 159,089 219,975 (7,428) 212,547 - 212,547
66 Ottawa County 542,669 30,657 10,923 19,224 267,149 327,953 1,006 601 43,367 44,974 96,478 79,476 175,954 - 175,954
71 Reno County 4,259,671 240,645 85,737 150,895 146,331 623,608 7,895 4,716 510,439 523,050 757,299 (132,294) 625,005 - 625,005
72 Republic County 307,492 17,371 6,189 10,893 203,891 238,344 570 340 - 910 54,667 49,729 104,396 - 104,396
74 Riley County 3,691,730 208,559 74,305 130,776 2,134,956 2,548,596 6,842 4,087 - 10,929 656,329 579,041 1,235,370 - 1,235,370
77 Russell County 837,317 47,303 16,853 29,661 42,003 135,820 1,552 927 78,633 81,112 148,861 (17,719) 131,142 - 131,142
80 Sedgwick County 65,071,782 3,676,144 1,309,730 2,305,107 33,214 7,324,195 120,602 72,048 1,696,746 1,889,396 11,568,689 (648,885) 10,919,804 - 10,919,804
81 Seward County 2,810,305 158,764 56,564 99,552 6,297 321,177 5,209 3,112 129,455 137,776 499,626 (19,239) 480,387 - 480,387
82 Shawnee County 14,165,154 800,242 285,108 501,787 3,898,937 5,486,074 26,253 15,684 2,156,211 2,198,148 2,518,331 236,112 2,754,443 - 2,754,443
(continued)
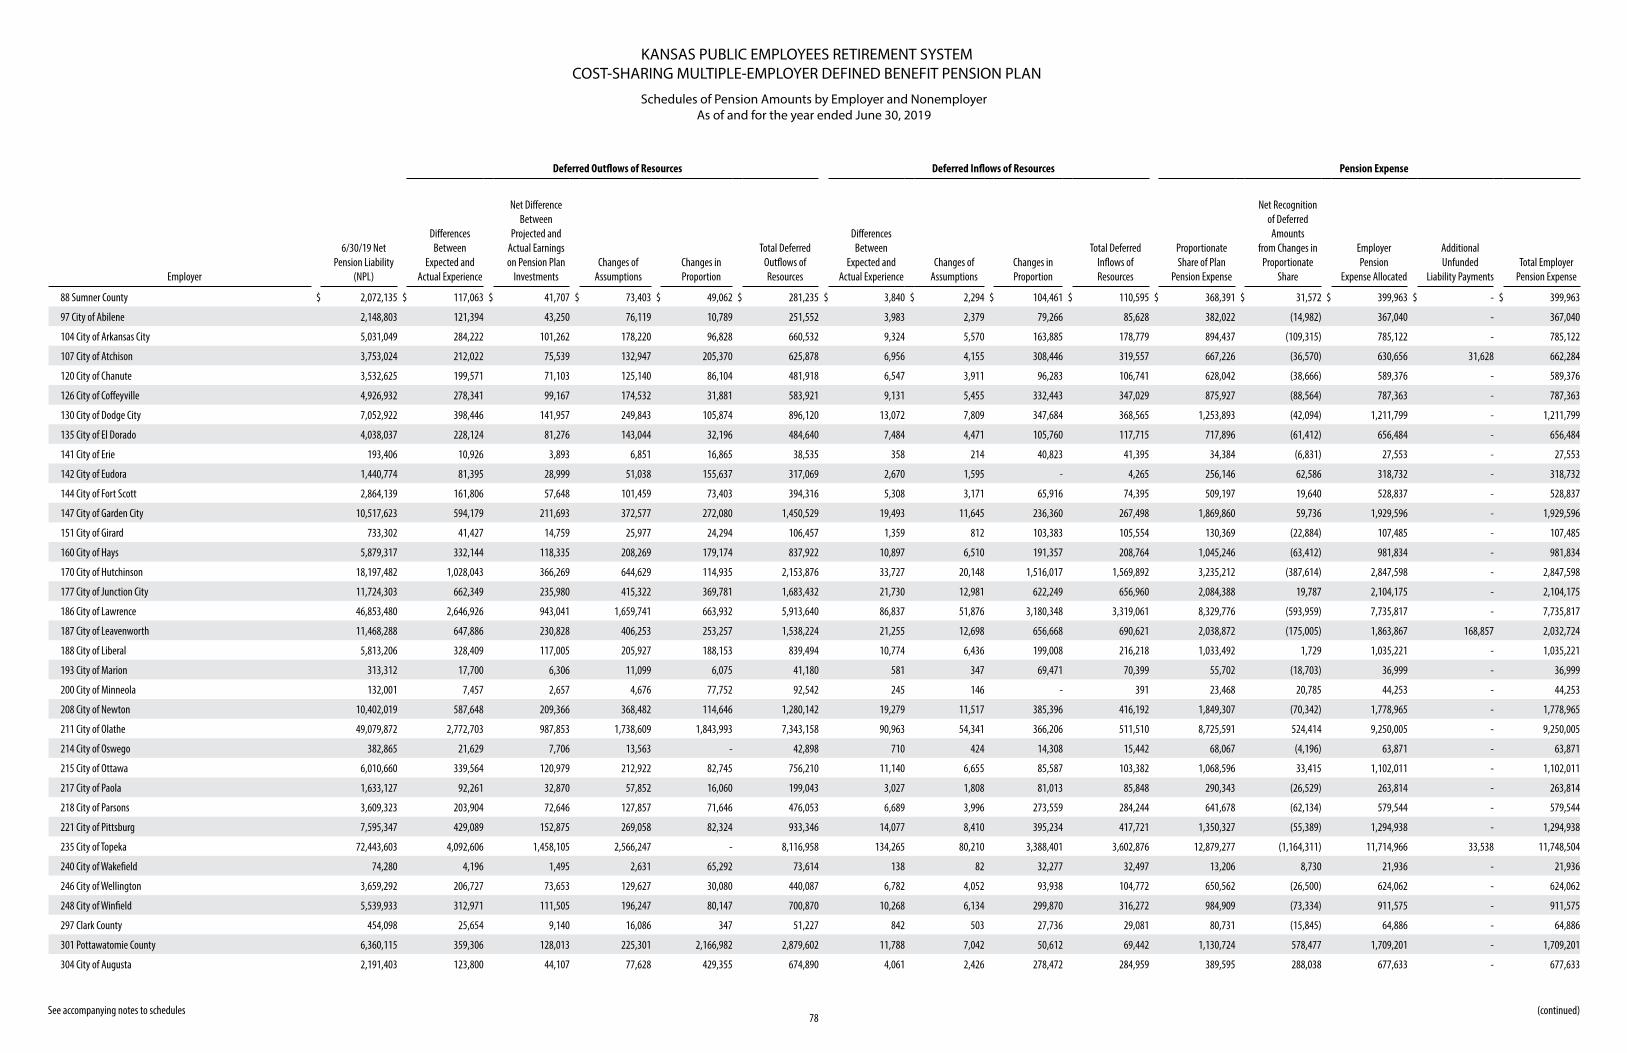
KANSAS PUBLIC EMPLOYEES RETIREMENT SYSTEMCOST-SHARING MULTIPLE-EMPLOYER DEFINED BENEFIT PENSION PLAN
Schedules of Pension Amounts by Employer and NonemployerAs of and for the year ended June 30, 2019
78 See accompanying notes to schedules
Deferred Outflows of Resources Deferred Inflows of Resources Pension Expense
Employer
6/30/19 Net Pension Liability
(NPL)
Differences Between
Expected and Actual Experience
Net Difference Between
Projected and Actual Earnings on Pension Plan
InvestmentsChanges of
AssumptionsChanges in Proportion
Total Deferred Outflows of Resources
Differences Between
Expected and Actual Experience
Changes of Assumptions
Changes in Proportion
Total Deferred Inflows of Resources
Proportionate Share of Plan
Pension Expense
Net Recognition of Deferred
Amounts from Changes in
Proportionate Share
Employer Pension
Expense Allocated
Additional Unfunded
Liability PaymentsTotal Employer
Pension Expense
88 Sumner County $ 2,072,135 $ 117,063 $ 41,707 $ 73,403 $ 49,062 $ 281,235 $ 3,840 $ 2,294 $ 104,461 $ 110,595 $ 368,391 $ 31,572 $ 399,963 $ - $ 399,963
97 City of Abilene 2,148,803 121,394 43,250 76,119 10,789 251,552 3,983 2,379 79,266 85,628 382,022 (14,982) 367,040 - 367,040
104 City of Arkansas City 5,031,049 284,222 101,262 178,220 96,828 660,532 9,324 5,570 163,885 178,779 894,437 (109,315) 785,122 - 785,122
107 City of Atchison 3,753,024 212,022 75,539 132,947 205,370 625,878 6,956 4,155 308,446 319,557 667,226 (36,570) 630,656 31,628 662,284
120 City of Chanute 3,532,625 199,571 71,103 125,140 86,104 481,918 6,547 3,911 96,283 106,741 628,042 (38,666) 589,376 - 589,376
126 City of Coffeyville 4,926,932 278,341 99,167 174,532 31,881 583,921 9,131 5,455 332,443 347,029 875,927 (88,564) 787,363 - 787,363
130 City of Dodge City 7,052,922 398,446 141,957 249,843 105,874 896,120 13,072 7,809 347,684 368,565 1,253,893 (42,094) 1,211,799 - 1,211,799
135 City of El Dorado 4,038,037 228,124 81,276 143,044 32,196 484,640 7,484 4,471 105,760 117,715 717,896 (61,412) 656,484 - 656,484
141 City of Erie 193,406 10,926 3,893 6,851 16,865 38,535 358 214 40,823 41,395 34,384 (6,831) 27,553 - 27,553
142 City of Eudora 1,440,774 81,395 28,999 51,038 155,637 317,069 2,670 1,595 - 4,265 256,146 62,586 318,732 - 318,732
144 City of Fort Scott 2,864,139 161,806 57,648 101,459 73,403 394,316 5,308 3,171 65,916 74,395 509,197 19,640 528,837 - 528,837
147 City of Garden City 10,517,623 594,179 211,693 372,577 272,080 1,450,529 19,493 11,645 236,360 267,498 1,869,860 59,736 1,929,596 - 1,929,596
151 City of Girard 733,302 41,427 14,759 25,977 24,294 106,457 1,359 812 103,383 105,554 130,369 (22,884) 107,485 - 107,485
160 City of Hays 5,879,317 332,144 118,335 208,269 179,174 837,922 10,897 6,510 191,357 208,764 1,045,246 (63,412) 981,834 - 981,834
170 City of Hutchinson 18,197,482 1,028,043 366,269 644,629 114,935 2,153,876 33,727 20,148 1,516,017 1,569,892 3,235,212 (387,614) 2,847,598 - 2,847,598
177 City of Junction City 11,724,303 662,349 235,980 415,322 369,781 1,683,432 21,730 12,981 622,249 656,960 2,084,388 19,787 2,104,175 - 2,104,175
186 City of Lawrence 46,853,480 2,646,926 943,041 1,659,741 663,932 5,913,640 86,837 51,876 3,180,348 3,319,061 8,329,776 (593,959) 7,735,817 - 7,735,817
187 City of Leavenworth 11,468,288 647,886 230,828 406,253 253,257 1,538,224 21,255 12,698 656,668 690,621 2,038,872 (175,005) 1,863,867 168,857 2,032,724
188 City of Liberal 5,813,206 328,409 117,005 205,927 188,153 839,494 10,774 6,436 199,008 216,218 1,033,492 1,729 1,035,221 - 1,035,221
193 City of Marion 313,312 17,700 6,306 11,099 6,075 41,180 581 347 69,471 70,399 55,702 (18,703) 36,999 - 36,999
200 City of Minneola 132,001 7,457 2,657 4,676 77,752 92,542 245 146 - 391 23,468 20,785 44,253 - 44,253
208 City of Newton 10,402,019 587,648 209,366 368,482 114,646 1,280,142 19,279 11,517 385,396 416,192 1,849,307 (70,342) 1,778,965 - 1,778,965
211 City of Olathe 49,079,872 2,772,703 987,853 1,738,609 1,843,993 7,343,158 90,963 54,341 366,206 511,510 8,725,591 524,414 9,250,005 - 9,250,005
214 City of Oswego 382,865 21,629 7,706 13,563 - 42,898 710 424 14,308 15,442 68,067 (4,196) 63,871 - 63,871
215 City of Ottawa 6,010,660 339,564 120,979 212,922 82,745 756,210 11,140 6,655 85,587 103,382 1,068,596 33,415 1,102,011 - 1,102,011
217 City of Paola 1,633,127 92,261 32,870 57,852 16,060 199,043 3,027 1,808 81,013 85,848 290,343 (26,529) 263,814 - 263,814
218 City of Parsons 3,609,323 203,904 72,646 127,857 71,646 476,053 6,689 3,996 273,559 284,244 641,678 (62,134) 579,544 - 579,544
221 City of Pittsburg 7,595,347 429,089 152,875 269,058 82,324 933,346 14,077 8,410 395,234 417,721 1,350,327 (55,389) 1,294,938 - 1,294,938
235 City of Topeka 72,443,603 4,092,606 1,458,105 2,566,247 - 8,116,958 134,265 80,210 3,388,401 3,602,876 12,879,277 (1,164,311) 11,714,966 33,538 11,748,504
240 City of Wakefield 74,280 4,196 1,495 2,631 65,292 73,614 138 82 32,277 32,497 13,206 8,730 21,936 - 21,936
246 City of Wellington 3,659,292 206,727 73,653 129,627 30,080 440,087 6,782 4,052 93,938 104,772 650,562 (26,500) 624,062 - 624,062
248 City of Winfield 5,539,933 312,971 111,505 196,247 80,147 700,870 10,268 6,134 299,870 316,272 984,909 (73,334) 911,575 - 911,575
297 Clark County 454,098 25,654 9,140 16,086 347 51,227 842 503 27,736 29,081 80,731 (15,845) 64,886 - 64,886
301 Pottawatomie County 6,360,115 359,306 128,013 225,301 2,166,982 2,879,602 11,788 7,042 50,612 69,442 1,130,724 578,477 1,709,201 - 1,709,201
304 City of Augusta 2,191,403 123,800 44,107 77,628 429,355 674,890 4,061 2,426 278,472 284,959 389,595 288,038 677,633 - 677,633
(continued)
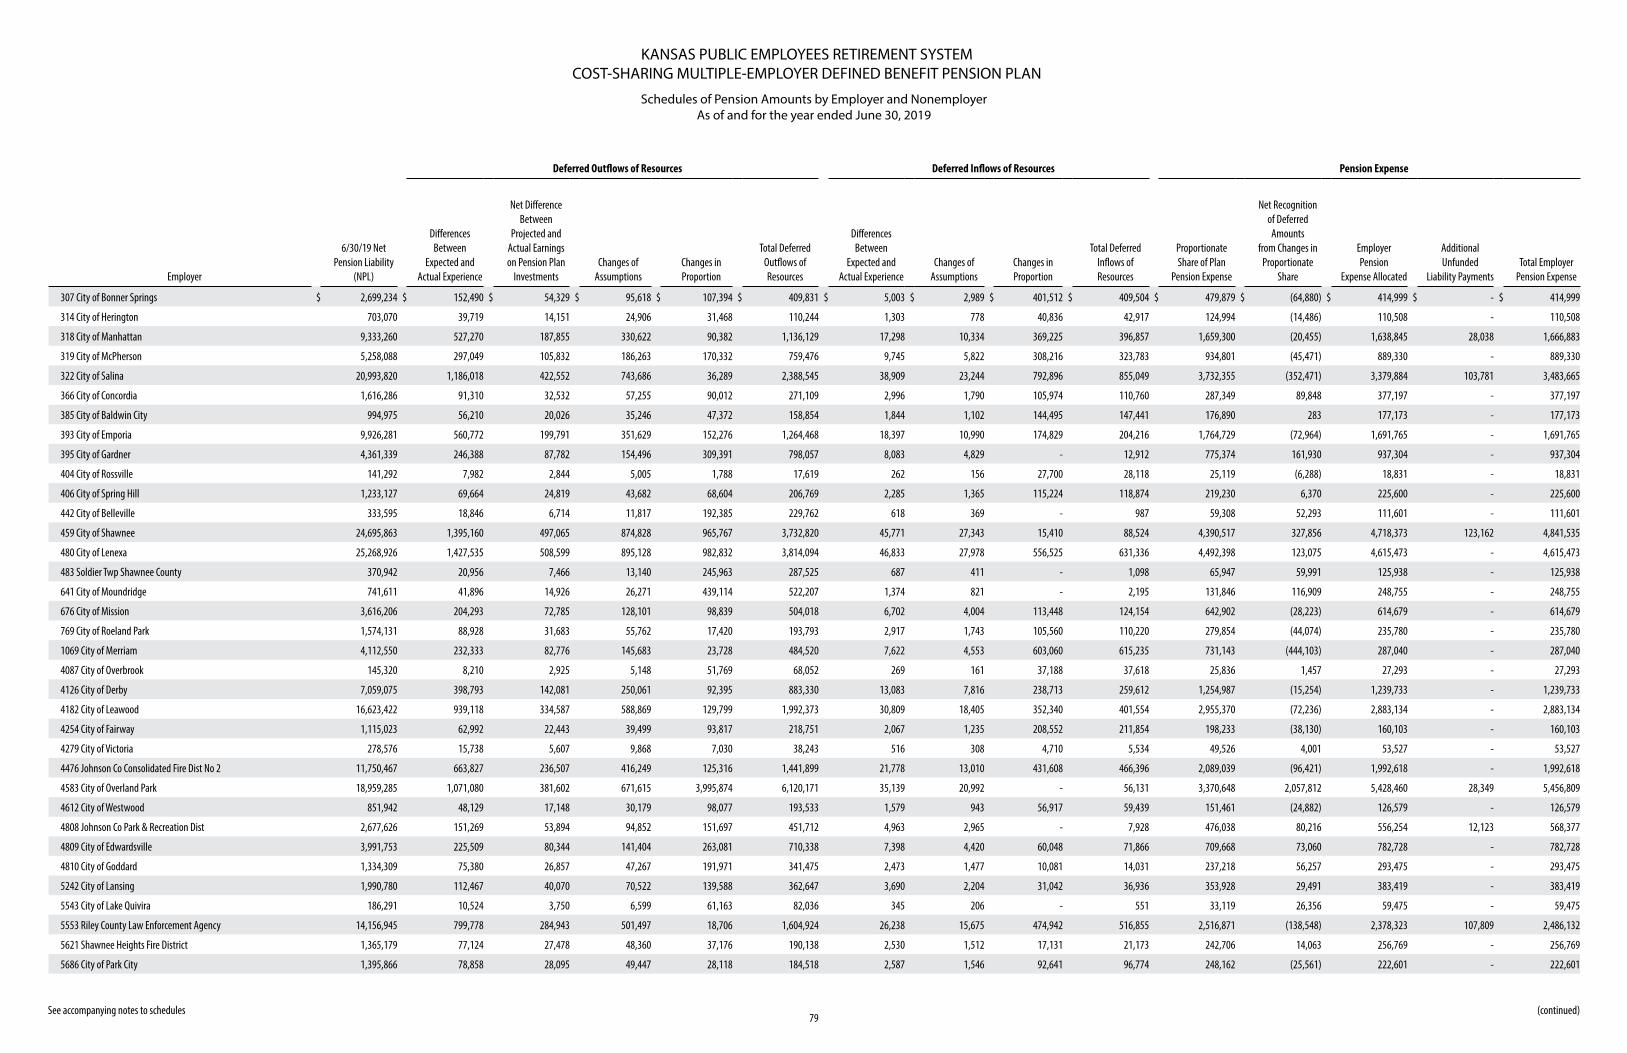
KANSAS PUBLIC EMPLOYEES RETIREMENT SYSTEMCOST-SHARING MULTIPLE-EMPLOYER DEFINED BENEFIT PENSION PLAN
Schedules of Pension Amounts by Employer and NonemployerAs of and for the year ended June 30, 2019
79 See accompanying notes to schedules
Deferred Outflows of Resources Deferred Inflows of Resources Pension Expense
Employer
6/30/19 Net Pension Liability
(NPL)
Differences Between
Expected and Actual Experience
Net Difference Between
Projected and Actual Earnings on Pension Plan
InvestmentsChanges of
AssumptionsChanges in Proportion
Total Deferred Outflows of Resources
Differences Between
Expected and Actual Experience
Changes of Assumptions
Changes in Proportion
Total Deferred Inflows of Resources
Proportionate Share of Plan
Pension Expense
Net Recognition of Deferred
Amounts from Changes in
Proportionate Share
Employer Pension
Expense Allocated
Additional Unfunded
Liability PaymentsTotal Employer
Pension Expense
307 City of Bonner Springs $ 2,699,234 $ 152,490 $ 54,329 $ 95,618 $ 107,394 $ 409,831 $ 5,003 $ 2,989 $ 401,512 $ 409,504 $ 479,879 $ (64,880) $ 414,999 $ - $ 414,999
314 City of Herington 703,070 39,719 14,151 24,906 31,468 110,244 1,303 778 40,836 42,917 124,994 (14,486) 110,508 - 110,508
318 City of Manhattan 9,333,260 527,270 187,855 330,622 90,382 1,136,129 17,298 10,334 369,225 396,857 1,659,300 (20,455) 1,638,845 28,038 1,666,883
319 City of McPherson 5,258,088 297,049 105,832 186,263 170,332 759,476 9,745 5,822 308,216 323,783 934,801 (45,471) 889,330 - 889,330
322 City of Salina 20,993,820 1,186,018 422,552 743,686 36,289 2,388,545 38,909 23,244 792,896 855,049 3,732,355 (352,471) 3,379,884 103,781 3,483,665
366 City of Concordia 1,616,286 91,310 32,532 57,255 90,012 271,109 2,996 1,790 105,974 110,760 287,349 89,848 377,197 - 377,197
385 City of Baldwin City 994,975 56,210 20,026 35,246 47,372 158,854 1,844 1,102 144,495 147,441 176,890 283 177,173 - 177,173
393 City of Emporia 9,926,281 560,772 199,791 351,629 152,276 1,264,468 18,397 10,990 174,829 204,216 1,764,729 (72,964) 1,691,765 - 1,691,765
395 City of Gardner 4,361,339 246,388 87,782 154,496 309,391 798,057 8,083 4,829 - 12,912 775,374 161,930 937,304 - 937,304
404 City of Rossville 141,292 7,982 2,844 5,005 1,788 17,619 262 156 27,700 28,118 25,119 (6,288) 18,831 - 18,831
406 City of Spring Hill 1,233,127 69,664 24,819 43,682 68,604 206,769 2,285 1,365 115,224 118,874 219,230 6,370 225,600 - 225,600
442 City of Belleville 333,595 18,846 6,714 11,817 192,385 229,762 618 369 - 987 59,308 52,293 111,601 - 111,601
459 City of Shawnee 24,695,863 1,395,160 497,065 874,828 965,767 3,732,820 45,771 27,343 15,410 88,524 4,390,517 327,856 4,718,373 123,162 4,841,535
480 City of Lenexa 25,268,926 1,427,535 508,599 895,128 982,832 3,814,094 46,833 27,978 556,525 631,336 4,492,398 123,075 4,615,473 - 4,615,473
483 Soldier Twp Shawnee County 370,942 20,956 7,466 13,140 245,963 287,525 687 411 - 1,098 65,947 59,991 125,938 - 125,938
641 City of Moundridge 741,611 41,896 14,926 26,271 439,114 522,207 1,374 821 - 2,195 131,846 116,909 248,755 - 248,755
676 City of Mission 3,616,206 204,293 72,785 128,101 98,839 504,018 6,702 4,004 113,448 124,154 642,902 (28,223) 614,679 - 614,679
769 City of Roeland Park 1,574,131 88,928 31,683 55,762 17,420 193,793 2,917 1,743 105,560 110,220 279,854 (44,074) 235,780 - 235,780
1069 City of Merriam 4,112,550 232,333 82,776 145,683 23,728 484,520 7,622 4,553 603,060 615,235 731,143 (444,103) 287,040 - 287,040
4087 City of Overbrook 145,320 8,210 2,925 5,148 51,769 68,052 269 161 37,188 37,618 25,836 1,457 27,293 - 27,293
4126 City of Derby 7,059,075 398,793 142,081 250,061 92,395 883,330 13,083 7,816 238,713 259,612 1,254,987 (15,254) 1,239,733 - 1,239,733
4182 City of Leawood 16,623,422 939,118 334,587 588,869 129,799 1,992,373 30,809 18,405 352,340 401,554 2,955,370 (72,236) 2,883,134 - 2,883,134
4254 City of Fairway 1,115,023 62,992 22,443 39,499 93,817 218,751 2,067 1,235 208,552 211,854 198,233 (38,130) 160,103 - 160,103
4279 City of Victoria 278,576 15,738 5,607 9,868 7,030 38,243 516 308 4,710 5,534 49,526 4,001 53,527 - 53,527
4476 Johnson Co Consolidated Fire Dist No 2 11,750,467 663,827 236,507 416,249 125,316 1,441,899 21,778 13,010 431,608 466,396 2,089,039 (96,421) 1,992,618 - 1,992,618
4583 City of Overland Park 18,959,285 1,071,080 381,602 671,615 3,995,874 6,120,171 35,139 20,992 - 56,131 3,370,648 2,057,812 5,428,460 28,349 5,456,809
4612 City of Westwood 851,942 48,129 17,148 30,179 98,077 193,533 1,579 943 56,917 59,439 151,461 (24,882) 126,579 - 126,579
4808 Johnson Co Park & Recreation Dist 2,677,626 151,269 53,894 94,852 151,697 451,712 4,963 2,965 - 7,928 476,038 80,216 556,254 12,123 568,377
4809 City of Edwardsville 3,991,753 225,509 80,344 141,404 263,081 710,338 7,398 4,420 60,048 71,866 709,668 73,060 782,728 - 782,728
4810 City of Goddard 1,334,309 75,380 26,857 47,267 191,971 341,475 2,473 1,477 10,081 14,031 237,218 56,257 293,475 - 293,475
5242 City of Lansing 1,990,780 112,467 40,070 70,522 139,588 362,647 3,690 2,204 31,042 36,936 353,928 29,491 383,419 - 383,419
5543 City of Lake Quivira 186,291 10,524 3,750 6,599 61,163 82,036 345 206 - 551 33,119 26,356 59,475 - 59,475
5553 Riley County Law Enforcement Agency 14,156,945 799,778 284,943 501,497 18,706 1,604,924 26,238 15,675 474,942 516,855 2,516,871 (138,548) 2,378,323 107,809 2,486,132
5621 Shawnee Heights Fire District 1,365,179 77,124 27,478 48,360 37,176 190,138 2,530 1,512 17,131 21,173 242,706 14,063 256,769 - 256,769
5686 City of Park City 1,395,866 78,858 28,095 49,447 28,118 184,518 2,587 1,546 92,641 96,774 248,162 (25,561) 222,601 - 222,601
(continued)
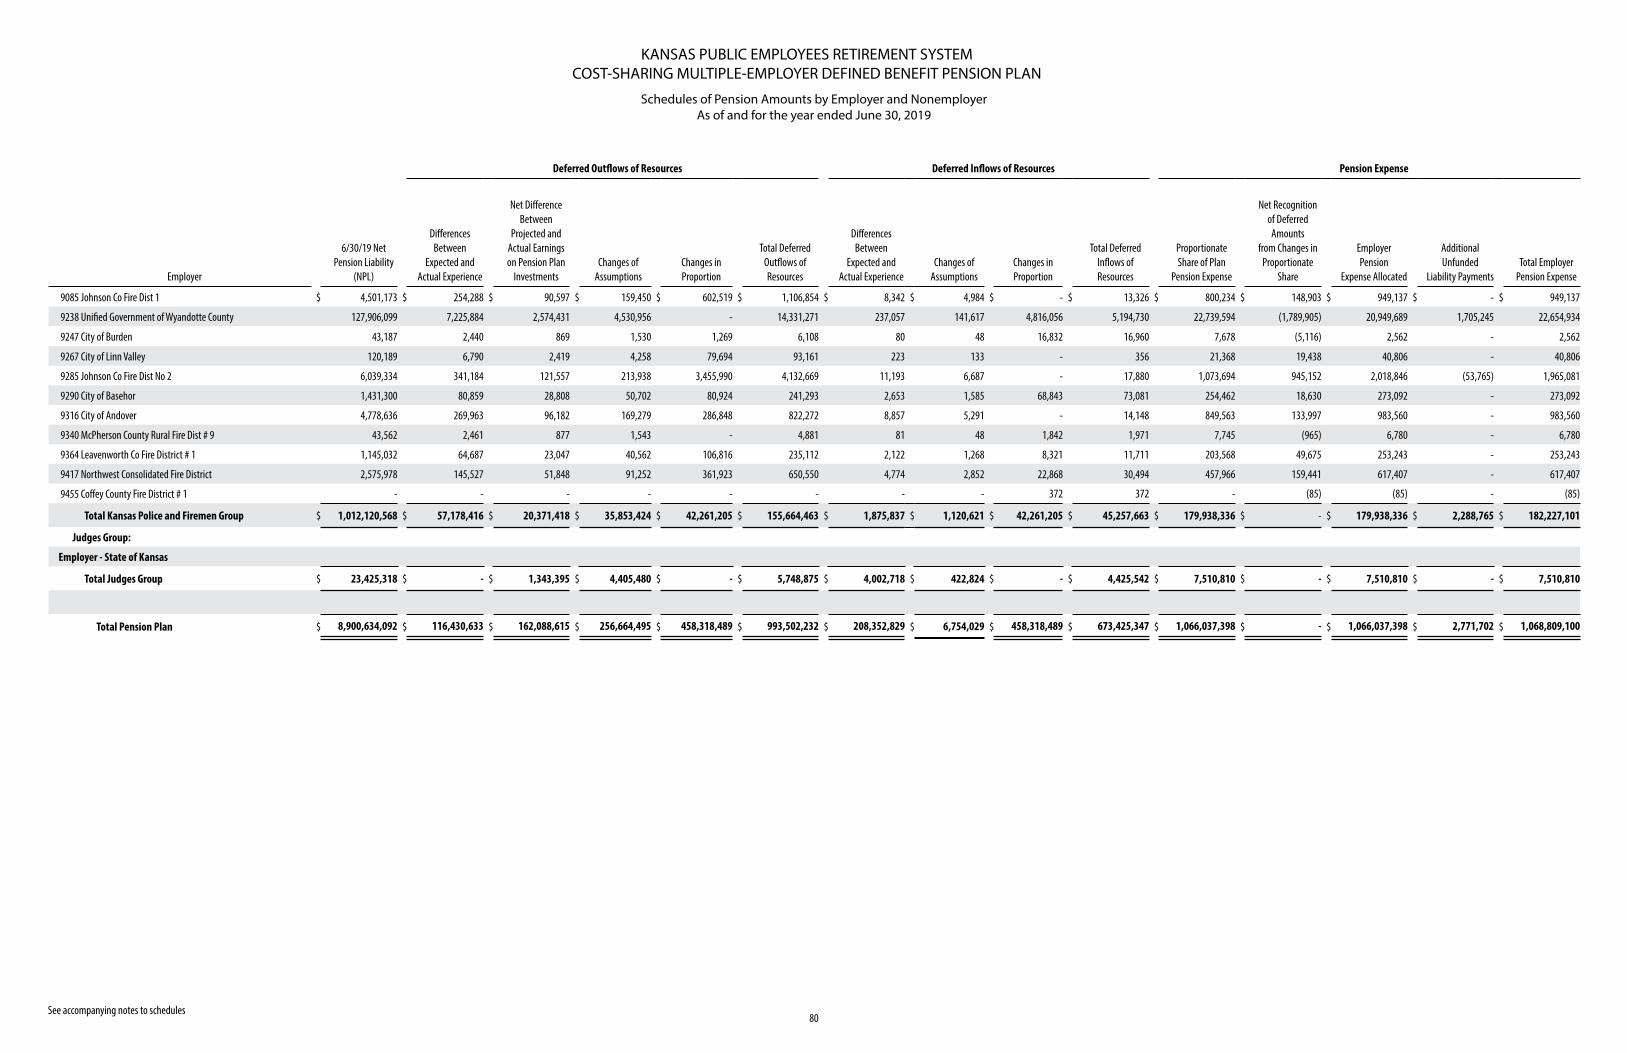
KANSAS PUBLIC EMPLOYEES RETIREMENT SYSTEMCOST-SHARING MULTIPLE-EMPLOYER DEFINED BENEFIT PENSION PLAN
Schedules of Pension Amounts by Employer and NonemployerAs of and for the year ended June 30, 2019
80 See accompanying notes to schedules
Deferred Outflows of Resources Deferred Inflows of Resources Pension Expense
Employer
6/30/19 Net Pension Liability
(NPL)
Differences Between
Expected and Actual Experience
Net Difference Between
Projected and Actual Earnings on Pension Plan
InvestmentsChanges of
AssumptionsChanges in Proportion
Total Deferred Outflows of Resources
Differences Between
Expected and Actual Experience
Changes of Assumptions
Changes in Proportion
Total Deferred Inflows of Resources
Proportionate Share of Plan
Pension Expense
Net Recognition of Deferred
Amounts from Changes in
Proportionate Share
Employer Pension
Expense Allocated
Additional Unfunded
Liability PaymentsTotal Employer
Pension Expense
9085 Johnson Co Fire Dist 1 $ 4,501,173 $ 254,288 $ 90,597 $ 159,450 $ 602,519 $ 1,106,854 $ 8,342 $ 4,984 $ - $ 13,326 $ 800,234 $ 148,903 $ 949,137 $ - $ 949,137
9238 Unified Government of Wyandotte County 127,906,099 7,225,884 2,574,431 4,530,956 - 14,331,271 237,057 141,617 4,816,056 5,194,730 22,739,594 (1,789,905) 20,949,689 1,705,245 22,654,934
9247 City of Burden 43,187 2,440 869 1,530 1,269 6,108 80 48 16,832 16,960 7,678 (5,116) 2,562 - 2,562
9267 City of Linn Valley 120,189 6,790 2,419 4,258 79,694 93,161 223 133 - 356 21,368 19,438 40,806 - 40,806
9285 Johnson Co Fire Dist No 2 6,039,334 341,184 121,557 213,938 3,455,990 4,132,669 11,193 6,687 - 17,880 1,073,694 945,152 2,018,846 (53,765) 1,965,081
9290 City of Basehor 1,431,300 80,859 28,808 50,702 80,924 241,293 2,653 1,585 68,843 73,081 254,462 18,630 273,092 - 273,092
9316 City of Andover 4,778,636 269,963 96,182 169,279 286,848 822,272 8,857 5,291 - 14,148 849,563 133,997 983,560 - 983,560
9340 McPherson County Rural Fire Dist # 9 43,562 2,461 877 1,543 - 4,881 81 48 1,842 1,971 7,745 (965) 6,780 - 6,780
9364 Leavenworth Co Fire District # 1 1,145,032 64,687 23,047 40,562 106,816 235,112 2,122 1,268 8,321 11,711 203,568 49,675 253,243 - 253,243
9417 Northwest Consolidated Fire District 2,575,978 145,527 51,848 91,252 361,923 650,550 4,774 2,852 22,868 30,494 457,966 159,441 617,407 - 617,407
9455 Coffey County Fire District # 1 - - - - - - - - 372 372 - (85) (85) - (85)
Total Kansas Police and Firemen Group $ 1,012,120,568 $ 57,178,416 $ 20,371,418 $ 35,853,424 $ 42,261,205 $ 155,664,463 $ 1,875,837 $ 1,120,621 $ 42,261,205 $ 45,257,663 $ 179,938,336 $ - $ 179,938,336 $ 2,288,765 $ 182,227,101
Judges Group:
Employer - State of Kansas
Total Judges Group $ 23,425,318 $ - $ 1,343,395 $ 4,405,480 $ - $ 5,748,875 $ 4,002,718 $ 422,824 $ - $ 4,425,542 $ 7,510,810 $ - $ 7,510,810 $ - $ 7,510,810
Total Pension Plan $ 8,900,634,092 $ 116,430,633 $ 162,088,615 $ 256,664,495 $ 458,318,489 $ 993,502,232 $ 208,352,829 $ 6,754,029 $ 458,318,489 $ 673,425,347 $ 1,066,037,398 $ - $ 1,066,037,398 $ 2,771,702 $ 1,068,809,100
KANSAS PUBLIC EMPLOYEES RETIREMENT SYSTEMCOST-SHARING MULTIPLE-EMPLOYER DEFINED BENEFIT PENSION PLAN
Notes to Schedules of Employer and Nonemployer Allocations andSchedules of Pension Amounts by Employer and Nonemployer
As of and for the year ended June 30, 2019
81
Plan Description
The Kansas Public Employees Retirement System (KPERS, or the System) is a body corporate and an instrumen-tality of the State of Kansas. KPERS is the administrator of a cost-sharing multiple-employer defined benefit pension plan (Pension Plan) as defined in Governmental Accounting Standards Board (GASB) Statement No. 67, Financial Reporting for Pension Plans. KPERS financial statements are included in its Comprehensive Annual Financial Report which can be found on the System’s website at www.kpers.org. KPERS provides pension benefits to the following statewide pension groups under one plan, as provided by K.S.A. 74, article 49:
• Public employees, which include: – State/School employees – Local employees
• Police and Firemen• Judges
Substantially all public employees in Kansas are covered by KPERS. The State of Kansas and Kansas schools are required to participate, while participation by local political subdivisions is optional but irrevocable once elected.
Benefits
Benefits are established by statute and may only be changed by the Legislature. Members (except Police and Firemen) with ten or more years of credited service, may retire as early as age 55 (Police and Firemen may be age 50 with 20 years of credited service), with an actuarially reduced monthly benefit. Normal retirement is at age 65, age 62 with ten years of credited service, or whenever a member’s combined age and years of credited service equal 85 “points” (Police and Firemen normal retirement ages are age 60 with 15 years of credited ser-vice, age 55 with 20 years, age 50 with 25 years, or any age with 36 years of service).
Monthly retirement benefits are based on a statutory formula that includes final average salary and years of service. When ending employment, members may withdraw their contributions from their individual accounts, including interest. Members who withdraw their accumulated contributions lose all rights and privileges of membership. For all pension coverage groups, the accumulated contributions and interest are deposited into and disbursed from the membership accumulated reserve fund as established by K.S.A. 74 4922.
Members choose one of seven payment options for their monthly retirement benefits. At retirement, a member may receive a lump sum payment of up to 50% of the actuarial present value of the member’s lifetime benefit. His or her monthly retirement benefit is then permanently reduced based on the amount of the lump sum. Benefit increases, including ad hoc post retirement benefit increases, must be passed into law by the Kansas Legislature. Benefit increases are under the authority of the Legislature and the Governor of the State of Kansas.
(1)
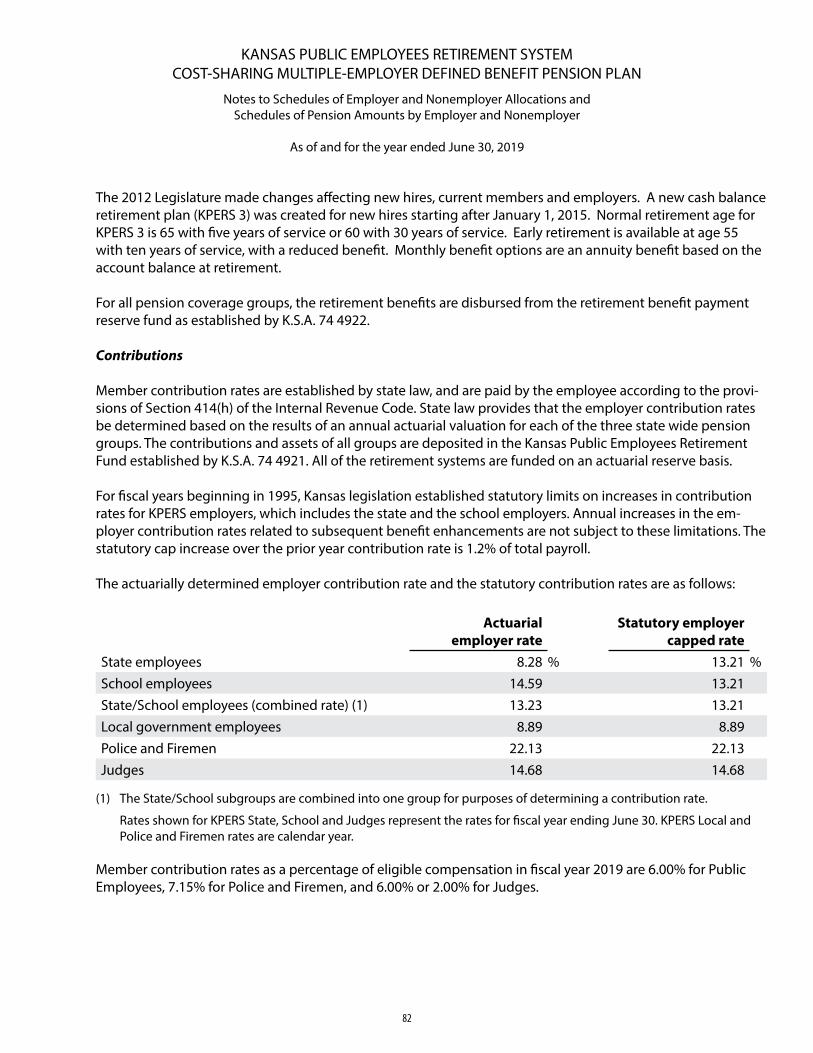
KANSAS PUBLIC EMPLOYEES RETIREMENT SYSTEMCOST-SHARING MULTIPLE-EMPLOYER DEFINED BENEFIT PENSION PLAN
Notes to Schedules of Employer and Nonemployer Allocations andSchedules of Pension Amounts by Employer and Nonemployer
As of and for the year ended June 30, 2019
82
The 2012 Legislature made changes affecting new hires, current members and employers. A new cash balance retirement plan (KPERS 3) was created for new hires starting after January 1, 2015. Normal retirement age for KPERS 3 is 65 with five years of service or 60 with 30 years of service. Early retirement is available at age 55 with ten years of service, with a reduced benefit. Monthly benefit options are an annuity benefit based on the account balance at retirement.
For all pension coverage groups, the retirement benefits are disbursed from the retirement benefit payment reserve fund as established by K.S.A. 74 4922.
Contributions Member contribution rates are established by state law, and are paid by the employee according to the provi-sions of Section 414(h) of the Internal Revenue Code. State law provides that the employer contribution rates be determined based on the results of an annual actuarial valuation for each of the three state wide pension groups. The contributions and assets of all groups are deposited in the Kansas Public Employees Retirement Fund established by K.S.A. 74 4921. All of the retirement systems are funded on an actuarial reserve basis.
For fiscal years beginning in 1995, Kansas legislation established statutory limits on increases in contribution rates for KPERS employers, which includes the state and the school employers. Annual increases in the em-ployer contribution rates related to subsequent benefit enhancements are not subject to these limitations. The statutory cap increase over the prior year contribution rate is 1.2% of total payroll.
The actuarially determined employer contribution rate and the statutory contribution rates are as follows:
Actuarial employer rate
Statutory employer capped rate
State employees 8.28 % 13.21 %School employees 14.59 13.21 State/School employees (combined rate) (1) 13.23 13.21 Local government employees 8.89 8.89 Police and Firemen 22.13 22.13 Judges 14.68 14.68
(1) The State/School subgroups are combined into one group for purposes of determining a contribution rate.
Rates shown for KPERS State, School and Judges represent the rates for fiscal year ending June 30. KPERS Local and Police and Firemen rates are calendar year.
Member contribution rates as a percentage of eligible compensation in fiscal year 2019 are 6.00% for Public Employees, 7.15% for Police and Firemen, and 6.00% or 2.00% for Judges.
KANSAS PUBLIC EMPLOYEES RETIREMENT SYSTEMCOST-SHARING MULTIPLE-EMPLOYER DEFINED BENEFIT PENSION PLAN
Notes to Schedules of Employer and Nonemployer Allocations andSchedules of Pension Amounts by Employer and Nonemployer
As of and for the year ended June 30, 2019
83
Basis of Presentation
The schedules of employer and nonemployer allocations and the schedules of pension amounts by employ-er and nonemployer (the Schedules) present amounts that are elements of the financial statements of the System or of its participating employers. Accordingly, they do not purport to be a complete presentation of the financial position or changes in financial position of either the System or its participating employers. The amounts presented in the Schedules were prepared in accordance with the accounting principles generally accepted in the United States of America. Such preparation requires management of the System to make a number of estimates and assumptions relating to the reported amounts. Actual results could differ from those estimates.
Employer and Nonemployer Allocations
Although KPERS administers one cost-sharing multiple-employer defined benefit pension plan, separate (sub) actuarial valuations are prepared to determine the actuarially determined contribution rate by group. Follow-ing this method, the measurement of the collective net pension liability, deferred outflows of resources, de-ferred inflows of resources, and pension expense are determined separately for each of the following groups of the plan:
• State• School• Local• Police and Firemen• Judges
To facilitate the separate (sub) actuarial valuations, the System maintains separate accounts to identify addi-tions, deductions, and fiduciary net position applicable to each group. The allocation percentages presented for each group in the schedule of employer and nonemployer allocations are applied to amounts presented in the schedules of pension amounts by employer and nonemployer. The allocation percentages for each group as of June 30, 2019, are based on the ratio of each employer’s contributions to total employer and nonemploy-er contributions of the group for the fiscal year ended June 30, 2019. The contributions used exclude contri-butions made for prior service, excess benefits and irregular payments. The employer allocation percentages have been rounded for presentation purposes. Therefore, use of these percentages to recalculate individual employer amounts presented in the schedules of pension amounts by employer and nonemployer may result in immaterial differences due to rounding.
The contributions used for determining allocation percentages for the state/school group exclude the $82 million transfer made in July 2018 and the $115 million transfer made in March 2019, both from the state general fund to KPERS for the school group. In addition, of the $194 million receivable set up per Senate Sub for HB 2002 for Fiscal Year 2019 school contributions, $16,543,202 has been classified as an on-behalf contribu-tion. Please reference the table on page 95 of this report, Supplemental Schedule of Nonemployer Contributions – State/School Group (unaudited).
(2)
(3)
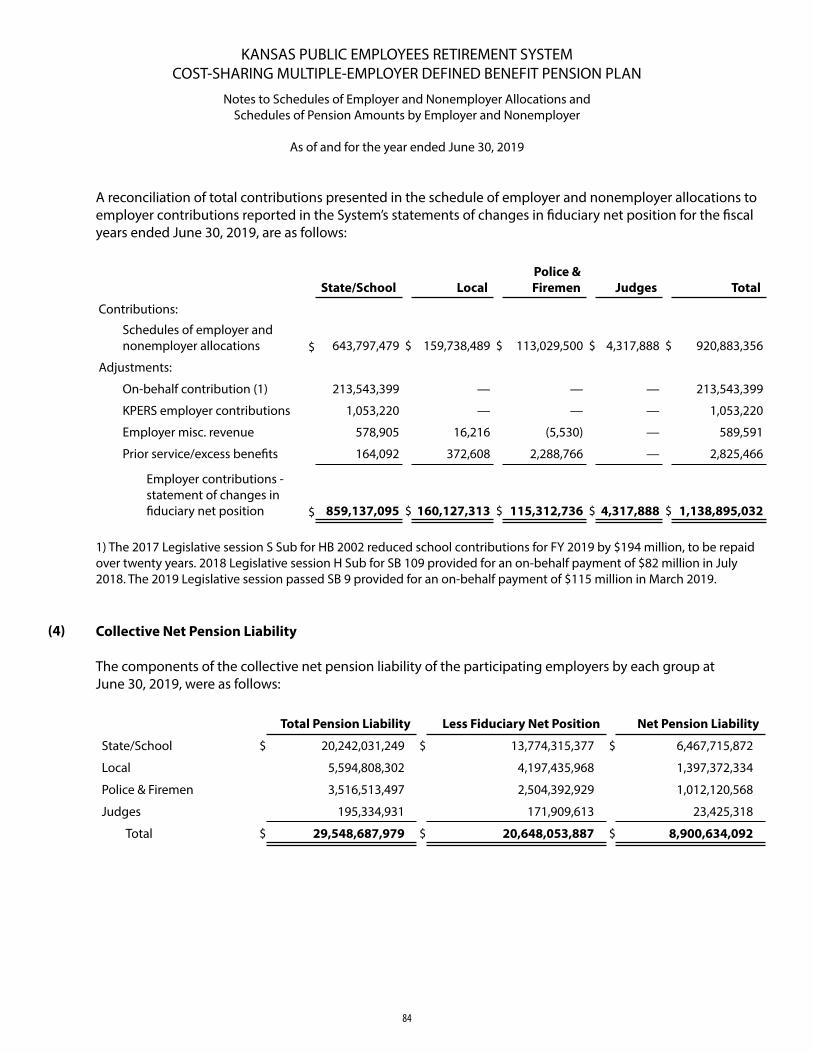
KANSAS PUBLIC EMPLOYEES RETIREMENT SYSTEMCOST-SHARING MULTIPLE-EMPLOYER DEFINED BENEFIT PENSION PLAN
Notes to Schedules of Employer and Nonemployer Allocations andSchedules of Pension Amounts by Employer and Nonemployer
As of and for the year ended June 30, 2019
84
A reconciliation of total contributions presented in the schedule of employer and nonemployer allocations to employer contributions reported in the System’s statements of changes in fiduciary net position for the fiscal years ended June 30, 2019, are as follows:
State/School LocalPolice & Firemen Judges Total
Contributions:
Schedules of employer and nonemployer allocations $ 643,797,479 $ 159,738,489 $ 113,029,500 $ 4,317,888 $ 920,883,356
Adjustments:
On-behalf contribution (1) 213,543,399 — — — 213,543,399
KPERS employer contributions 1,053,220 — — — 1,053,220
Employer misc. revenue 578,905 16,216 (5,530) — 589,591
Prior service/excess benefits 164,092 372,608 2,288,766 — 2,825,466
Employer contributions - statement of changes in fiduciary net position $ 859,137,095 $ 160,127,313 $ 115,312,736 $ 4,317,888 $ 1,138,895,032
1) The 2017 Legislative session S Sub for HB 2002 reduced school contributions for FY 2019 by $194 million, to be repaid over twenty years. 2018 Legislative session H Sub for SB 109 provided for an on-behalf payment of $82 million in July 2018. The 2019 Legislative session passed SB 9 provided for an on-behalf payment of $115 million in March 2019.
Collective Net Pension Liability
The components of the collective net pension liability of the participating employers by each group at June 30, 2019, were as follows:
Total Pension Liability Less Fiduciary Net Position Net Pension Liability
State/School $ 20,242,031,249 $ 13,774,315,377 $ 6,467,715,872
Local 5,594,808,302 4,197,435,968 1,397,372,334
Police & Firemen 3,516,513,497 2,504,392,929 1,012,120,568
Judges 195,334,931 171,909,613 23,425,318
Total $ 29,548,687,979 $ 20,648,053,887 $ 8,900,634,092
(4)
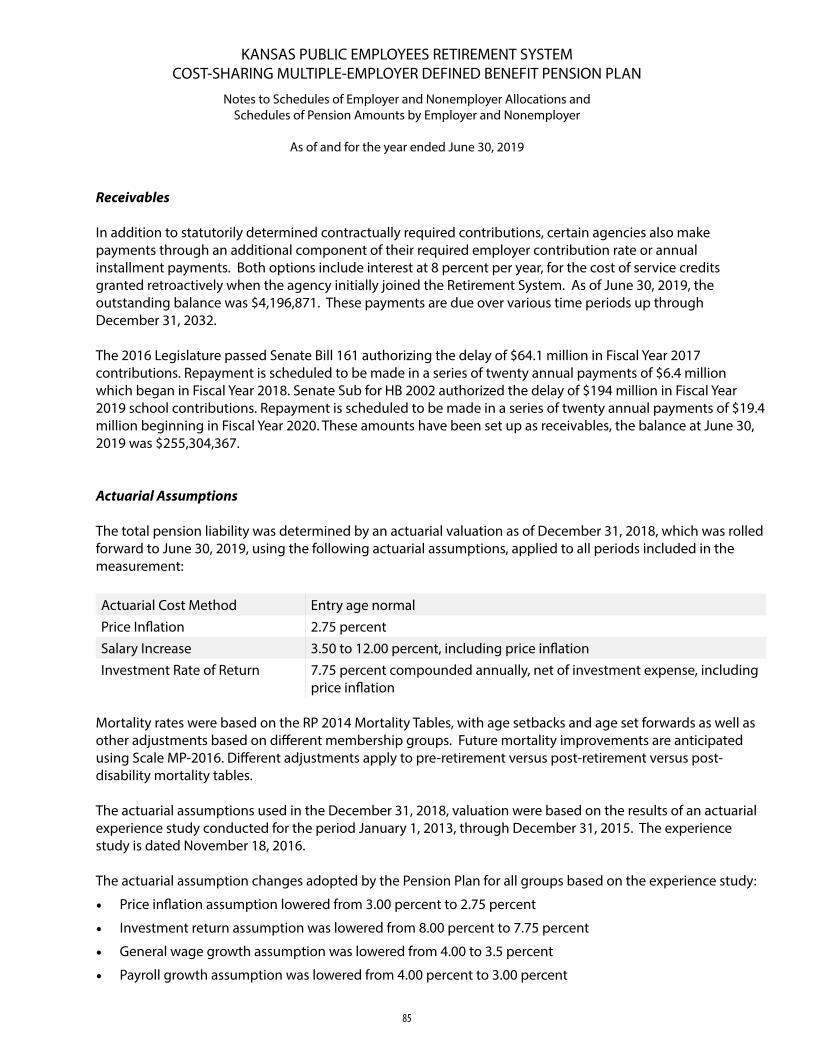
KANSAS PUBLIC EMPLOYEES RETIREMENT SYSTEMCOST-SHARING MULTIPLE-EMPLOYER DEFINED BENEFIT PENSION PLAN
Notes to Schedules of Employer and Nonemployer Allocations andSchedules of Pension Amounts by Employer and Nonemployer
As of and for the year ended June 30, 2019
85
Receivables
In addition to statutorily determined contractually required contributions, certain agencies also make payments through an additional component of their required employer contribution rate or annual installment payments. Both options include interest at 8 percent per year, for the cost of service credits granted retroactively when the agency initially joined the Retirement System. As of June 30, 2019, the outstanding balance was $4,196,871. These payments are due over various time periods up through December 31, 2032.
The 2016 Legislature passed Senate Bill 161 authorizing the delay of $64.1 million in Fiscal Year 2017 contributions. Repayment is scheduled to be made in a series of twenty annual payments of $6.4 million which began in Fiscal Year 2018. Senate Sub for HB 2002 authorized the delay of $194 million in Fiscal Year 2019 school contributions. Repayment is scheduled to be made in a series of twenty annual payments of $19.4 million beginning in Fiscal Year 2020. These amounts have been set up as receivables, the balance at June 30, 2019 was $255,304,367.
Actuarial Assumptions
The total pension liability was determined by an actuarial valuation as of December 31, 2018, which was rolled forward to June 30, 2019, using the following actuarial assumptions, applied to all periods included in the measurement:
Actuarial Cost Method Entry age normalPrice Inflation 2.75 percentSalary Increase 3.50 to 12.00 percent, including price inflationInvestment Rate of Return 7.75 percent compounded annually, net of investment expense, including
price inflation
Mortality rates were based on the RP 2014 Mortality Tables, with age setbacks and age set forwards as well as other adjustments based on different membership groups. Future mortality improvements are anticipated using Scale MP-2016. Different adjustments apply to pre-retirement versus post-retirement versus post-disability mortality tables.
The actuarial assumptions used in the December 31, 2018, valuation were based on the results of an actuarial experience study conducted for the period January 1, 2013, through December 31, 2015. The experience study is dated November 18, 2016.
The actuarial assumption changes adopted by the Pension Plan for all groups based on the experience study:
• Price inflation assumption lowered from 3.00 percent to 2.75 percent
• Investment return assumption was lowered from 8.00 percent to 7.75 percent
• General wage growth assumption was lowered from 4.00 to 3.5 percent
• Payroll growth assumption was lowered from 4.00 percent to 3.00 percent
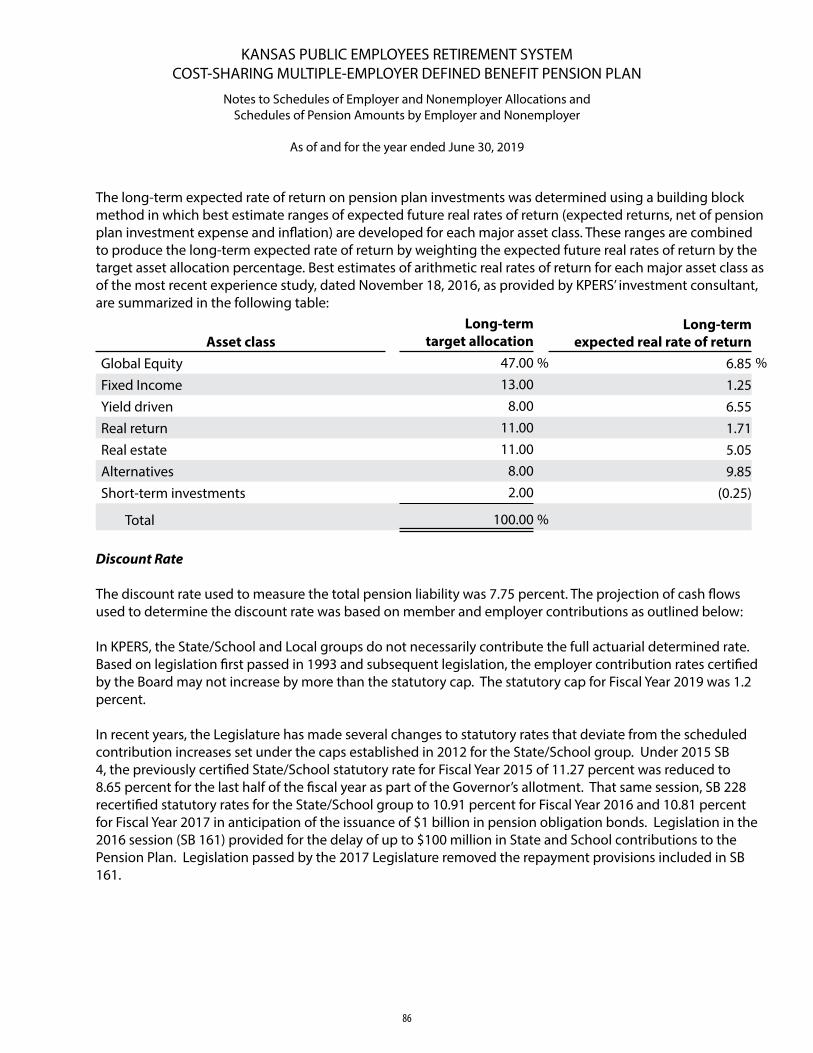
KANSAS PUBLIC EMPLOYEES RETIREMENT SYSTEMCOST-SHARING MULTIPLE-EMPLOYER DEFINED BENEFIT PENSION PLAN
Notes to Schedules of Employer and Nonemployer Allocations andSchedules of Pension Amounts by Employer and Nonemployer
As of and for the year ended June 30, 2019
86
The long-term expected rate of return on pension plan investments was determined using a building blockmethod in which best estimate ranges of expected future real rates of return (expected returns, net of pensionplan investment expense and inflation) are developed for each major asset class. These ranges are combinedto produce the long-term expected rate of return by weighting the expected future real rates of return by thetarget asset allocation percentage. Best estimates of arithmetic real rates of return for each major asset class asof the most recent experience study, dated November 18, 2016, as provided by KPERS’ investment consultant,are summarized in the following table:
Asset classLong-term
target allocationLong-term
expected real rate of returnGlobal Equity 47.00 % 6.85 %
Fixed Income 13.00 1.25Yield driven 8.00 6.55Real return 11.00 1.71Real estate 11.00 5.05Alternatives 8.00 9.85Short-term investments 2.00 (0.25)
Total 100.00 %
Discount Rate
The discount rate used to measure the total pension liability was 7.75 percent. The projection of cash flows used to determine the discount rate was based on member and employer contributions as outlined below:
In KPERS, the State/School and Local groups do not necessarily contribute the full actuarial determined rate. Based on legislation first passed in 1993 and subsequent legislation, the employer contribution rates certified by the Board may not increase by more than the statutory cap. The statutory cap for Fiscal Year 2019 was 1.2 percent.
In recent years, the Legislature has made several changes to statutory rates that deviate from the scheduled contribution increases set under the caps established in 2012 for the State/School group. Under 2015 SB 4, the previously certified State/School statutory rate for Fiscal Year 2015 of 11.27 percent was reduced to 8.65 percent for the last half of the fiscal year as part of the Governor’s allotment. That same session, SB 228 recertified statutory rates for the State/School group to 10.91 percent for Fiscal Year 2016 and 10.81 percent for Fiscal Year 2017 in anticipation of the issuance of $1 billion in pension obligation bonds. Legislation in the 2016 session (SB 161) provided for the delay of up to $100 million in State and School contributions to the Pension Plan. Legislation passed by the 2017 Legislature removed the repayment provisions included in SB 161.
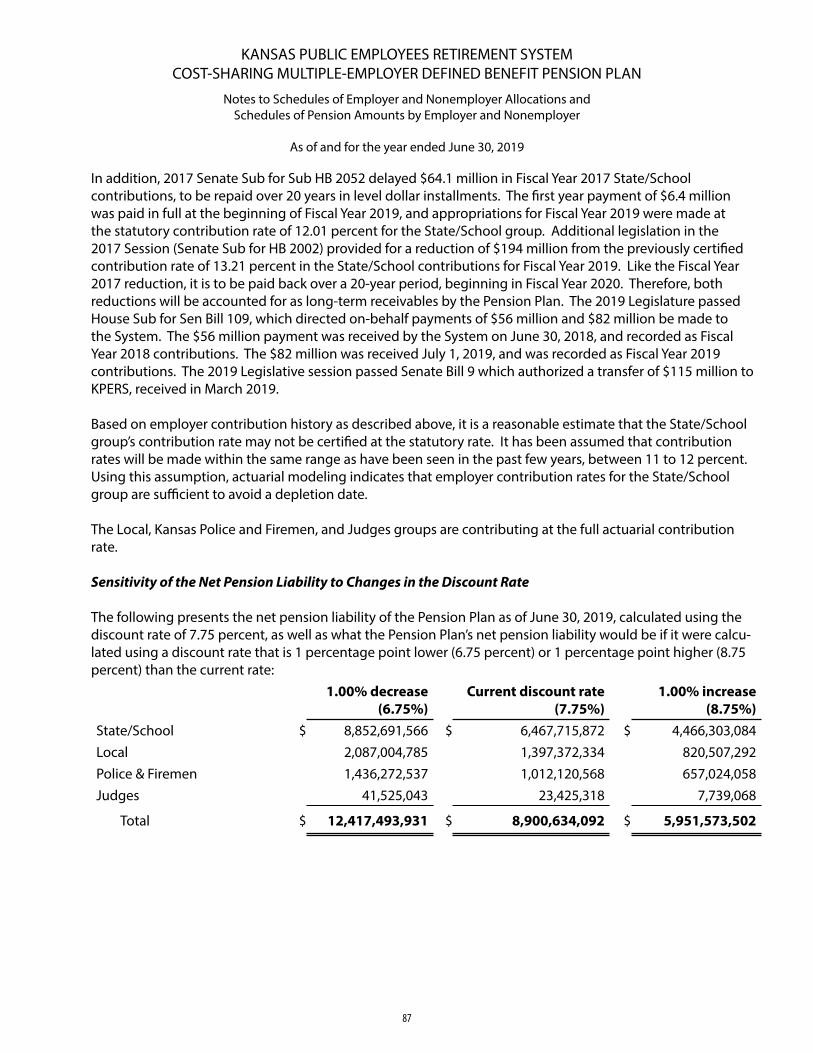
KANSAS PUBLIC EMPLOYEES RETIREMENT SYSTEMCOST-SHARING MULTIPLE-EMPLOYER DEFINED BENEFIT PENSION PLAN
Notes to Schedules of Employer and Nonemployer Allocations andSchedules of Pension Amounts by Employer and Nonemployer
As of and for the year ended June 30, 2019
87
In addition, 2017 Senate Sub for Sub HB 2052 delayed $64.1 million in Fiscal Year 2017 State/School contributions, to be repaid over 20 years in level dollar installments. The first year payment of $6.4 million was paid in full at the beginning of Fiscal Year 2019, and appropriations for Fiscal Year 2019 were made at the statutory contribution rate of 12.01 percent for the State/School group. Additional legislation in the 2017 Session (Senate Sub for HB 2002) provided for a reduction of $194 million from the previously certified contribution rate of 13.21 percent in the State/School contributions for Fiscal Year 2019. Like the Fiscal Year 2017 reduction, it is to be paid back over a 20-year period, beginning in Fiscal Year 2020. Therefore, both reductions will be accounted for as long-term receivables by the Pension Plan. The 2019 Legislature passed House Sub for Sen Bill 109, which directed on-behalf payments of $56 million and $82 million be made to the System. The $56 million payment was received by the System on June 30, 2018, and recorded as Fiscal Year 2018 contributions. The $82 million was received July 1, 2019, and was recorded as Fiscal Year 2019 contributions. The 2019 Legislative session passed Senate Bill 9 which authorized a transfer of $115 million to KPERS, received in March 2019.
Based on employer contribution history as described above, it is a reasonable estimate that the State/School group’s contribution rate may not be certified at the statutory rate. It has been assumed that contribution rates will be made within the same range as have been seen in the past few years, between 11 to 12 percent. Using this assumption, actuarial modeling indicates that employer contribution rates for the State/School group are sufficient to avoid a depletion date.
The Local, Kansas Police and Firemen, and Judges groups are contributing at the full actuarial contribution rate.
Sensitivity of the Net Pension Liability to Changes in the Discount Rate
The following presents the net pension liability of the Pension Plan as of June 30, 2019, calculated using the discount rate of 7.75 percent, as well as what the Pension Plan’s net pension liability would be if it were calcu-lated using a discount rate that is 1 percentage point lower (6.75 percent) or 1 percentage point higher (8.75 percent) than the current rate:
1.00% decrease (6.75%)
Current discount rate (7.75%)
1.00% increase (8.75%)
State/School $ 8,852,691,566 $ 6,467,715,872 $ 4,466,303,084 Local 2,087,004,785 1,397,372,334 820,507,292 Police & Firemen 1,436,272,537 1,012,120,568 657,024,058 Judges 41,525,043 23,425,318 7,739,068
Total $ 12,417,493,931 $ 8,900,634,092 $ 5,951,573,502
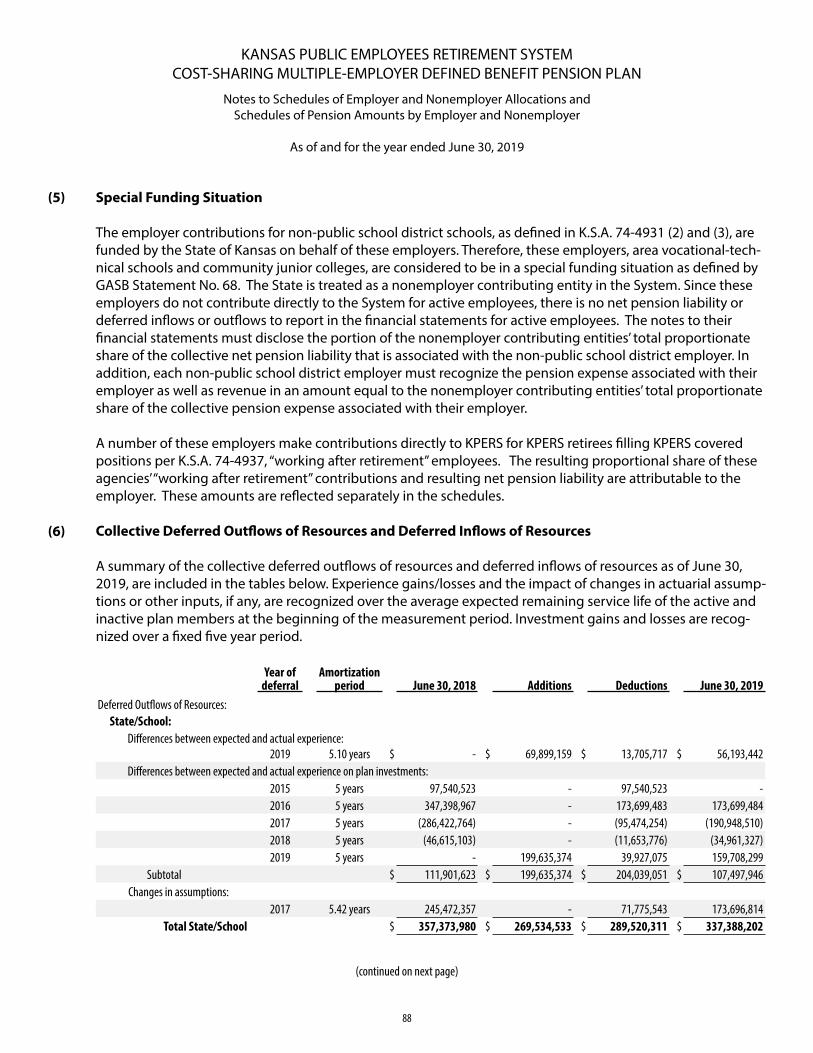
KANSAS PUBLIC EMPLOYEES RETIREMENT SYSTEMCOST-SHARING MULTIPLE-EMPLOYER DEFINED BENEFIT PENSION PLAN
Notes to Schedules of Employer and Nonemployer Allocations andSchedules of Pension Amounts by Employer and Nonemployer
As of and for the year ended June 30, 2019
88
(6)
Special Funding Situation
The employer contributions for non-public school district schools, as defined in K.S.A. 74-4931 (2) and (3), are funded by the State of Kansas on behalf of these employers. Therefore, these employers, area vocational-tech-nical schools and community junior colleges, are considered to be in a special funding situation as defined by GASB Statement No. 68. The State is treated as a nonemployer contributing entity in the System. Since these employers do not contribute directly to the System for active employees, there is no net pension liability or deferred inflows or outflows to report in the financial statements for active employees. The notes to their financial statements must disclose the portion of the nonemployer contributing entities’ total proportionate share of the collective net pension liability that is associated with the non-public school district employer. In addition, each non-public school district employer must recognize the pension expense associated with their employer as well as revenue in an amount equal to the nonemployer contributing entities’ total proportionate share of the collective pension expense associated with their employer.
A number of these employers make contributions directly to KPERS for KPERS retirees filling KPERS covered positions per K.S.A. 74-4937, “working after retirement” employees. The resulting proportional share of these agencies’ “working after retirement” contributions and resulting net pension liability are attributable to the employer. These amounts are reflected separately in the schedules.
Collective Deferred Outflows of Resources and Deferred Inflows of Resources
A summary of the collective deferred outflows of resources and deferred inflows of resources as of June 30, 2019, are included in the tables below. Experience gains/losses and the impact of changes in actuarial assump-tions or other inputs, if any, are recognized over the average expected remaining service life of the active and inactive plan members at the beginning of the measurement period. Investment gains and losses are recog-nized over a fixed five year period.
Year of deferral
Amortization period June 30, 2018 Additions Deductions June 30, 2019
Deferred Outflows of Resources: State/School:
Differences between expected and actual experience:2019 5.10 years $ - $ 69,899,159 $ 13,705,717 $ 56,193,442
Differences between expected and actual experience on plan investments:2015 5 years 97,540,523 - 97,540,523 - 2016 5 years 347,398,967 - 173,699,483 173,699,484 2017 5 years (286,422,764) - (95,474,254) (190,948,510)2018 5 years (46,615,103) - (11,653,776) (34,961,327)2019 5 years - 199,635,374 39,927,075 159,708,299
Subtotal $ 111,901,623 $ 199,635,374 $ 204,039,051 $ 107,497,946 Changes in assumptions:
2017 5.42 years 245,472,357 - 71,775,543 173,696,814 Total State/School $ 357,373,980 $ 269,534,533 $ 289,520,311 $ 337,388,202
(continued on next page)
(5)
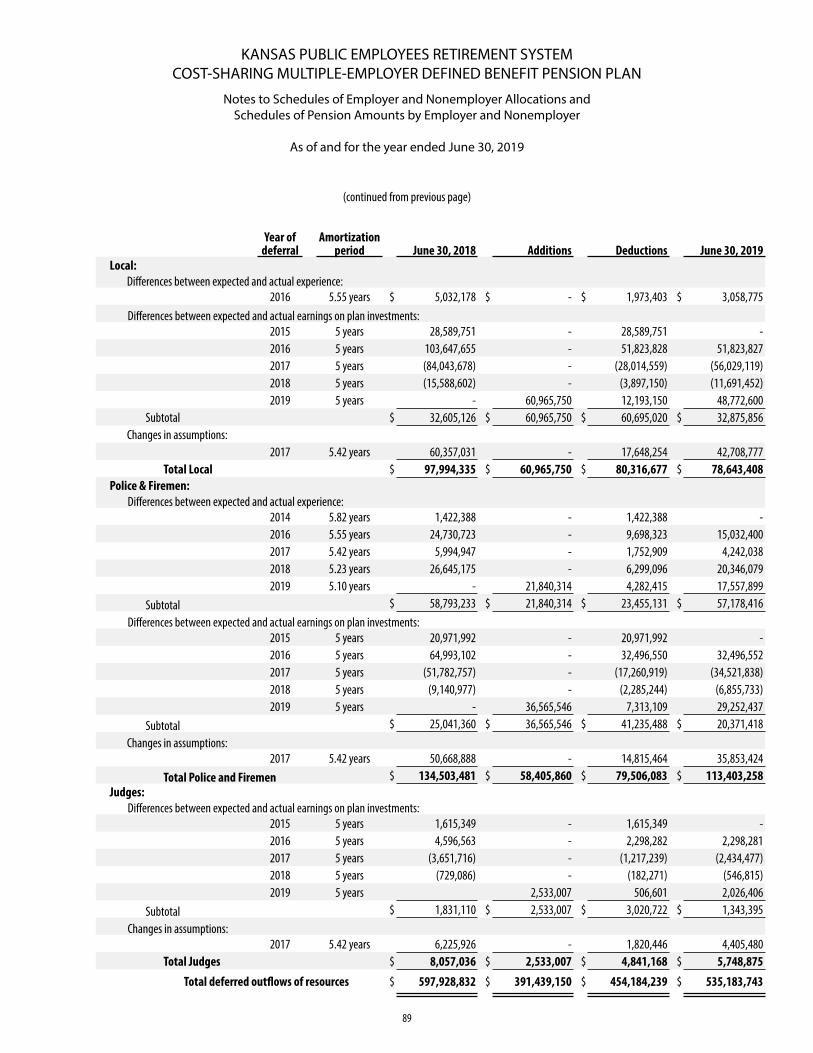
KANSAS PUBLIC EMPLOYEES RETIREMENT SYSTEMCOST-SHARING MULTIPLE-EMPLOYER DEFINED BENEFIT PENSION PLAN
Notes to Schedules of Employer and Nonemployer Allocations andSchedules of Pension Amounts by Employer and Nonemployer
As of and for the year ended June 30, 2019
89
Year of deferral
Amortization period June 30, 2018 Additions Deductions June 30, 2019
Local:Differences between expected and actual experience:
2016 5.55 years $ 5,032,178 $ - $ 1,973,403 $ 3,058,775 Differences between expected and actual earnings on plan investments:
2015 5 years 28,589,751 - 28,589,751 - 2016 5 years 103,647,655 - 51,823,828 51,823,827 2017 5 years (84,043,678) - (28,014,559) (56,029,119)2018 5 years (15,588,602) - (3,897,150) (11,691,452)2019 5 years - 60,965,750 12,193,150 48,772,600
Subtotal $ 32,605,126 $ 60,965,750 $ 60,695,020 $ 32,875,856 Changes in assumptions:
2017 5.42 years 60,357,031 - 17,648,254 42,708,777 Total Local $ 97,994,335 $ 60,965,750 $ 80,316,677 $ 78,643,408
Police & Firemen:Differences between expected and actual experience:
2014 5.82 years 1,422,388 - 1,422,388 - 2016 5.55 years 24,730,723 - 9,698,323 15,032,400 2017 5.42 years 5,994,947 - 1,752,909 4,242,038 2018 5.23 years 26,645,175 - 6,299,096 20,346,079 2019 5.10 years - 21,840,314 4,282,415 17,557,899
Subtotal $ 58,793,233 $ 21,840,314 $ 23,455,131 $ 57,178,416 Differences between expected and actual earnings on plan investments:
2015 5 years 20,971,992 - 20,971,992 - 2016 5 years 64,993,102 - 32,496,550 32,496,552 2017 5 years (51,782,757) - (17,260,919) (34,521,838)2018 5 years (9,140,977) - (2,285,244) (6,855,733)2019 5 years - 36,565,546 7,313,109 29,252,437
Subtotal $ 25,041,360 $ 36,565,546 $ 41,235,488 $ 20,371,418 Changes in assumptions:
2017 5.42 years 50,668,888 - 14,815,464 35,853,424 Total Police and Firemen $ 134,503,481 $ 58,405,860 $ 79,506,083 $ 113,403,258
Judges:Differences between expected and actual earnings on plan investments:
2015 5 years 1,615,349 - 1,615,349 - 2016 5 years 4,596,563 - 2,298,282 2,298,281 2017 5 years (3,651,716) - (1,217,239) (2,434,477)2018 5 years (729,086) - (182,271) (546,815)2019 5 years 2,533,007 506,601 2,026,406
Subtotal $ 1,831,110 $ 2,533,007 $ 3,020,722 $ 1,343,395 Changes in assumptions:
2017 5.42 years 6,225,926 - 1,820,446 4,405,480 Total Judges $ 8,057,036 $ 2,533,007 $ 4,841,168 $ 5,748,875
Total deferred outflows of resources $ 597,928,832 $ 391,439,150 $ 454,184,239 $ 535,183,743
(continued from previous page)
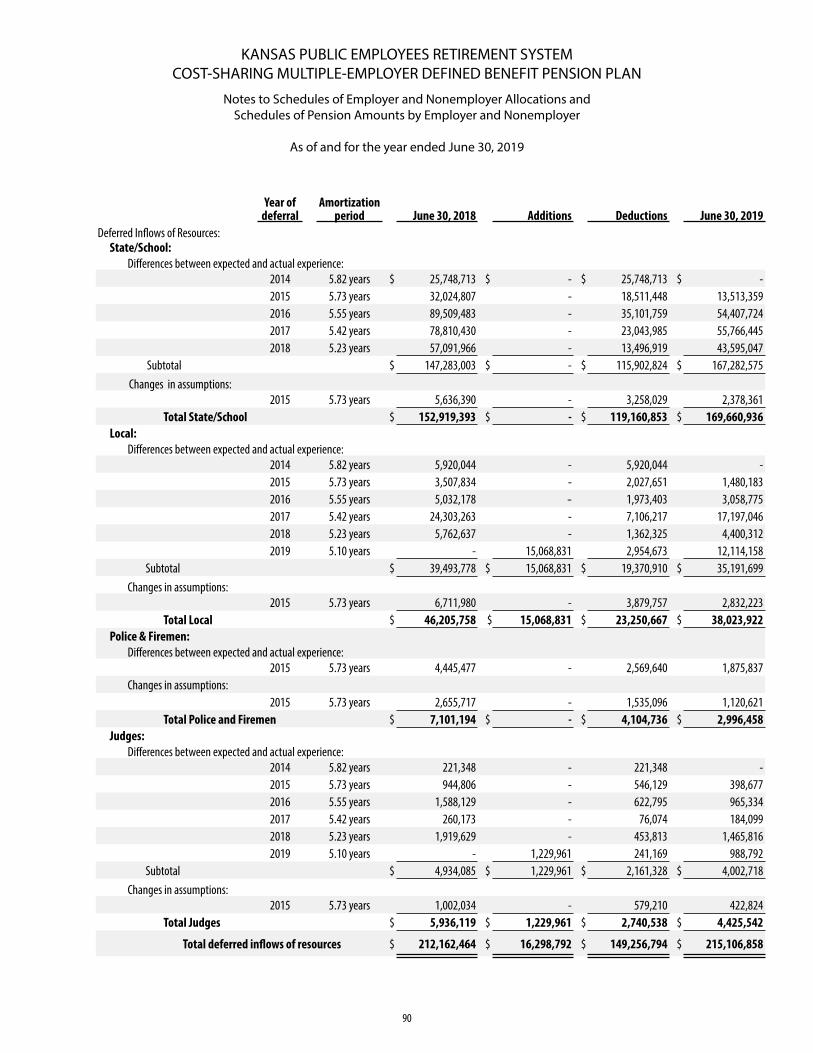
KANSAS PUBLIC EMPLOYEES RETIREMENT SYSTEMCOST-SHARING MULTIPLE-EMPLOYER DEFINED BENEFIT PENSION PLAN
Notes to Schedules of Employer and Nonemployer Allocations andSchedules of Pension Amounts by Employer and Nonemployer
As of and for the year ended June 30, 2019
90
Year of deferral
Amortization period June 30, 2018 Additions Deductions June 30, 2019
Deferred Inflows of Resources: State/School:
Differences between expected and actual experience:2014 5.82 years $ 25,748,713 $ - $ 25,748,713 $ - 2015 5.73 years 32,024,807 - 18,511,448 13,513,359 2016 5.55 years 89,509,483 - 35,101,759 54,407,724 2017 5.42 years 78,810,430 - 23,043,985 55,766,445 2018 5.23 years 57,091,966 - 13,496,919 43,595,047
Subtotal $ 147,283,003 $ - $ 115,902,824 $ 167,282,575 Changes in assumptions:
2015 5.73 years 5,636,390 - 3,258,029 2,378,361 Total State/School $ 152,919,393 $ - $ 119,160,853 $ 169,660,936
Local:Differences between expected and actual experience:
2014 5.82 years 5,920,044 - 5,920,044 - 2015 5.73 years 3,507,834 - 2,027,651 1,480,183 2016 5.55 years 5,032,178 - 1,973,403 3,058,775 2017 5.42 years 24,303,263 - 7,106,217 17,197,046 2018 5.23 years 5,762,637 - 1,362,325 4,400,312 2019 5.10 years - 15,068,831 2,954,673 12,114,158
Subtotal $ 39,493,778 $ 15,068,831 $ 19,370,910 $ 35,191,699 Changes in assumptions:
2015 5.73 years 6,711,980 - 3,879,757 2,832,223 Total Local $ 46,205,758 $ 15,068,831 $ 23,250,667 $ 38,023,922
Police & Firemen:Differences between expected and actual experience:
2015 5.73 years 4,445,477 - 2,569,640 1,875,837 Changes in assumptions:
2015 5.73 years 2,655,717 - 1,535,096 1,120,621 Total Police and Firemen $ 7,101,194 $ - $ 4,104,736 $ 2,996,458
Judges:Differences between expected and actual experience:
2014 5.82 years 221,348 - 221,348 - 2015 5.73 years 944,806 - 546,129 398,677 2016 5.55 years 1,588,129 - 622,795 965,334 2017 5.42 years 260,173 - 76,074 184,099 2018 5.23 years 1,919,629 - 453,813 1,465,816 2019 5.10 years - 1,229,961 241,169 988,792
Subtotal $ 4,934,085 $ 1,229,961 $ 2,161,328 $ 4,002,718 Changes in assumptions:
2015 5.73 years 1,002,034 - 579,210 422,824 Total Judges $ 5,936,119 $ 1,229,961 $ 2,740,538 $ 4,425,542
Total deferred inflows of resources $ 212,162,464 $ 16,298,792 $ 149,256,794 $ 215,106,858
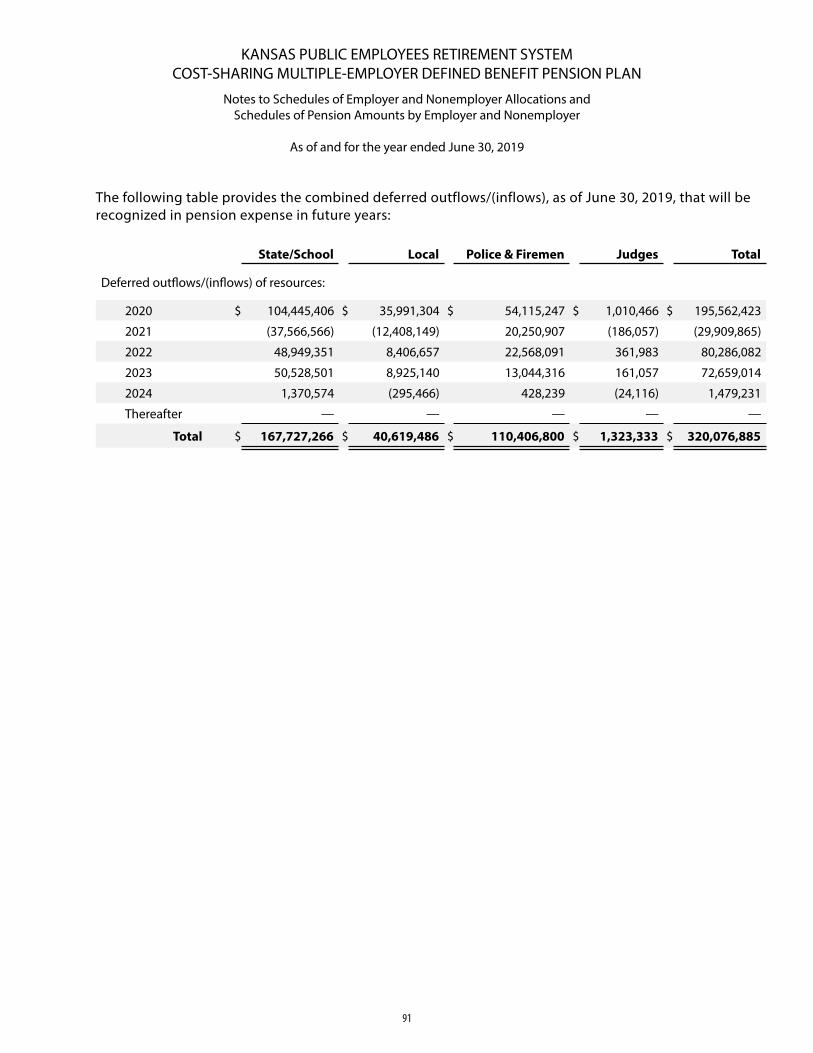
KANSAS PUBLIC EMPLOYEES RETIREMENT SYSTEMCOST-SHARING MULTIPLE-EMPLOYER DEFINED BENEFIT PENSION PLAN
Notes to Schedules of Employer and Nonemployer Allocations andSchedules of Pension Amounts by Employer and Nonemployer
As of and for the year ended June 30, 2019
91
The following table provides the combined deferred outflows/(inflows), as of June 30, 2019, that will be recognized in pension expense in future years:
State/School Local Police & Firemen Judges Total
Deferred outflows/(inflows) of resources:
2020 $ 104,445,406 $ 35,991,304 $ 54,115,247 $ 1,010,466 $ 195,562,423
2021 (37,566,566) (12,408,149) 20,250,907 (186,057) (29,909,865)
2022 48,949,351 8,406,657 22,568,091 361,983 80,286,082
2023 50,528,501 8,925,140 13,044,316 161,057 72,659,014
2024 1,370,574 (295,466) 428,239 (24,116) 1,479,231
Thereafter — — — — —
Total $ 167,727,266 $ 40,619,486 $ 110,406,800 $ 1,323,333 $ 320,076,885
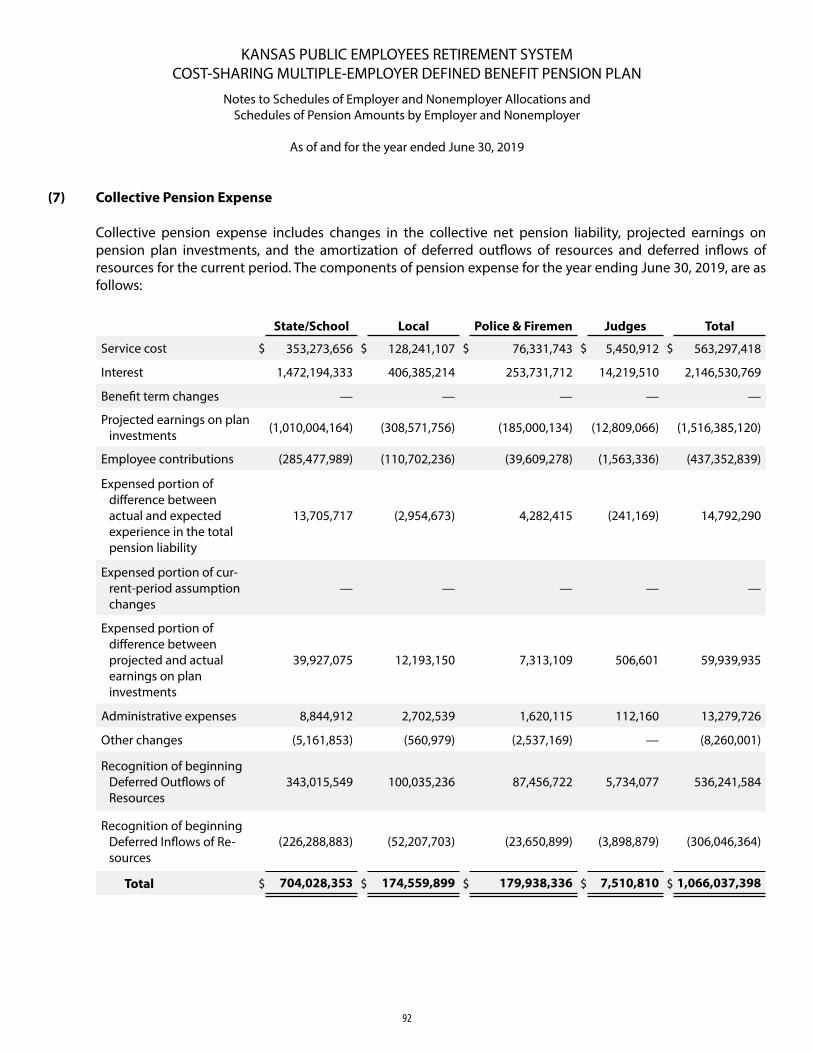
KANSAS PUBLIC EMPLOYEES RETIREMENT SYSTEMCOST-SHARING MULTIPLE-EMPLOYER DEFINED BENEFIT PENSION PLAN
Notes to Schedules of Employer and Nonemployer Allocations andSchedules of Pension Amounts by Employer and Nonemployer
As of and for the year ended June 30, 2019
92
State/School Local Police & Firemen Judges Total
Service cost $ 353,273,656 $ 128,241,107 $ 76,331,743 $ 5,450,912 $ 563,297,418
Interest 1,472,194,333 406,385,214 253,731,712 14,219,510 2,146,530,769
Benefit term changes — — — — —
Projected earnings on plan investments (1,010,004,164) (308,571,756) (185,000,134) (12,809,066) (1,516,385,120)
Employee contributions (285,477,989) (110,702,236) (39,609,278) (1,563,336) (437,352,839)
Expensed portion of difference between actual and expected experience in the total pension liability
13,705,717 (2,954,673) 4,282,415 (241,169) 14,792,290
Expensed portion of cur-rent-period assumption changes
— — — — —
Expensed portion of difference between projected and actual earnings on plan investments
39,927,075 12,193,150 7,313,109 506,601 59,939,935
Administrative expenses 8,844,912 2,702,539 1,620,115 112,160 13,279,726
Other changes (5,161,853) (560,979) (2,537,169) — (8,260,001)
Recognition of beginning Deferred Outflows of Resources
343,015,549 100,035,236 87,456,722 5,734,077 536,241,584
Recognition of beginning Deferred Inflows of Re-sources
(226,288,883) (52,207,703) (23,650,899) (3,898,879) (306,046,364)
Total $ 704,028,353 $ 174,559,899 $ 179,938,336 $ 7,510,810 $ 1,066,037,398
Collective Pension Expense
Collective pension expense includes changes in the collective net pension liability, projected earnings on pension plan investments, and the amortization of deferred outflows of resources and deferred inflows of resources for the current period. The components of pension expense for the year ending June 30, 2019, are as follows:
(7)
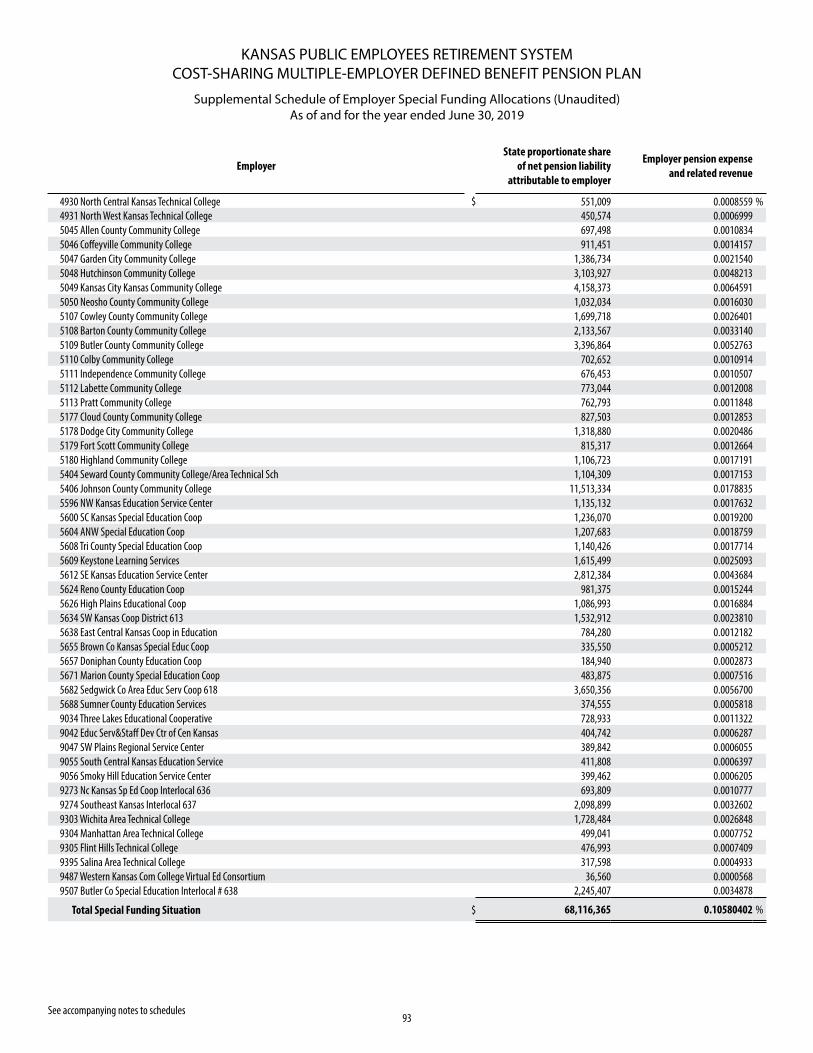
93
KANSAS PUBLIC EMPLOYEES RETIREMENT SYSTEMCOST-SHARING MULTIPLE-EMPLOYER DEFINED BENEFIT PENSION PLAN
Supplemental Schedule of Employer Special Funding Allocations (Unaudited)As of and for the year ended June 30, 2019
EmployerState proportionate share
of net pension liability attributable to employer
Employer pension expense and related revenue
4930 North Central Kansas Technical College $ 551,009 0.0008559 %4931 North West Kansas Technical College 450,574 0.0006999 5045 Allen County Community College 697,498 0.0010834 5046 Coffeyville Community College 911,451 0.0014157 5047 Garden City Community College 1,386,734 0.0021540 5048 Hutchinson Community College 3,103,927 0.0048213 5049 Kansas City Kansas Community College 4,158,373 0.0064591 5050 Neosho County Community College 1,032,034 0.0016030 5107 Cowley County Community College 1,699,718 0.0026401 5108 Barton County Community College 2,133,567 0.0033140 5109 Butler County Community College 3,396,864 0.0052763 5110 Colby Community College 702,652 0.0010914 5111 Independence Community College 676,453 0.0010507 5112 Labette Community College 773,044 0.0012008 5113 Pratt Community College 762,793 0.0011848 5177 Cloud County Community College 827,503 0.0012853 5178 Dodge City Community College 1,318,880 0.0020486 5179 Fort Scott Community College 815,317 0.0012664 5180 Highland Community College 1,106,723 0.0017191 5404 Seward County Community College/Area Technical Sch 1,104,309 0.0017153 5406 Johnson County Community College 11,513,334 0.0178835 5596 NW Kansas Education Service Center 1,135,132 0.0017632 5600 SC Kansas Special Education Coop 1,236,070 0.0019200 5604 ANW Special Education Coop 1,207,683 0.0018759 5608 Tri County Special Education Coop 1,140,426 0.0017714 5609 Keystone Learning Services 1,615,499 0.0025093 5612 SE Kansas Education Service Center 2,812,384 0.0043684 5624 Reno County Education Coop 981,375 0.0015244 5626 High Plains Educational Coop 1,086,993 0.0016884 5634 SW Kansas Coop District 613 1,532,912 0.0023810 5638 East Central Kansas Coop in Education 784,280 0.0012182 5655 Brown Co Kansas Special Educ Coop 335,550 0.0005212 5657 Doniphan County Education Coop 184,940 0.0002873 5671 Marion County Special Education Coop 483,875 0.0007516 5682 Sedgwick Co Area Educ Serv Coop 618 3,650,356 0.0056700 5688 Sumner County Education Services 374,555 0.0005818 9034 Three Lakes Educational Cooperative 728,933 0.0011322 9042 Educ Serv&Staff Dev Ctr of Cen Kansas 404,742 0.0006287 9047 SW Plains Regional Service Center 389,842 0.0006055 9055 South Central Kansas Education Service 411,808 0.0006397 9056 Smoky Hill Education Service Center 399,462 0.0006205 9273 Nc Kansas Sp Ed Coop Interlocal 636 693,809 0.0010777 9274 Southeast Kansas Interlocal 637 2,098,899 0.0032602 9303 Wichita Area Technical College 1,728,484 0.0026848 9304 Manhattan Area Technical College 499,041 0.0007752 9305 Flint Hills Technical College 476,993 0.0007409 9395 Salina Area Technical College 317,598 0.0004933 9487 Western Kansas Com College Virtual Ed Consortium 36,560 0.0000568 9507 Butler Co Special Education Interlocal # 638 2,245,407 0.0034878
Total Special Funding Situation $ 68,116,365 0.10580402 %
See accompanying notes to schedules
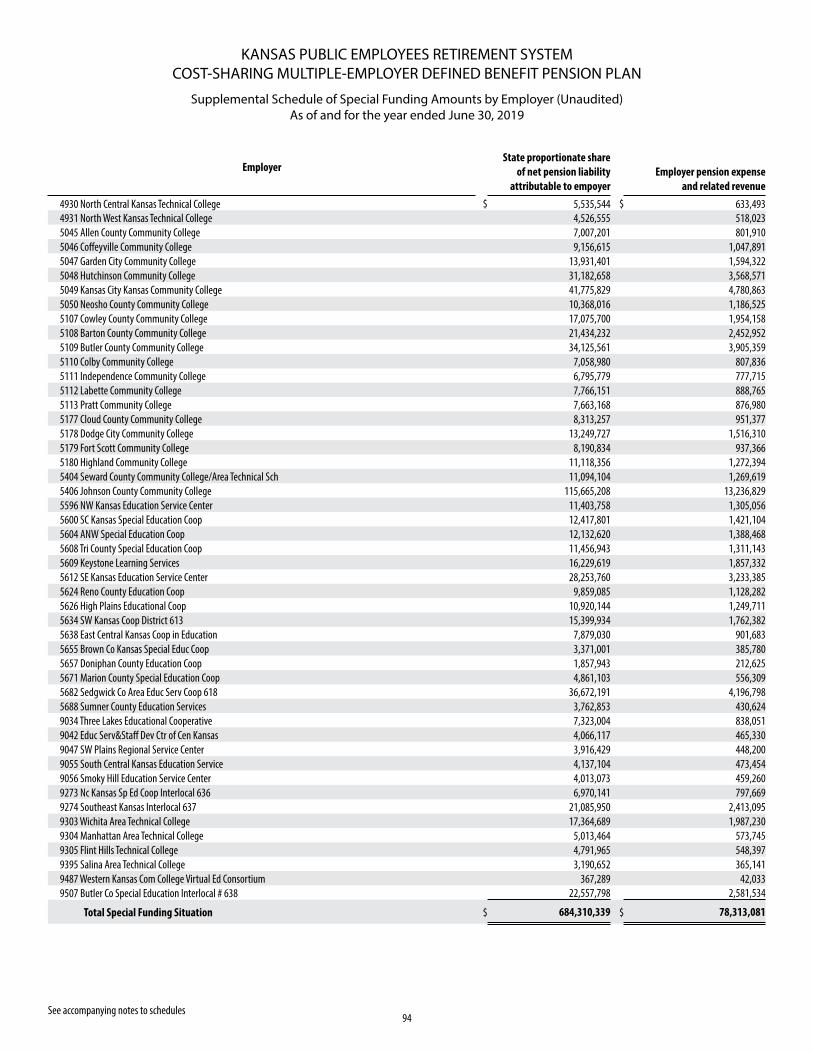
94
KANSAS PUBLIC EMPLOYEES RETIREMENT SYSTEMCOST-SHARING MULTIPLE-EMPLOYER DEFINED BENEFIT PENSION PLAN
Supplemental Schedule of Special Funding Amounts by Employer (Unaudited)As of and for the year ended June 30, 2019
EmployerState proportionate share
of net pension liability attributable to empoyer
Employer pension expense and related revenue
4930 North Central Kansas Technical College $ 5,535,544 $ 633,493 4931 North West Kansas Technical College 4,526,555 518,023 5045 Allen County Community College 7,007,201 801,910 5046 Coffeyville Community College 9,156,615 1,047,891 5047 Garden City Community College 13,931,401 1,594,322 5048 Hutchinson Community College 31,182,658 3,568,571 5049 Kansas City Kansas Community College 41,775,829 4,780,863 5050 Neosho County Community College 10,368,016 1,186,525 5107 Cowley County Community College 17,075,700 1,954,158 5108 Barton County Community College 21,434,232 2,452,952 5109 Butler County Community College 34,125,561 3,905,359 5110 Colby Community College 7,058,980 807,836 5111 Independence Community College 6,795,779 777,715 5112 Labette Community College 7,766,151 888,765 5113 Pratt Community College 7,663,168 876,980 5177 Cloud County Community College 8,313,257 951,377 5178 Dodge City Community College 13,249,727 1,516,310 5179 Fort Scott Community College 8,190,834 937,366 5180 Highland Community College 11,118,356 1,272,394 5404 Seward County Community College/Area Technical Sch 11,094,104 1,269,619 5406 Johnson County Community College 115,665,208 13,236,829 5596 NW Kansas Education Service Center 11,403,758 1,305,056 5600 SC Kansas Special Education Coop 12,417,801 1,421,104 5604 ANW Special Education Coop 12,132,620 1,388,468 5608 Tri County Special Education Coop 11,456,943 1,311,143 5609 Keystone Learning Services 16,229,619 1,857,332 5612 SE Kansas Education Service Center 28,253,760 3,233,385 5624 Reno County Education Coop 9,859,085 1,128,282 5626 High Plains Educational Coop 10,920,144 1,249,711 5634 SW Kansas Coop District 613 15,399,934 1,762,382 5638 East Central Kansas Coop in Education 7,879,030 901,683 5655 Brown Co Kansas Special Educ Coop 3,371,001 385,780 5657 Doniphan County Education Coop 1,857,943 212,625 5671 Marion County Special Education Coop 4,861,103 556,309 5682 Sedgwick Co Area Educ Serv Coop 618 36,672,191 4,196,798 5688 Sumner County Education Services 3,762,853 430,624 9034 Three Lakes Educational Cooperative 7,323,004 838,051 9042 Educ Serv&Staff Dev Ctr of Cen Kansas 4,066,117 465,330 9047 SW Plains Regional Service Center 3,916,429 448,200 9055 South Central Kansas Education Service 4,137,104 473,454 9056 Smoky Hill Education Service Center 4,013,073 459,260 9273 Nc Kansas Sp Ed Coop Interlocal 636 6,970,141 797,669 9274 Southeast Kansas Interlocal 637 21,085,950 2,413,095 9303 Wichita Area Technical College 17,364,689 1,987,230 9304 Manhattan Area Technical College 5,013,464 573,745 9305 Flint Hills Technical College 4,791,965 548,397 9395 Salina Area Technical College 3,190,652 365,141 9487 Western Kansas Com College Virtual Ed Consortium 367,289 42,033 9507 Butler Co Special Education Interlocal # 638 22,557,798 2,581,534
Total Special Funding Situation $ 684,310,339 $ 78,313,081
See accompanying notes to schedules
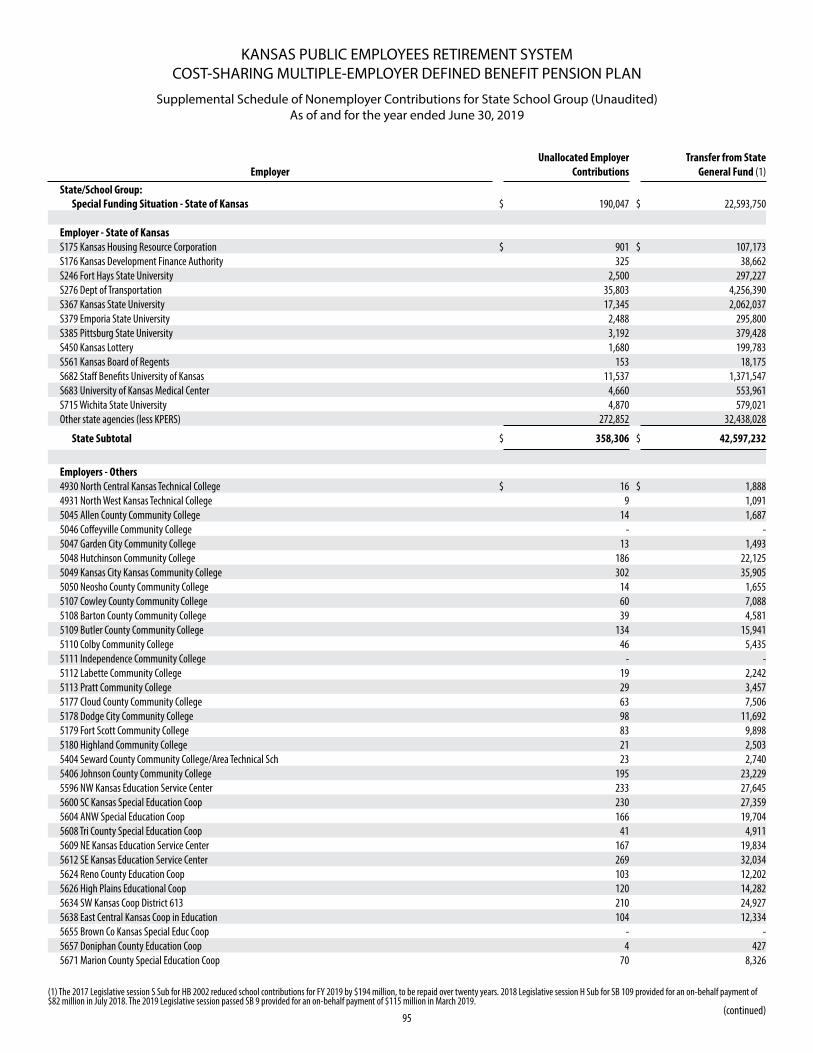
KANSAS PUBLIC EMPLOYEES RETIREMENT SYSTEMCOST-SHARING MULTIPLE-EMPLOYER DEFINED BENEFIT PENSION PLAN
Supplemental Schedule of Nonemployer Contributions for State School Group (Unaudited) As of and for the year ended June 30, 2019
95
EmployerUnallocated Employer
ContributionsTransfer from State
General Fund (1)
State/School Group:Special Funding Situation - State of Kansas $ 190,047 $ 22,593,750
Employer - State of Kansas S175 Kansas Housing Resource Corporation $ 901 $ 107,173 S176 Kansas Development Finance Authority 325 38,662 S246 Fort Hays State University 2,500 297,227 S276 Dept of Transportation 35,803 4,256,390 S367 Kansas State University 17,345 2,062,037 S379 Emporia State University 2,488 295,800 S385 Pittsburg State University 3,192 379,428 S450 Kansas Lottery 1,680 199,783 S561 Kansas Board of Regents 153 18,175 S682 Staff Benefits University of Kansas 11,537 1,371,547 S683 University of Kansas Medical Center 4,660 553,961 S715 Wichita State University 4,870 579,021 Other state agencies (less KPERS) 272,852 32,438,028
State Subtotal $ 358,306 $ 42,597,232
Employers - Others4930 North Central Kansas Technical College $ 16 $ 1,888 4931 North West Kansas Technical College 9 1,091 5045 Allen County Community College 14 1,687 5046 Coffeyville Community College - - 5047 Garden City Community College 13 1,493 5048 Hutchinson Community College 186 22,125 5049 Kansas City Kansas Community College 302 35,905 5050 Neosho County Community College 14 1,655 5107 Cowley County Community College 60 7,088 5108 Barton County Community College 39 4,581 5109 Butler County Community College 134 15,941 5110 Colby Community College 46 5,435 5111 Independence Community College - - 5112 Labette Community College 19 2,242 5113 Pratt Community College 29 3,457 5177 Cloud County Community College 63 7,506 5178 Dodge City Community College 98 11,692 5179 Fort Scott Community College 83 9,898 5180 Highland Community College 21 2,503 5404 Seward County Community College/Area Technical Sch 23 2,740 5406 Johnson County Community College 195 23,229 5596 NW Kansas Education Service Center 233 27,645 5600 SC Kansas Special Education Coop 230 27,359 5604 ANW Special Education Coop 166 19,704 5608 Tri County Special Education Coop 41 4,911 5609 NE Kansas Education Service Center 167 19,834 5612 SE Kansas Education Service Center 269 32,034 5624 Reno County Education Coop 103 12,202 5626 High Plains Educational Coop 120 14,282 5634 SW Kansas Coop District 613 210 24,927 5638 East Central Kansas Coop in Education 104 12,334 5655 Brown Co Kansas Special Educ Coop - - 5657 Doniphan County Education Coop 4 427 5671 Marion County Special Education Coop 70 8,326
(continued)
(1) The 2017 Legislative session S Sub for HB 2002 reduced school contributions for FY 2019 by $194 million, to be repaid over twenty years. 2018 Legislative session H Sub for SB 109 provided for an on-behalf payment of $82 million in July 2018. The 2019 Legislative session passed SB 9 provided for an on-behalf payment of $115 million in March 2019.
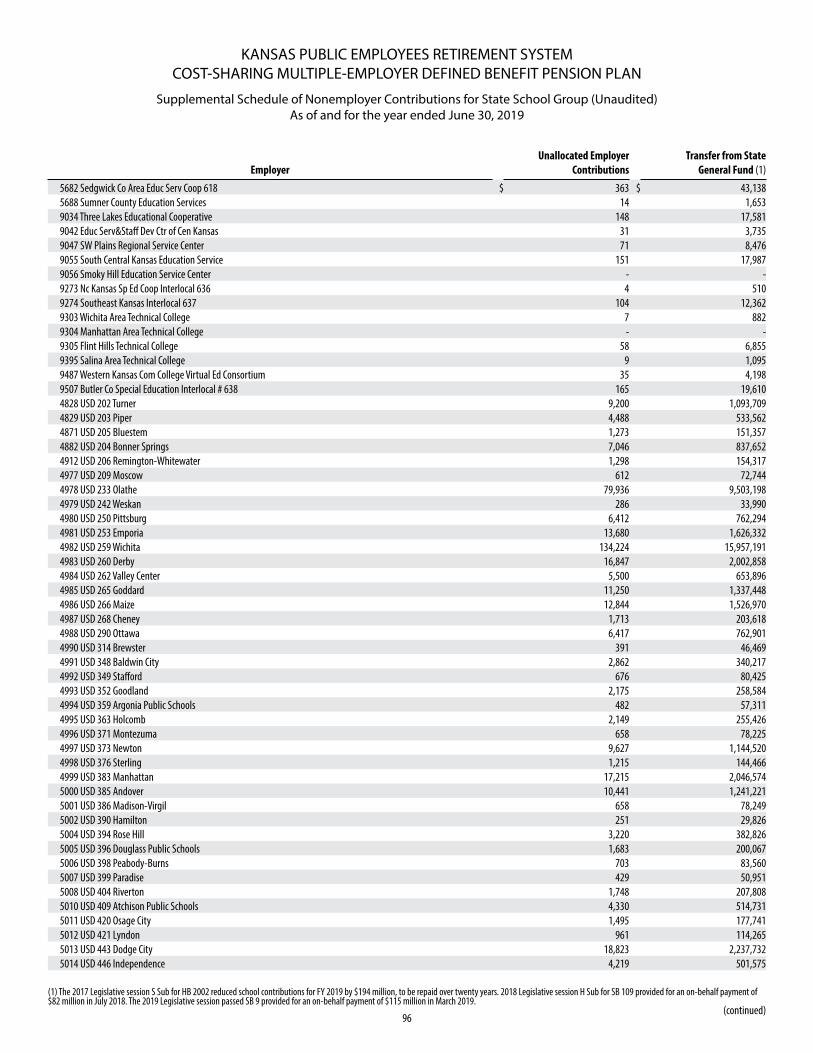
KANSAS PUBLIC EMPLOYEES RETIREMENT SYSTEMCOST-SHARING MULTIPLE-EMPLOYER DEFINED BENEFIT PENSION PLAN
Supplemental Schedule of Nonemployer Contributions for State School Group (Unaudited) As of and for the year ended June 30, 2019
96
EmployerUnallocated Employer
ContributionsTransfer from State
General Fund (1)
5682 Sedgwick Co Area Educ Serv Coop 618 $ 363 $ 43,138 5688 Sumner County Education Services 14 1,653 9034 Three Lakes Educational Cooperative 148 17,581 9042 Educ Serv&Staff Dev Ctr of Cen Kansas 31 3,735 9047 SW Plains Regional Service Center 71 8,476 9055 South Central Kansas Education Service 151 17,987 9056 Smoky Hill Education Service Center - - 9273 Nc Kansas Sp Ed Coop Interlocal 636 4 510 9274 Southeast Kansas Interlocal 637 104 12,362 9303 Wichita Area Technical College 7 882 9304 Manhattan Area Technical College - - 9305 Flint Hills Technical College 58 6,855 9395 Salina Area Technical College 9 1,095 9487 Western Kansas Com College Virtual Ed Consortium 35 4,198 9507 Butler Co Special Education Interlocal # 638 165 19,610 4828 USD 202 Turner 9,200 1,093,709 4829 USD 203 Piper 4,488 533,562 4871 USD 205 Bluestem 1,273 151,357 4882 USD 204 Bonner Springs 7,046 837,652 4912 USD 206 Remington-Whitewater 1,298 154,317 4977 USD 209 Moscow 612 72,744 4978 USD 233 Olathe 79,936 9,503,198 4979 USD 242 Weskan 286 33,990 4980 USD 250 Pittsburg 6,412 762,294 4981 USD 253 Emporia 13,680 1,626,332 4982 USD 259 Wichita 134,224 15,957,191 4983 USD 260 Derby 16,847 2,002,858 4984 USD 262 Valley Center 5,500 653,896 4985 USD 265 Goddard 11,250 1,337,448 4986 USD 266 Maize 12,844 1,526,970 4987 USD 268 Cheney 1,713 203,618 4988 USD 290 Ottawa 6,417 762,901 4990 USD 314 Brewster 391 46,469 4991 USD 348 Baldwin City 2,862 340,217 4992 USD 349 Stafford 676 80,425 4993 USD 352 Goodland 2,175 258,584 4994 USD 359 Argonia Public Schools 482 57,311 4995 USD 363 Holcomb 2,149 255,426 4996 USD 371 Montezuma 658 78,225 4997 USD 373 Newton 9,627 1,144,520 4998 USD 376 Sterling 1,215 144,466 4999 USD 383 Manhattan 17,215 2,046,574 5000 USD 385 Andover 10,441 1,241,221 5001 USD 386 Madison-Virgil 658 78,249 5002 USD 390 Hamilton 251 29,826 5004 USD 394 Rose Hill 3,220 382,826 5005 USD 396 Douglass Public Schools 1,683 200,067 5006 USD 398 Peabody-Burns 703 83,560 5007 USD 399 Paradise 429 50,951 5008 USD 404 Riverton 1,748 207,808 5010 USD 409 Atchison Public Schools 4,330 514,731 5011 USD 420 Osage City 1,495 177,741 5012 USD 421 Lyndon 961 114,265 5013 USD 443 Dodge City 18,823 2,237,732 5014 USD 446 Independence 4,219 501,575
(continued)
(1) The 2017 Legislative session S Sub for HB 2002 reduced school contributions for FY 2019 by $194 million, to be repaid over twenty years. 2018 Legislative session H Sub for SB 109 provided for an on-behalf payment of $82 million in July 2018. The 2019 Legislative session passed SB 9 provided for an on-behalf payment of $115 million in March 2019.
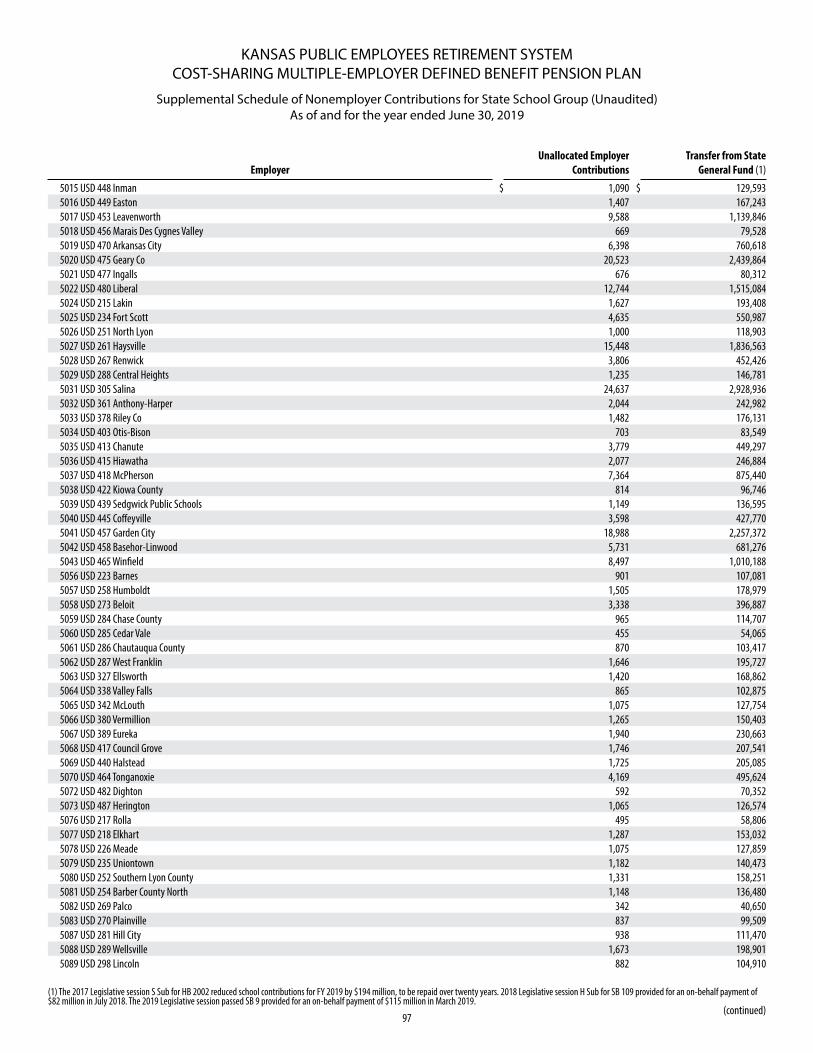
KANSAS PUBLIC EMPLOYEES RETIREMENT SYSTEMCOST-SHARING MULTIPLE-EMPLOYER DEFINED BENEFIT PENSION PLAN
Supplemental Schedule of Nonemployer Contributions for State School Group (Unaudited) As of and for the year ended June 30, 2019
97
EmployerUnallocated Employer
ContributionsTransfer from State
General Fund (1)
5015 USD 448 Inman $ 1,090 $ 129,593 5016 USD 449 Easton 1,407 167,243 5017 USD 453 Leavenworth 9,588 1,139,846 5018 USD 456 Marais Des Cygnes Valley 669 79,528 5019 USD 470 Arkansas City 6,398 760,618 5020 USD 475 Geary Co 20,523 2,439,864 5021 USD 477 Ingalls 676 80,312 5022 USD 480 Liberal 12,744 1,515,084 5024 USD 215 Lakin 1,627 193,408 5025 USD 234 Fort Scott 4,635 550,987 5026 USD 251 North Lyon 1,000 118,903 5027 USD 261 Haysville 15,448 1,836,563 5028 USD 267 Renwick 3,806 452,426 5029 USD 288 Central Heights 1,235 146,781 5031 USD 305 Salina 24,637 2,928,936 5032 USD 361 Anthony-Harper 2,044 242,982 5033 USD 378 Riley Co 1,482 176,131 5034 USD 403 Otis-Bison 703 83,549 5035 USD 413 Chanute 3,779 449,297 5036 USD 415 Hiawatha 2,077 246,884 5037 USD 418 McPherson 7,364 875,440 5038 USD 422 Kiowa County 814 96,746 5039 USD 439 Sedgwick Public Schools 1,149 136,595 5040 USD 445 Coffeyville 3,598 427,770 5041 USD 457 Garden City 18,988 2,257,372 5042 USD 458 Basehor-Linwood 5,731 681,276 5043 USD 465 Winfield 8,497 1,010,188 5056 USD 223 Barnes 901 107,081 5057 USD 258 Humboldt 1,505 178,979 5058 USD 273 Beloit 3,338 396,887 5059 USD 284 Chase County 965 114,707 5060 USD 285 Cedar Vale 455 54,065 5061 USD 286 Chautauqua County 870 103,417 5062 USD 287 West Franklin 1,646 195,727 5063 USD 327 Ellsworth 1,420 168,862 5064 USD 338 Valley Falls 865 102,875 5065 USD 342 McLouth 1,075 127,754 5066 USD 380 Vermillion 1,265 150,403 5067 USD 389 Eureka 1,940 230,663 5068 USD 417 Council Grove 1,746 207,541 5069 USD 440 Halstead 1,725 205,085 5070 USD 464 Tonganoxie 4,169 495,624 5072 USD 482 Dighton 592 70,352 5073 USD 487 Herington 1,065 126,574 5076 USD 217 Rolla 495 58,806 5077 USD 218 Elkhart 1,287 153,032 5078 USD 226 Meade 1,075 127,859 5079 USD 235 Uniontown 1,182 140,473 5080 USD 252 Southern Lyon County 1,331 158,251 5081 USD 254 Barber County North 1,148 136,480 5082 USD 269 Palco 342 40,650 5083 USD 270 Plainville 837 99,509 5087 USD 281 Hill City 938 111,470 5088 USD 289 Wellsville 1,673 198,901 5089 USD 298 Lincoln 882 104,910
(continued)
(1) The 2017 Legislative session S Sub for HB 2002 reduced school contributions for FY 2019 by $194 million, to be repaid over twenty years. 2018 Legislative session H Sub for SB 109 provided for an on-behalf payment of $82 million in July 2018. The 2019 Legislative session passed SB 9 provided for an on-behalf payment of $115 million in March 2019.
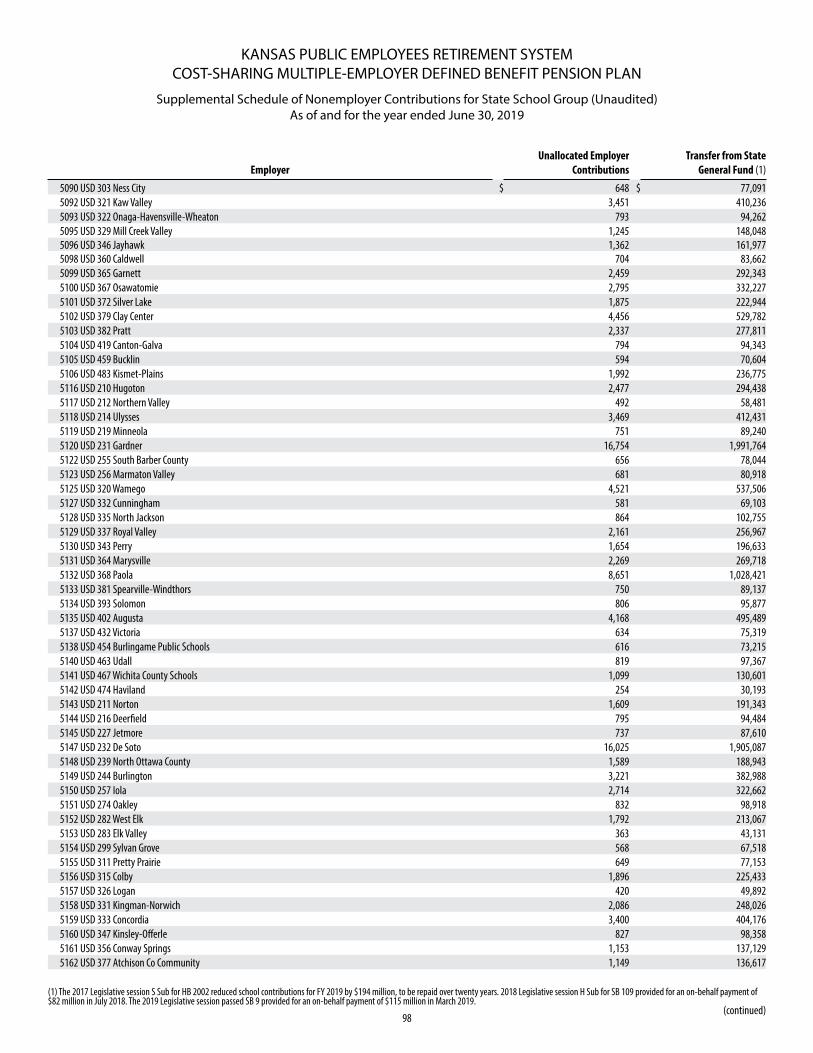
KANSAS PUBLIC EMPLOYEES RETIREMENT SYSTEMCOST-SHARING MULTIPLE-EMPLOYER DEFINED BENEFIT PENSION PLAN
Supplemental Schedule of Nonemployer Contributions for State School Group (Unaudited) As of and for the year ended June 30, 2019
98
EmployerUnallocated Employer
ContributionsTransfer from State
General Fund (1)
5090 USD 303 Ness City $ 648 $ 77,091 5092 USD 321 Kaw Valley 3,451 410,236 5093 USD 322 Onaga-Havensville-Wheaton 793 94,262 5095 USD 329 Mill Creek Valley 1,245 148,048 5096 USD 346 Jayhawk 1,362 161,977 5098 USD 360 Caldwell 704 83,662 5099 USD 365 Garnett 2,459 292,343 5100 USD 367 Osawatomie 2,795 332,227 5101 USD 372 Silver Lake 1,875 222,944 5102 USD 379 Clay Center 4,456 529,782 5103 USD 382 Pratt 2,337 277,811 5104 USD 419 Canton-Galva 794 94,343 5105 USD 459 Bucklin 594 70,604 5106 USD 483 Kismet-Plains 1,992 236,775 5116 USD 210 Hugoton 2,477 294,438 5117 USD 212 Northern Valley 492 58,481 5118 USD 214 Ulysses 3,469 412,431 5119 USD 219 Minneola 751 89,240 5120 USD 231 Gardner 16,754 1,991,764 5122 USD 255 South Barber County 656 78,044 5123 USD 256 Marmaton Valley 681 80,918 5125 USD 320 Wamego 4,521 537,506 5127 USD 332 Cunningham 581 69,103 5128 USD 335 North Jackson 864 102,755 5129 USD 337 Royal Valley 2,161 256,967 5130 USD 343 Perry 1,654 196,633 5131 USD 364 Marysville 2,269 269,718 5132 USD 368 Paola 8,651 1,028,421 5133 USD 381 Spearville-Windthors 750 89,137 5134 USD 393 Solomon 806 95,877 5135 USD 402 Augusta 4,168 495,489 5137 USD 432 Victoria 634 75,319 5138 USD 454 Burlingame Public Schools 616 73,215 5140 USD 463 Udall 819 97,367 5141 USD 467 Wichita County Schools 1,099 130,601 5142 USD 474 Haviland 254 30,193 5143 USD 211 Norton 1,609 191,343 5144 USD 216 Deerfield 795 94,484 5145 USD 227 Jetmore 737 87,610 5147 USD 232 De Soto 16,025 1,905,087 5148 USD 239 North Ottawa County 1,589 188,943 5149 USD 244 Burlington 3,221 382,988 5150 USD 257 Iola 2,714 322,662 5151 USD 274 Oakley 832 98,918 5152 USD 282 West Elk 1,792 213,067 5153 USD 283 Elk Valley 363 43,131 5154 USD 299 Sylvan Grove 568 67,518 5155 USD 311 Pretty Prairie 649 77,153 5156 USD 315 Colby 1,896 225,433 5157 USD 326 Logan 420 49,892 5158 USD 331 Kingman-Norwich 2,086 248,026 5159 USD 333 Concordia 3,400 404,176 5160 USD 347 Kinsley-Offerle 827 98,358 5161 USD 356 Conway Springs 1,153 137,129 5162 USD 377 Atchison Co Community 1,149 136,617
(continued)
(1) The 2017 Legislative session S Sub for HB 2002 reduced school contributions for FY 2019 by $194 million, to be repaid over twenty years. 2018 Legislative session H Sub for SB 109 provided for an on-behalf payment of $82 million in July 2018. The 2019 Legislative session passed SB 9 provided for an on-behalf payment of $115 million in March 2019.
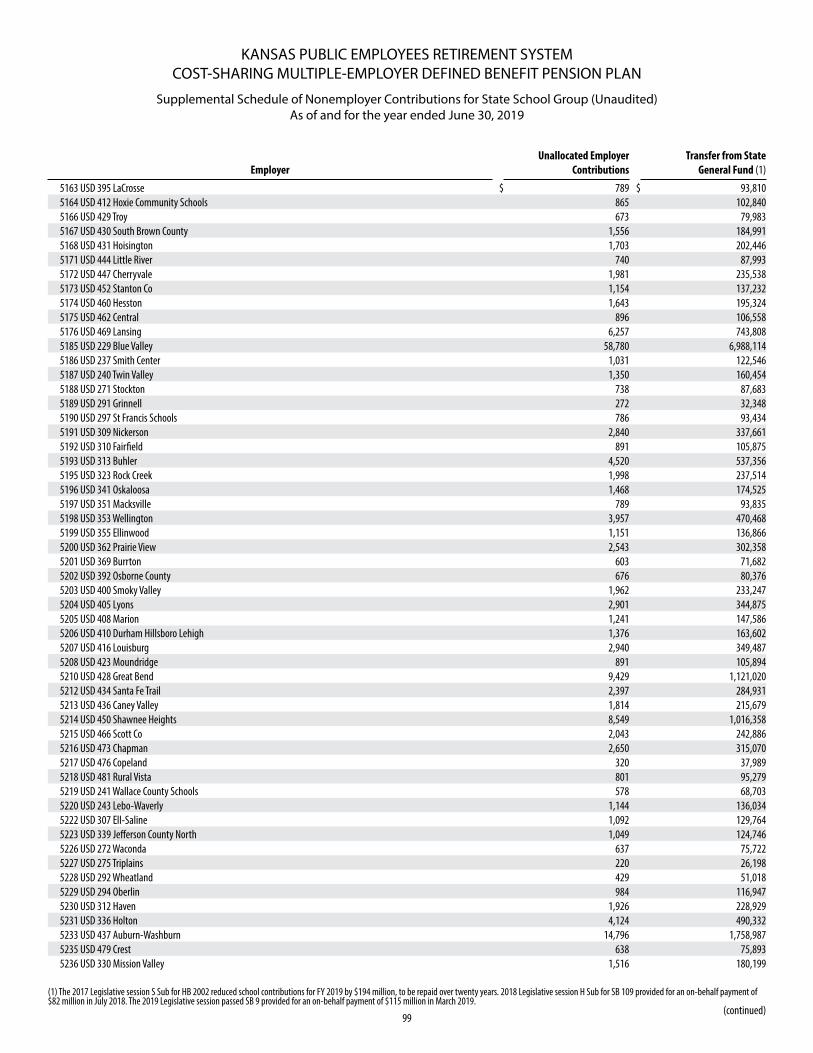
KANSAS PUBLIC EMPLOYEES RETIREMENT SYSTEMCOST-SHARING MULTIPLE-EMPLOYER DEFINED BENEFIT PENSION PLAN
Supplemental Schedule of Nonemployer Contributions for State School Group (Unaudited) As of and for the year ended June 30, 2019
99
EmployerUnallocated Employer
ContributionsTransfer from State
General Fund (1)
5163 USD 395 LaCrosse $ 789 $ 93,810 5164 USD 412 Hoxie Community Schools 865 102,840 5166 USD 429 Troy 673 79,983 5167 USD 430 South Brown County 1,556 184,991 5168 USD 431 Hoisington 1,703 202,446 5171 USD 444 Little River 740 87,993 5172 USD 447 Cherryvale 1,981 235,538 5173 USD 452 Stanton Co 1,154 137,232 5174 USD 460 Hesston 1,643 195,324 5175 USD 462 Central 896 106,558 5176 USD 469 Lansing 6,257 743,808 5185 USD 229 Blue Valley 58,780 6,988,114 5186 USD 237 Smith Center 1,031 122,546 5187 USD 240 Twin Valley 1,350 160,454 5188 USD 271 Stockton 738 87,683 5189 USD 291 Grinnell 272 32,348 5190 USD 297 St Francis Schools 786 93,434 5191 USD 309 Nickerson 2,840 337,661 5192 USD 310 Fairfield 891 105,875 5193 USD 313 Buhler 4,520 537,356 5195 USD 323 Rock Creek 1,998 237,514 5196 USD 341 Oskaloosa 1,468 174,525 5197 USD 351 Macksville 789 93,835 5198 USD 353 Wellington 3,957 470,468 5199 USD 355 Ellinwood 1,151 136,866 5200 USD 362 Prairie View 2,543 302,358 5201 USD 369 Burrton 603 71,682 5202 USD 392 Osborne County 676 80,376 5203 USD 400 Smoky Valley 1,962 233,247 5204 USD 405 Lyons 2,901 344,875 5205 USD 408 Marion 1,241 147,586 5206 USD 410 Durham Hillsboro Lehigh 1,376 163,602 5207 USD 416 Louisburg 2,940 349,487 5208 USD 423 Moundridge 891 105,894 5210 USD 428 Great Bend 9,429 1,121,020 5212 USD 434 Santa Fe Trail 2,397 284,931 5213 USD 436 Caney Valley 1,814 215,679 5214 USD 450 Shawnee Heights 8,549 1,016,358 5215 USD 466 Scott Co 2,043 242,886 5216 USD 473 Chapman 2,650 315,070 5217 USD 476 Copeland 320 37,989 5218 USD 481 Rural Vista 801 95,279 5219 USD 241 Wallace County Schools 578 68,703 5220 USD 243 Lebo-Waverly 1,144 136,034 5222 USD 307 Ell-Saline 1,092 129,764 5223 USD 339 Jefferson County North 1,049 124,746 5226 USD 272 Waconda 637 75,722 5227 USD 275 Triplains 220 26,198 5228 USD 292 Wheatland 429 51,018 5229 USD 294 Oberlin 984 116,947 5230 USD 312 Haven 1,926 228,929 5231 USD 336 Holton 4,124 490,332 5233 USD 437 Auburn-Washburn 14,796 1,758,987 5235 USD 479 Crest 638 75,893 5236 USD 330 Mission Valley 1,516 180,199
(continued)
(1) The 2017 Legislative session S Sub for HB 2002 reduced school contributions for FY 2019 by $194 million, to be repaid over twenty years. 2018 Legislative session H Sub for SB 109 provided for an on-behalf payment of $82 million in July 2018. The 2019 Legislative session passed SB 9 provided for an on-behalf payment of $115 million in March 2019.
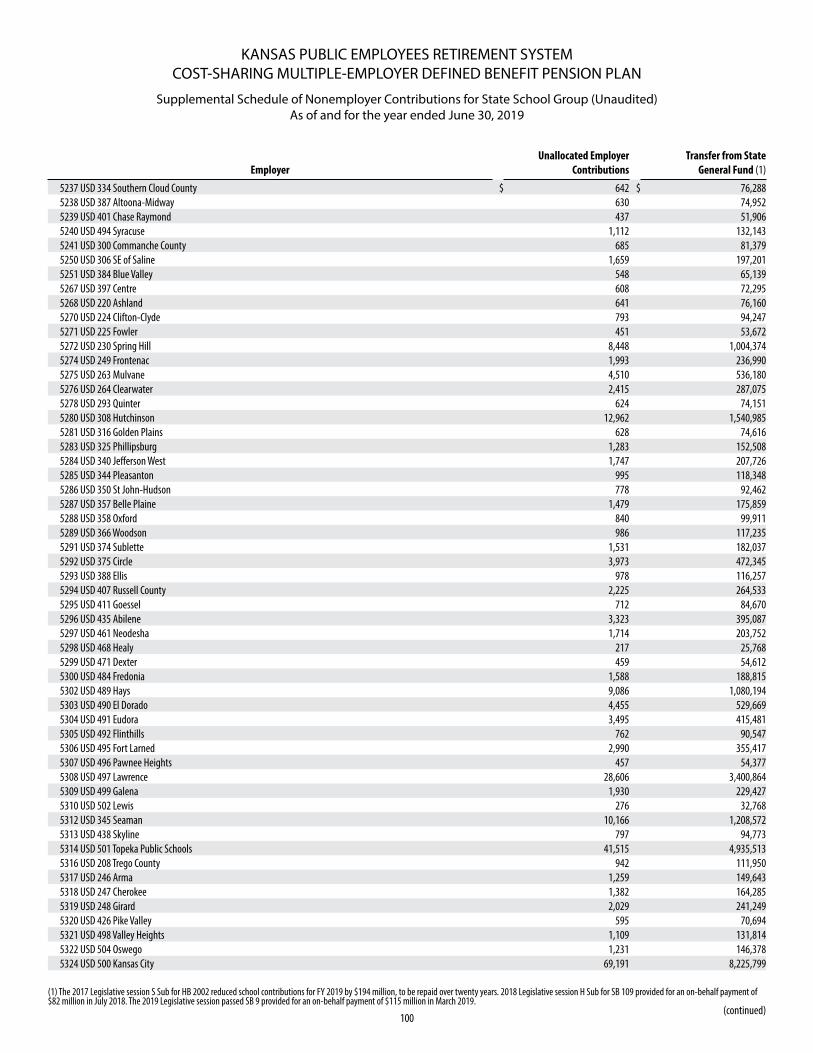
KANSAS PUBLIC EMPLOYEES RETIREMENT SYSTEMCOST-SHARING MULTIPLE-EMPLOYER DEFINED BENEFIT PENSION PLAN
Supplemental Schedule of Nonemployer Contributions for State School Group (Unaudited) As of and for the year ended June 30, 2019
100
EmployerUnallocated Employer
ContributionsTransfer from State
General Fund (1)
5237 USD 334 Southern Cloud County $ 642 $ 76,288 5238 USD 387 Altoona-Midway 630 74,952 5239 USD 401 Chase Raymond 437 51,906 5240 USD 494 Syracuse 1,112 132,143 5241 USD 300 Commanche County 685 81,379 5250 USD 306 SE of Saline 1,659 197,201 5251 USD 384 Blue Valley 548 65,139 5267 USD 397 Centre 608 72,295 5268 USD 220 Ashland 641 76,160 5270 USD 224 Clifton-Clyde 793 94,247 5271 USD 225 Fowler 451 53,672 5272 USD 230 Spring Hill 8,448 1,004,374 5274 USD 249 Frontenac 1,993 236,990 5275 USD 263 Mulvane 4,510 536,180 5276 USD 264 Clearwater 2,415 287,075 5278 USD 293 Quinter 624 74,151 5280 USD 308 Hutchinson 12,962 1,540,985 5281 USD 316 Golden Plains 628 74,616 5283 USD 325 Phillipsburg 1,283 152,508 5284 USD 340 Jefferson West 1,747 207,726 5285 USD 344 Pleasanton 995 118,348 5286 USD 350 St John-Hudson 778 92,462 5287 USD 357 Belle Plaine 1,479 175,859 5288 USD 358 Oxford 840 99,911 5289 USD 366 Woodson 986 117,235 5291 USD 374 Sublette 1,531 182,037 5292 USD 375 Circle 3,973 472,345 5293 USD 388 Ellis 978 116,257 5294 USD 407 Russell County 2,225 264,533 5295 USD 411 Goessel 712 84,670 5296 USD 435 Abilene 3,323 395,087 5297 USD 461 Neodesha 1,714 203,752 5298 USD 468 Healy 217 25,768 5299 USD 471 Dexter 459 54,612 5300 USD 484 Fredonia 1,588 188,815 5302 USD 489 Hays 9,086 1,080,194 5303 USD 490 El Dorado 4,455 529,669 5304 USD 491 Eudora 3,495 415,481 5305 USD 492 Flinthills 762 90,547 5306 USD 495 Fort Larned 2,990 355,417 5307 USD 496 Pawnee Heights 457 54,377 5308 USD 497 Lawrence 28,606 3,400,864 5309 USD 499 Galena 1,930 229,427 5310 USD 502 Lewis 276 32,768 5312 USD 345 Seaman 10,166 1,208,572 5313 USD 438 Skyline 797 94,773 5314 USD 501 Topeka Public Schools 41,515 4,935,513 5316 USD 208 Trego County 942 111,950 5317 USD 246 Arma 1,259 149,643 5318 USD 247 Cherokee 1,382 164,285 5319 USD 248 Girard 2,029 241,249 5320 USD 426 Pike Valley 595 70,694 5321 USD 498 Valley Heights 1,109 131,814 5322 USD 504 Oswego 1,231 146,378 5324 USD 500 Kansas City 69,191 8,225,799
(continued)
(1) The 2017 Legislative session S Sub for HB 2002 reduced school contributions for FY 2019 by $194 million, to be repaid over twenty years. 2018 Legislative session H Sub for SB 109 provided for an on-behalf payment of $82 million in July 2018. The 2019 Legislative session passed SB 9 provided for an on-behalf payment of $115 million in March 2019.
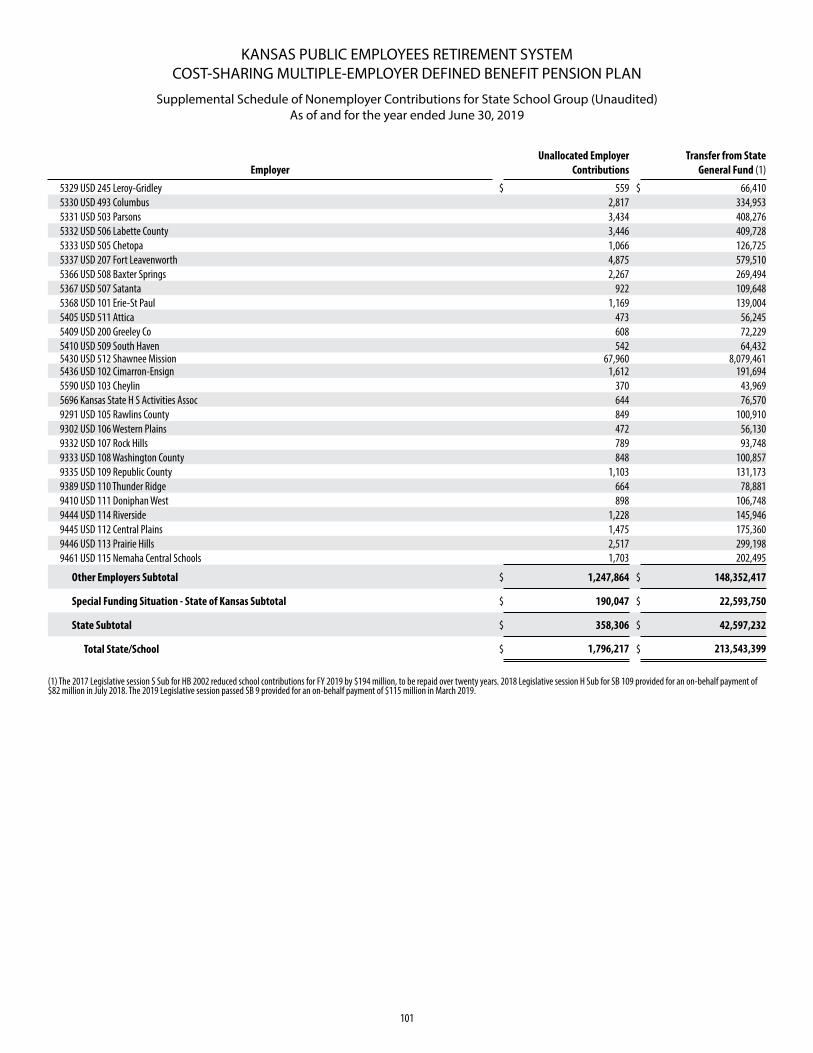
KANSAS PUBLIC EMPLOYEES RETIREMENT SYSTEMCOST-SHARING MULTIPLE-EMPLOYER DEFINED BENEFIT PENSION PLAN
Supplemental Schedule of Nonemployer Contributions for State School Group (Unaudited) As of and for the year ended June 30, 2019
101
EmployerUnallocated Employer
ContributionsTransfer from State
General Fund (1)
5329 USD 245 Leroy-Gridley $ 559 $ 66,410 5330 USD 493 Columbus 2,817 334,953 5331 USD 503 Parsons 3,434 408,276 5332 USD 506 Labette County 3,446 409,728 5333 USD 505 Chetopa 1,066 126,725 5337 USD 207 Fort Leavenworth 4,875 579,510 5366 USD 508 Baxter Springs 2,267 269,494 5367 USD 507 Satanta 922 109,648 5368 USD 101 Erie-St Paul 1,169 139,004 5405 USD 511 Attica 473 56,245 5409 USD 200 Greeley Co 608 72,229 5410 USD 509 South Haven 542 64,432 5430 USD 512 Shawnee Mission 67,960 8,079,461 5436 USD 102 Cimarron-Ensign 1,612 191,694 5590 USD 103 Cheylin 370 43,969 5696 Kansas State H S Activities Assoc 644 76,570 9291 USD 105 Rawlins County 849 100,910 9302 USD 106 Western Plains 472 56,130 9332 USD 107 Rock Hills 789 93,748 9333 USD 108 Washington County 848 100,857 9335 USD 109 Republic County 1,103 131,173 9389 USD 110 Thunder Ridge 664 78,881 9410 USD 111 Doniphan West 898 106,748 9444 USD 114 Riverside 1,228 145,946 9445 USD 112 Central Plains 1,475 175,360 9446 USD 113 Prairie Hills 2,517 299,198 9461 USD 115 Nemaha Central Schools 1,703 202,495
Other Employers Subtotal $ 1,247,864 $ 148,352,417
Special Funding Situation - State of Kansas Subtotal $ 190,047 $ 22,593,750
State Subtotal $ 358,306 $ 42,597,232
Total State/School $ 1,796,217 $ 213,543,399
(1) The 2017 Legislative session S Sub for HB 2002 reduced school contributions for FY 2019 by $194 million, to be repaid over twenty years. 2018 Legislative session H Sub for SB 109 provided for an on-behalf payment of $82 million in July 2018. The 2019 Legislative session passed SB 9 provided for an on-behalf payment of $115 million in March 2019.
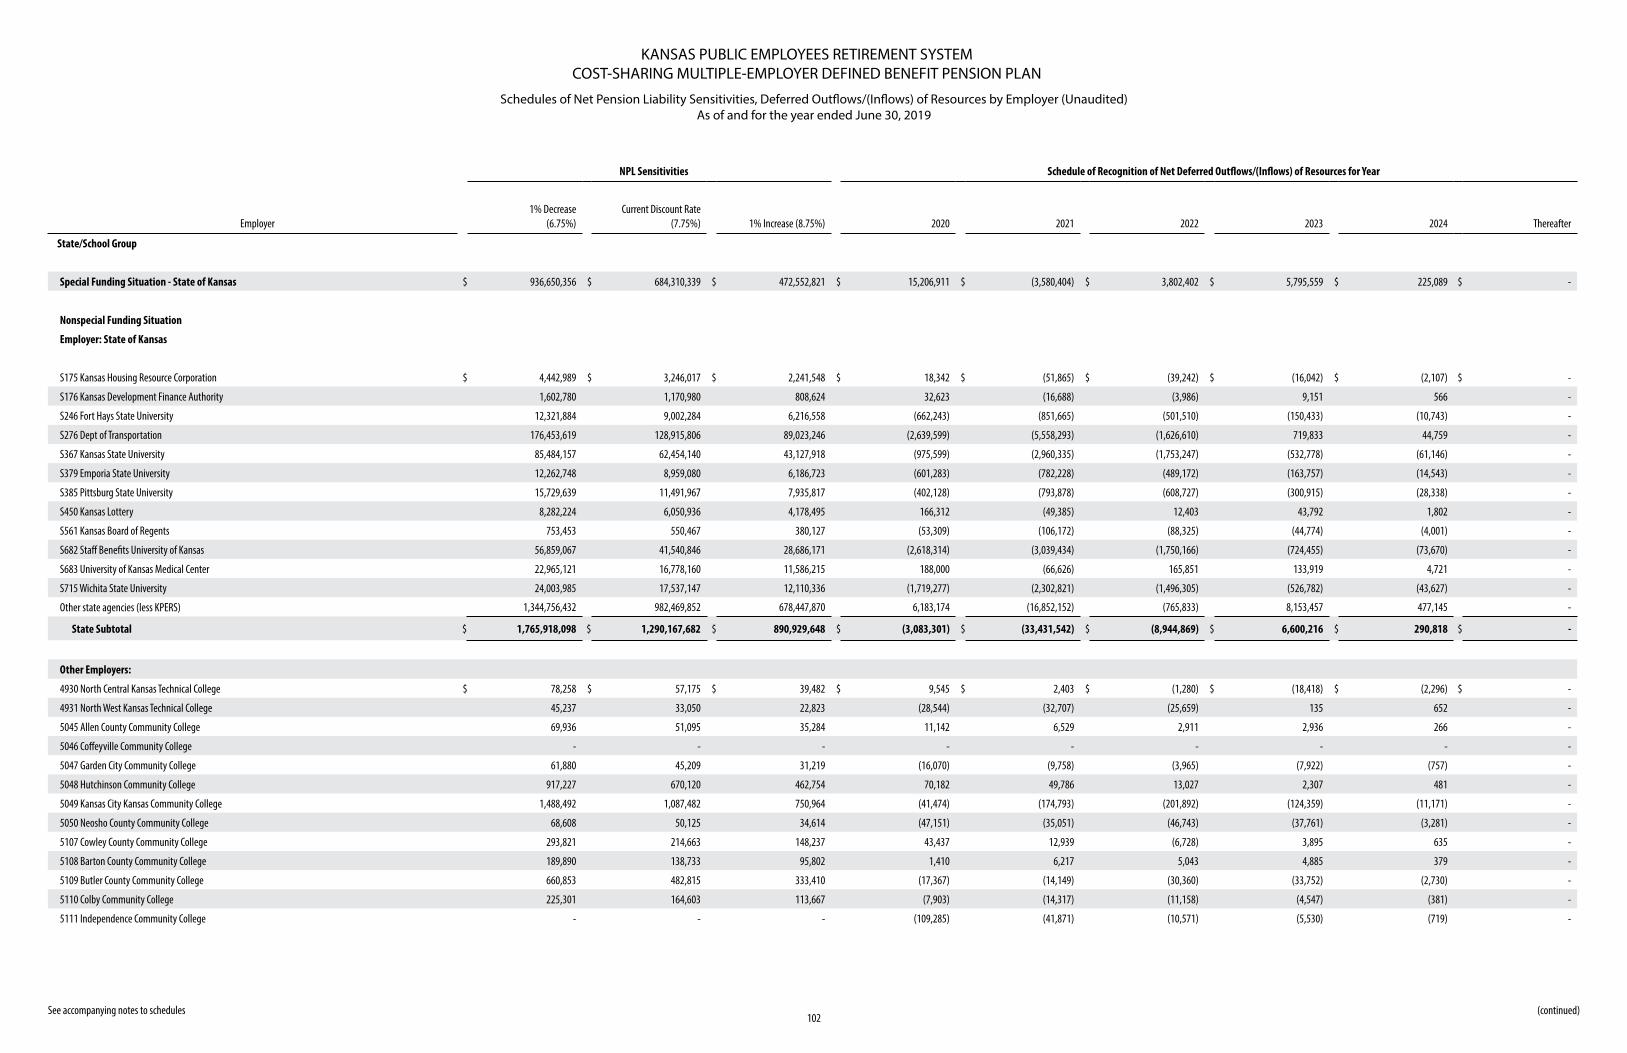
KANSAS PUBLIC EMPLOYEES RETIREMENT SYSTEMCOST-SHARING MULTIPLE-EMPLOYER DEFINED BENEFIT PENSION PLAN
Schedules of Net Pension Liability Sensitivities, Deferred Outflows/(Inflows) of Resources by Employer (Unaudited) As of and for the year ended June 30, 2019
See accompanying notes to schedules102
(continued)
NPL Sensitivities Schedule of Recognition of Net Deferred Outflows/(Inflows) of Resources for Year
Employer1% Decrease
(6.75%)Current Discount Rate
(7.75%) 1% Increase (8.75%) 2020 2021 2022 2023 2024 Thereafter
State/School Group
Special Funding Situation - State of Kansas $ 936,650,356 $ 684,310,339 $ 472,552,821 $ 15,206,911 $ (3,580,404) $ 3,802,402 $ 5,795,559 $ 225,089 $ -
Nonspecial Funding Situation
Employer: State of Kansas
S175 Kansas Housing Resource Corporation $ 4,442,989 $ 3,246,017 $ 2,241,548 $ 18,342 $ (51,865) $ (39,242) $ (16,042) $ (2,107) $ -
S176 Kansas Development Finance Authority 1,602,780 1,170,980 808,624 32,623 (16,688) (3,986) 9,151 566 -
S246 Fort Hays State University 12,321,884 9,002,284 6,216,558 (662,243) (851,665) (501,510) (150,433) (10,743) -
S276 Dept of Transportation 176,453,619 128,915,806 89,023,246 (2,639,599) (5,558,293) (1,626,610) 719,833 44,759 -
S367 Kansas State University 85,484,157 62,454,140 43,127,918 (975,599) (2,960,335) (1,753,247) (532,778) (61,146) -
S379 Emporia State University 12,262,748 8,959,080 6,186,723 (601,283) (782,228) (489,172) (163,757) (14,543) -
S385 Pittsburg State University 15,729,639 11,491,967 7,935,817 (402,128) (793,878) (608,727) (300,915) (28,338) -
S450 Kansas Lottery 8,282,224 6,050,936 4,178,495 166,312 (49,385) 12,403 43,792 1,802 -
S561 Kansas Board of Regents 753,453 550,467 380,127 (53,309) (106,172) (88,325) (44,774) (4,001) -
S682 Staff Benefits University of Kansas 56,859,067 41,540,846 28,686,171 (2,618,314) (3,039,434) (1,750,166) (724,455) (73,670) -
S683 University of Kansas Medical Center 22,965,121 16,778,160 11,586,215 188,000 (66,626) 165,851 133,919 4,721 -
S715 Wichita State University 24,003,985 17,537,147 12,110,336 (1,719,277) (2,302,821) (1,496,305) (526,782) (43,627) -
Other state agencies (less KPERS) 1,344,756,432 982,469,852 678,447,870 6,183,174 (16,852,152) (765,833) 8,153,457 477,145 -
State Subtotal $ 1,765,918,098 $ 1,290,167,682 $ 890,929,648 $ (3,083,301) $ (33,431,542) $ (8,944,869) $ 6,600,216 $ 290,818 $ -
Other Employers:
4930 North Central Kansas Technical College $ 78,258 $ 57,175 $ 39,482 $ 9,545 $ 2,403 $ (1,280) $ (18,418) $ (2,296) $ -
4931 North West Kansas Technical College 45,237 33,050 22,823 (28,544) (32,707) (25,659) 135 652 -
5045 Allen County Community College 69,936 51,095 35,284 11,142 6,529 2,911 2,936 266 -
5046 Coffeyville Community College - - - - - - - - -
5047 Garden City Community College 61,880 45,209 31,219 (16,070) (9,758) (3,965) (7,922) (757) -
5048 Hutchinson Community College 917,227 670,120 462,754 70,182 49,786 13,027 2,307 481 -
5049 Kansas City Kansas Community College 1,488,492 1,087,482 750,964 (41,474) (174,793) (201,892) (124,359) (11,171) -
5050 Neosho County Community College 68,608 50,125 34,614 (47,151) (35,051) (46,743) (37,761) (3,281) -
5107 Cowley County Community College 293,821 214,663 148,237 43,437 12,939 (6,728) 3,895 635 -
5108 Barton County Community College 189,890 138,733 95,802 1,410 6,217 5,043 4,885 379 -
5109 Butler County Community College 660,853 482,815 333,410 (17,367) (14,149) (30,360) (33,752) (2,730) -
5110 Colby Community College 225,301 164,603 113,667 (7,903) (14,317) (11,158) (4,547) (381) -
5111 Independence Community College - - - (109,285) (41,871) (10,571) (5,530) (719) -
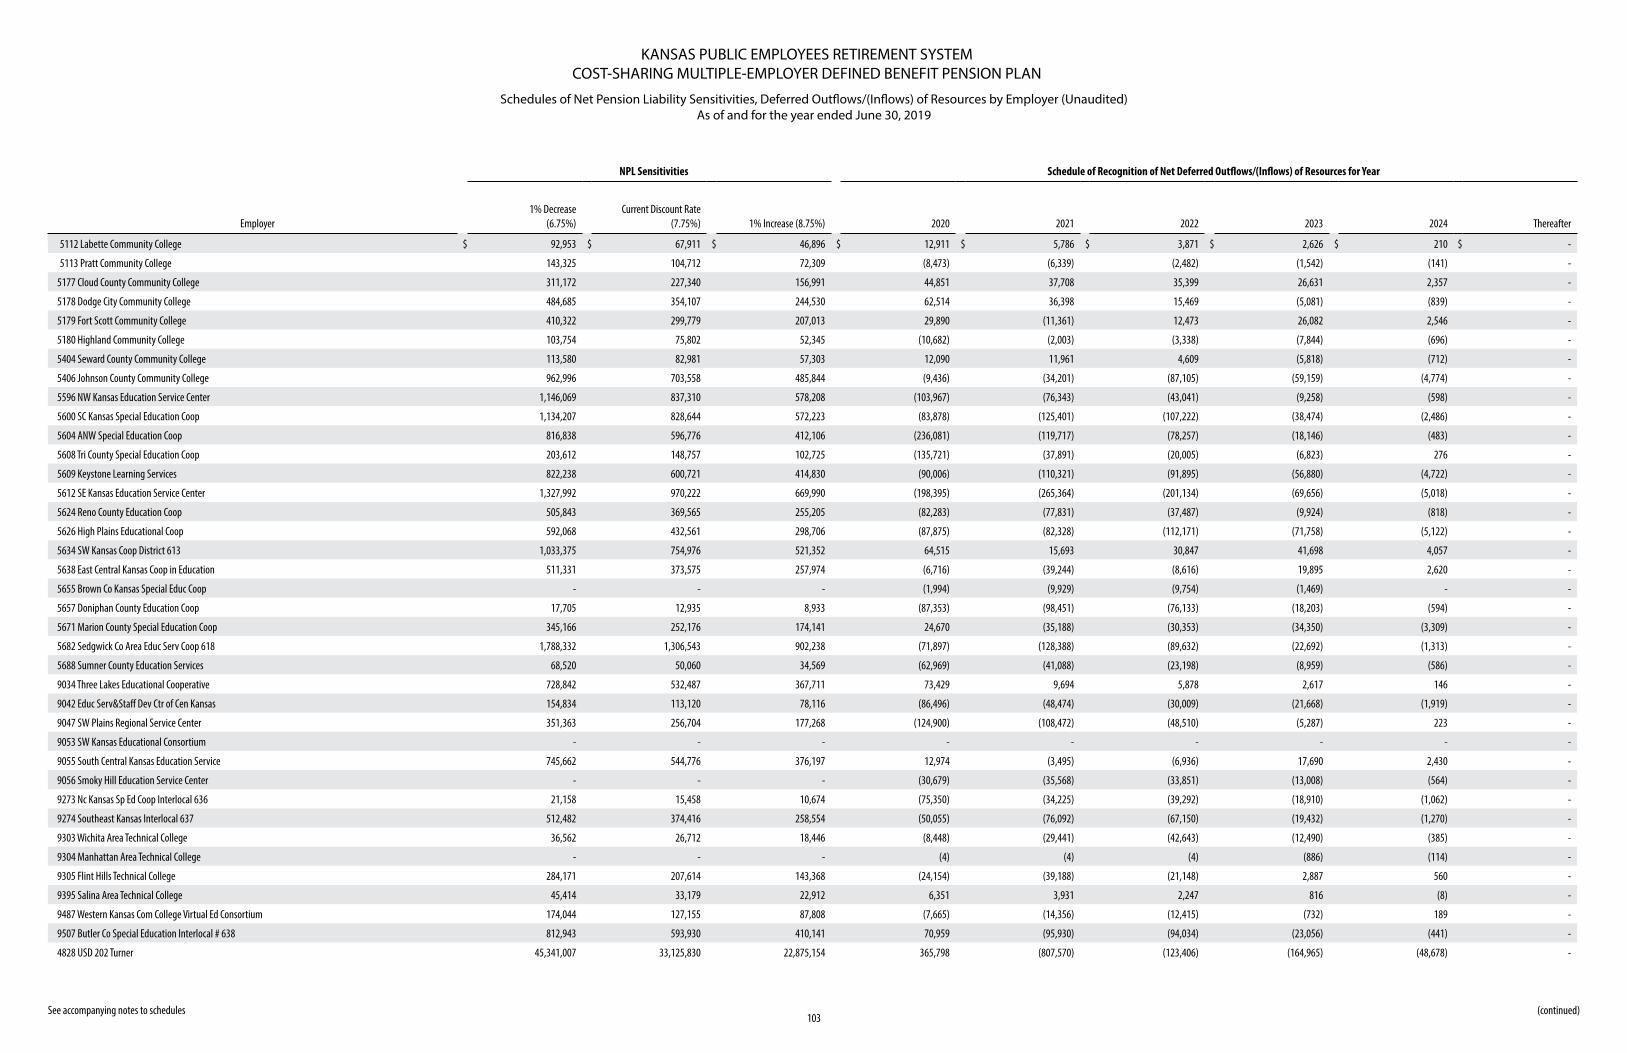
KANSAS PUBLIC EMPLOYEES RETIREMENT SYSTEMCOST-SHARING MULTIPLE-EMPLOYER DEFINED BENEFIT PENSION PLAN
Schedules of Net Pension Liability Sensitivities, Deferred Outflows/(Inflows) of Resources by Employer (Unaudited) As of and for the year ended June 30, 2019
See accompanying notes to schedules103
NPL Sensitivities Schedule of Recognition of Net Deferred Outflows/(Inflows) of Resources for Year
Employer1% Decrease
(6.75%)Current Discount Rate
(7.75%) 1% Increase (8.75%) 2020 2021 2022 2023 2024 Thereafter
5112 Labette Community College $ 92,953 $ 67,911 $ 46,896 $ 12,911 $ 5,786 $ 3,871 $ 2,626 $ 210 $ -
5113 Pratt Community College 143,325 104,712 72,309 (8,473) (6,339) (2,482) (1,542) (141) -
5177 Cloud County Community College 311,172 227,340 156,991 44,851 37,708 35,399 26,631 2,357 -
5178 Dodge City Community College 484,685 354,107 244,530 62,514 36,398 15,469 (5,081) (839) -
5179 Fort Scott Community College 410,322 299,779 207,013 29,890 (11,361) 12,473 26,082 2,546 -
5180 Highland Community College 103,754 75,802 52,345 (10,682) (2,003) (3,338) (7,844) (696) -
5404 Seward County Community College 113,580 82,981 57,303 12,090 11,961 4,609 (5,818) (712) -
5406 Johnson County Community College 962,996 703,558 485,844 (9,436) (34,201) (87,105) (59,159) (4,774) -
5596 NW Kansas Education Service Center 1,146,069 837,310 578,208 (103,967) (76,343) (43,041) (9,258) (598) -
5600 SC Kansas Special Education Coop 1,134,207 828,644 572,223 (83,878) (125,401) (107,222) (38,474) (2,486) -
5604 ANW Special Education Coop 816,838 596,776 412,106 (236,081) (119,717) (78,257) (18,146) (483) -
5608 Tri County Special Education Coop 203,612 148,757 102,725 (135,721) (37,891) (20,005) (6,823) 276 -
5609 Keystone Learning Services 822,238 600,721 414,830 (90,006) (110,321) (91,895) (56,880) (4,722) -
5612 SE Kansas Education Service Center 1,327,992 970,222 669,990 (198,395) (265,364) (201,134) (69,656) (5,018) -
5624 Reno County Education Coop 505,843 369,565 255,205 (82,283) (77,831) (37,487) (9,924) (818) -
5626 High Plains Educational Coop 592,068 432,561 298,706 (87,875) (82,328) (112,171) (71,758) (5,122) -
5634 SW Kansas Coop District 613 1,033,375 754,976 521,352 64,515 15,693 30,847 41,698 4,057 -
5638 East Central Kansas Coop in Education 511,331 373,575 257,974 (6,716) (39,244) (8,616) 19,895 2,620 -
5655 Brown Co Kansas Special Educ Coop - - - (1,994) (9,929) (9,754) (1,469) - -
5657 Doniphan County Education Coop 17,705 12,935 8,933 (87,353) (98,451) (76,133) (18,203) (594) -
5671 Marion County Special Education Coop 345,166 252,176 174,141 24,670 (35,188) (30,353) (34,350) (3,309) -
5682 Sedgwick Co Area Educ Serv Coop 618 1,788,332 1,306,543 902,238 (71,897) (128,388) (89,632) (22,692) (1,313) -
5688 Sumner County Education Services 68,520 50,060 34,569 (62,969) (41,088) (23,198) (8,959) (586) -
9034 Three Lakes Educational Cooperative 728,842 532,487 367,711 73,429 9,694 5,878 2,617 146 -
9042 Educ Serv&Staff Dev Ctr of Cen Kansas 154,834 113,120 78,116 (86,496) (48,474) (30,009) (21,668) (1,919) -
9047 SW Plains Regional Service Center 351,363 256,704 177,268 (124,900) (108,472) (48,510) (5,287) 223 -
9053 SW Kansas Educational Consortium - - - - - - - - -
9055 South Central Kansas Education Service 745,662 544,776 376,197 12,974 (3,495) (6,936) 17,690 2,430 -
9056 Smoky Hill Education Service Center - - - (30,679) (35,568) (33,851) (13,008) (564) -
9273 Nc Kansas Sp Ed Coop Interlocal 636 21,158 15,458 10,674 (75,350) (34,225) (39,292) (18,910) (1,062) -
9274 Southeast Kansas Interlocal 637 512,482 374,416 258,554 (50,055) (76,092) (67,150) (19,432) (1,270) -
9303 Wichita Area Technical College 36,562 26,712 18,446 (8,448) (29,441) (42,643) (12,490) (385) -
9304 Manhattan Area Technical College - - - (4) (4) (4) (886) (114) -
9305 Flint Hills Technical College 284,171 207,614 143,368 (24,154) (39,188) (21,148) 2,887 560 -
9395 Salina Area Technical College 45,414 33,179 22,912 6,351 3,931 2,247 816 (8) -
9487 Western Kansas Com College Virtual Ed Consortium 174,044 127,155 87,808 (7,665) (14,356) (12,415) (732) 189 -
9507 Butler Co Special Education Interlocal # 638 812,943 593,930 410,141 70,959 (95,930) (94,034) (23,056) (441) -
4828 USD 202 Turner 45,341,007 33,125,830 22,875,154 365,798 (807,570) (123,406) (164,965) (48,678) -
(continued)
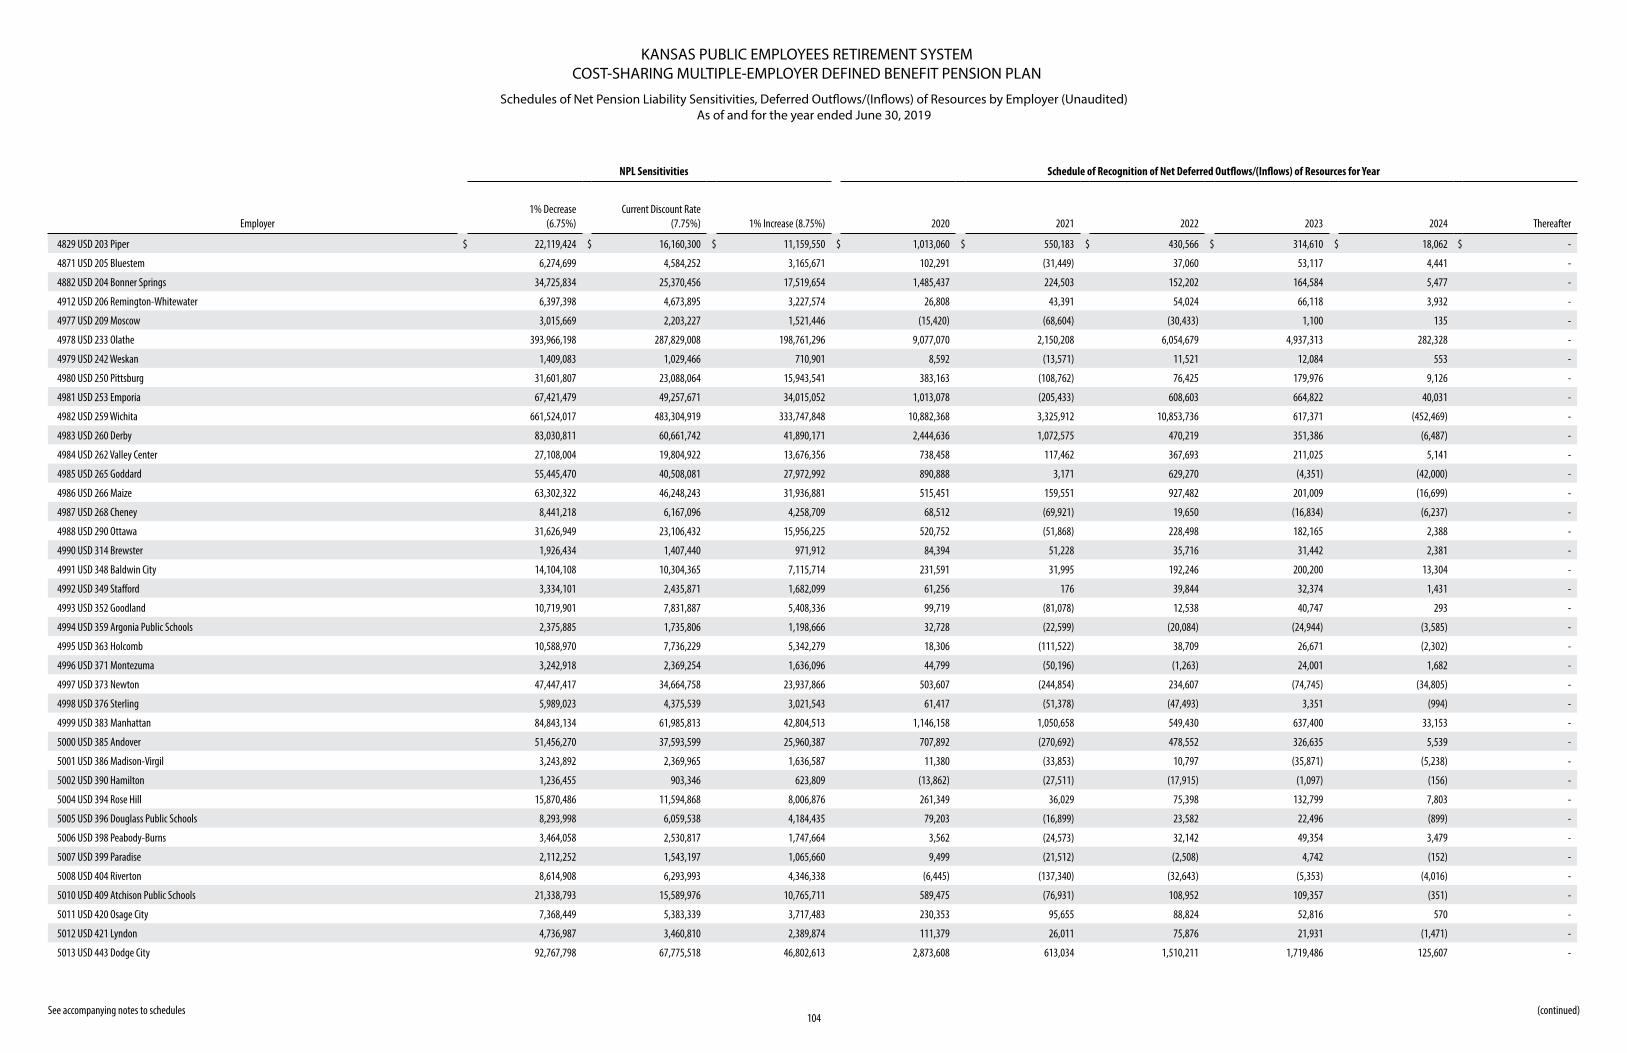
KANSAS PUBLIC EMPLOYEES RETIREMENT SYSTEMCOST-SHARING MULTIPLE-EMPLOYER DEFINED BENEFIT PENSION PLAN
Schedules of Net Pension Liability Sensitivities, Deferred Outflows/(Inflows) of Resources by Employer (Unaudited) As of and for the year ended June 30, 2019
See accompanying notes to schedules104
(continued)
NPL Sensitivities Schedule of Recognition of Net Deferred Outflows/(Inflows) of Resources for Year
Employer1% Decrease
(6.75%)Current Discount Rate
(7.75%) 1% Increase (8.75%) 2020 2021 2022 2023 2024 Thereafter
4829 USD 203 Piper $ 22,119,424 $ 16,160,300 $ 11,159,550 $ 1,013,060 $ 550,183 $ 430,566 $ 314,610 $ 18,062 $ -
4871 USD 205 Bluestem 6,274,699 4,584,252 3,165,671 102,291 (31,449) 37,060 53,117 4,441 -
4882 USD 204 Bonner Springs 34,725,834 25,370,456 17,519,654 1,485,437 224,503 152,202 164,584 5,477 -
4912 USD 206 Remington-Whitewater 6,397,398 4,673,895 3,227,574 26,808 43,391 54,024 66,118 3,932 -
4977 USD 209 Moscow 3,015,669 2,203,227 1,521,446 (15,420) (68,604) (30,433) 1,100 135 -
4978 USD 233 Olathe 393,966,198 287,829,008 198,761,296 9,077,070 2,150,208 6,054,679 4,937,313 282,328 -
4979 USD 242 Weskan 1,409,083 1,029,466 710,901 8,592 (13,571) 11,521 12,084 553 -
4980 USD 250 Pittsburg 31,601,807 23,088,064 15,943,541 383,163 (108,762) 76,425 179,976 9,126 -
4981 USD 253 Emporia 67,421,479 49,257,671 34,015,052 1,013,078 (205,433) 608,603 664,822 40,031 -
4982 USD 259 Wichita 661,524,017 483,304,919 333,747,848 10,882,368 3,325,912 10,853,736 617,371 (452,469) -
4983 USD 260 Derby 83,030,811 60,661,742 41,890,171 2,444,636 1,072,575 470,219 351,386 (6,487) -
4984 USD 262 Valley Center 27,108,004 19,804,922 13,676,356 738,458 117,462 367,693 211,025 5,141 -
4985 USD 265 Goddard 55,445,470 40,508,081 27,972,992 890,888 3,171 629,270 (4,351) (42,000) -
4986 USD 266 Maize 63,302,322 46,248,243 31,936,881 515,451 159,551 927,482 201,009 (16,699) -
4987 USD 268 Cheney 8,441,218 6,167,096 4,258,709 68,512 (69,921) 19,650 (16,834) (6,237) -
4988 USD 290 Ottawa 31,626,949 23,106,432 15,956,225 520,752 (51,868) 228,498 182,165 2,388 -
4990 USD 314 Brewster 1,926,434 1,407,440 971,912 84,394 51,228 35,716 31,442 2,381 -
4991 USD 348 Baldwin City 14,104,108 10,304,365 7,115,714 231,591 31,995 192,246 200,200 13,304 -
4992 USD 349 Stafford 3,334,101 2,435,871 1,682,099 61,256 176 39,844 32,374 1,431 -
4993 USD 352 Goodland 10,719,901 7,831,887 5,408,336 99,719 (81,078) 12,538 40,747 293 -
4994 USD 359 Argonia Public Schools 2,375,885 1,735,806 1,198,666 32,728 (22,599) (20,084) (24,944) (3,585) -
4995 USD 363 Holcomb 10,588,970 7,736,229 5,342,279 18,306 (111,522) 38,709 26,671 (2,302) -
4996 USD 371 Montezuma 3,242,918 2,369,254 1,636,096 44,799 (50,196) (1,263) 24,001 1,682 -
4997 USD 373 Newton 47,447,417 34,664,758 23,937,866 503,607 (244,854) 234,607 (74,745) (34,805) -
4998 USD 376 Sterling 5,989,023 4,375,539 3,021,543 61,417 (51,378) (47,493) 3,351 (994) -
4999 USD 383 Manhattan 84,843,134 61,985,813 42,804,513 1,146,158 1,050,658 549,430 637,400 33,153 -
5000 USD 385 Andover 51,456,270 37,593,599 25,960,387 707,892 (270,692) 478,552 326,635 5,539 -
5001 USD 386 Madison-Virgil 3,243,892 2,369,965 1,636,587 11,380 (33,853) 10,797 (35,871) (5,238) -
5002 USD 390 Hamilton 1,236,455 903,346 623,809 (13,862) (27,511) (17,915) (1,097) (156) -
5004 USD 394 Rose Hill 15,870,486 11,594,868 8,006,876 261,349 36,029 75,398 132,799 7,803 -
5005 USD 396 Douglass Public Schools 8,293,998 6,059,538 4,184,435 79,203 (16,899) 23,582 22,496 (899) -
5006 USD 398 Peabody-Burns 3,464,058 2,530,817 1,747,664 3,562 (24,573) 32,142 49,354 3,479 -
5007 USD 399 Paradise 2,112,252 1,543,197 1,065,660 9,499 (21,512) (2,508) 4,742 (152) -
5008 USD 404 Riverton 8,614,908 6,293,993 4,346,338 (6,445) (137,340) (32,643) (5,353) (4,016) -
5010 USD 409 Atchison Public Schools 21,338,793 15,589,976 10,765,711 589,475 (76,931) 108,952 109,357 (351) -
5011 USD 420 Osage City 7,368,449 5,383,339 3,717,483 230,353 95,655 88,824 52,816 570 -
5012 USD 421 Lyndon 4,736,987 3,460,810 2,389,874 111,379 26,011 75,876 21,931 (1,471) -
5013 USD 443 Dodge City 92,767,798 67,775,518 46,802,613 2,873,608 613,034 1,510,211 1,719,486 125,607 -
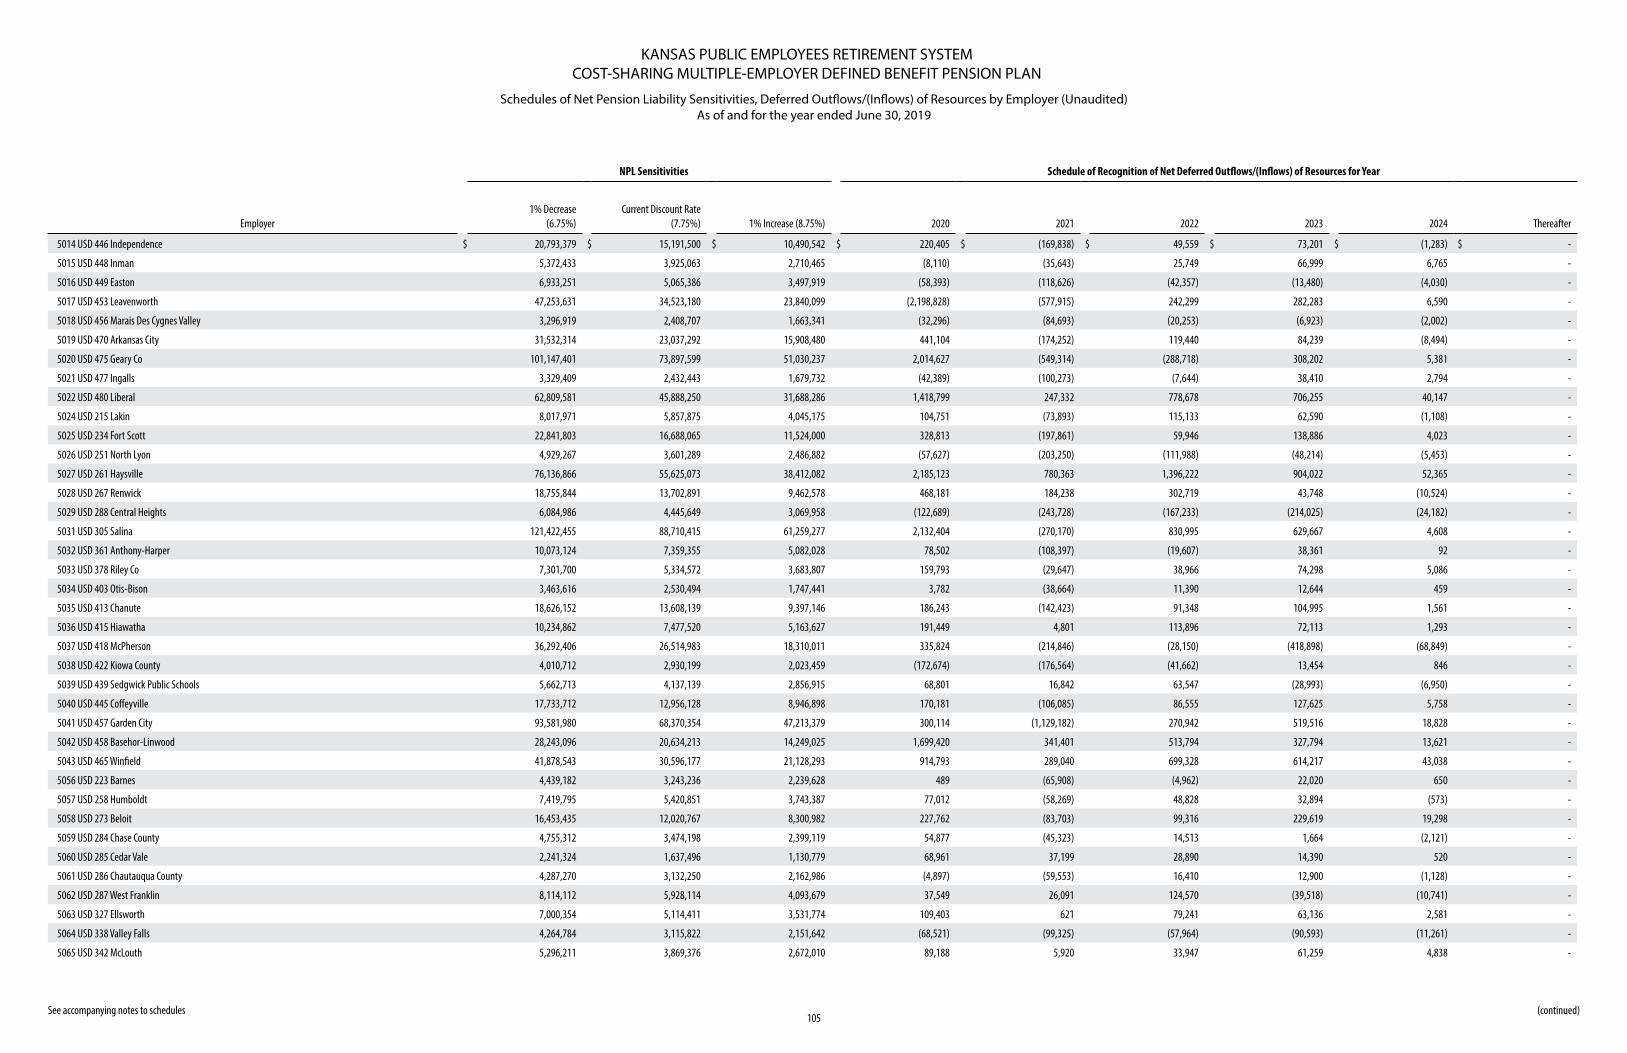
KANSAS PUBLIC EMPLOYEES RETIREMENT SYSTEMCOST-SHARING MULTIPLE-EMPLOYER DEFINED BENEFIT PENSION PLAN
Schedules of Net Pension Liability Sensitivities, Deferred Outflows/(Inflows) of Resources by Employer (Unaudited) As of and for the year ended June 30, 2019
See accompanying notes to schedules105
(continued)
NPL Sensitivities Schedule of Recognition of Net Deferred Outflows/(Inflows) of Resources for Year
Employer1% Decrease
(6.75%)Current Discount Rate
(7.75%) 1% Increase (8.75%) 2020 2021 2022 2023 2024 Thereafter
5014 USD 446 Independence $ 20,793,379 $ 15,191,500 $ 10,490,542 $ 220,405 $ (169,838) $ 49,559 $ 73,201 $ (1,283) $ -
5015 USD 448 Inman 5,372,433 3,925,063 2,710,465 (8,110) (35,643) 25,749 66,999 6,765 -
5016 USD 449 Easton 6,933,251 5,065,386 3,497,919 (58,393) (118,626) (42,357) (13,480) (4,030) -
5017 USD 453 Leavenworth 47,253,631 34,523,180 23,840,099 (2,198,828) (577,915) 242,299 282,283 6,590 -
5018 USD 456 Marais Des Cygnes Valley 3,296,919 2,408,707 1,663,341 (32,296) (84,693) (20,253) (6,923) (2,002) -
5019 USD 470 Arkansas City 31,532,314 23,037,292 15,908,480 441,104 (174,252) 119,440 84,239 (8,494) -
5020 USD 475 Geary Co 101,147,401 73,897,599 51,030,237 2,014,627 (549,314) (288,718) 308,202 5,381 -
5021 USD 477 Ingalls 3,329,409 2,432,443 1,679,732 (42,389) (100,273) (7,644) 38,410 2,794 -
5022 USD 480 Liberal 62,809,581 45,888,250 31,688,286 1,418,799 247,332 778,678 706,255 40,147 -
5024 USD 215 Lakin 8,017,971 5,857,875 4,045,175 104,751 (73,893) 115,133 62,590 (1,108) -
5025 USD 234 Fort Scott 22,841,803 16,688,065 11,524,000 328,813 (197,861) 59,946 138,886 4,023 -
5026 USD 251 North Lyon 4,929,267 3,601,289 2,486,882 (57,627) (203,250) (111,988) (48,214) (5,453) -
5027 USD 261 Haysville 76,136,866 55,625,073 38,412,082 2,185,123 780,363 1,396,222 904,022 52,365 -
5028 USD 267 Renwick 18,755,844 13,702,891 9,462,578 468,181 184,238 302,719 43,748 (10,524) -
5029 USD 288 Central Heights 6,084,986 4,445,649 3,069,958 (122,689) (243,728) (167,233) (214,025) (24,182) -
5031 USD 305 Salina 121,422,455 88,710,415 61,259,277 2,132,404 (270,170) 830,995 629,667 4,608 -
5032 USD 361 Anthony-Harper 10,073,124 7,359,355 5,082,028 78,502 (108,397) (19,607) 38,361 92 -
5033 USD 378 Riley Co 7,301,700 5,334,572 3,683,807 159,793 (29,647) 38,966 74,298 5,086 -
5034 USD 403 Otis-Bison 3,463,616 2,530,494 1,747,441 3,782 (38,664) 11,390 12,644 459 -
5035 USD 413 Chanute 18,626,152 13,608,139 9,397,146 186,243 (142,423) 91,348 104,995 1,561 -
5036 USD 415 Hiawatha 10,234,862 7,477,520 5,163,627 191,449 4,801 113,896 72,113 1,293 -
5037 USD 418 McPherson 36,292,406 26,514,983 18,310,011 335,824 (214,846) (28,150) (418,898) (68,849) -
5038 USD 422 Kiowa County 4,010,712 2,930,199 2,023,459 (172,674) (176,564) (41,662) 13,454 846 -
5039 USD 439 Sedgwick Public Schools 5,662,713 4,137,139 2,856,915 68,801 16,842 63,547 (28,993) (6,950) -
5040 USD 445 Coffeyville 17,733,712 12,956,128 8,946,898 170,181 (106,085) 86,555 127,625 5,758 -
5041 USD 457 Garden City 93,581,980 68,370,354 47,213,379 300,114 (1,129,182) 270,942 519,516 18,828 -
5042 USD 458 Basehor-Linwood 28,243,096 20,634,213 14,249,025 1,699,420 341,401 513,794 327,794 13,621 -
5043 USD 465 Winfield 41,878,543 30,596,177 21,128,293 914,793 289,040 699,328 614,217 43,038 -
5056 USD 223 Barnes 4,439,182 3,243,236 2,239,628 489 (65,908) (4,962) 22,020 650 -
5057 USD 258 Humboldt 7,419,795 5,420,851 3,743,387 77,012 (58,269) 48,828 32,894 (573) -
5058 USD 273 Beloit 16,453,435 12,020,767 8,300,982 227,762 (83,703) 99,316 229,619 19,298 -
5059 USD 284 Chase County 4,755,312 3,474,198 2,399,119 54,877 (45,323) 14,513 1,664 (2,121) -
5060 USD 285 Cedar Vale 2,241,324 1,637,496 1,130,779 68,961 37,199 28,890 14,390 520 -
5061 USD 286 Chautauqua County 4,287,270 3,132,250 2,162,986 (4,897) (59,553) 16,410 12,900 (1,128) -
5062 USD 287 West Franklin 8,114,112 5,928,114 4,093,679 37,549 26,091 124,570 (39,518) (10,741) -
5063 USD 327 Ellsworth 7,000,354 5,114,411 3,531,774 109,403 621 79,241 63,136 2,581 -
5064 USD 338 Valley Falls 4,264,784 3,115,822 2,151,642 (68,521) (99,325) (57,964) (90,593) (11,261) -
5065 USD 342 McLouth 5,296,211 3,869,376 2,672,010 89,188 5,920 33,947 61,259 4,838 -
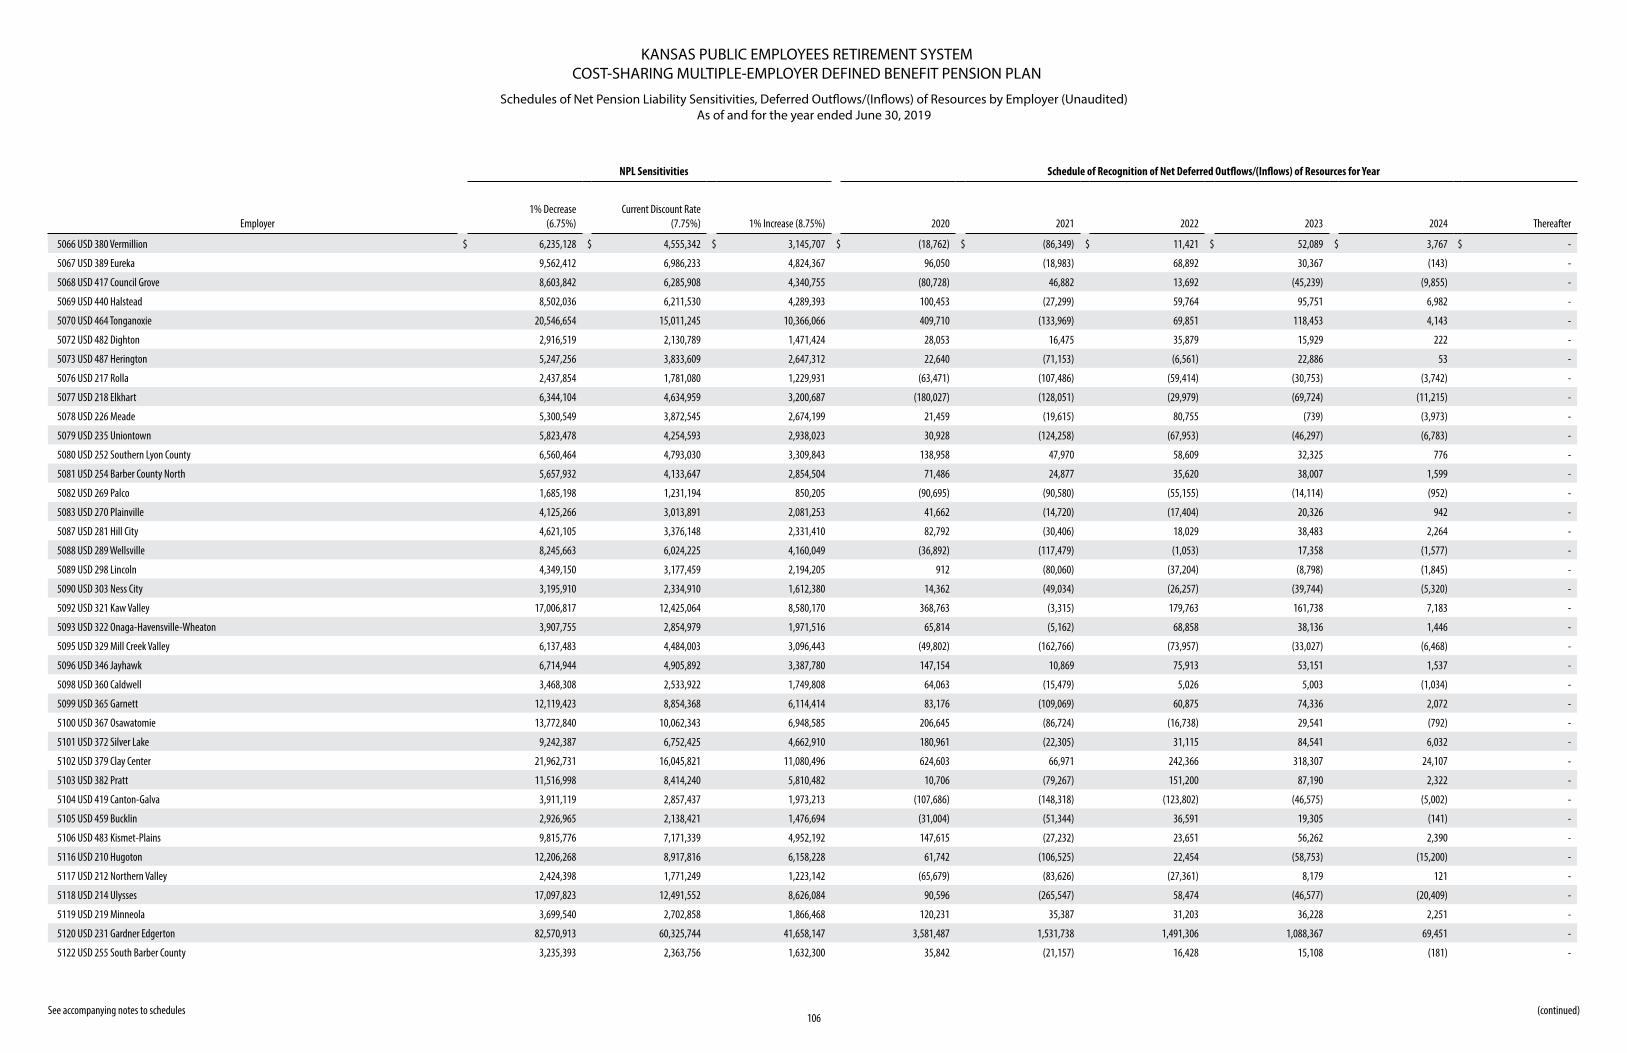
KANSAS PUBLIC EMPLOYEES RETIREMENT SYSTEMCOST-SHARING MULTIPLE-EMPLOYER DEFINED BENEFIT PENSION PLAN
Schedules of Net Pension Liability Sensitivities, Deferred Outflows/(Inflows) of Resources by Employer (Unaudited) As of and for the year ended June 30, 2019
See accompanying notes to schedules106
(continued)
NPL Sensitivities Schedule of Recognition of Net Deferred Outflows/(Inflows) of Resources for Year
Employer1% Decrease
(6.75%)Current Discount Rate
(7.75%) 1% Increase (8.75%) 2020 2021 2022 2023 2024 Thereafter
5066 USD 380 Vermillion $ 6,235,128 $ 4,555,342 $ 3,145,707 $ (18,762) $ (86,349) $ 11,421 $ 52,089 $ 3,767 $ -
5067 USD 389 Eureka 9,562,412 6,986,233 4,824,367 96,050 (18,983) 68,892 30,367 (143) -
5068 USD 417 Council Grove 8,603,842 6,285,908 4,340,755 (80,728) 46,882 13,692 (45,239) (9,855) -
5069 USD 440 Halstead 8,502,036 6,211,530 4,289,393 100,453 (27,299) 59,764 95,751 6,982 -
5070 USD 464 Tonganoxie 20,546,654 15,011,245 10,366,066 409,710 (133,969) 69,851 118,453 4,143 -
5072 USD 482 Dighton 2,916,519 2,130,789 1,471,424 28,053 16,475 35,879 15,929 222 -
5073 USD 487 Herington 5,247,256 3,833,609 2,647,312 22,640 (71,153) (6,561) 22,886 53 -
5076 USD 217 Rolla 2,437,854 1,781,080 1,229,931 (63,471) (107,486) (59,414) (30,753) (3,742) -
5077 USD 218 Elkhart 6,344,104 4,634,959 3,200,687 (180,027) (128,051) (29,979) (69,724) (11,215) -
5078 USD 226 Meade 5,300,549 3,872,545 2,674,199 21,459 (19,615) 80,755 (739) (3,973) -
5079 USD 235 Uniontown 5,823,478 4,254,593 2,938,023 30,928 (124,258) (67,953) (46,297) (6,783) -
5080 USD 252 Southern Lyon County 6,560,464 4,793,030 3,309,843 138,958 47,970 58,609 32,325 776 -
5081 USD 254 Barber County North 5,657,932 4,133,647 2,854,504 71,486 24,877 35,620 38,007 1,599 -
5082 USD 269 Palco 1,685,198 1,231,194 850,205 (90,695) (90,580) (55,155) (14,114) (952) -
5083 USD 270 Plainville 4,125,266 3,013,891 2,081,253 41,662 (14,720) (17,404) 20,326 942 -
5087 USD 281 Hill City 4,621,105 3,376,148 2,331,410 82,792 (30,406) 18,029 38,483 2,264 -
5088 USD 289 Wellsville 8,245,663 6,024,225 4,160,049 (36,892) (117,479) (1,053) 17,358 (1,577) -
5089 USD 298 Lincoln 4,349,150 3,177,459 2,194,205 912 (80,060) (37,204) (8,798) (1,845) -
5090 USD 303 Ness City 3,195,910 2,334,910 1,612,380 14,362 (49,034) (26,257) (39,744) (5,320) -
5092 USD 321 Kaw Valley 17,006,817 12,425,064 8,580,170 368,763 (3,315) 179,763 161,738 7,183 -
5093 USD 322 Onaga-Havensville-Wheaton 3,907,755 2,854,979 1,971,516 65,814 (5,162) 68,858 38,136 1,446 -
5095 USD 329 Mill Creek Valley 6,137,483 4,484,003 3,096,443 (49,802) (162,766) (73,957) (33,027) (6,468) -
5096 USD 346 Jayhawk 6,714,944 4,905,892 3,387,780 147,154 10,869 75,913 53,151 1,537 -
5098 USD 360 Caldwell 3,468,308 2,533,922 1,749,808 64,063 (15,479) 5,026 5,003 (1,034) -
5099 USD 365 Garnett 12,119,423 8,854,368 6,114,414 83,176 (109,069) 60,875 74,336 2,072 -
5100 USD 367 Osawatomie 13,772,840 10,062,343 6,948,585 206,645 (86,724) (16,738) 29,541 (792) -
5101 USD 372 Silver Lake 9,242,387 6,752,425 4,662,910 180,961 (22,305) 31,115 84,541 6,032 -
5102 USD 379 Clay Center 21,962,731 16,045,821 11,080,496 624,603 66,971 242,366 318,307 24,107 -
5103 USD 382 Pratt 11,516,998 8,414,240 5,810,482 10,706 (79,267) 151,200 87,190 2,322 -
5104 USD 419 Canton-Galva 3,911,119 2,857,437 1,973,213 (107,686) (148,318) (123,802) (46,575) (5,002) -
5105 USD 459 Bucklin 2,926,965 2,138,421 1,476,694 (31,004) (51,344) 36,591 19,305 (141) -
5106 USD 483 Kismet-Plains 9,815,776 7,171,339 4,952,192 147,615 (27,232) 23,651 56,262 2,390 -
5116 USD 210 Hugoton 12,206,268 8,917,816 6,158,228 61,742 (106,525) 22,454 (58,753) (15,200) -
5117 USD 212 Northern Valley 2,424,398 1,771,249 1,223,142 (65,679) (83,626) (27,361) 8,179 121 -
5118 USD 214 Ulysses 17,097,823 12,491,552 8,626,084 90,596 (265,547) 58,474 (46,577) (20,409) -
5119 USD 219 Minneola 3,699,540 2,702,858 1,866,468 120,231 35,387 31,203 36,228 2,251 -
5120 USD 231 Gardner Edgerton 82,570,913 60,325,744 41,658,147 3,581,487 1,531,738 1,491,306 1,088,367 69,451 -
5122 USD 255 South Barber County 3,235,393 2,363,756 1,632,300 35,842 (21,157) 16,428 15,108 (181) -
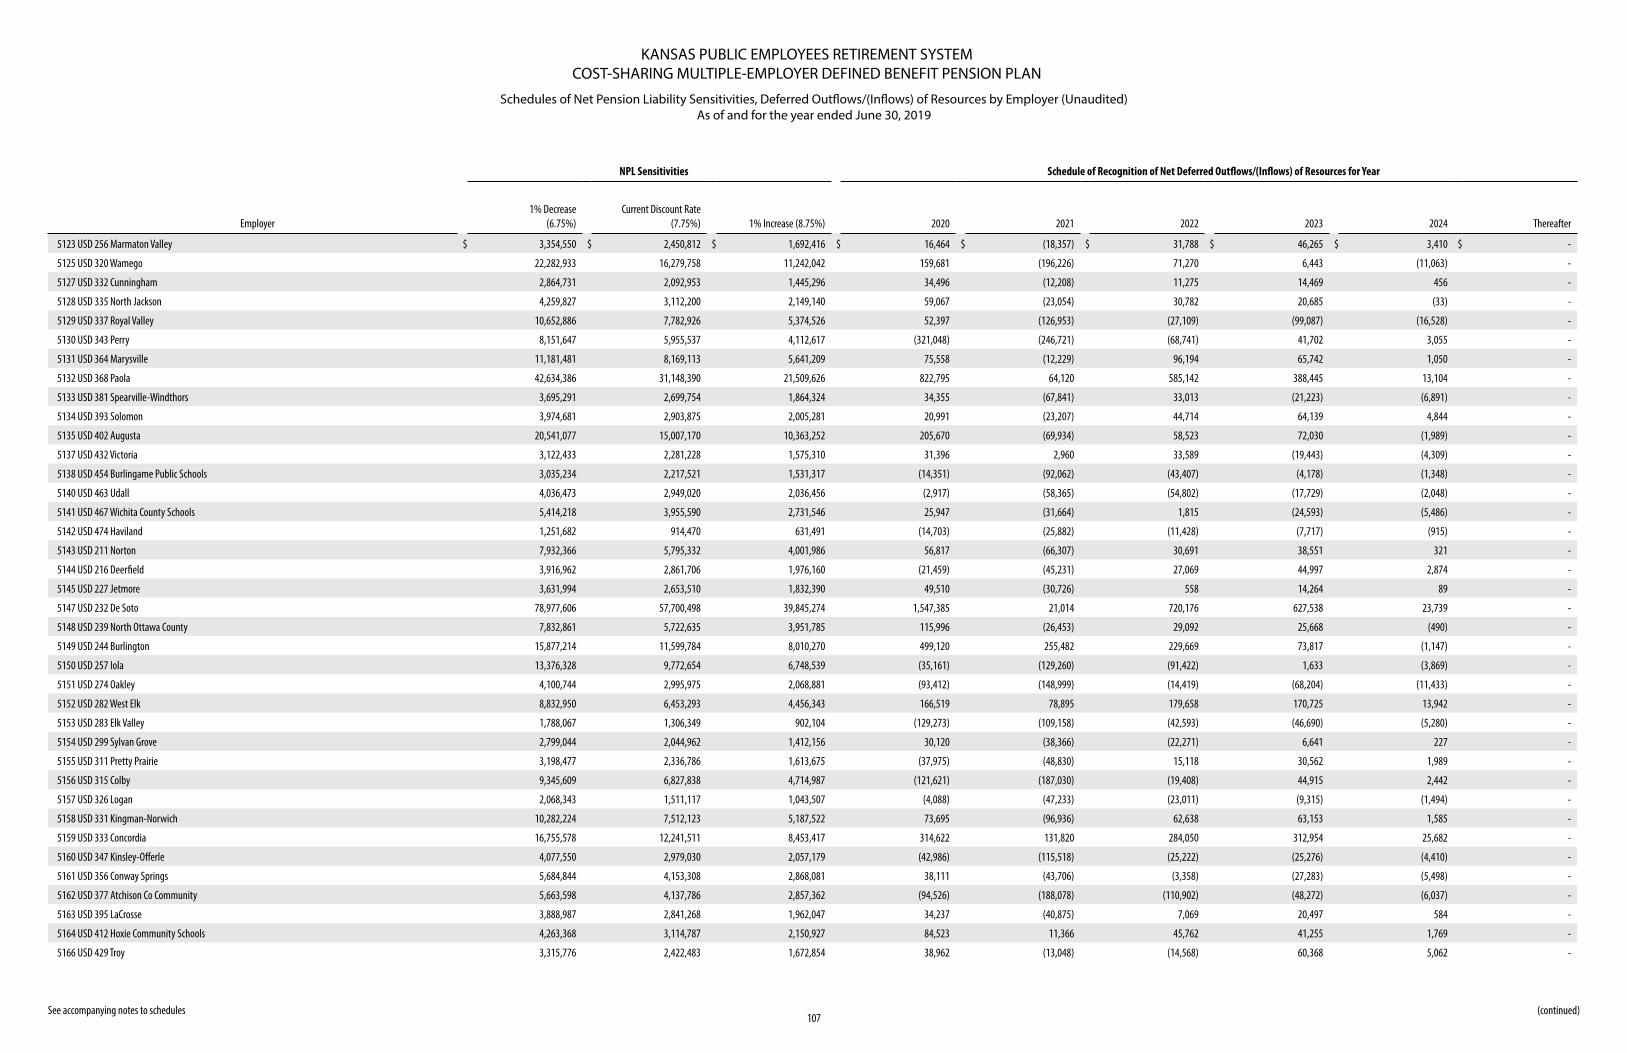
KANSAS PUBLIC EMPLOYEES RETIREMENT SYSTEMCOST-SHARING MULTIPLE-EMPLOYER DEFINED BENEFIT PENSION PLAN
Schedules of Net Pension Liability Sensitivities, Deferred Outflows/(Inflows) of Resources by Employer (Unaudited) As of and for the year ended June 30, 2019
See accompanying notes to schedules107
(continued)
NPL Sensitivities Schedule of Recognition of Net Deferred Outflows/(Inflows) of Resources for Year
Employer1% Decrease
(6.75%)Current Discount Rate
(7.75%) 1% Increase (8.75%) 2020 2021 2022 2023 2024 Thereafter
5123 USD 256 Marmaton Valley $ 3,354,550 $ 2,450,812 $ 1,692,416 $ 16,464 $ (18,357) $ 31,788 $ 46,265 $ 3,410 $ -
5125 USD 320 Wamego 22,282,933 16,279,758 11,242,042 159,681 (196,226) 71,270 6,443 (11,063) -
5127 USD 332 Cunningham 2,864,731 2,092,953 1,445,296 34,496 (12,208) 11,275 14,469 456 -
5128 USD 335 North Jackson 4,259,827 3,112,200 2,149,140 59,067 (23,054) 30,782 20,685 (33) -
5129 USD 337 Royal Valley 10,652,886 7,782,926 5,374,526 52,397 (126,953) (27,109) (99,087) (16,528) -
5130 USD 343 Perry 8,151,647 5,955,537 4,112,617 (321,048) (246,721) (68,741) 41,702 3,055 -
5131 USD 364 Marysville 11,181,481 8,169,113 5,641,209 75,558 (12,229) 96,194 65,742 1,050 -
5132 USD 368 Paola 42,634,386 31,148,390 21,509,626 822,795 64,120 585,142 388,445 13,104 -
5133 USD 381 Spearville-Windthors 3,695,291 2,699,754 1,864,324 34,355 (67,841) 33,013 (21,223) (6,891) -
5134 USD 393 Solomon 3,974,681 2,903,875 2,005,281 20,991 (23,207) 44,714 64,139 4,844 -
5135 USD 402 Augusta 20,541,077 15,007,170 10,363,252 205,670 (69,934) 58,523 72,030 (1,989) -
5137 USD 432 Victoria 3,122,433 2,281,228 1,575,310 31,396 2,960 33,589 (19,443) (4,309) -
5138 USD 454 Burlingame Public Schools 3,035,234 2,217,521 1,531,317 (14,351) (92,062) (43,407) (4,178) (1,348) -
5140 USD 463 Udall 4,036,473 2,949,020 2,036,456 (2,917) (58,365) (54,802) (17,729) (2,048) -
5141 USD 467 Wichita County Schools 5,414,218 3,955,590 2,731,546 25,947 (31,664) 1,815 (24,593) (5,486) -
5142 USD 474 Haviland 1,251,682 914,470 631,491 (14,703) (25,882) (11,428) (7,717) (915) -
5143 USD 211 Norton 7,932,366 5,795,332 4,001,986 56,817 (66,307) 30,691 38,551 321 -
5144 USD 216 Deerfield 3,916,962 2,861,706 1,976,160 (21,459) (45,231) 27,069 44,997 2,874 -
5145 USD 227 Jetmore 3,631,994 2,653,510 1,832,390 49,510 (30,726) 558 14,264 89 -
5147 USD 232 De Soto 78,977,606 57,700,498 39,845,274 1,547,385 21,014 720,176 627,538 23,739 -
5148 USD 239 North Ottawa County 7,832,861 5,722,635 3,951,785 115,996 (26,453) 29,092 25,668 (490) -
5149 USD 244 Burlington 15,877,214 11,599,784 8,010,270 499,120 255,482 229,669 73,817 (1,147) -
5150 USD 257 Iola 13,376,328 9,772,654 6,748,539 (35,161) (129,260) (91,422) 1,633 (3,869) -
5151 USD 274 Oakley 4,100,744 2,995,975 2,068,881 (93,412) (148,999) (14,419) (68,204) (11,433) -
5152 USD 282 West Elk 8,832,950 6,453,293 4,456,343 166,519 78,895 179,658 170,725 13,942 -
5153 USD 283 Elk Valley 1,788,067 1,306,349 902,104 (129,273) (109,158) (42,593) (46,690) (5,280) -
5154 USD 299 Sylvan Grove 2,799,044 2,044,962 1,412,156 30,120 (38,366) (22,271) 6,641 227 -
5155 USD 311 Pretty Prairie 3,198,477 2,336,786 1,613,675 (37,975) (48,830) 15,118 30,562 1,989 -
5156 USD 315 Colby 9,345,609 6,827,838 4,714,987 (121,621) (187,030) (19,408) 44,915 2,442 -
5157 USD 326 Logan 2,068,343 1,511,117 1,043,507 (4,088) (47,233) (23,011) (9,315) (1,494) -
5158 USD 331 Kingman-Norwich 10,282,224 7,512,123 5,187,522 73,695 (96,936) 62,638 63,153 1,585 -
5159 USD 333 Concordia 16,755,578 12,241,511 8,453,417 314,622 131,820 284,050 312,954 25,682 -
5160 USD 347 Kinsley-Offerle 4,077,550 2,979,030 2,057,179 (42,986) (115,518) (25,222) (25,276) (4,410) -
5161 USD 356 Conway Springs 5,684,844 4,153,308 2,868,081 38,111 (43,706) (3,358) (27,283) (5,498) -
5162 USD 377 Atchison Co Community 5,663,598 4,137,786 2,857,362 (94,526) (188,078) (110,902) (48,272) (6,037) -
5163 USD 395 LaCrosse 3,888,987 2,841,268 1,962,047 34,237 (40,875) 7,069 20,497 584 -
5164 USD 412 Hoxie Community Schools 4,263,368 3,114,787 2,150,927 84,523 11,366 45,762 41,255 1,769 -
5166 USD 429 Troy 3,315,776 2,422,483 1,672,854 38,962 (13,048) (14,568) 60,368 5,062 -
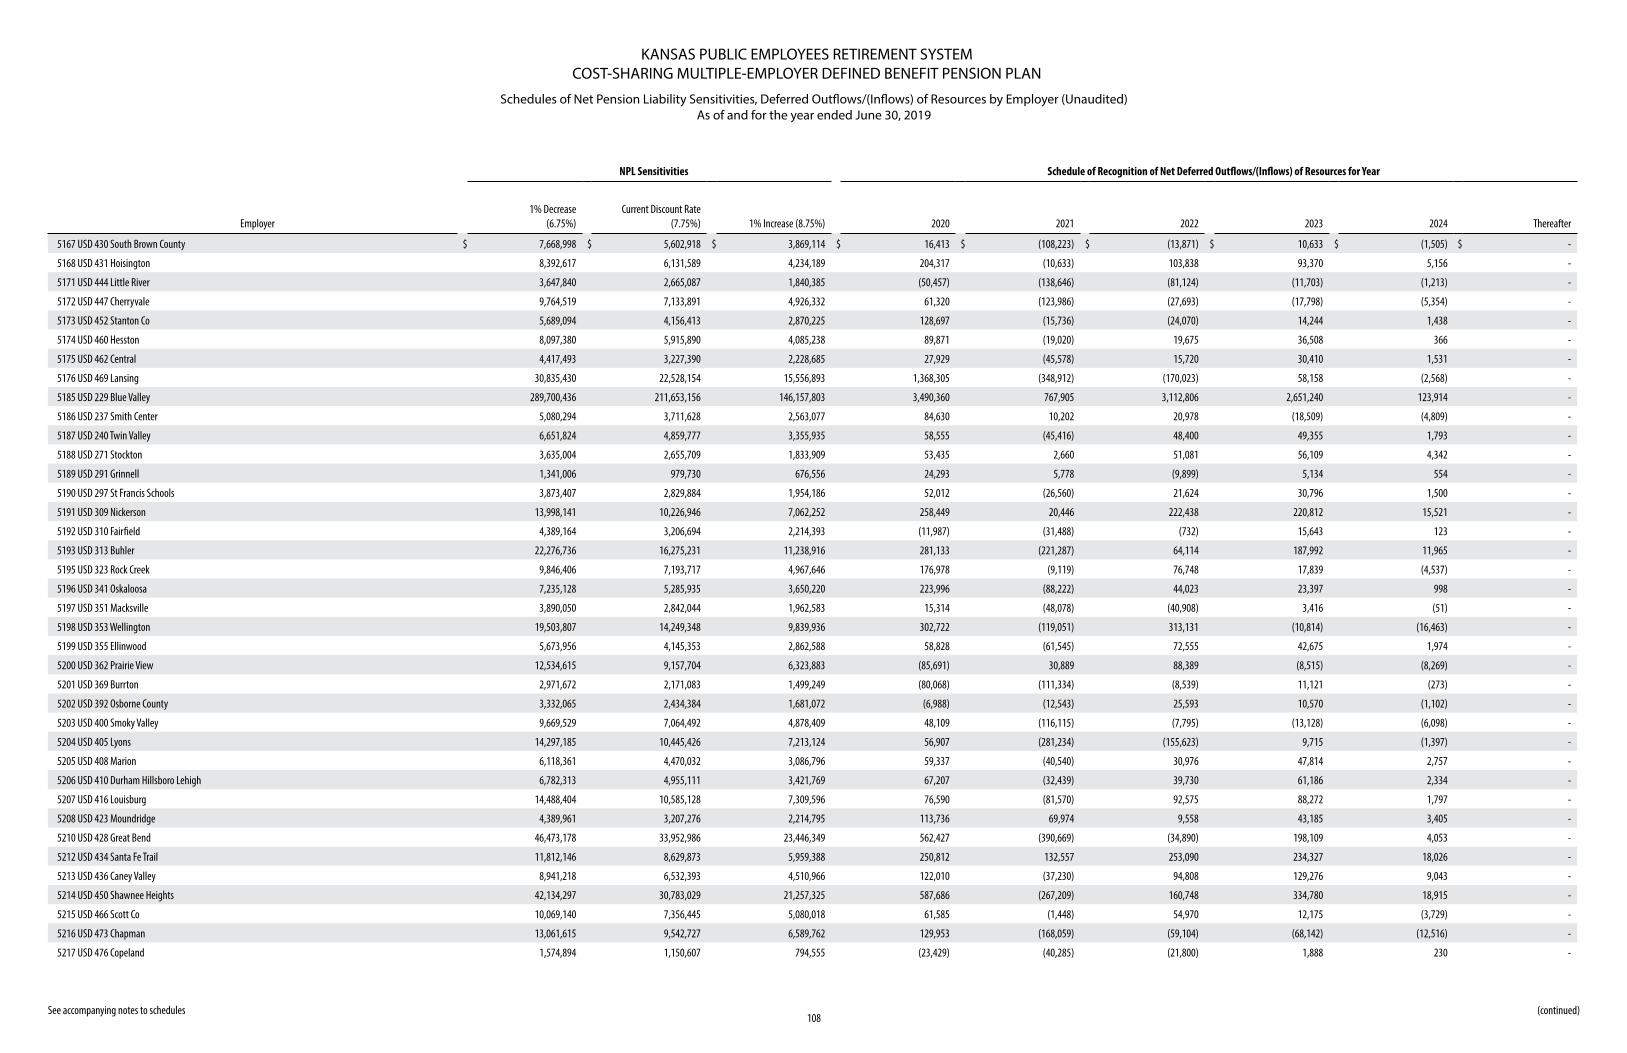
KANSAS PUBLIC EMPLOYEES RETIREMENT SYSTEMCOST-SHARING MULTIPLE-EMPLOYER DEFINED BENEFIT PENSION PLAN
Schedules of Net Pension Liability Sensitivities, Deferred Outflows/(Inflows) of Resources by Employer (Unaudited) As of and for the year ended June 30, 2019
See accompanying notes to schedules108
(continued)
NPL Sensitivities Schedule of Recognition of Net Deferred Outflows/(Inflows) of Resources for Year
Employer1% Decrease
(6.75%)Current Discount Rate
(7.75%) 1% Increase (8.75%) 2020 2021 2022 2023 2024 Thereafter
5167 USD 430 South Brown County $ 7,668,998 $ 5,602,918 $ 3,869,114 $ 16,413 $ (108,223) $ (13,871) $ 10,633 $ (1,505) $ -
5168 USD 431 Hoisington 8,392,617 6,131,589 4,234,189 204,317 (10,633) 103,838 93,370 5,156 -
5171 USD 444 Little River 3,647,840 2,665,087 1,840,385 (50,457) (138,646) (81,124) (11,703) (1,213) -
5172 USD 447 Cherryvale 9,764,519 7,133,891 4,926,332 61,320 (123,986) (27,693) (17,798) (5,354) -
5173 USD 452 Stanton Co 5,689,094 4,156,413 2,870,225 128,697 (15,736) (24,070) 14,244 1,438 -
5174 USD 460 Hesston 8,097,380 5,915,890 4,085,238 89,871 (19,020) 19,675 36,508 366 -
5175 USD 462 Central 4,417,493 3,227,390 2,228,685 27,929 (45,578) 15,720 30,410 1,531 -
5176 USD 469 Lansing 30,835,430 22,528,154 15,556,893 1,368,305 (348,912) (170,023) 58,158 (2,568) -
5185 USD 229 Blue Valley 289,700,436 211,653,156 146,157,803 3,490,360 767,905 3,112,806 2,651,240 123,914 -
5186 USD 237 Smith Center 5,080,294 3,711,628 2,563,077 84,630 10,202 20,978 (18,509) (4,809) -
5187 USD 240 Twin Valley 6,651,824 4,859,777 3,355,935 58,555 (45,416) 48,400 49,355 1,793 -
5188 USD 271 Stockton 3,635,004 2,655,709 1,833,909 53,435 2,660 51,081 56,109 4,342 -
5189 USD 291 Grinnell 1,341,006 979,730 676,556 24,293 5,778 (9,899) 5,134 554 -
5190 USD 297 St Francis Schools 3,873,407 2,829,884 1,954,186 52,012 (26,560) 21,624 30,796 1,500 -
5191 USD 309 Nickerson 13,998,141 10,226,946 7,062,252 258,449 20,446 222,438 220,812 15,521 -
5192 USD 310 Fairfield 4,389,164 3,206,694 2,214,393 (11,987) (31,488) (732) 15,643 123 -
5193 USD 313 Buhler 22,276,736 16,275,231 11,238,916 281,133 (221,287) 64,114 187,992 11,965 -
5195 USD 323 Rock Creek 9,846,406 7,193,717 4,967,646 176,978 (9,119) 76,748 17,839 (4,537) -
5196 USD 341 Oskaloosa 7,235,128 5,285,935 3,650,220 223,996 (88,222) 44,023 23,397 998 -
5197 USD 351 Macksville 3,890,050 2,842,044 1,962,583 15,314 (48,078) (40,908) 3,416 (51) -
5198 USD 353 Wellington 19,503,807 14,249,348 9,839,936 302,722 (119,051) 313,131 (10,814) (16,463) -
5199 USD 355 Ellinwood 5,673,956 4,145,353 2,862,588 58,828 (61,545) 72,555 42,675 1,974 -
5200 USD 362 Prairie View 12,534,615 9,157,704 6,323,883 (85,691) 30,889 88,389 (8,515) (8,269) -
5201 USD 369 Burrton 2,971,672 2,171,083 1,499,249 (80,068) (111,334) (8,539) 11,121 (273) -
5202 USD 392 Osborne County 3,332,065 2,434,384 1,681,072 (6,988) (12,543) 25,593 10,570 (1,102) -
5203 USD 400 Smoky Valley 9,669,529 7,064,492 4,878,409 48,109 (116,115) (7,795) (13,128) (6,098) -
5204 USD 405 Lyons 14,297,185 10,445,426 7,213,124 56,907 (281,234) (155,623) 9,715 (1,397) -
5205 USD 408 Marion 6,118,361 4,470,032 3,086,796 59,337 (40,540) 30,976 47,814 2,757 -
5206 USD 410 Durham Hillsboro Lehigh 6,782,313 4,955,111 3,421,769 67,207 (32,439) 39,730 61,186 2,334 -
5207 USD 416 Louisburg 14,488,404 10,585,128 7,309,596 76,590 (81,570) 92,575 88,272 1,797 -
5208 USD 423 Moundridge 4,389,961 3,207,276 2,214,795 113,736 69,974 9,558 43,185 3,405 -
5210 USD 428 Great Bend 46,473,178 33,952,986 23,446,349 562,427 (390,669) (34,890) 198,109 4,053 -
5212 USD 434 Santa Fe Trail 11,812,146 8,629,873 5,959,388 250,812 132,557 253,090 234,327 18,026 -
5213 USD 436 Caney Valley 8,941,218 6,532,393 4,510,966 122,010 (37,230) 94,808 129,276 9,043 -
5214 USD 450 Shawnee Heights 42,134,297 30,783,029 21,257,325 587,686 (267,209) 160,748 334,780 18,915 -
5215 USD 466 Scott Co 10,069,140 7,356,445 5,080,018 61,585 (1,448) 54,970 12,175 (3,729) -
5216 USD 473 Chapman 13,061,615 9,542,727 6,589,762 129,953 (168,059) (59,104) (68,142) (12,516) -
5217 USD 476 Copeland 1,574,894 1,150,607 794,555 (23,429) (40,285) (21,800) 1,888 230 -
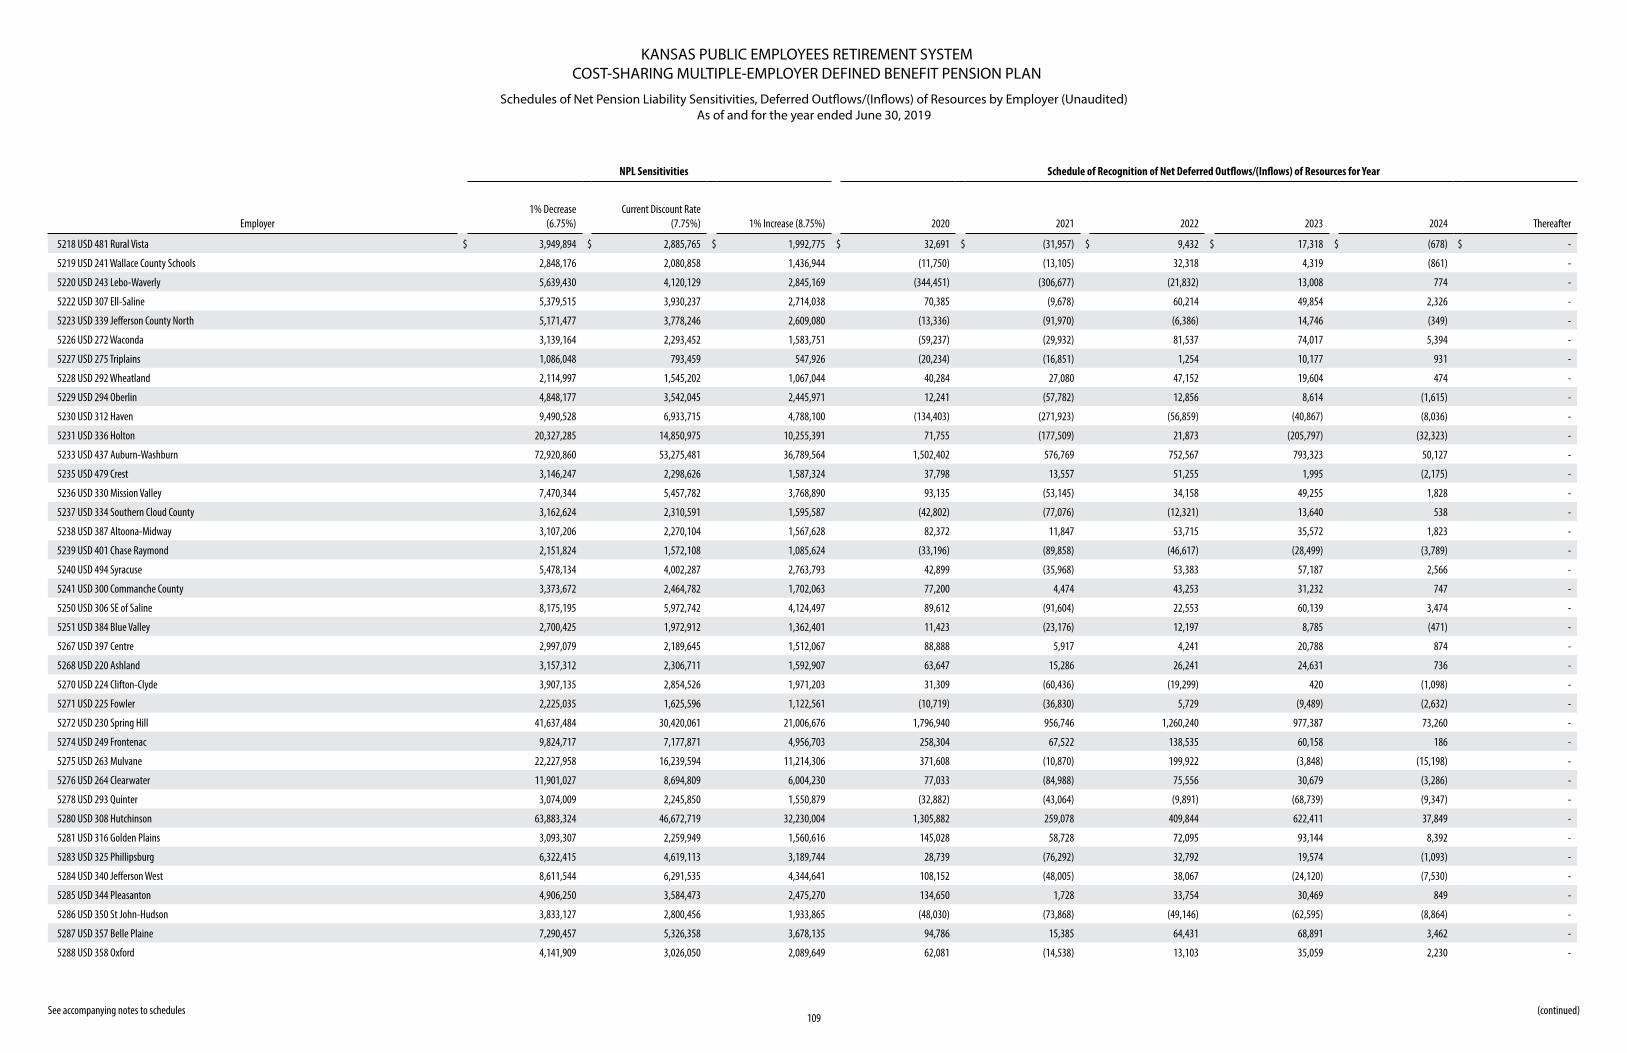
KANSAS PUBLIC EMPLOYEES RETIREMENT SYSTEMCOST-SHARING MULTIPLE-EMPLOYER DEFINED BENEFIT PENSION PLAN
Schedules of Net Pension Liability Sensitivities, Deferred Outflows/(Inflows) of Resources by Employer (Unaudited) As of and for the year ended June 30, 2019
See accompanying notes to schedules109
(continued)
NPL Sensitivities Schedule of Recognition of Net Deferred Outflows/(Inflows) of Resources for Year
Employer1% Decrease
(6.75%)Current Discount Rate
(7.75%) 1% Increase (8.75%) 2020 2021 2022 2023 2024 Thereafter
5218 USD 481 Rural Vista $ 3,949,894 $ 2,885,765 $ 1,992,775 $ 32,691 $ (31,957) $ 9,432 $ 17,318 $ (678) $ -
5219 USD 241 Wallace County Schools 2,848,176 2,080,858 1,436,944 (11,750) (13,105) 32,318 4,319 (861) -
5220 USD 243 Lebo-Waverly 5,639,430 4,120,129 2,845,169 (344,451) (306,677) (21,832) 13,008 774 -
5222 USD 307 Ell-Saline 5,379,515 3,930,237 2,714,038 70,385 (9,678) 60,214 49,854 2,326 -
5223 USD 339 Jefferson County North 5,171,477 3,778,246 2,609,080 (13,336) (91,970) (6,386) 14,746 (349) -
5226 USD 272 Waconda 3,139,164 2,293,452 1,583,751 (59,237) (29,932) 81,537 74,017 5,394 -
5227 USD 275 Triplains 1,086,048 793,459 547,926 (20,234) (16,851) 1,254 10,177 931 -
5228 USD 292 Wheatland 2,114,997 1,545,202 1,067,044 40,284 27,080 47,152 19,604 474 -
5229 USD 294 Oberlin 4,848,177 3,542,045 2,445,971 12,241 (57,782) 12,856 8,614 (1,615) -
5230 USD 312 Haven 9,490,528 6,933,715 4,788,100 (134,403) (271,923) (56,859) (40,867) (8,036) -
5231 USD 336 Holton 20,327,285 14,850,975 10,255,391 71,755 (177,509) 21,873 (205,797) (32,323) -
5233 USD 437 Auburn-Washburn 72,920,860 53,275,481 36,789,564 1,502,402 576,769 752,567 793,323 50,127 -
5235 USD 479 Crest 3,146,247 2,298,626 1,587,324 37,798 13,557 51,255 1,995 (2,175) -
5236 USD 330 Mission Valley 7,470,344 5,457,782 3,768,890 93,135 (53,145) 34,158 49,255 1,828 -
5237 USD 334 Southern Cloud County 3,162,624 2,310,591 1,595,587 (42,802) (77,076) (12,321) 13,640 538 -
5238 USD 387 Altoona-Midway 3,107,206 2,270,104 1,567,628 82,372 11,847 53,715 35,572 1,823 -
5239 USD 401 Chase Raymond 2,151,824 1,572,108 1,085,624 (33,196) (89,858) (46,617) (28,499) (3,789) -
5240 USD 494 Syracuse 5,478,134 4,002,287 2,763,793 42,899 (35,968) 53,383 57,187 2,566 -
5241 USD 300 Commanche County 3,373,672 2,464,782 1,702,063 77,200 4,474 43,253 31,232 747 -
5250 USD 306 SE of Saline 8,175,195 5,972,742 4,124,497 89,612 (91,604) 22,553 60,139 3,474 -
5251 USD 384 Blue Valley 2,700,425 1,972,912 1,362,401 11,423 (23,176) 12,197 8,785 (471) -
5267 USD 397 Centre 2,997,079 2,189,645 1,512,067 88,888 5,917 4,241 20,788 874 -
5268 USD 220 Ashland 3,157,312 2,306,711 1,592,907 63,647 15,286 26,241 24,631 736 -
5270 USD 224 Clifton-Clyde 3,907,135 2,854,526 1,971,203 31,309 (60,436) (19,299) 420 (1,098) -
5271 USD 225 Fowler 2,225,035 1,625,596 1,122,561 (10,719) (36,830) 5,729 (9,489) (2,632) -
5272 USD 230 Spring Hill 41,637,484 30,420,061 21,006,676 1,796,940 956,746 1,260,240 977,387 73,260 -
5274 USD 249 Frontenac 9,824,717 7,177,871 4,956,703 258,304 67,522 138,535 60,158 186 -
5275 USD 263 Mulvane 22,227,958 16,239,594 11,214,306 371,608 (10,870) 199,922 (3,848) (15,198) -
5276 USD 264 Clearwater 11,901,027 8,694,809 6,004,230 77,033 (84,988) 75,556 30,679 (3,286) -
5278 USD 293 Quinter 3,074,009 2,245,850 1,550,879 (32,882) (43,064) (9,891) (68,739) (9,347) -
5280 USD 308 Hutchinson 63,883,324 46,672,719 32,230,004 1,305,882 259,078 409,844 622,411 37,849 -
5281 USD 316 Golden Plains 3,093,307 2,259,949 1,560,616 145,028 58,728 72,095 93,144 8,392 -
5283 USD 325 Phillipsburg 6,322,415 4,619,113 3,189,744 28,739 (76,292) 32,792 19,574 (1,093) -
5284 USD 340 Jefferson West 8,611,544 6,291,535 4,344,641 108,152 (48,005) 38,067 (24,120) (7,530) -
5285 USD 344 Pleasanton 4,906,250 3,584,473 2,475,270 134,650 1,728 33,754 30,469 849 -
5286 USD 350 St John-Hudson 3,833,127 2,800,456 1,933,865 (48,030) (73,868) (49,146) (62,595) (8,864) -
5287 USD 357 Belle Plaine 7,290,457 5,326,358 3,678,135 94,786 15,385 64,431 68,891 3,462 -
5288 USD 358 Oxford 4,141,909 3,026,050 2,089,649 62,081 (14,538) 13,103 35,059 2,230 -
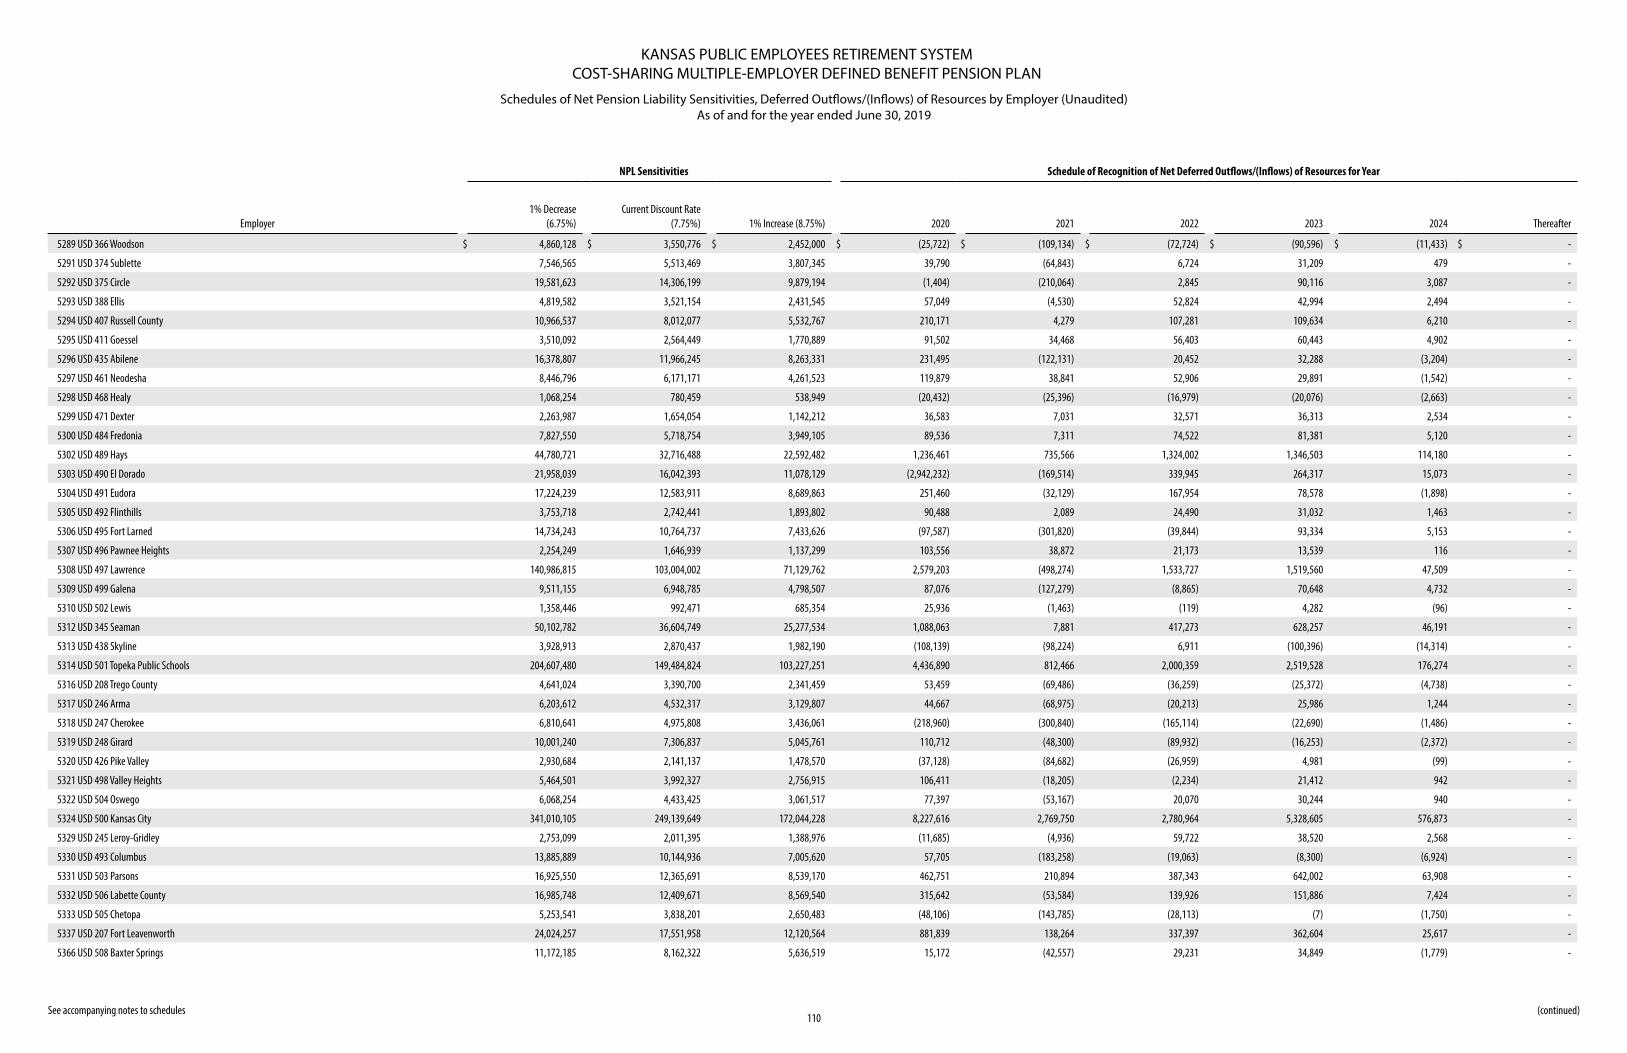
KANSAS PUBLIC EMPLOYEES RETIREMENT SYSTEMCOST-SHARING MULTIPLE-EMPLOYER DEFINED BENEFIT PENSION PLAN
Schedules of Net Pension Liability Sensitivities, Deferred Outflows/(Inflows) of Resources by Employer (Unaudited) As of and for the year ended June 30, 2019
See accompanying notes to schedules110
(continued)
NPL Sensitivities Schedule of Recognition of Net Deferred Outflows/(Inflows) of Resources for Year
Employer1% Decrease
(6.75%)Current Discount Rate
(7.75%) 1% Increase (8.75%) 2020 2021 2022 2023 2024 Thereafter
5289 USD 366 Woodson $ 4,860,128 $ 3,550,776 $ 2,452,000 $ (25,722) $ (109,134) $ (72,724) $ (90,596) $ (11,433) $ -
5291 USD 374 Sublette 7,546,565 5,513,469 3,807,345 39,790 (64,843) 6,724 31,209 479 -
5292 USD 375 Circle 19,581,623 14,306,199 9,879,194 (1,404) (210,064) 2,845 90,116 3,087 -
5293 USD 388 Ellis 4,819,582 3,521,154 2,431,545 57,049 (4,530) 52,824 42,994 2,494 -
5294 USD 407 Russell County 10,966,537 8,012,077 5,532,767 210,171 4,279 107,281 109,634 6,210 -
5295 USD 411 Goessel 3,510,092 2,564,449 1,770,889 91,502 34,468 56,403 60,443 4,902 -
5296 USD 435 Abilene 16,378,807 11,966,245 8,263,331 231,495 (122,131) 20,452 32,288 (3,204) -
5297 USD 461 Neodesha 8,446,796 6,171,171 4,261,523 119,879 38,841 52,906 29,891 (1,542) -
5298 USD 468 Healy 1,068,254 780,459 538,949 (20,432) (25,396) (16,979) (20,076) (2,663) -
5299 USD 471 Dexter 2,263,987 1,654,054 1,142,212 36,583 7,031 32,571 36,313 2,534 -
5300 USD 484 Fredonia 7,827,550 5,718,754 3,949,105 89,536 7,311 74,522 81,381 5,120 -
5302 USD 489 Hays 44,780,721 32,716,488 22,592,482 1,236,461 735,566 1,324,002 1,346,503 114,180 -
5303 USD 490 El Dorado 21,958,039 16,042,393 11,078,129 (2,942,232) (169,514) 339,945 264,317 15,073 -
5304 USD 491 Eudora 17,224,239 12,583,911 8,689,863 251,460 (32,129) 167,954 78,578 (1,898) -
5305 USD 492 Flinthills 3,753,718 2,742,441 1,893,802 90,488 2,089 24,490 31,032 1,463 -
5306 USD 495 Fort Larned 14,734,243 10,764,737 7,433,626 (97,587) (301,820) (39,844) 93,334 5,153 -
5307 USD 496 Pawnee Heights 2,254,249 1,646,939 1,137,299 103,556 38,872 21,173 13,539 116 -
5308 USD 497 Lawrence 140,986,815 103,004,002 71,129,762 2,579,203 (498,274) 1,533,727 1,519,560 47,509 -
5309 USD 499 Galena 9,511,155 6,948,785 4,798,507 87,076 (127,279) (8,865) 70,648 4,732 -
5310 USD 502 Lewis 1,358,446 992,471 685,354 25,936 (1,463) (119) 4,282 (96) -
5312 USD 345 Seaman 50,102,782 36,604,749 25,277,534 1,088,063 7,881 417,273 628,257 46,191 -
5313 USD 438 Skyline 3,928,913 2,870,437 1,982,190 (108,139) (98,224) 6,911 (100,396) (14,314) -
5314 USD 501 Topeka Public Schools 204,607,480 149,484,824 103,227,251 4,436,890 812,466 2,000,359 2,519,528 176,274 -
5316 USD 208 Trego County 4,641,024 3,390,700 2,341,459 53,459 (69,486) (36,259) (25,372) (4,738) -
5317 USD 246 Arma 6,203,612 4,532,317 3,129,807 44,667 (68,975) (20,213) 25,986 1,244 -
5318 USD 247 Cherokee 6,810,641 4,975,808 3,436,061 (218,960) (300,840) (165,114) (22,690) (1,486) -
5319 USD 248 Girard 10,001,240 7,306,837 5,045,761 110,712 (48,300) (89,932) (16,253) (2,372) -
5320 USD 426 Pike Valley 2,930,684 2,141,137 1,478,570 (37,128) (84,682) (26,959) 4,981 (99) -
5321 USD 498 Valley Heights 5,464,501 3,992,327 2,756,915 106,411 (18,205) (2,234) 21,412 942 -
5322 USD 504 Oswego 6,068,254 4,433,425 3,061,517 77,397 (53,167) 20,070 30,244 940 -
5324 USD 500 Kansas City 341,010,105 249,139,649 172,044,228 8,227,616 2,769,750 2,780,964 5,328,605 576,873 -
5329 USD 245 Leroy-Gridley 2,753,099 2,011,395 1,388,976 (11,685) (4,936) 59,722 38,520 2,568 -
5330 USD 493 Columbus 13,885,889 10,144,936 7,005,620 57,705 (183,258) (19,063) (8,300) (6,924) -
5331 USD 503 Parsons 16,925,550 12,365,691 8,539,170 462,751 210,894 387,343 642,002 63,908 -
5332 USD 506 Labette County 16,985,748 12,409,671 8,569,540 315,642 (53,584) 139,926 151,886 7,424 -
5333 USD 505 Chetopa 5,253,541 3,838,201 2,650,483 (48,106) (143,785) (28,113) (7) (1,750) -
5337 USD 207 Fort Leavenworth 24,024,257 17,551,958 12,120,564 881,839 138,264 337,397 362,604 25,617 -
5366 USD 508 Baxter Springs 11,172,185 8,162,322 5,636,519 15,172 (42,557) 29,231 34,849 (1,779) -
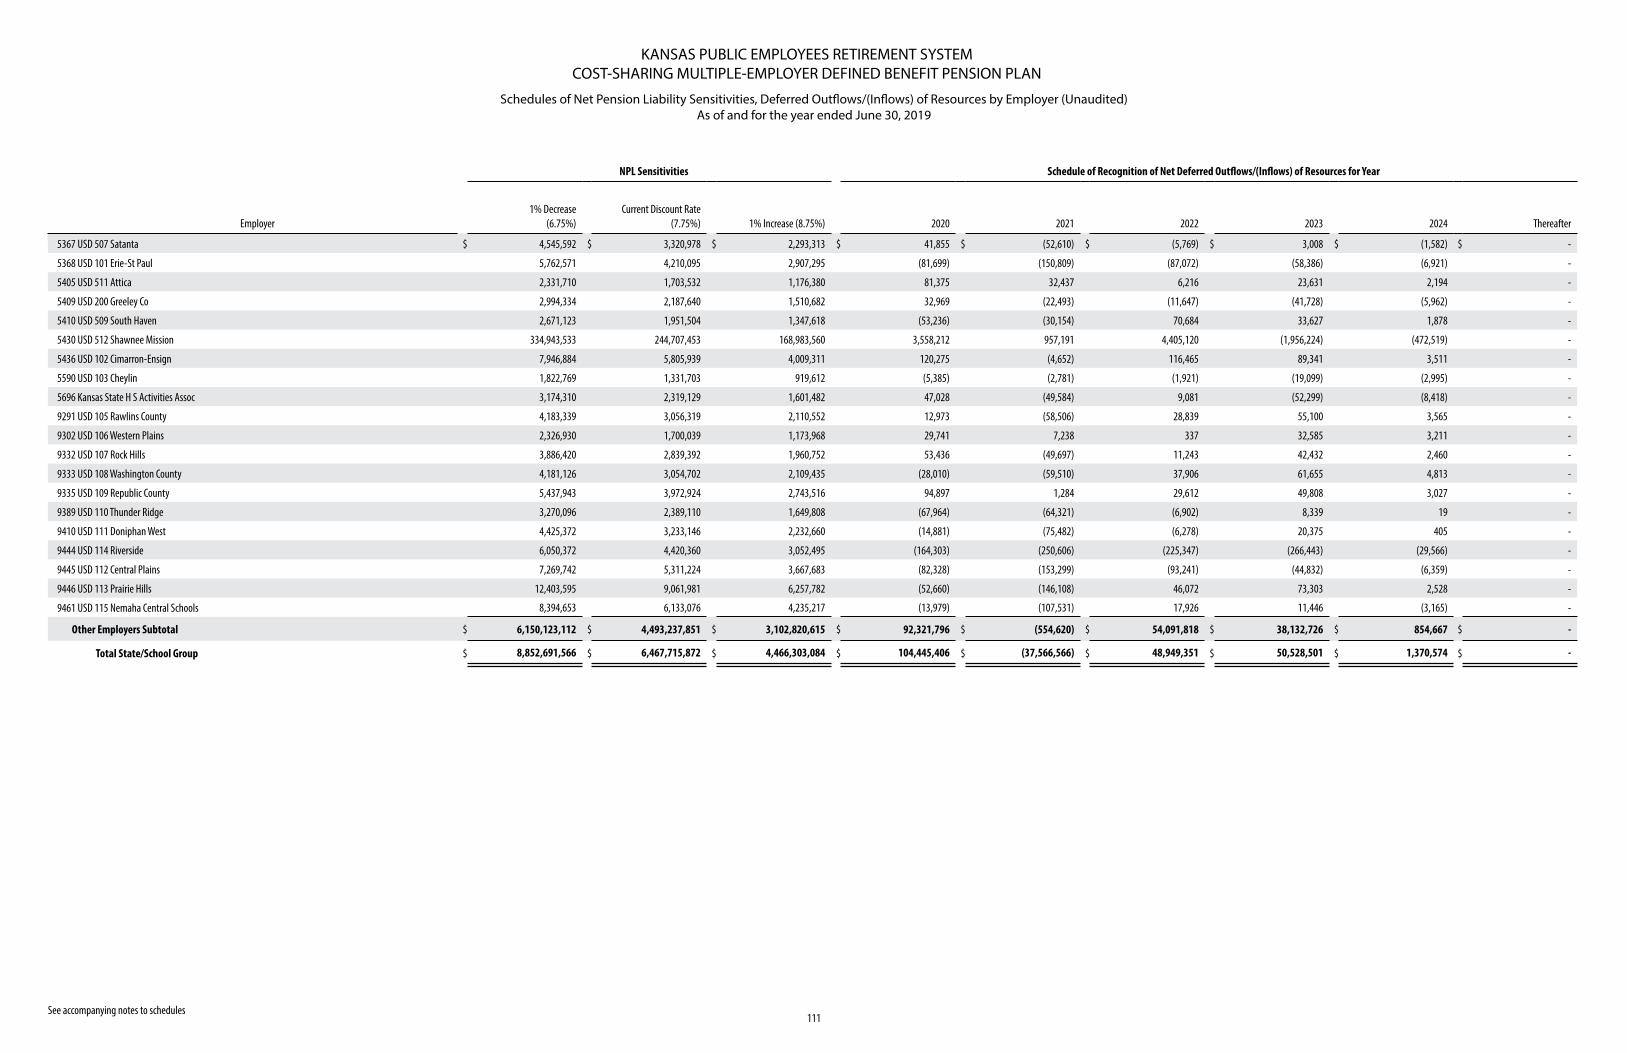
KANSAS PUBLIC EMPLOYEES RETIREMENT SYSTEMCOST-SHARING MULTIPLE-EMPLOYER DEFINED BENEFIT PENSION PLAN
Schedules of Net Pension Liability Sensitivities, Deferred Outflows/(Inflows) of Resources by Employer (Unaudited) As of and for the year ended June 30, 2019
See accompanying notes to schedules111
NPL Sensitivities Schedule of Recognition of Net Deferred Outflows/(Inflows) of Resources for Year
Employer1% Decrease
(6.75%)Current Discount Rate
(7.75%) 1% Increase (8.75%) 2020 2021 2022 2023 2024 Thereafter
5367 USD 507 Satanta $ 4,545,592 $ 3,320,978 $ 2,293,313 $ 41,855 $ (52,610) $ (5,769) $ 3,008 $ (1,582) $ -
5368 USD 101 Erie-St Paul 5,762,571 4,210,095 2,907,295 (81,699) (150,809) (87,072) (58,386) (6,921) -
5405 USD 511 Attica 2,331,710 1,703,532 1,176,380 81,375 32,437 6,216 23,631 2,194 -
5409 USD 200 Greeley Co 2,994,334 2,187,640 1,510,682 32,969 (22,493) (11,647) (41,728) (5,962) -
5410 USD 509 South Haven 2,671,123 1,951,504 1,347,618 (53,236) (30,154) 70,684 33,627 1,878 -
5430 USD 512 Shawnee Mission 334,943,533 244,707,453 168,983,560 3,558,212 957,191 4,405,120 (1,956,224) (472,519) -
5436 USD 102 Cimarron-Ensign 7,946,884 5,805,939 4,009,311 120,275 (4,652) 116,465 89,341 3,511 -
5590 USD 103 Cheylin 1,822,769 1,331,703 919,612 (5,385) (2,781) (1,921) (19,099) (2,995) -
5696 Kansas State H S Activities Assoc 3,174,310 2,319,129 1,601,482 47,028 (49,584) 9,081 (52,299) (8,418) -
9291 USD 105 Rawlins County 4,183,339 3,056,319 2,110,552 12,973 (58,506) 28,839 55,100 3,565 -
9302 USD 106 Western Plains 2,326,930 1,700,039 1,173,968 29,741 7,238 337 32,585 3,211 -
9332 USD 107 Rock Hills 3,886,420 2,839,392 1,960,752 53,436 (49,697) 11,243 42,432 2,460 -
9333 USD 108 Washington County 4,181,126 3,054,702 2,109,435 (28,010) (59,510) 37,906 61,655 4,813 -
9335 USD 109 Republic County 5,437,943 3,972,924 2,743,516 94,897 1,284 29,612 49,808 3,027 -
9389 USD 110 Thunder Ridge 3,270,096 2,389,110 1,649,808 (67,964) (64,321) (6,902) 8,339 19 -
9410 USD 111 Doniphan West 4,425,372 3,233,146 2,232,660 (14,881) (75,482) (6,278) 20,375 405 -
9444 USD 114 Riverside 6,050,372 4,420,360 3,052,495 (164,303) (250,606) (225,347) (266,443) (29,566) -
9445 USD 112 Central Plains 7,269,742 5,311,224 3,667,683 (82,328) (153,299) (93,241) (44,832) (6,359) -
9446 USD 113 Prairie Hills 12,403,595 9,061,981 6,257,782 (52,660) (146,108) 46,072 73,303 2,528 -
9461 USD 115 Nemaha Central Schools 8,394,653 6,133,076 4,235,217 (13,979) (107,531) 17,926 11,446 (3,165) -
Other Employers Subtotal $ 6,150,123,112 $ 4,493,237,851 $ 3,102,820,615 $ 92,321,796 $ (554,620) $ 54,091,818 $ 38,132,726 $ 854,667 $ -
Total State/School Group $ 8,852,691,566 $ 6,467,715,872 $ 4,466,303,084 $ 104,445,406 $ (37,566,566) $ 48,949,351 $ 50,528,501 $ 1,370,574 $ -
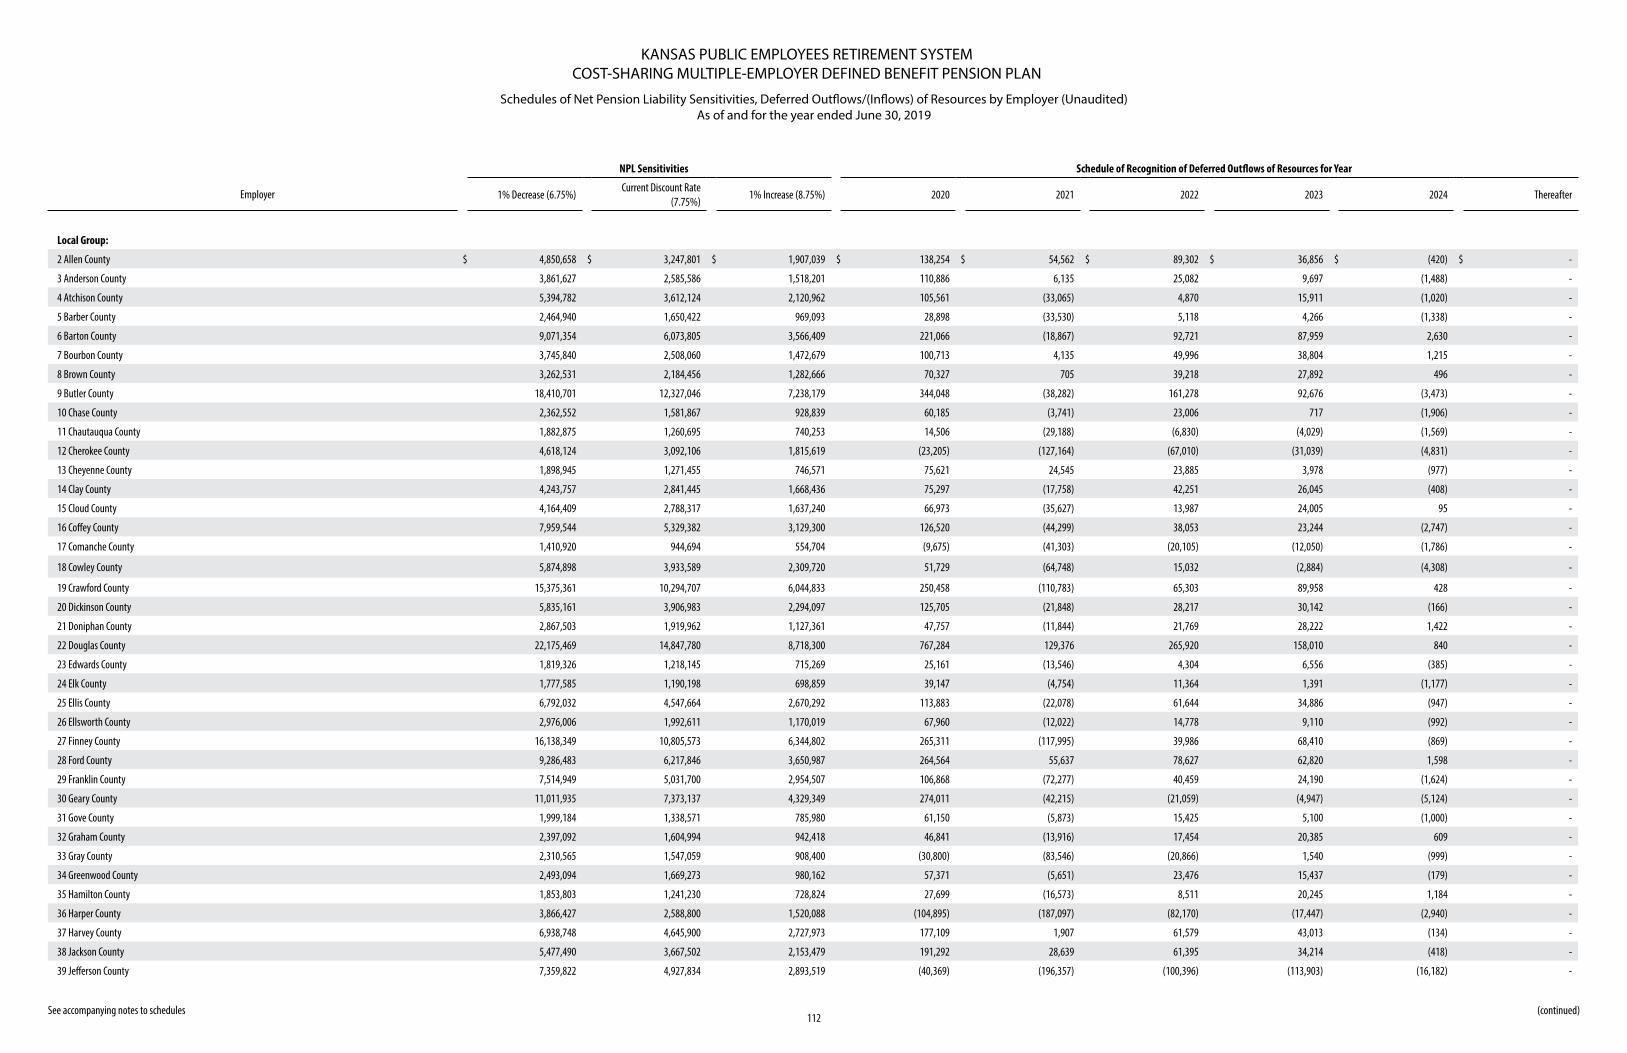
KANSAS PUBLIC EMPLOYEES RETIREMENT SYSTEMCOST-SHARING MULTIPLE-EMPLOYER DEFINED BENEFIT PENSION PLAN
Schedules of Net Pension Liability Sensitivities, Deferred Outflows/(Inflows) of Resources by Employer (Unaudited) As of and for the year ended June 30, 2019
See accompanying notes to schedules112
NPL Sensitivities Schedule of Recognition of Deferred Outflows of Resources for Year
Employer 1% Decrease (6.75%)Current Discount Rate
(7.75%)1% Increase (8.75%) 2020 2021 2022 2023 2024 Thereafter
Local Group:
2 Allen County $ 4,850,658 $ 3,247,801 $ 1,907,039 $ 138,254 $ 54,562 $ 89,302 $ 36,856 $ (420) $ -
3 Anderson County 3,861,627 2,585,586 1,518,201 110,886 6,135 25,082 9,697 (1,488) -
4 Atchison County 5,394,782 3,612,124 2,120,962 105,561 (33,065) 4,870 15,911 (1,020) -
5 Barber County 2,464,940 1,650,422 969,093 28,898 (33,530) 5,118 4,266 (1,338) -
6 Barton County 9,071,354 6,073,805 3,566,409 221,066 (18,867) 92,721 87,959 2,630 -
7 Bourbon County 3,745,840 2,508,060 1,472,679 100,713 4,135 49,996 38,804 1,215 -
8 Brown County 3,262,531 2,184,456 1,282,666 70,327 705 39,218 27,892 496 -
9 Butler County 18,410,701 12,327,046 7,238,179 344,048 (38,282) 161,278 92,676 (3,473) -
10 Chase County 2,362,552 1,581,867 928,839 60,185 (3,741) 23,006 717 (1,906) -
11 Chautauqua County 1,882,875 1,260,695 740,253 14,506 (29,188) (6,830) (4,029) (1,569) -
12 Cherokee County 4,618,124 3,092,106 1,815,619 (23,205) (127,164) (67,010) (31,039) (4,831) -
13 Cheyenne County 1,898,945 1,271,455 746,571 75,621 24,545 23,885 3,978 (977) -
14 Clay County 4,243,757 2,841,445 1,668,436 75,297 (17,758) 42,251 26,045 (408) -
15 Cloud County 4,164,409 2,788,317 1,637,240 66,973 (35,627) 13,987 24,005 95 -
16 Coffey County 7,959,544 5,329,382 3,129,300 126,520 (44,299) 38,053 23,244 (2,747) -
17 Comanche County 1,410,920 944,694 554,704 (9,675) (41,303) (20,105) (12,050) (1,786) -
18 Cowley County 5,874,898 3,933,589 2,309,720 51,729 (64,748) 15,032 (2,884) (4,308) -
19 Crawford County 15,375,361 10,294,707 6,044,833 250,458 (110,783) 65,303 89,958 428 -
20 Dickinson County 5,835,161 3,906,983 2,294,097 125,705 (21,848) 28,217 30,142 (166) -
21 Doniphan County 2,867,503 1,919,962 1,127,361 47,757 (11,844) 21,769 28,222 1,422 -
22 Douglas County 22,175,469 14,847,780 8,718,300 767,284 129,376 265,920 158,010 840 -
23 Edwards County 1,819,326 1,218,145 715,269 25,161 (13,546) 4,304 6,556 (385) -
24 Elk County 1,777,585 1,190,198 698,859 39,147 (4,754) 11,364 1,391 (1,177) -
25 Ellis County 6,792,032 4,547,664 2,670,292 113,883 (22,078) 61,644 34,886 (947) -
26 Ellsworth County 2,976,006 1,992,611 1,170,019 67,960 (12,022) 14,778 9,110 (992) -
27 Finney County 16,138,349 10,805,573 6,344,802 265,311 (117,995) 39,986 68,410 (869) -
28 Ford County 9,286,483 6,217,846 3,650,987 264,564 55,637 78,627 62,820 1,598 -
29 Franklin County 7,514,949 5,031,700 2,954,507 106,868 (72,277) 40,459 24,190 (1,624) -
30 Geary County 11,011,935 7,373,137 4,329,349 274,011 (42,215) (21,059) (4,947) (5,124) -
31 Gove County 1,999,184 1,338,571 785,980 61,150 (5,873) 15,425 5,100 (1,000) -
32 Graham County 2,397,092 1,604,994 942,418 46,841 (13,916) 17,454 20,385 609 -
33 Gray County 2,310,565 1,547,059 908,400 (30,800) (83,546) (20,866) 1,540 (999) -
34 Greenwood County 2,493,094 1,669,273 980,162 57,371 (5,651) 23,476 15,437 (179) -
35 Hamilton County 1,853,803 1,241,230 728,824 27,699 (16,573) 8,511 20,245 1,184 -
36 Harper County 3,866,427 2,588,800 1,520,088 (104,895) (187,097) (82,170) (17,447) (2,940) -
37 Harvey County 6,938,748 4,645,900 2,727,973 177,109 1,907 61,579 43,013 (134) -
38 Jackson County 5,477,490 3,667,502 2,153,479 191,292 28,639 61,395 34,214 (418) -
39 Jefferson County 7,359,822 4,927,834 2,893,519 (40,369) (196,357) (100,396) (113,903) (16,182) -
(continued)
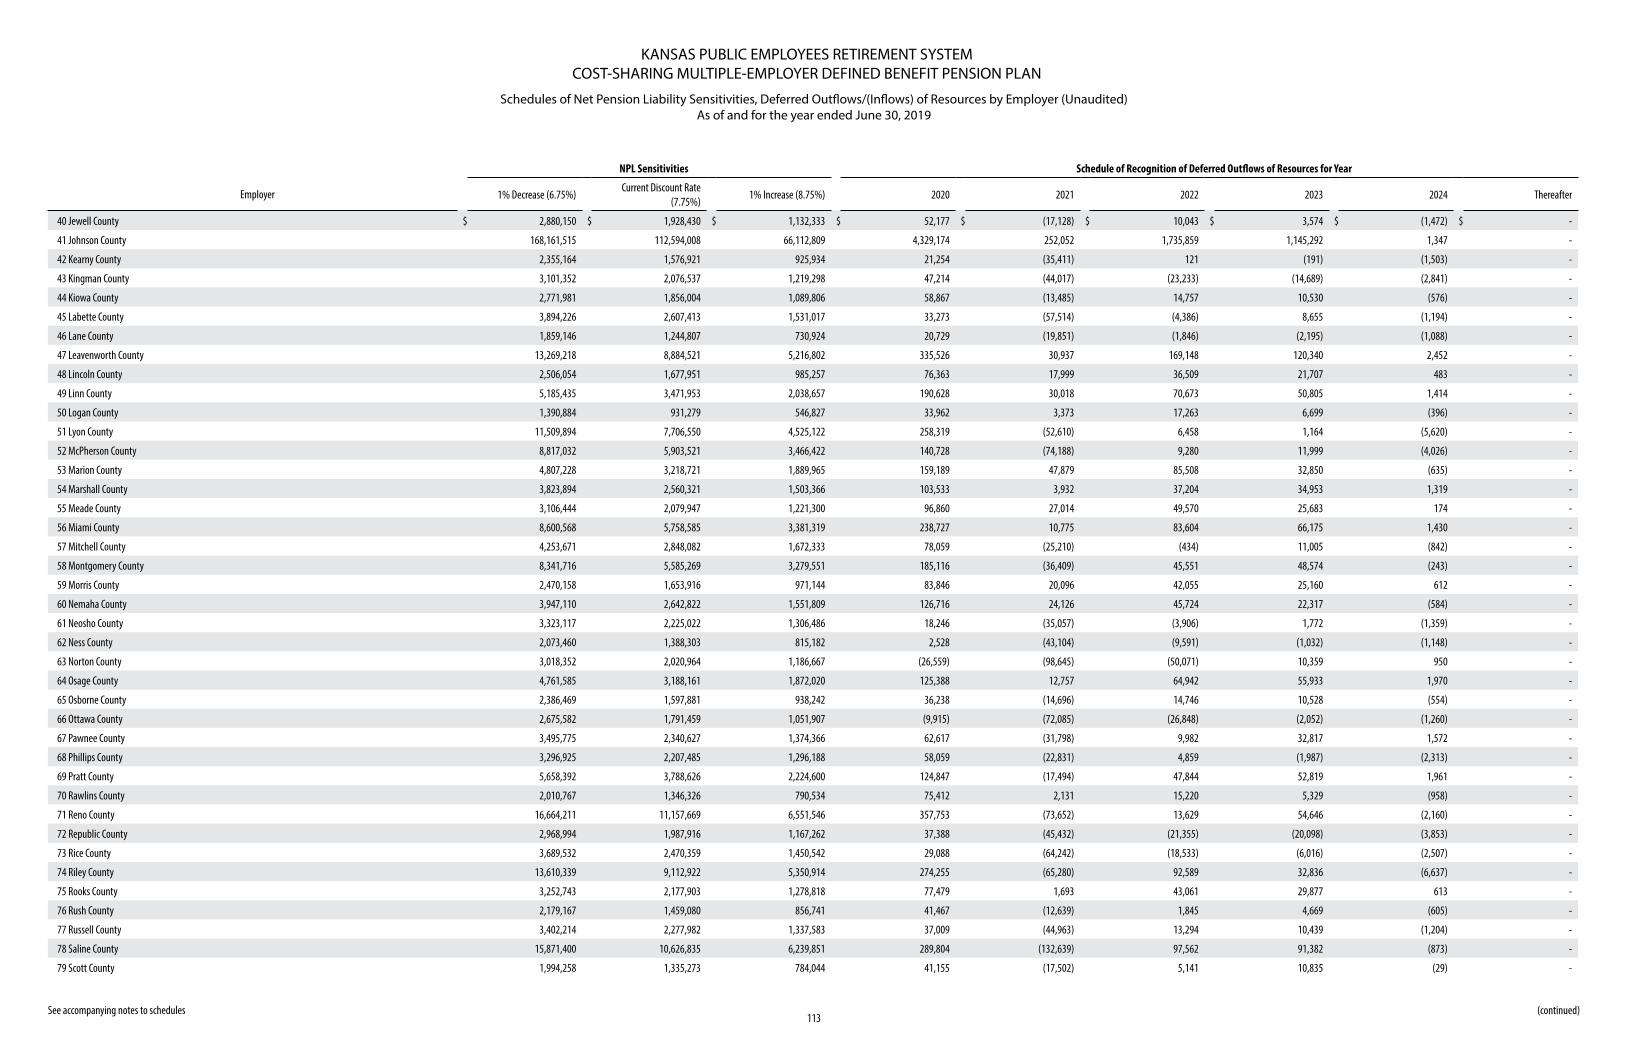
KANSAS PUBLIC EMPLOYEES RETIREMENT SYSTEMCOST-SHARING MULTIPLE-EMPLOYER DEFINED BENEFIT PENSION PLAN
Schedules of Net Pension Liability Sensitivities, Deferred Outflows/(Inflows) of Resources by Employer (Unaudited) As of and for the year ended June 30, 2019
See accompanying notes to schedules113
(continued)
NPL Sensitivities Schedule of Recognition of Deferred Outflows of Resources for Year
Employer 1% Decrease (6.75%)Current Discount Rate
(7.75%)1% Increase (8.75%) 2020 2021 2022 2023 2024 Thereafter
40 Jewell County $ 2,880,150 $ 1,928,430 $ 1,132,333 $ 52,177 $ (17,128) $ 10,043 $ 3,574 $ (1,472) $ -
41 Johnson County 168,161,515 112,594,008 66,112,809 4,329,174 252,052 1,735,859 1,145,292 1,347 -
42 Kearny County 2,355,164 1,576,921 925,934 21,254 (35,411) 121 (191) (1,503) -
43 Kingman County 3,101,352 2,076,537 1,219,298 47,214 (44,017) (23,233) (14,689) (2,841) -
44 Kiowa County 2,771,981 1,856,004 1,089,806 58,867 (13,485) 14,757 10,530 (576) -
45 Labette County 3,894,226 2,607,413 1,531,017 33,273 (57,514) (4,386) 8,655 (1,194) -
46 Lane County 1,859,146 1,244,807 730,924 20,729 (19,851) (1,846) (2,195) (1,088) -
47 Leavenworth County 13,269,218 8,884,521 5,216,802 335,526 30,937 169,148 120,340 2,452 -
48 Lincoln County 2,506,054 1,677,951 985,257 76,363 17,999 36,509 21,707 483 -
49 Linn County 5,185,435 3,471,953 2,038,657 190,628 30,018 70,673 50,805 1,414 -
50 Logan County 1,390,884 931,279 546,827 33,962 3,373 17,263 6,699 (396) -
51 Lyon County 11,509,894 7,706,550 4,525,122 258,319 (52,610) 6,458 1,164 (5,620) -
52 McPherson County 8,817,032 5,903,521 3,466,422 140,728 (74,188) 9,280 11,999 (4,026) -
53 Marion County 4,807,228 3,218,721 1,889,965 159,189 47,879 85,508 32,850 (635) -
54 Marshall County 3,823,894 2,560,321 1,503,366 103,533 3,932 37,204 34,953 1,319 -
55 Meade County 3,106,444 2,079,947 1,221,300 96,860 27,014 49,570 25,683 174 -
56 Miami County 8,600,568 5,758,585 3,381,319 238,727 10,775 83,604 66,175 1,430 -
57 Mitchell County 4,253,671 2,848,082 1,672,333 78,059 (25,210) (434) 11,005 (842) -
58 Montgomery County 8,341,716 5,585,269 3,279,551 185,116 (36,409) 45,551 48,574 (243) -
59 Morris County 2,470,158 1,653,916 971,144 83,846 20,096 42,055 25,160 612 -
60 Nemaha County 3,947,110 2,642,822 1,551,809 126,716 24,126 45,724 22,317 (584) -
61 Neosho County 3,323,117 2,225,022 1,306,486 18,246 (35,057) (3,906) 1,772 (1,359) -
62 Ness County 2,073,460 1,388,303 815,182 2,528 (43,104) (9,591) (1,032) (1,148) -
63 Norton County 3,018,352 2,020,964 1,186,667 (26,559) (98,645) (50,071) 10,359 950 -
64 Osage County 4,761,585 3,188,161 1,872,020 125,388 12,757 64,942 55,933 1,970 -
65 Osborne County 2,386,469 1,597,881 938,242 36,238 (14,696) 14,746 10,528 (554) -
66 Ottawa County 2,675,582 1,791,459 1,051,907 (9,915) (72,085) (26,848) (2,052) (1,260) -
67 Pawnee County 3,495,775 2,340,627 1,374,366 62,617 (31,798) 9,982 32,817 1,572 -
68 Phillips County 3,296,925 2,207,485 1,296,188 58,059 (22,831) 4,859 (1,987) (2,313) -
69 Pratt County 5,658,392 3,788,626 2,224,600 124,847 (17,494) 47,844 52,819 1,961 -
70 Rawlins County 2,010,767 1,346,326 790,534 75,412 2,131 15,220 5,329 (958) -
71 Reno County 16,664,211 11,157,669 6,551,546 357,753 (73,652) 13,629 54,646 (2,160) -
72 Republic County 2,968,994 1,987,916 1,167,262 37,388 (45,432) (21,355) (20,098) (3,853) -
73 Rice County 3,689,532 2,470,359 1,450,542 29,088 (64,242) (18,533) (6,016) (2,507) -
74 Riley County 13,610,339 9,112,922 5,350,914 274,255 (65,280) 92,589 32,836 (6,637) -
75 Rooks County 3,252,743 2,177,903 1,278,818 77,479 1,693 43,061 29,877 613 -
76 Rush County 2,179,167 1,459,080 856,741 41,467 (12,639) 1,845 4,669 (605) -
77 Russell County 3,402,214 2,277,982 1,337,583 37,009 (44,963) 13,294 10,439 (1,204) -
78 Saline County 15,871,400 10,626,835 6,239,851 289,804 (132,639) 97,562 91,382 (873) -
79 Scott County 1,994,258 1,335,273 784,044 41,155 (17,502) 5,141 10,835 (29) -
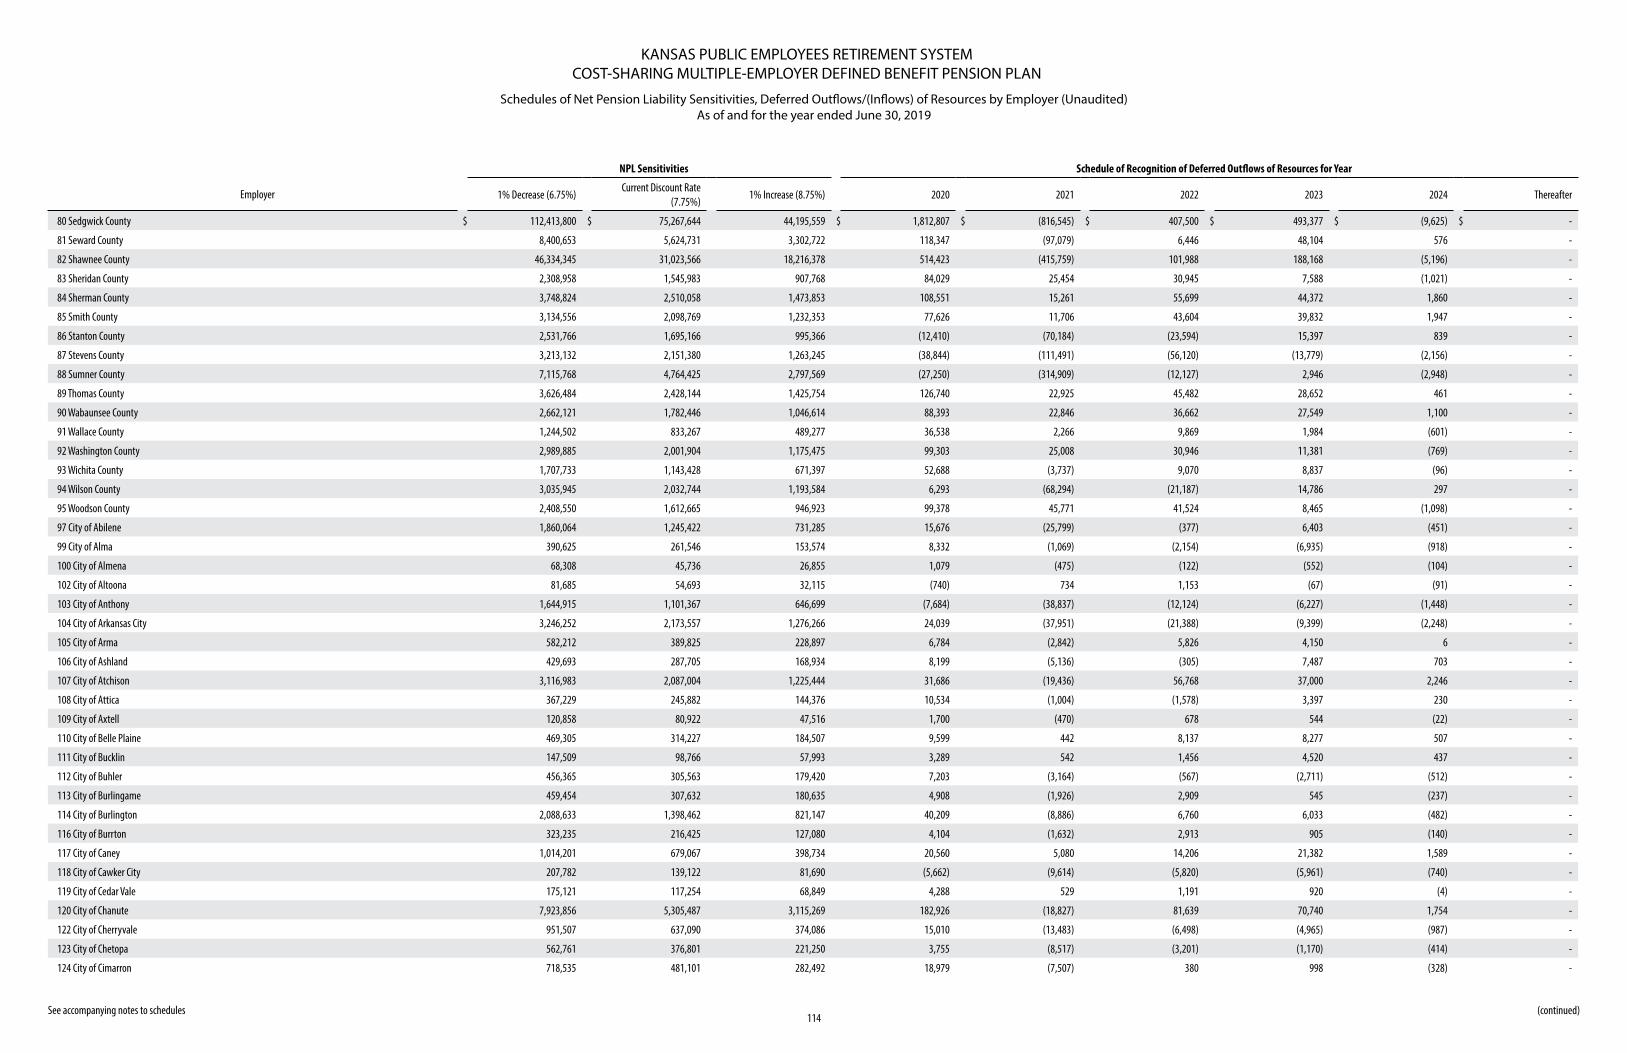
KANSAS PUBLIC EMPLOYEES RETIREMENT SYSTEMCOST-SHARING MULTIPLE-EMPLOYER DEFINED BENEFIT PENSION PLAN
Schedules of Net Pension Liability Sensitivities, Deferred Outflows/(Inflows) of Resources by Employer (Unaudited) As of and for the year ended June 30, 2019
See accompanying notes to schedules114
(continued)
NPL Sensitivities Schedule of Recognition of Deferred Outflows of Resources for Year
Employer 1% Decrease (6.75%)Current Discount Rate
(7.75%)1% Increase (8.75%) 2020 2021 2022 2023 2024 Thereafter
80 Sedgwick County $ 112,413,800 $ 75,267,644 44,195,559 $ 1,812,807 $ (816,545) $ 407,500 $ 493,377 $ (9,625) $ -
81 Seward County 8,400,653 5,624,731 3,302,722 118,347 (97,079) 6,446 48,104 576 -
82 Shawnee County 46,334,345 31,023,566 18,216,378 514,423 (415,759) 101,988 188,168 (5,196) -
83 Sheridan County 2,308,958 1,545,983 907,768 84,029 25,454 30,945 7,588 (1,021) -
84 Sherman County 3,748,824 2,510,058 1,473,853 108,551 15,261 55,699 44,372 1,860 -
85 Smith County 3,134,556 2,098,769 1,232,353 77,626 11,706 43,604 39,832 1,947 -
86 Stanton County 2,531,766 1,695,166 995,366 (12,410) (70,184) (23,594) 15,397 839 -
87 Stevens County 3,213,132 2,151,380 1,263,245 (38,844) (111,491) (56,120) (13,779) (2,156) -
88 Sumner County 7,115,768 4,764,425 2,797,569 (27,250) (314,909) (12,127) 2,946 (2,948) -
89 Thomas County 3,626,484 2,428,144 1,425,754 126,740 22,925 45,482 28,652 461 -
90 Wabaunsee County 2,662,121 1,782,446 1,046,614 88,393 22,846 36,662 27,549 1,100 -
91 Wallace County 1,244,502 833,267 489,277 36,538 2,266 9,869 1,984 (601) -
92 Washington County 2,989,885 2,001,904 1,175,475 99,303 25,008 30,946 11,381 (769) -
93 Wichita County 1,707,733 1,143,428 671,397 52,688 (3,737) 9,070 8,837 (96) -
94 Wilson County 3,035,945 2,032,744 1,193,584 6,293 (68,294) (21,187) 14,786 297 -
95 Woodson County 2,408,550 1,612,665 946,923 99,378 45,771 41,524 8,465 (1,098) -
97 City of Abilene 1,860,064 1,245,422 731,285 15,676 (25,799) (377) 6,403 (451) -
99 City of Alma 390,625 261,546 153,574 8,332 (1,069) (2,154) (6,935) (918) -
100 City of Almena 68,308 45,736 26,855 1,079 (475) (122) (552) (104) -
102 City of Altoona 81,685 54,693 32,115 (740) 734 1,153 (67) (91) -
103 City of Anthony 1,644,915 1,101,367 646,699 (7,684) (38,837) (12,124) (6,227) (1,448) -
104 City of Arkansas City 3,246,252 2,173,557 1,276,266 24,039 (37,951) (21,388) (9,399) (2,248) -
105 City of Arma 582,212 389,825 228,897 6,784 (2,842) 5,826 4,150 6 -
106 City of Ashland 429,693 287,705 168,934 8,199 (5,136) (305) 7,487 703 -
107 City of Atchison 3,116,983 2,087,004 1,225,444 31,686 (19,436) 56,768 37,000 2,246 -
108 City of Attica 367,229 245,882 144,376 10,534 (1,004) (1,578) 3,397 230 -
109 City of Axtell 120,858 80,922 47,516 1,700 (470) 678 544 (22) -
110 City of Belle Plaine 469,305 314,227 184,507 9,599 442 8,137 8,277 507 -
111 City of Bucklin 147,509 98,766 57,993 3,289 542 1,456 4,520 437 -
112 City of Buhler 456,365 305,563 179,420 7,203 (3,164) (567) (2,711) (512) -
113 City of Burlingame 459,454 307,632 180,635 4,908 (1,926) 2,909 545 (237) -
114 City of Burlington 2,088,633 1,398,462 821,147 40,209 (8,886) 6,760 6,033 (482) -
116 City of Burrton 323,235 216,425 127,080 4,104 (1,632) 2,913 905 (140) -
117 City of Caney 1,014,201 679,067 398,734 20,560 5,080 14,206 21,382 1,589 -
118 City of Cawker City 207,782 139,122 81,690 (5,662) (9,614) (5,820) (5,961) (740) -
119 City of Cedar Vale 175,121 117,254 68,849 4,288 529 1,191 920 (4) -
120 City of Chanute 7,923,856 5,305,487 3,115,269 182,926 (18,827) 81,639 70,740 1,754 -
122 City of Cherryvale 951,507 637,090 374,086 15,010 (13,483) (6,498) (4,965) (987) -
123 City of Chetopa 562,761 376,801 221,250 3,755 (8,517) (3,201) (1,170) (414) -
124 City of Cimarron 718,535 481,101 282,492 18,979 (7,507) 380 998 (328) -
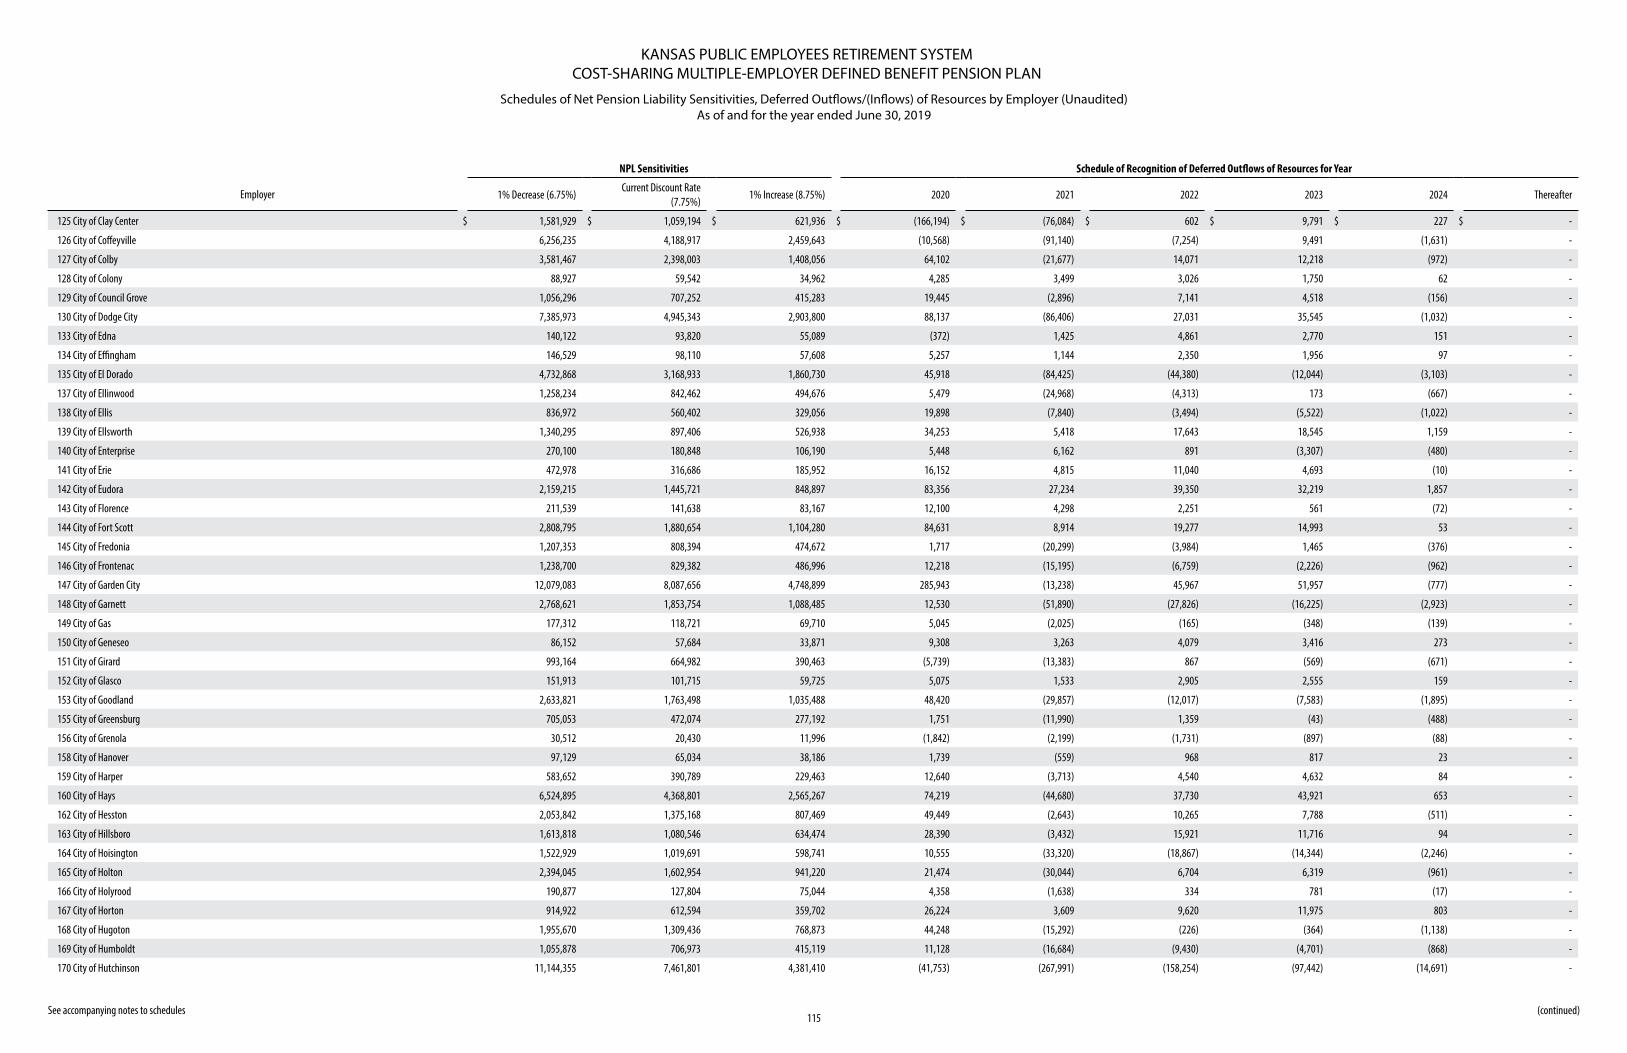
KANSAS PUBLIC EMPLOYEES RETIREMENT SYSTEMCOST-SHARING MULTIPLE-EMPLOYER DEFINED BENEFIT PENSION PLAN
Schedules of Net Pension Liability Sensitivities, Deferred Outflows/(Inflows) of Resources by Employer (Unaudited) As of and for the year ended June 30, 2019
See accompanying notes to schedules115
(continued)
NPL Sensitivities Schedule of Recognition of Deferred Outflows of Resources for Year
Employer 1% Decrease (6.75%)Current Discount Rate
(7.75%)1% Increase (8.75%) 2020 2021 2022 2023 2024 Thereafter
125 City of Clay Center $ 1,581,929 $ 1,059,194 $ 621,936 $ (166,194) $ (76,084) $ 602 $ 9,791 $ 227 $ -
126 City of Coffeyville 6,256,235 4,188,917 2,459,643 (10,568) (91,140) (7,254) 9,491 (1,631) -
127 City of Colby 3,581,467 2,398,003 1,408,056 64,102 (21,677) 14,071 12,218 (972) -
128 City of Colony 88,927 59,542 34,962 4,285 3,499 3,026 1,750 62 -
129 City of Council Grove 1,056,296 707,252 415,283 19,445 (2,896) 7,141 4,518 (156) -
130 City of Dodge City 7,385,973 4,945,343 2,903,800 88,137 (86,406) 27,031 35,545 (1,032) -
133 City of Edna 140,122 93,820 55,089 (372) 1,425 4,861 2,770 151 -
134 City of Effingham 146,529 98,110 57,608 5,257 1,144 2,350 1,956 97 -
135 City of El Dorado 4,732,868 3,168,933 1,860,730 45,918 (84,425) (44,380) (12,044) (3,103) -
137 City of Ellinwood 1,258,234 842,462 494,676 5,479 (24,968) (4,313) 173 (667) -
138 City of Ellis 836,972 560,402 329,056 19,898 (7,840) (3,494) (5,522) (1,022) -
139 City of Ellsworth 1,340,295 897,406 526,938 34,253 5,418 17,643 18,545 1,159 -
140 City of Enterprise 270,100 180,848 106,190 5,448 6,162 891 (3,307) (480) -
141 City of Erie 472,978 316,686 185,952 16,152 4,815 11,040 4,693 (10) -
142 City of Eudora 2,159,215 1,445,721 848,897 83,356 27,234 39,350 32,219 1,857 -
143 City of Florence 211,539 141,638 83,167 12,100 4,298 2,251 561 (72) -
144 City of Fort Scott 2,808,795 1,880,654 1,104,280 84,631 8,914 19,277 14,993 53 -
145 City of Fredonia 1,207,353 808,394 474,672 1,717 (20,299) (3,984) 1,465 (376) -
146 City of Frontenac 1,238,700 829,382 486,996 12,218 (15,195) (6,759) (2,226) (962) -
147 City of Garden City 12,079,083 8,087,656 4,748,899 285,943 (13,238) 45,967 51,957 (777) -
148 City of Garnett 2,768,621 1,853,754 1,088,485 12,530 (51,890) (27,826) (16,225) (2,923) -
149 City of Gas 177,312 118,721 69,710 5,045 (2,025) (165) (348) (139) -
150 City of Geneseo 86,152 57,684 33,871 9,308 3,263 4,079 3,416 273 -
151 City of Girard 993,164 664,982 390,463 (5,739) (13,383) 867 (569) (671) -
152 City of Glasco 151,913 101,715 59,725 5,075 1,533 2,905 2,555 159 -
153 City of Goodland 2,633,821 1,763,498 1,035,488 48,420 (29,857) (12,017) (7,583) (1,895) -
155 City of Greensburg 705,053 472,074 277,192 1,751 (11,990) 1,359 (43) (488) -
156 City of Grenola 30,512 20,430 11,996 (1,842) (2,199) (1,731) (897) (88) -
158 City of Hanover 97,129 65,034 38,186 1,739 (559) 968 817 23 -
159 City of Harper 583,652 390,789 229,463 12,640 (3,713) 4,540 4,632 84 -
160 City of Hays 6,524,895 4,368,801 2,565,267 74,219 (44,680) 37,730 43,921 653 -
162 City of Hesston 2,053,842 1,375,168 807,469 49,449 (2,643) 10,265 7,788 (511) -
163 City of Hillsboro 1,613,818 1,080,546 634,474 28,390 (3,432) 15,921 11,716 94 -
164 City of Hoisington 1,522,929 1,019,691 598,741 10,555 (33,320) (18,867) (14,344) (2,246) -
165 City of Holton 2,394,045 1,602,954 941,220 21,474 (30,044) 6,704 6,319 (961) -
166 City of Holyrood 190,877 127,804 75,044 4,358 (1,638) 334 781 (17) -
167 City of Horton 914,922 612,594 359,702 26,224 3,609 9,620 11,975 803 -
168 City of Hugoton 1,955,670 1,309,436 768,873 44,248 (15,292) (226) (364) (1,138) -
169 City of Humboldt 1,055,878 706,973 415,119 11,128 (16,684) (9,430) (4,701) (868) -
170 City of Hutchinson 11,144,355 7,461,801 4,381,410 (41,753) (267,991) (158,254) (97,442) (14,691) -
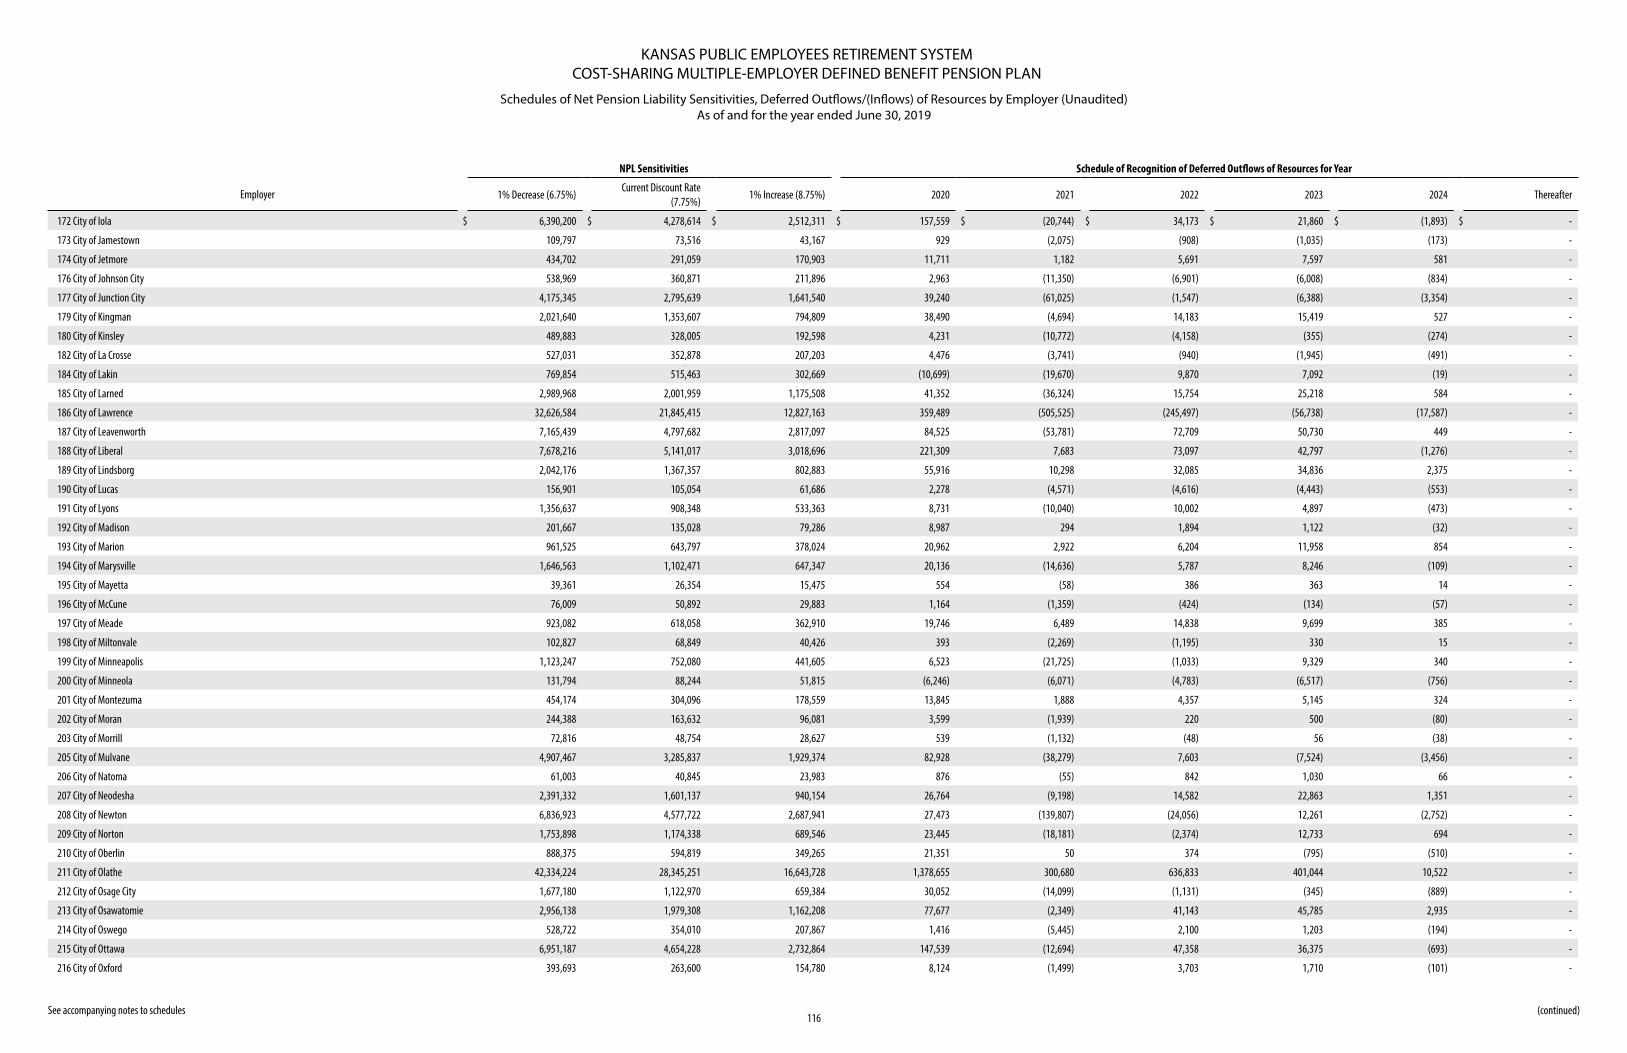
KANSAS PUBLIC EMPLOYEES RETIREMENT SYSTEMCOST-SHARING MULTIPLE-EMPLOYER DEFINED BENEFIT PENSION PLAN
Schedules of Net Pension Liability Sensitivities, Deferred Outflows/(Inflows) of Resources by Employer (Unaudited) As of and for the year ended June 30, 2019
See accompanying notes to schedules116
(continued)
NPL Sensitivities Schedule of Recognition of Deferred Outflows of Resources for Year
Employer 1% Decrease (6.75%)Current Discount Rate
(7.75%)1% Increase (8.75%) 2020 2021 2022 2023 2024 Thereafter
172 City of Iola $ 6,390,200 $ 4,278,614 $ 2,512,311 $ 157,559 $ (20,744) $ 34,173 $ 21,860 $ (1,893) $ -
173 City of Jamestown 109,797 73,516 43,167 929 (2,075) (908) (1,035) (173) -
174 City of Jetmore 434,702 291,059 170,903 11,711 1,182 5,691 7,597 581 -
176 City of Johnson City 538,969 360,871 211,896 2,963 (11,350) (6,901) (6,008) (834) -
177 City of Junction City 4,175,345 2,795,639 1,641,540 39,240 (61,025) (1,547) (6,388) (3,354) -
179 City of Kingman 2,021,640 1,353,607 794,809 38,490 (4,694) 14,183 15,419 527 -
180 City of Kinsley 489,883 328,005 192,598 4,231 (10,772) (4,158) (355) (274) -
182 City of La Crosse 527,031 352,878 207,203 4,476 (3,741) (940) (1,945) (491) -
184 City of Lakin 769,854 515,463 302,669 (10,699) (19,670) 9,870 7,092 (19) -
185 City of Larned 2,989,968 2,001,959 1,175,508 41,352 (36,324) 15,754 25,218 584 -
186 City of Lawrence 32,626,584 21,845,415 12,827,163 359,489 (505,525) (245,497) (56,738) (17,587) -
187 City of Leavenworth 7,165,439 4,797,682 2,817,097 84,525 (53,781) 72,709 50,730 449 -
188 City of Liberal 7,678,216 5,141,017 3,018,696 221,309 7,683 73,097 42,797 (1,276) -
189 City of Lindsborg 2,042,176 1,367,357 802,883 55,916 10,298 32,085 34,836 2,375 -
190 City of Lucas 156,901 105,054 61,686 2,278 (4,571) (4,616) (4,443) (553) -
191 City of Lyons 1,356,637 908,348 533,363 8,731 (10,040) 10,002 4,897 (473) -
192 City of Madison 201,667 135,028 79,286 8,987 294 1,894 1,122 (32) -
193 City of Marion 961,525 643,797 378,024 20,962 2,922 6,204 11,958 854 -
194 City of Marysville 1,646,563 1,102,471 647,347 20,136 (14,636) 5,787 8,246 (109) -
195 City of Mayetta 39,361 26,354 15,475 554 (58) 386 363 14 -
196 City of McCune 76,009 50,892 29,883 1,164 (1,359) (424) (134) (57) -
197 City of Meade 923,082 618,058 362,910 19,746 6,489 14,838 9,699 385 -
198 City of Miltonvale 102,827 68,849 40,426 393 (2,269) (1,195) 330 15 -
199 City of Minneapolis 1,123,247 752,080 441,605 6,523 (21,725) (1,033) 9,329 340 -
200 City of Minneola 131,794 88,244 51,815 (6,246) (6,071) (4,783) (6,517) (756) -
201 City of Montezuma 454,174 304,096 178,559 13,845 1,888 4,357 5,145 324 -
202 City of Moran 244,388 163,632 96,081 3,599 (1,939) 220 500 (80) -
203 City of Morrill 72,816 48,754 28,627 539 (1,132) (48) 56 (38) -
205 City of Mulvane 4,907,467 3,285,837 1,929,374 82,928 (38,279) 7,603 (7,524) (3,456) -
206 City of Natoma 61,003 40,845 23,983 876 (55) 842 1,030 66 -
207 City of Neodesha 2,391,332 1,601,137 940,154 26,764 (9,198) 14,582 22,863 1,351 -
208 City of Newton 6,836,923 4,577,722 2,687,941 27,473 (139,807) (24,056) 12,261 (2,752) -
209 City of Norton 1,753,898 1,174,338 689,546 23,445 (18,181) (2,374) 12,733 694 -
210 City of Oberlin 888,375 594,819 349,265 21,351 50 374 (795) (510) -
211 City of Olathe 42,334,224 28,345,251 16,643,728 1,378,655 300,680 636,833 401,044 10,522 -
212 City of Osage City 1,677,180 1,122,970 659,384 30,052 (14,099) (1,131) (345) (889) -
213 City of Osawatomie 2,956,138 1,979,308 1,162,208 77,677 (2,349) 41,143 45,785 2,935 -
214 City of Oswego 528,722 354,010 207,867 1,416 (5,445) 2,100 1,203 (194) -
215 City of Ottawa 6,951,187 4,654,228 2,732,864 147,539 (12,694) 47,358 36,375 (693) -
216 City of Oxford 393,693 263,600 154,780 8,124 (1,499) 3,703 1,710 (101) -
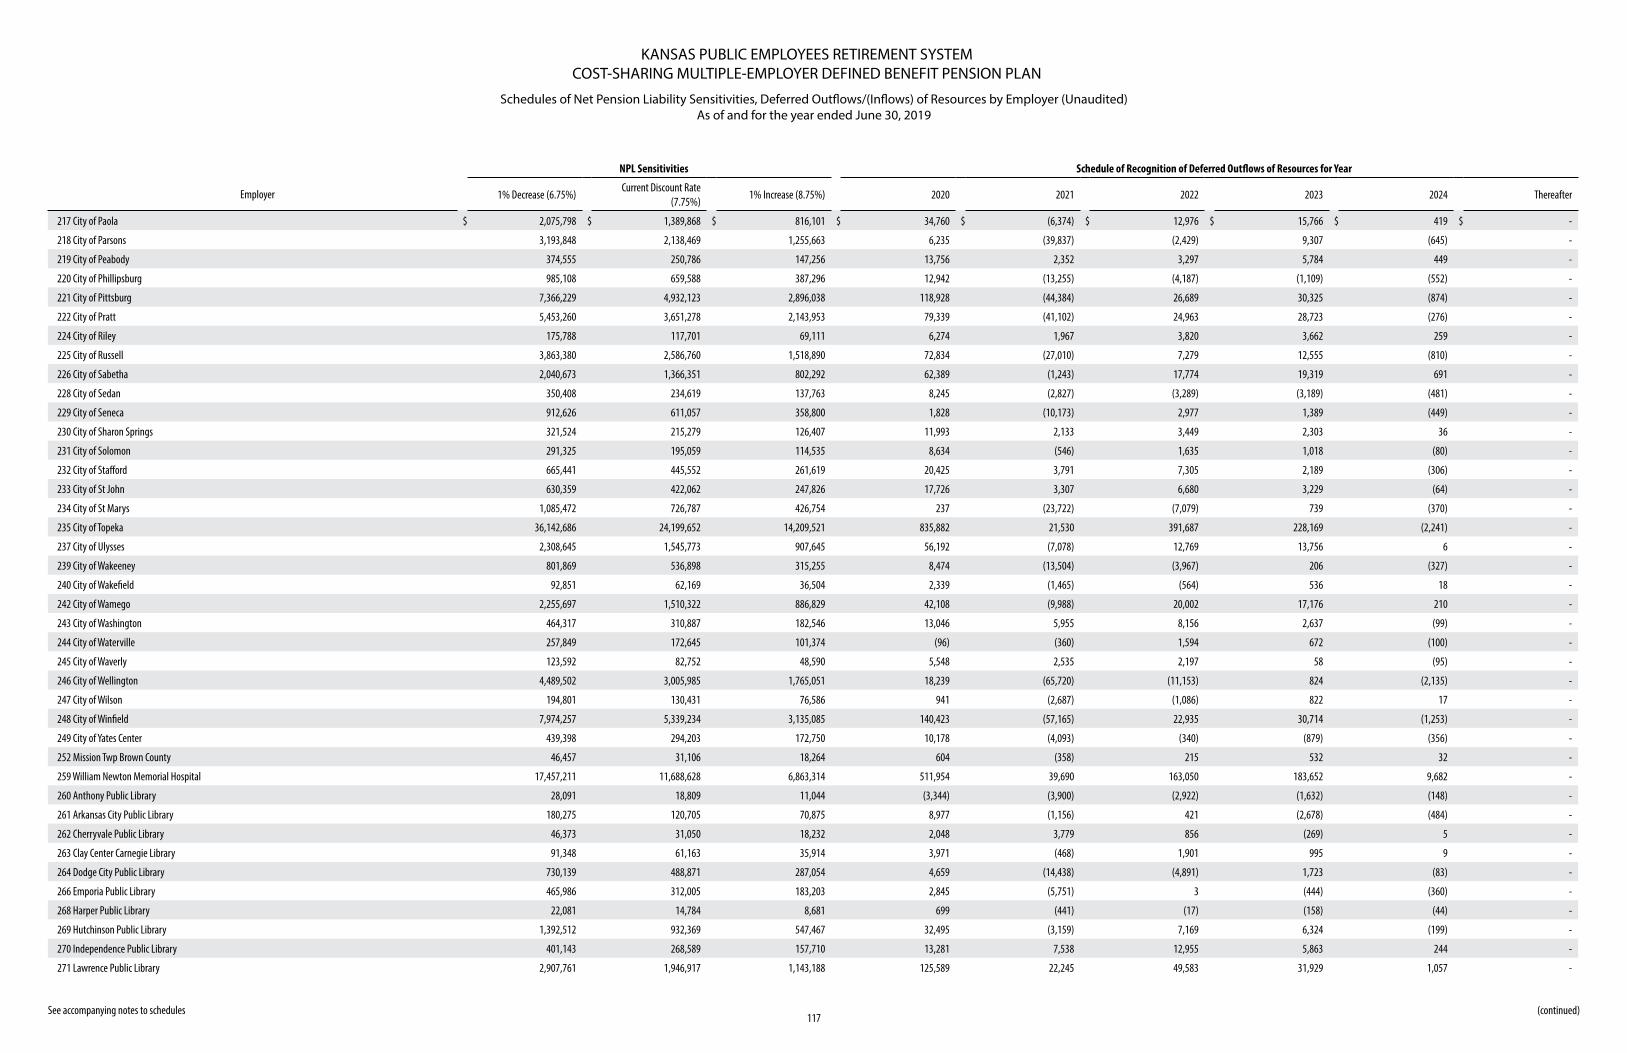
KANSAS PUBLIC EMPLOYEES RETIREMENT SYSTEMCOST-SHARING MULTIPLE-EMPLOYER DEFINED BENEFIT PENSION PLAN
Schedules of Net Pension Liability Sensitivities, Deferred Outflows/(Inflows) of Resources by Employer (Unaudited) As of and for the year ended June 30, 2019
See accompanying notes to schedules117
(continued)
NPL Sensitivities Schedule of Recognition of Deferred Outflows of Resources for Year
Employer 1% Decrease (6.75%)Current Discount Rate
(7.75%)1% Increase (8.75%) 2020 2021 2022 2023 2024 Thereafter
217 City of Paola $ 2,075,798 $ 1,389,868 $ 816,101 $ 34,760 $ (6,374) $ 12,976 $ 15,766 $ 419 $ -
218 City of Parsons 3,193,848 2,138,469 1,255,663 6,235 (39,837) (2,429) 9,307 (645) -
219 City of Peabody 374,555 250,786 147,256 13,756 2,352 3,297 5,784 449 -
220 City of Phillipsburg 985,108 659,588 387,296 12,942 (13,255) (4,187) (1,109) (552) -
221 City of Pittsburg 7,366,229 4,932,123 2,896,038 118,928 (44,384) 26,689 30,325 (874) -
222 City of Pratt 5,453,260 3,651,278 2,143,953 79,339 (41,102) 24,963 28,723 (276) -
224 City of Riley 175,788 117,701 69,111 6,274 1,967 3,820 3,662 259 -
225 City of Russell 3,863,380 2,586,760 1,518,890 72,834 (27,010) 7,279 12,555 (810) -
226 City of Sabetha 2,040,673 1,366,351 802,292 62,389 (1,243) 17,774 19,319 691 -
228 City of Sedan 350,408 234,619 137,763 8,245 (2,827) (3,289) (3,189) (481) -
229 City of Seneca 912,626 611,057 358,800 1,828 (10,173) 2,977 1,389 (449) -
230 City of Sharon Springs 321,524 215,279 126,407 11,993 2,133 3,449 2,303 36 -
231 City of Solomon 291,325 195,059 114,535 8,634 (546) 1,635 1,018 (80) -
232 City of Stafford 665,441 445,552 261,619 20,425 3,791 7,305 2,189 (306) -
233 City of St John 630,359 422,062 247,826 17,726 3,307 6,680 3,229 (64) -
234 City of St Marys 1,085,472 726,787 426,754 237 (23,722) (7,079) 739 (370) -
235 City of Topeka 36,142,686 24,199,652 14,209,521 835,882 21,530 391,687 228,169 (2,241) -
237 City of Ulysses 2,308,645 1,545,773 907,645 56,192 (7,078) 12,769 13,756 6 -
239 City of Wakeeney 801,869 536,898 315,255 8,474 (13,504) (3,967) 206 (327) -
240 City of Wakefield 92,851 62,169 36,504 2,339 (1,465) (564) 536 18 -
242 City of Wamego 2,255,697 1,510,322 886,829 42,108 (9,988) 20,002 17,176 210 -
243 City of Washington 464,317 310,887 182,546 13,046 5,955 8,156 2,637 (99) -
244 City of Waterville 257,849 172,645 101,374 (96) (360) 1,594 672 (100) -
245 City of Waverly 123,592 82,752 48,590 5,548 2,535 2,197 58 (95) -
246 City of Wellington 4,489,502 3,005,985 1,765,051 18,239 (65,720) (11,153) 824 (2,135) -
247 City of Wilson 194,801 130,431 76,586 941 (2,687) (1,086) 822 17 -
248 City of Winfield 7,974,257 5,339,234 3,135,085 140,423 (57,165) 22,935 30,714 (1,253) -
249 City of Yates Center 439,398 294,203 172,750 10,178 (4,093) (340) (879) (356) -
252 Mission Twp Brown County 46,457 31,106 18,264 604 (358) 215 532 32 -
259 William Newton Memorial Hospital 17,457,211 11,688,628 6,863,314 511,954 39,690 163,050 183,652 9,682 -
260 Anthony Public Library 28,091 18,809 11,044 (3,344) (3,900) (2,922) (1,632) (148) -
261 Arkansas City Public Library 180,275 120,705 70,875 8,977 (1,156) 421 (2,678) (484) -
262 Cherryvale Public Library 46,373 31,050 18,232 2,048 3,779 856 (269) 5 -
263 Clay Center Carnegie Library 91,348 61,163 35,914 3,971 (468) 1,901 995 9 -
264 Dodge City Public Library 730,139 488,871 287,054 4,659 (14,438) (4,891) 1,723 (83) -
266 Emporia Public Library 465,986 312,005 183,203 2,845 (5,751) 3 (444) (360) -
268 Harper Public Library 22,081 14,784 8,681 699 (441) (17) (158) (44) -
269 Hutchinson Public Library 1,392,512 932,369 547,467 32,495 (3,159) 7,169 6,324 (199) -
270 Independence Public Library 401,143 268,589 157,710 13,281 7,538 12,955 5,863 244 -
271 Lawrence Public Library 2,907,761 1,946,917 1,143,188 125,589 22,245 49,583 31,929 1,057 -
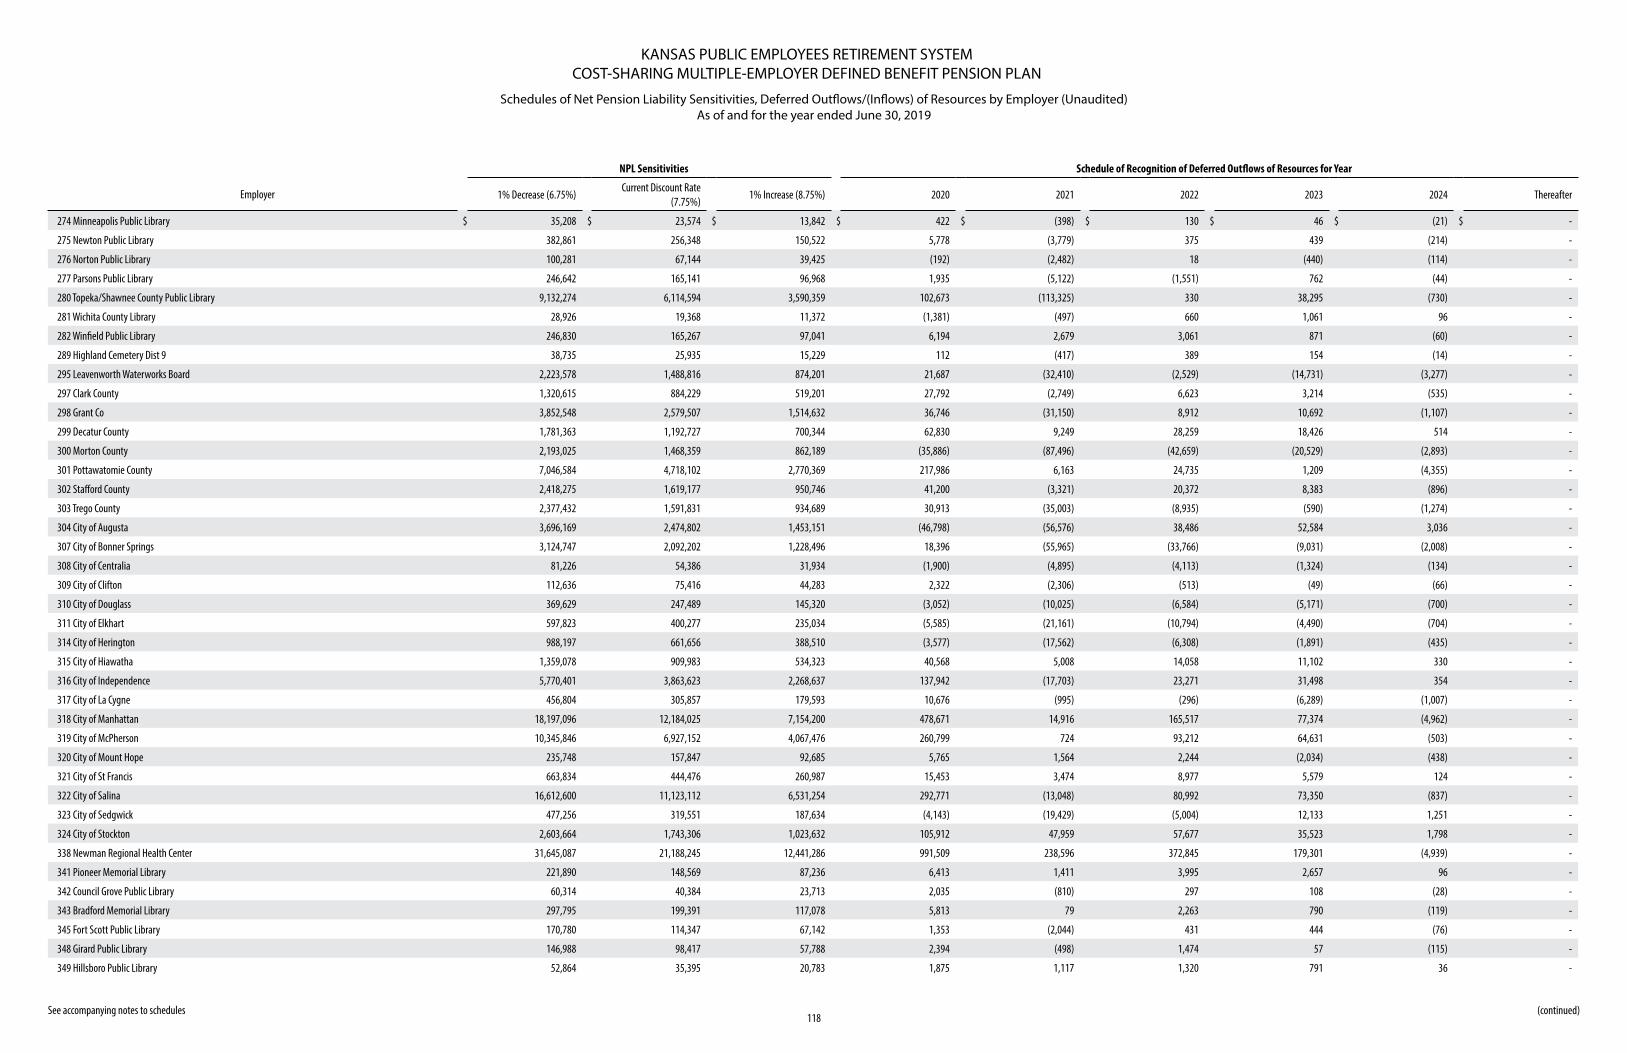
KANSAS PUBLIC EMPLOYEES RETIREMENT SYSTEMCOST-SHARING MULTIPLE-EMPLOYER DEFINED BENEFIT PENSION PLAN
Schedules of Net Pension Liability Sensitivities, Deferred Outflows/(Inflows) of Resources by Employer (Unaudited) As of and for the year ended June 30, 2019
See accompanying notes to schedules118
(continued)
NPL Sensitivities Schedule of Recognition of Deferred Outflows of Resources for Year
Employer 1% Decrease (6.75%)Current Discount Rate
(7.75%)1% Increase (8.75%) 2020 2021 2022 2023 2024 Thereafter
274 Minneapolis Public Library $ 35,208 $ 23,574 $ 13,842 $ 422 $ (398) $ 130 $ 46 $ (21) $ -
275 Newton Public Library 382,861 256,348 150,522 5,778 (3,779) 375 439 (214) -
276 Norton Public Library 100,281 67,144 39,425 (192) (2,482) 18 (440) (114) -
277 Parsons Public Library 246,642 165,141 96,968 1,935 (5,122) (1,551) 762 (44) -
280 Topeka/Shawnee County Public Library 9,132,274 6,114,594 3,590,359 102,673 (113,325) 330 38,295 (730) -
281 Wichita County Library 28,926 19,368 11,372 (1,381) (497) 660 1,061 96 -
282 Winfield Public Library 246,830 165,267 97,041 6,194 2,679 3,061 871 (60) -
289 Highland Cemetery Dist 9 38,735 25,935 15,229 112 (417) 389 154 (14) -
295 Leavenworth Waterworks Board 2,223,578 1,488,816 874,201 21,687 (32,410) (2,529) (14,731) (3,277) -
297 Clark County 1,320,615 884,229 519,201 27,792 (2,749) 6,623 3,214 (535) -
298 Grant Co 3,852,548 2,579,507 1,514,632 36,746 (31,150) 8,912 10,692 (1,107) -
299 Decatur County 1,781,363 1,192,727 700,344 62,830 9,249 28,259 18,426 514 -
300 Morton County 2,193,025 1,468,359 862,189 (35,886) (87,496) (42,659) (20,529) (2,893) -
301 Pottawatomie County 7,046,584 4,718,102 2,770,369 217,986 6,163 24,735 1,209 (4,355) -
302 Stafford County 2,418,275 1,619,177 950,746 41,200 (3,321) 20,372 8,383 (896) -
303 Trego County 2,377,432 1,591,831 934,689 30,913 (35,003) (8,935) (590) (1,274) -
304 City of Augusta 3,696,169 2,474,802 1,453,151 (46,798) (56,576) 38,486 52,584 3,036 -
307 City of Bonner Springs 3,124,747 2,092,202 1,228,496 18,396 (55,965) (33,766) (9,031) (2,008) -
308 City of Centralia 81,226 54,386 31,934 (1,900) (4,895) (4,113) (1,324) (134) -
309 City of Clifton 112,636 75,416 44,283 2,322 (2,306) (513) (49) (66) -
310 City of Douglass 369,629 247,489 145,320 (3,052) (10,025) (6,584) (5,171) (700) -
311 City of Elkhart 597,823 400,277 235,034 (5,585) (21,161) (10,794) (4,490) (704) -
314 City of Herington 988,197 661,656 388,510 (3,577) (17,562) (6,308) (1,891) (435) -
315 City of Hiawatha 1,359,078 909,983 534,323 40,568 5,008 14,058 11,102 330 -
316 City of Independence 5,770,401 3,863,623 2,268,637 137,942 (17,703) 23,271 31,498 354 -
317 City of La Cygne 456,804 305,857 179,593 10,676 (995) (296) (6,289) (1,007) -
318 City of Manhattan 18,197,096 12,184,025 7,154,200 478,671 14,916 165,517 77,374 (4,962) -
319 City of McPherson 10,345,846 6,927,152 4,067,476 260,799 724 93,212 64,631 (503) -
320 City of Mount Hope 235,748 157,847 92,685 5,765 1,564 2,244 (2,034) (438) -
321 City of St Francis 663,834 444,476 260,987 15,453 3,474 8,977 5,579 124 -
322 City of Salina 16,612,600 11,123,112 6,531,254 292,771 (13,048) 80,992 73,350 (837) -
323 City of Sedgwick 477,256 319,551 187,634 (4,143) (19,429) (5,004) 12,133 1,251 -
324 City of Stockton 2,603,664 1,743,306 1,023,632 105,912 47,959 57,677 35,523 1,798 -
338 Newman Regional Health Center 31,645,087 21,188,245 12,441,286 991,509 238,596 372,845 179,301 (4,939) -
341 Pioneer Memorial Library 221,890 148,569 87,236 6,413 1,411 3,995 2,657 96 -
342 Council Grove Public Library 60,314 40,384 23,713 2,035 (810) 297 108 (28) -
343 Bradford Memorial Library 297,795 199,391 117,078 5,813 79 2,263 790 (119) -
345 Fort Scott Public Library 170,780 114,347 67,142 1,353 (2,044) 431 444 (76) -
348 Girard Public Library 146,988 98,417 57,788 2,394 (498) 1,474 57 (115) -
349 Hillsboro Public Library 52,864 35,395 20,783 1,875 1,117 1,320 791 36 -
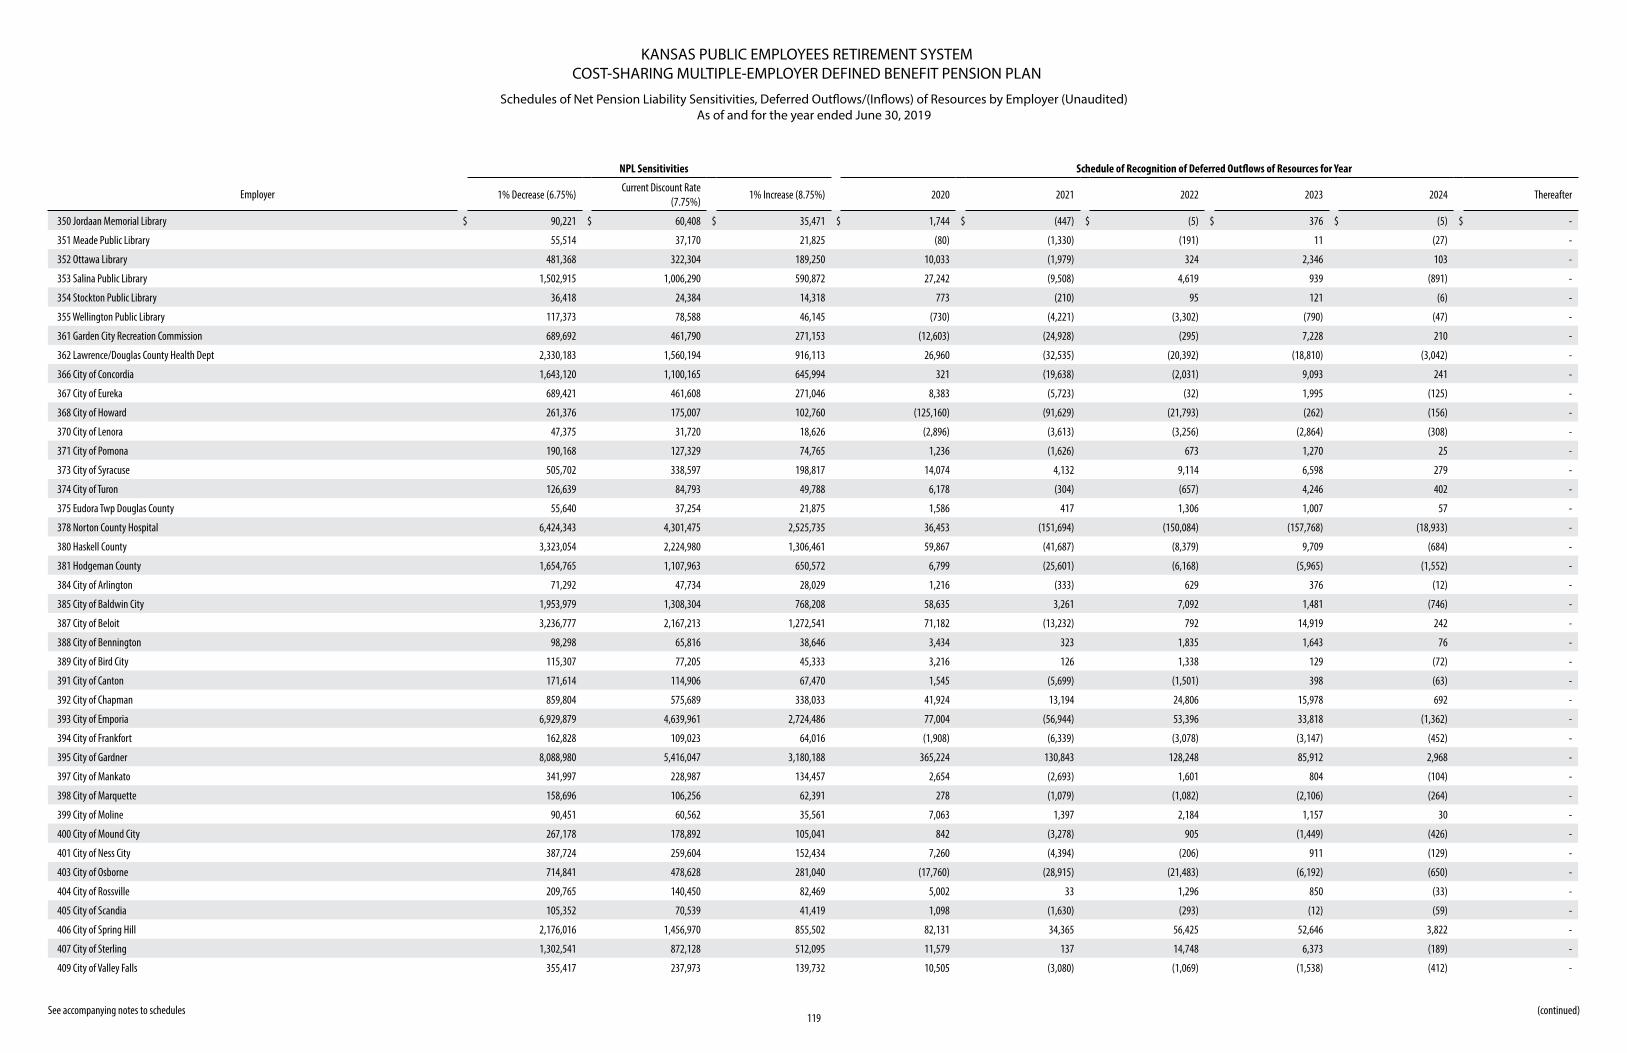
KANSAS PUBLIC EMPLOYEES RETIREMENT SYSTEMCOST-SHARING MULTIPLE-EMPLOYER DEFINED BENEFIT PENSION PLAN
Schedules of Net Pension Liability Sensitivities, Deferred Outflows/(Inflows) of Resources by Employer (Unaudited) As of and for the year ended June 30, 2019
See accompanying notes to schedules119
(continued)
NPL Sensitivities Schedule of Recognition of Deferred Outflows of Resources for Year
Employer 1% Decrease (6.75%)Current Discount Rate
(7.75%)1% Increase (8.75%) 2020 2021 2022 2023 2024 Thereafter
350 Jordaan Memorial Library $ 90,221 $ 60,408 $ 35,471 $ 1,744 $ (447) $ (5) $ 376 $ (5) $ -
351 Meade Public Library 55,514 37,170 21,825 (80) (1,330) (191) 11 (27) -
352 Ottawa Library 481,368 322,304 189,250 10,033 (1,979) 324 2,346 103 -
353 Salina Public Library 1,502,915 1,006,290 590,872 27,242 (9,508) 4,619 939 (891) -
354 Stockton Public Library 36,418 24,384 14,318 773 (210) 95 121 (6) -
355 Wellington Public Library 117,373 78,588 46,145 (730) (4,221) (3,302) (790) (47) -
361 Garden City Recreation Commission 689,692 461,790 271,153 (12,603) (24,928) (295) 7,228 210 -
362 Lawrence/Douglas County Health Dept 2,330,183 1,560,194 916,113 26,960 (32,535) (20,392) (18,810) (3,042) -
366 City of Concordia 1,643,120 1,100,165 645,994 321 (19,638) (2,031) 9,093 241 -
367 City of Eureka 689,421 461,608 271,046 8,383 (5,723) (32) 1,995 (125) -
368 City of Howard 261,376 175,007 102,760 (125,160) (91,629) (21,793) (262) (156) -
370 City of Lenora 47,375 31,720 18,626 (2,896) (3,613) (3,256) (2,864) (308) -
371 City of Pomona 190,168 127,329 74,765 1,236 (1,626) 673 1,270 25 -
373 City of Syracuse 505,702 338,597 198,817 14,074 4,132 9,114 6,598 279 -
374 City of Turon 126,639 84,793 49,788 6,178 (304) (657) 4,246 402 -
375 Eudora Twp Douglas County 55,640 37,254 21,875 1,586 417 1,306 1,007 57 -
378 Norton County Hospital 6,424,343 4,301,475 2,525,735 36,453 (151,694) (150,084) (157,768) (18,933) -
380 Haskell County 3,323,054 2,224,980 1,306,461 59,867 (41,687) (8,379) 9,709 (684) -
381 Hodgeman County 1,654,765 1,107,963 650,572 6,799 (25,601) (6,168) (5,965) (1,552) -
384 City of Arlington 71,292 47,734 28,029 1,216 (333) 629 376 (12) -
385 City of Baldwin City 1,953,979 1,308,304 768,208 58,635 3,261 7,092 1,481 (746) -
387 City of Beloit 3,236,777 2,167,213 1,272,541 71,182 (13,232) 792 14,919 242 -
388 City of Bennington 98,298 65,816 38,646 3,434 323 1,835 1,643 76 -
389 City of Bird City 115,307 77,205 45,333 3,216 126 1,338 129 (72) -
391 City of Canton 171,614 114,906 67,470 1,545 (5,699) (1,501) 398 (63) -
392 City of Chapman 859,804 575,689 338,033 41,924 13,194 24,806 15,978 692 -
393 City of Emporia 6,929,879 4,639,961 2,724,486 77,004 (56,944) 53,396 33,818 (1,362) -
394 City of Frankfort 162,828 109,023 64,016 (1,908) (6,339) (3,078) (3,147) (452) -
395 City of Gardner 8,088,980 5,416,047 3,180,188 365,224 130,843 128,248 85,912 2,968 -
397 City of Mankato 341,997 228,987 134,457 2,654 (2,693) 1,601 804 (104) -
398 City of Marquette 158,696 106,256 62,391 278 (1,079) (1,082) (2,106) (264) -
399 City of Moline 90,451 60,562 35,561 7,063 1,397 2,184 1,157 30 -
400 City of Mound City 267,178 178,892 105,041 842 (3,278) 905 (1,449) (426) -
401 City of Ness City 387,724 259,604 152,434 7,260 (4,394) (206) 911 (129) -
403 City of Osborne 714,841 478,628 281,040 (17,760) (28,915) (21,483) (6,192) (650) -
404 City of Rossville 209,765 140,450 82,469 5,002 33 1,296 850 (33) -
405 City of Scandia 105,352 70,539 41,419 1,098 (1,630) (293) (12) (59) -
406 City of Spring Hill 2,176,016 1,456,970 855,502 82,131 34,365 56,425 52,646 3,822 -
407 City of Sterling 1,302,541 872,128 512,095 11,579 137 14,748 6,373 (189) -
409 City of Valley Falls 355,417 237,973 139,732 10,505 (3,080) (1,069) (1,538) (412) -
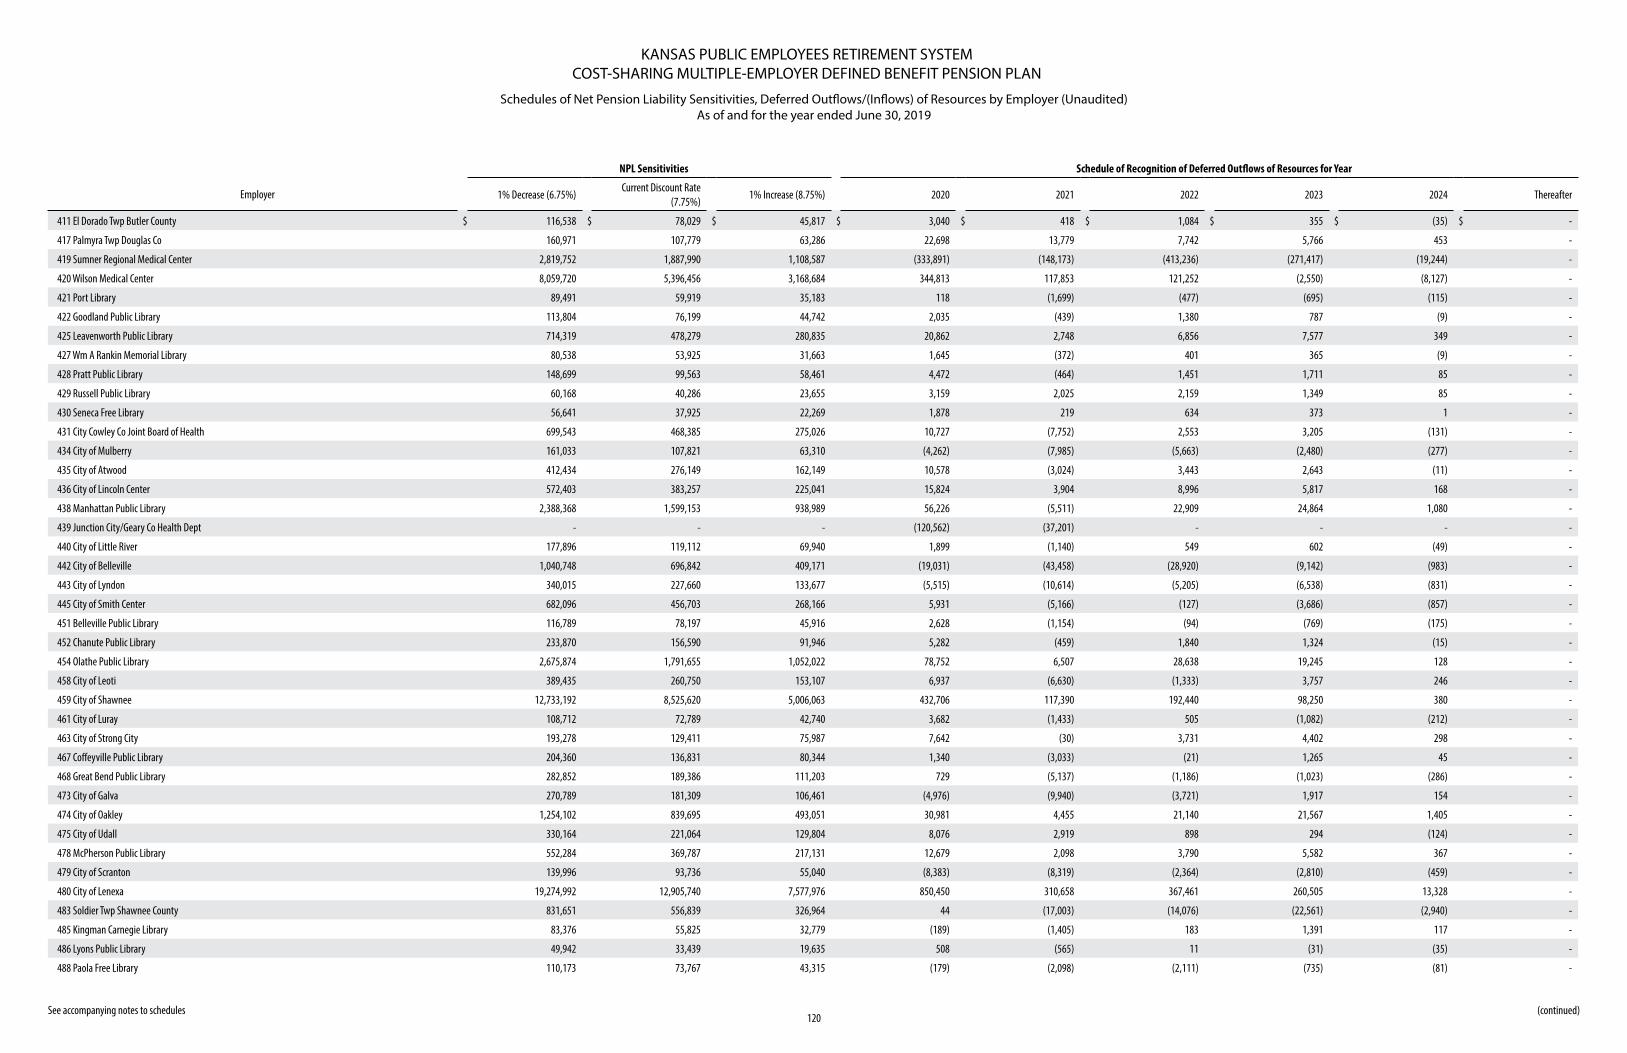
KANSAS PUBLIC EMPLOYEES RETIREMENT SYSTEMCOST-SHARING MULTIPLE-EMPLOYER DEFINED BENEFIT PENSION PLAN
Schedules of Net Pension Liability Sensitivities, Deferred Outflows/(Inflows) of Resources by Employer (Unaudited) As of and for the year ended June 30, 2019
See accompanying notes to schedules120
(continued)
NPL Sensitivities Schedule of Recognition of Deferred Outflows of Resources for Year
Employer 1% Decrease (6.75%)Current Discount Rate
(7.75%)1% Increase (8.75%) 2020 2021 2022 2023 2024 Thereafter
411 El Dorado Twp Butler County $ 116,538 $ 78,029 $ 45,817 $ 3,040 $ 418 $ 1,084 $ 355 $ (35) $ -
417 Palmyra Twp Douglas Co 160,971 107,779 63,286 22,698 13,779 7,742 5,766 453 -
419 Sumner Regional Medical Center 2,819,752 1,887,990 1,108,587 (333,891) (148,173) (413,236) (271,417) (19,244) -
420 Wilson Medical Center 8,059,720 5,396,456 3,168,684 344,813 117,853 121,252 (2,550) (8,127) -
421 Port Library 89,491 59,919 35,183 118 (1,699) (477) (695) (115) -
422 Goodland Public Library 113,804 76,199 44,742 2,035 (439) 1,380 787 (9) -
425 Leavenworth Public Library 714,319 478,279 280,835 20,862 2,748 6,856 7,577 349 -
427 Wm A Rankin Memorial Library 80,538 53,925 31,663 1,645 (372) 401 365 (9) -
428 Pratt Public Library 148,699 99,563 58,461 4,472 (464) 1,451 1,711 85 -
429 Russell Public Library 60,168 40,286 23,655 3,159 2,025 2,159 1,349 85 -
430 Seneca Free Library 56,641 37,925 22,269 1,878 219 634 373 1 -
431 City Cowley Co Joint Board of Health 699,543 468,385 275,026 10,727 (7,752) 2,553 3,205 (131) -
434 City of Mulberry 161,033 107,821 63,310 (4,262) (7,985) (5,663) (2,480) (277) -
435 City of Atwood 412,434 276,149 162,149 10,578 (3,024) 3,443 2,643 (11) -
436 City of Lincoln Center 572,403 383,257 225,041 15,824 3,904 8,996 5,817 168 -
438 Manhattan Public Library 2,388,368 1,599,153 938,989 56,226 (5,511) 22,909 24,864 1,080 -
439 Junction City/Geary Co Health Dept - - - (120,562) (37,201) - - - -
440 City of Little River 177,896 119,112 69,940 1,899 (1,140) 549 602 (49) -
442 City of Belleville 1,040,748 696,842 409,171 (19,031) (43,458) (28,920) (9,142) (983) -
443 City of Lyndon 340,015 227,660 133,677 (5,515) (10,614) (5,205) (6,538) (831) -
445 City of Smith Center 682,096 456,703 268,166 5,931 (5,166) (127) (3,686) (857) -
451 Belleville Public Library 116,789 78,197 45,916 2,628 (1,154) (94) (769) (175) -
452 Chanute Public Library 233,870 156,590 91,946 5,282 (459) 1,840 1,324 (15) -
454 Olathe Public Library 2,675,874 1,791,655 1,052,022 78,752 6,507 28,638 19,245 128 -
458 City of Leoti 389,435 260,750 153,107 6,937 (6,630) (1,333) 3,757 246 -
459 City of Shawnee 12,733,192 8,525,620 5,006,063 432,706 117,390 192,440 98,250 380 -
461 City of Luray 108,712 72,789 42,740 3,682 (1,433) 505 (1,082) (212) -
463 City of Strong City 193,278 129,411 75,987 7,642 (30) 3,731 4,402 298 -
467 Coffeyville Public Library 204,360 136,831 80,344 1,340 (3,033) (21) 1,265 45 -
468 Great Bend Public Library 282,852 189,386 111,203 729 (5,137) (1,186) (1,023) (286) -
473 City of Galva 270,789 181,309 106,461 (4,976) (9,940) (3,721) 1,917 154 -
474 City of Oakley 1,254,102 839,695 493,051 30,981 4,455 21,140 21,567 1,405 -
475 City of Udall 330,164 221,064 129,804 8,076 2,919 898 294 (124) -
478 McPherson Public Library 552,284 369,787 217,131 12,679 2,098 3,790 5,582 367 -
479 City of Scranton 139,996 93,736 55,040 (8,383) (8,319) (2,364) (2,810) (459) -
480 City of Lenexa 19,274,992 12,905,740 7,577,976 850,450 310,658 367,461 260,505 13,328 -
483 Soldier Twp Shawnee County 831,651 556,839 326,964 44 (17,003) (14,076) (22,561) (2,940) -
485 Kingman Carnegie Library 83,376 55,825 32,779 (189) (1,405) 183 1,391 117 -
486 Lyons Public Library 49,942 33,439 19,635 508 (565) 11 (31) (35) -
488 Paola Free Library 110,173 73,767 43,315 (179) (2,098) (2,111) (735) (81) -
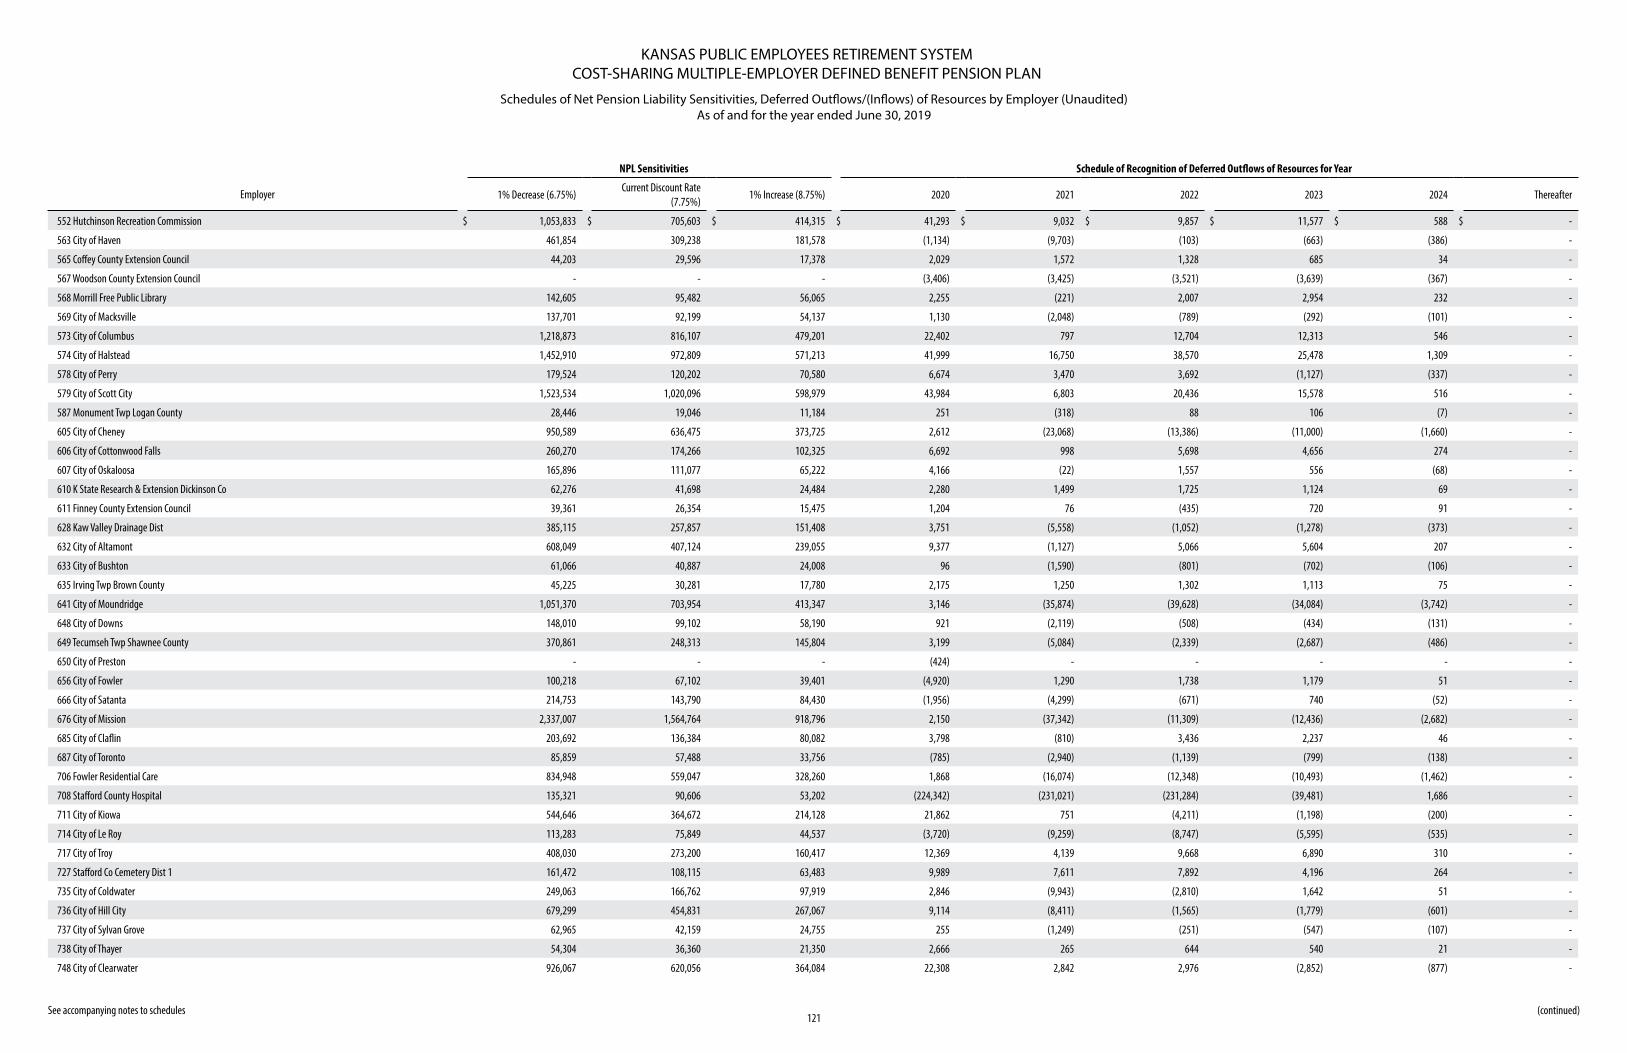
KANSAS PUBLIC EMPLOYEES RETIREMENT SYSTEMCOST-SHARING MULTIPLE-EMPLOYER DEFINED BENEFIT PENSION PLAN
Schedules of Net Pension Liability Sensitivities, Deferred Outflows/(Inflows) of Resources by Employer (Unaudited) As of and for the year ended June 30, 2019
See accompanying notes to schedules121
(continued)
NPL Sensitivities Schedule of Recognition of Deferred Outflows of Resources for Year
Employer 1% Decrease (6.75%)Current Discount Rate
(7.75%)1% Increase (8.75%) 2020 2021 2022 2023 2024 Thereafter
552 Hutchinson Recreation Commission $ 1,053,833 $ 705,603 $ 414,315 $ 41,293 $ 9,032 $ 9,857 $ 11,577 $ 588 $ -
563 City of Haven 461,854 309,238 181,578 (1,134) (9,703) (103) (663) (386) -
565 Coffey County Extension Council 44,203 29,596 17,378 2,029 1,572 1,328 685 34 -
567 Woodson County Extension Council - - - (3,406) (3,425) (3,521) (3,639) (367) -
568 Morrill Free Public Library 142,605 95,482 56,065 2,255 (221) 2,007 2,954 232 -
569 City of Macksville 137,701 92,199 54,137 1,130 (2,048) (789) (292) (101) -
573 City of Columbus 1,218,873 816,107 479,201 22,402 797 12,704 12,313 546 -
574 City of Halstead 1,452,910 972,809 571,213 41,999 16,750 38,570 25,478 1,309 -
578 City of Perry 179,524 120,202 70,580 6,674 3,470 3,692 (1,127) (337) -
579 City of Scott City 1,523,534 1,020,096 598,979 43,984 6,803 20,436 15,578 516 -
587 Monument Twp Logan County 28,446 19,046 11,184 251 (318) 88 106 (7) -
605 City of Cheney 950,589 636,475 373,725 2,612 (23,068) (13,386) (11,000) (1,660) -
606 City of Cottonwood Falls 260,270 174,266 102,325 6,692 998 5,698 4,656 274 -
607 City of Oskaloosa 165,896 111,077 65,222 4,166 (22) 1,557 556 (68) -
610 K State Research & Extension Dickinson Co 62,276 41,698 24,484 2,280 1,499 1,725 1,124 69 -
611 Finney County Extension Council 39,361 26,354 15,475 1,204 76 (435) 720 91 -
628 Kaw Valley Drainage Dist 385,115 257,857 151,408 3,751 (5,558) (1,052) (1,278) (373) -
632 City of Altamont 608,049 407,124 239,055 9,377 (1,127) 5,066 5,604 207 -
633 City of Bushton 61,066 40,887 24,008 96 (1,590) (801) (702) (106) -
635 Irving Twp Brown County 45,225 30,281 17,780 2,175 1,250 1,302 1,113 75 -
641 City of Moundridge 1,051,370 703,954 413,347 3,146 (35,874) (39,628) (34,084) (3,742) -
648 City of Downs 148,010 99,102 58,190 921 (2,119) (508) (434) (131) -
649 Tecumseh Twp Shawnee County 370,861 248,313 145,804 3,199 (5,084) (2,339) (2,687) (486) -
650 City of Preston - - - (424) - - - - -
656 City of Fowler 100,218 67,102 39,401 (4,920) 1,290 1,738 1,179 51 -
666 City of Satanta 214,753 143,790 84,430 (1,956) (4,299) (671) 740 (52) -
676 City of Mission 2,337,007 1,564,764 918,796 2,150 (37,342) (11,309) (12,436) (2,682) -
685 City of Claflin 203,692 136,384 80,082 3,798 (810) 3,436 2,237 46 -
687 City of Toronto 85,859 57,488 33,756 (785) (2,940) (1,139) (799) (138) -
706 Fowler Residential Care 834,948 559,047 328,260 1,868 (16,074) (12,348) (10,493) (1,462) -
708 Stafford County Hospital 135,321 90,606 53,202 (224,342) (231,021) (231,284) (39,481) 1,686 -
711 City of Kiowa 544,646 364,672 214,128 21,862 751 (4,211) (1,198) (200) -
714 City of Le Roy 113,283 75,849 44,537 (3,720) (9,259) (8,747) (5,595) (535) -
717 City of Troy 408,030 273,200 160,417 12,369 4,139 9,668 6,890 310 -
727 Stafford Co Cemetery Dist 1 161,472 108,115 63,483 9,989 7,611 7,892 4,196 264 -
735 City of Coldwater 249,063 166,762 97,919 2,846 (9,943) (2,810) 1,642 51 -
736 City of Hill City 679,299 454,831 267,067 9,114 (8,411) (1,565) (1,779) (601) -
737 City of Sylvan Grove 62,965 42,159 24,755 255 (1,249) (251) (547) (107) -
738 City of Thayer 54,304 36,360 21,350 2,666 265 644 540 21 -
748 City of Clearwater 926,067 620,056 364,084 22,308 2,842 2,976 (2,852) (877) -
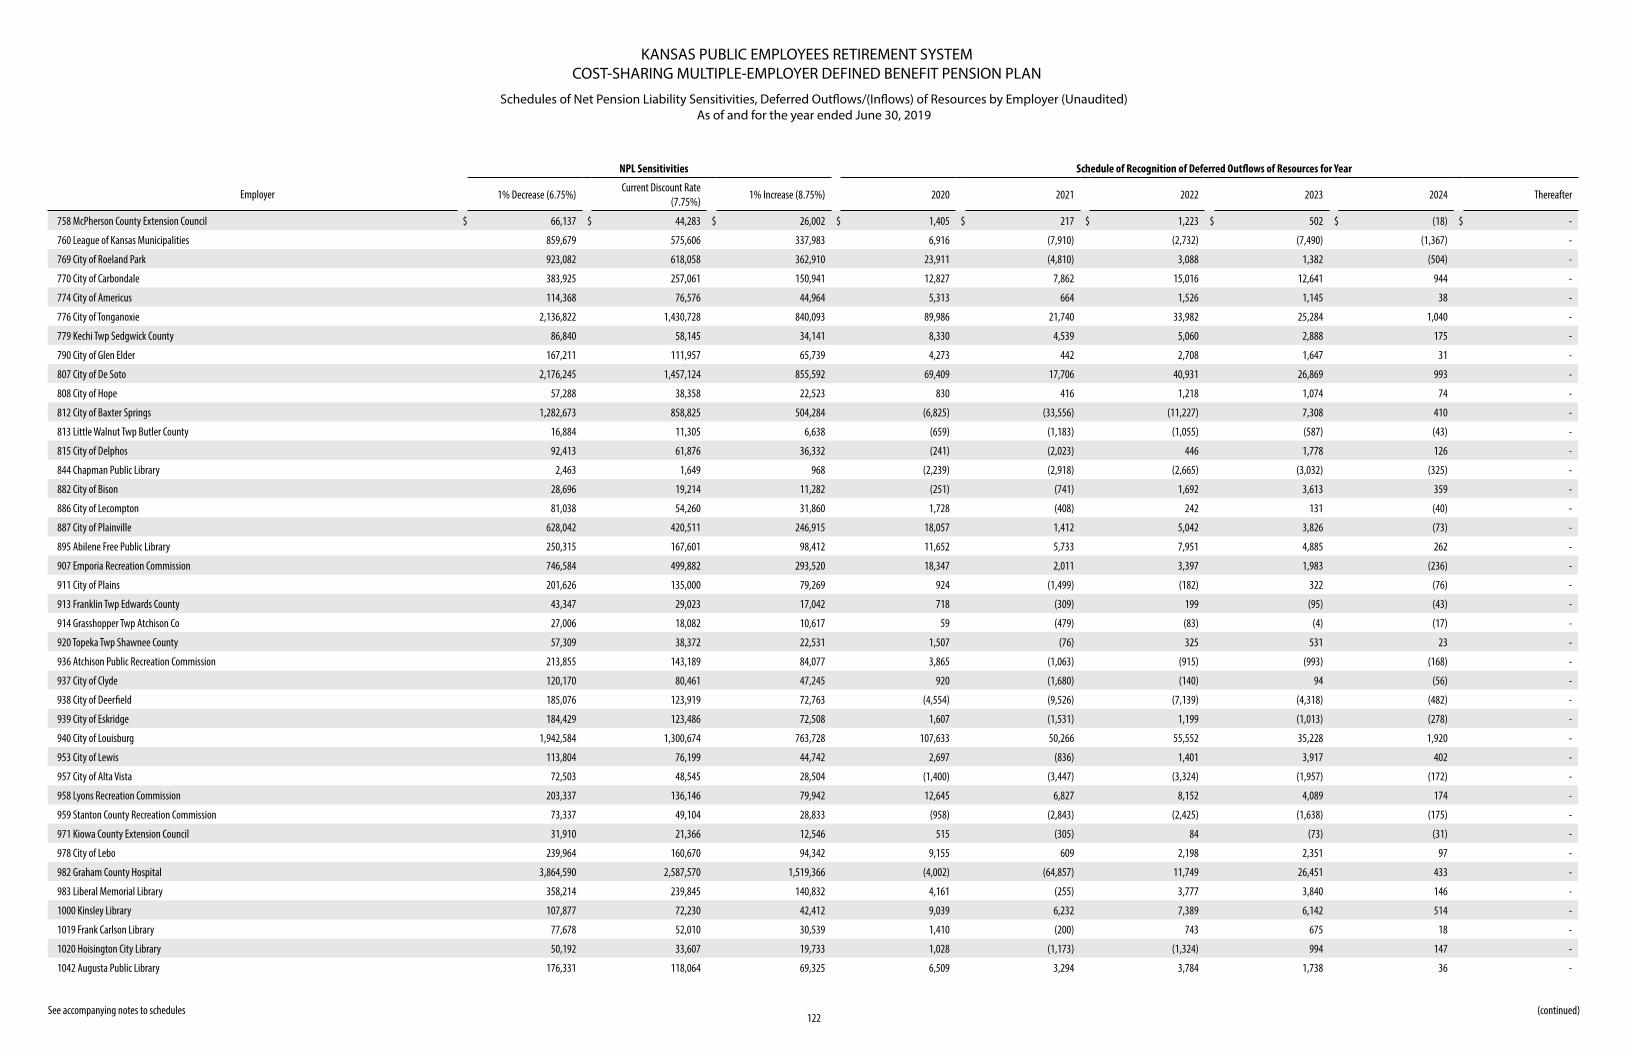
KANSAS PUBLIC EMPLOYEES RETIREMENT SYSTEMCOST-SHARING MULTIPLE-EMPLOYER DEFINED BENEFIT PENSION PLAN
Schedules of Net Pension Liability Sensitivities, Deferred Outflows/(Inflows) of Resources by Employer (Unaudited) As of and for the year ended June 30, 2019
See accompanying notes to schedules122
(continued)
NPL Sensitivities Schedule of Recognition of Deferred Outflows of Resources for Year
Employer 1% Decrease (6.75%)Current Discount Rate
(7.75%)1% Increase (8.75%) 2020 2021 2022 2023 2024 Thereafter
758 McPherson County Extension Council $ 66,137 $ 44,283 $ 26,002 $ 1,405 $ 217 $ 1,223 $ 502 $ (18) $ -
760 League of Kansas Municipalities 859,679 575,606 337,983 6,916 (7,910) (2,732) (7,490) (1,367) -
769 City of Roeland Park 923,082 618,058 362,910 23,911 (4,810) 3,088 1,382 (504) -
770 City of Carbondale 383,925 257,061 150,941 12,827 7,862 15,016 12,641 944 -
774 City of Americus 114,368 76,576 44,964 5,313 664 1,526 1,145 38 -
776 City of Tonganoxie 2,136,822 1,430,728 840,093 89,986 21,740 33,982 25,284 1,040 -
779 Kechi Twp Sedgwick County 86,840 58,145 34,141 8,330 4,539 5,060 2,888 175 -
790 City of Glen Elder 167,211 111,957 65,739 4,273 442 2,708 1,647 31 -
807 City of De Soto 2,176,245 1,457,124 855,592 69,409 17,706 40,931 26,869 993 -
808 City of Hope 57,288 38,358 22,523 830 416 1,218 1,074 74 -
812 City of Baxter Springs 1,282,673 858,825 504,284 (6,825) (33,556) (11,227) 7,308 410 -
813 Little Walnut Twp Butler County 16,884 11,305 6,638 (659) (1,183) (1,055) (587) (43) -
815 City of Delphos 92,413 61,876 36,332 (241) (2,023) 446 1,778 126 -
844 Chapman Public Library 2,463 1,649 968 (2,239) (2,918) (2,665) (3,032) (325) -
882 City of Bison 28,696 19,214 11,282 (251) (741) 1,692 3,613 359 -
886 City of Lecompton 81,038 54,260 31,860 1,728 (408) 242 131 (40) -
887 City of Plainville 628,042 420,511 246,915 18,057 1,412 5,042 3,826 (73) -
895 Abilene Free Public Library 250,315 167,601 98,412 11,652 5,733 7,951 4,885 262 -
907 Emporia Recreation Commission 746,584 499,882 293,520 18,347 2,011 3,397 1,983 (236) -
911 City of Plains 201,626 135,000 79,269 924 (1,499) (182) 322 (76) -
913 Franklin Twp Edwards County 43,347 29,023 17,042 718 (309) 199 (95) (43) -
914 Grasshopper Twp Atchison Co 27,006 18,082 10,617 59 (479) (83) (4) (17) -
920 Topeka Twp Shawnee County 57,309 38,372 22,531 1,507 (76) 325 531 23 -
936 Atchison Public Recreation Commission 213,855 143,189 84,077 3,865 (1,063) (915) (993) (168) -
937 City of Clyde 120,170 80,461 47,245 920 (1,680) (140) 94 (56) -
938 City of Deerfield 185,076 123,919 72,763 (4,554) (9,526) (7,139) (4,318) (482) -
939 City of Eskridge 184,429 123,486 72,508 1,607 (1,531) 1,199 (1,013) (278) -
940 City of Louisburg 1,942,584 1,300,674 763,728 107,633 50,266 55,552 35,228 1,920 -
953 City of Lewis 113,804 76,199 44,742 2,697 (836) 1,401 3,917 402 -
957 City of Alta Vista 72,503 48,545 28,504 (1,400) (3,447) (3,324) (1,957) (172) -
958 Lyons Recreation Commission 203,337 136,146 79,942 12,645 6,827 8,152 4,089 174 -
959 Stanton County Recreation Commission 73,337 49,104 28,833 (958) (2,843) (2,425) (1,638) (175) -
971 Kiowa County Extension Council 31,910 21,366 12,546 515 (305) 84 (73) (31) -
978 City of Lebo 239,964 160,670 94,342 9,155 609 2,198 2,351 97 -
982 Graham County Hospital 3,864,590 2,587,570 1,519,366 (4,002) (64,857) 11,749 26,451 433 -
983 Liberal Memorial Library 358,214 239,845 140,832 4,161 (255) 3,777 3,840 146 -
1000 Kinsley Library 107,877 72,230 42,412 9,039 6,232 7,389 6,142 514 -
1019 Frank Carlson Library 77,678 52,010 30,539 1,410 (200) 743 675 18 -
1020 Hoisington City Library 50,192 33,607 19,733 1,028 (1,173) (1,324) 994 147 -
1042 Augusta Public Library 176,331 118,064 69,325 6,509 3,294 3,784 1,738 36 -
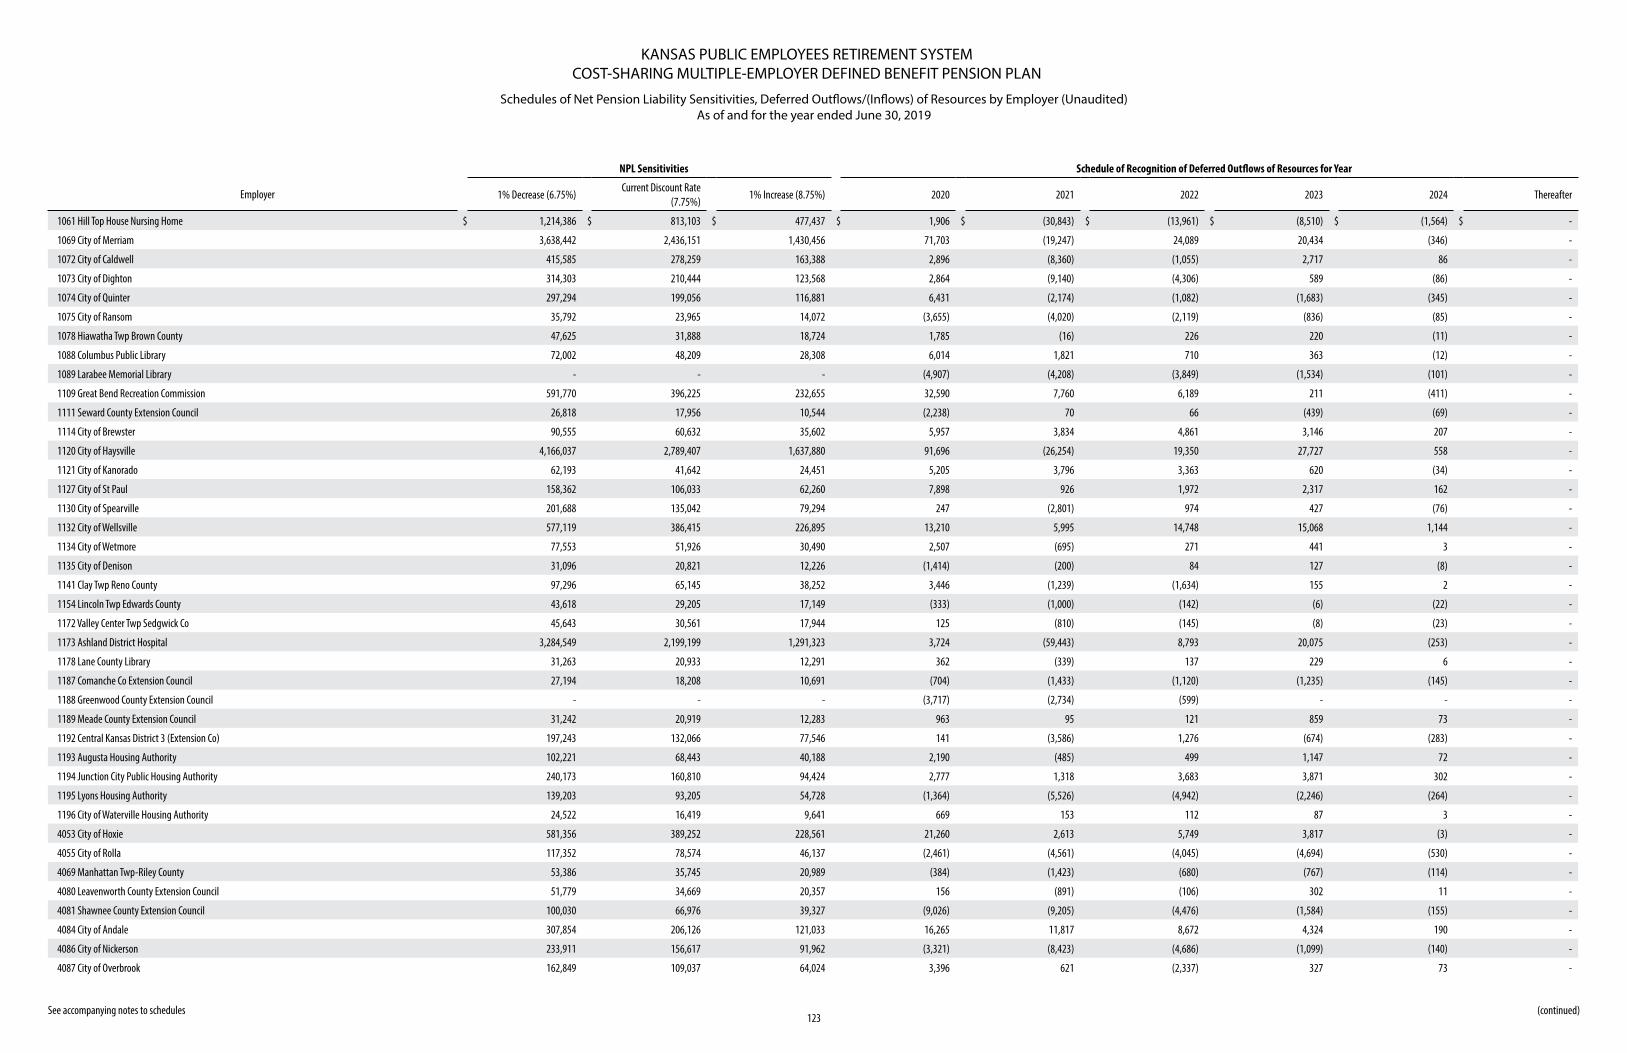
KANSAS PUBLIC EMPLOYEES RETIREMENT SYSTEMCOST-SHARING MULTIPLE-EMPLOYER DEFINED BENEFIT PENSION PLAN
Schedules of Net Pension Liability Sensitivities, Deferred Outflows/(Inflows) of Resources by Employer (Unaudited) As of and for the year ended June 30, 2019
See accompanying notes to schedules123
(continued)
NPL Sensitivities Schedule of Recognition of Deferred Outflows of Resources for Year
Employer 1% Decrease (6.75%)Current Discount Rate
(7.75%)1% Increase (8.75%) 2020 2021 2022 2023 2024 Thereafter
1061 Hill Top House Nursing Home $ 1,214,386 $ 813,103 $ 477,437 $ 1,906 $ (30,843) $ (13,961) $ (8,510) $ (1,564) $ -
1069 City of Merriam 3,638,442 2,436,151 1,430,456 71,703 (19,247) 24,089 20,434 (346) -
1072 City of Caldwell 415,585 278,259 163,388 2,896 (8,360) (1,055) 2,717 86 -
1073 City of Dighton 314,303 210,444 123,568 2,864 (9,140) (4,306) 589 (86) -
1074 City of Quinter 297,294 199,056 116,881 6,431 (2,174) (1,082) (1,683) (345) -
1075 City of Ransom 35,792 23,965 14,072 (3,655) (4,020) (2,119) (836) (85) -
1078 Hiawatha Twp Brown County 47,625 31,888 18,724 1,785 (16) 226 220 (11) -
1088 Columbus Public Library 72,002 48,209 28,308 6,014 1,821 710 363 (12) -
1089 Larabee Memorial Library - - - (4,907) (4,208) (3,849) (1,534) (101) -
1109 Great Bend Recreation Commission 591,770 396,225 232,655 32,590 7,760 6,189 211 (411) -
1111 Seward County Extension Council 26,818 17,956 10,544 (2,238) 70 66 (439) (69) -
1114 City of Brewster 90,555 60,632 35,602 5,957 3,834 4,861 3,146 207 -
1120 City of Haysville 4,166,037 2,789,407 1,637,880 91,696 (26,254) 19,350 27,727 558 -
1121 City of Kanorado 62,193 41,642 24,451 5,205 3,796 3,363 620 (34) -
1127 City of St Paul 158,362 106,033 62,260 7,898 926 1,972 2,317 162 -
1130 City of Spearville 201,688 135,042 79,294 247 (2,801) 974 427 (76) -
1132 City of Wellsville 577,119 386,415 226,895 13,210 5,995 14,748 15,068 1,144 -
1134 City of Wetmore 77,553 51,926 30,490 2,507 (695) 271 441 3 -
1135 City of Denison 31,096 20,821 12,226 (1,414) (200) 84 127 (8) -
1141 Clay Twp Reno County 97,296 65,145 38,252 3,446 (1,239) (1,634) 155 2 -
1154 Lincoln Twp Edwards County 43,618 29,205 17,149 (333) (1,000) (142) (6) (22) -
1172 Valley Center Twp Sedgwick Co 45,643 30,561 17,944 125 (810) (145) (8) (23) -
1173 Ashland District Hospital 3,284,549 2,199,199 1,291,323 3,724 (59,443) 8,793 20,075 (253) -
1178 Lane County Library 31,263 20,933 12,291 362 (339) 137 229 6 -
1187 Comanche Co Extension Council 27,194 18,208 10,691 (704) (1,433) (1,120) (1,235) (145) -
1188 Greenwood County Extension Council - - - (3,717) (2,734) (599) - - -
1189 Meade County Extension Council 31,242 20,919 12,283 963 95 121 859 73 -
1192 Central Kansas District 3 (Extension Co) 197,243 132,066 77,546 141 (3,586) 1,276 (674) (283) -
1193 Augusta Housing Authority 102,221 68,443 40,188 2,190 (485) 499 1,147 72 -
1194 Junction City Public Housing Authority 240,173 160,810 94,424 2,777 1,318 3,683 3,871 302 -
1195 Lyons Housing Authority 139,203 93,205 54,728 (1,364) (5,526) (4,942) (2,246) (264) -
1196 City of Waterville Housing Authority 24,522 16,419 9,641 669 153 112 87 3 -
4053 City of Hoxie 581,356 389,252 228,561 21,260 2,613 5,749 3,817 (3) -
4055 City of Rolla 117,352 78,574 46,137 (2,461) (4,561) (4,045) (4,694) (530) -
4069 Manhattan Twp-Riley County 53,386 35,745 20,989 (384) (1,423) (680) (767) (114) -
4080 Leavenworth County Extension Council 51,779 34,669 20,357 156 (891) (106) 302 11 -
4081 Shawnee County Extension Council 100,030 66,976 39,327 (9,026) (9,205) (4,476) (1,584) (155) -
4084 City of Andale 307,854 206,126 121,033 16,265 11,817 8,672 4,324 190 -
4086 City of Nickerson 233,911 156,617 91,962 (3,321) (8,423) (4,686) (1,099) (140) -
4087 City of Overbrook 162,849 109,037 64,024 3,396 621 (2,337) 327 73 -
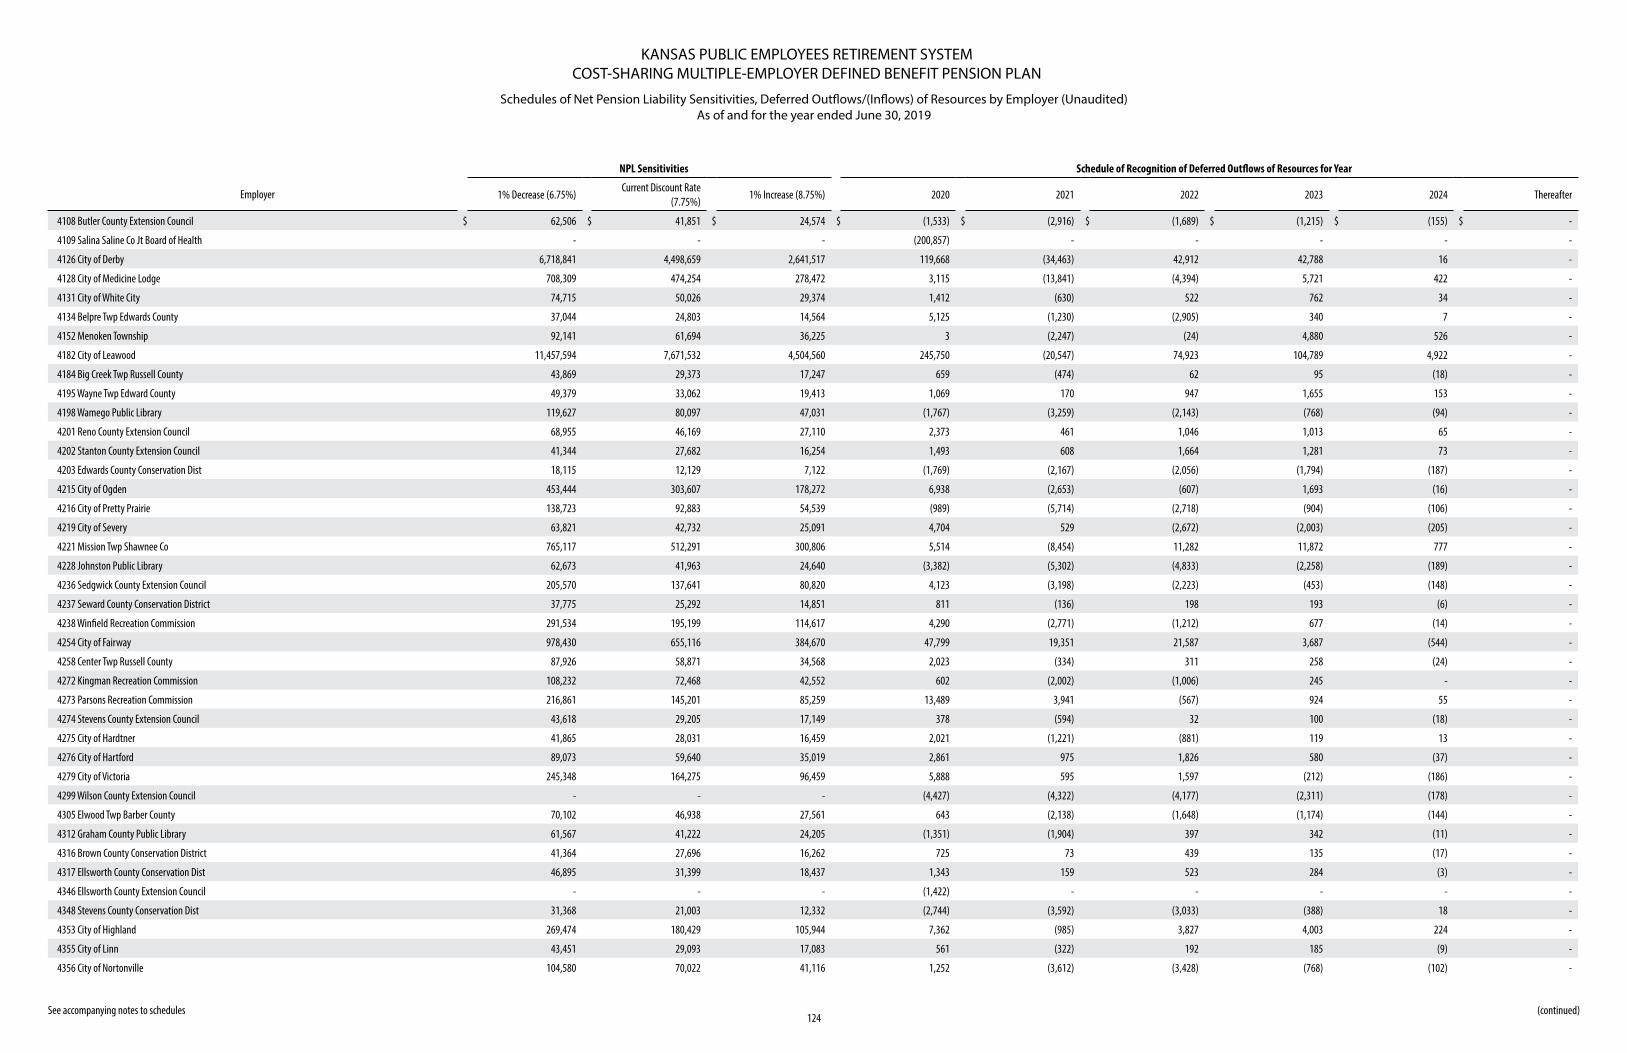
KANSAS PUBLIC EMPLOYEES RETIREMENT SYSTEMCOST-SHARING MULTIPLE-EMPLOYER DEFINED BENEFIT PENSION PLAN
Schedules of Net Pension Liability Sensitivities, Deferred Outflows/(Inflows) of Resources by Employer (Unaudited) As of and for the year ended June 30, 2019
See accompanying notes to schedules124
(continued)
NPL Sensitivities Schedule of Recognition of Deferred Outflows of Resources for Year
Employer 1% Decrease (6.75%)Current Discount Rate
(7.75%)1% Increase (8.75%) 2020 2021 2022 2023 2024 Thereafter
4108 Butler County Extension Council $ 62,506 $ 41,851 $ 24,574 $ (1,533) $ (2,916) $ (1,689) $ (1,215) $ (155) $ -
4109 Salina Saline Co Jt Board of Health - - - (200,857) - - - - -
4126 City of Derby 6,718,841 4,498,659 2,641,517 119,668 (34,463) 42,912 42,788 16 -
4128 City of Medicine Lodge 708,309 474,254 278,472 3,115 (13,841) (4,394) 5,721 422 -
4131 City of White City 74,715 50,026 29,374 1,412 (630) 522 762 34 -
4134 Belpre Twp Edwards County 37,044 24,803 14,564 5,125 (1,230) (2,905) 340 7 -
4152 Menoken Township 92,141 61,694 36,225 3 (2,247) (24) 4,880 526 -
4182 City of Leawood 11,457,594 7,671,532 4,504,560 245,750 (20,547) 74,923 104,789 4,922 -
4184 Big Creek Twp Russell County 43,869 29,373 17,247 659 (474) 62 95 (18) -
4195 Wayne Twp Edward County 49,379 33,062 19,413 1,069 170 947 1,655 153 -
4198 Wamego Public Library 119,627 80,097 47,031 (1,767) (3,259) (2,143) (768) (94) -
4201 Reno County Extension Council 68,955 46,169 27,110 2,373 461 1,046 1,013 65 -
4202 Stanton County Extension Council 41,344 27,682 16,254 1,493 608 1,664 1,281 73 -
4203 Edwards County Conservation Dist 18,115 12,129 7,122 (1,769) (2,167) (2,056) (1,794) (187) -
4215 City of Ogden 453,444 303,607 178,272 6,938 (2,653) (607) 1,693 (16) -
4216 City of Pretty Prairie 138,723 92,883 54,539 (989) (5,714) (2,718) (904) (106) -
4219 City of Severy 63,821 42,732 25,091 4,704 529 (2,672) (2,003) (205) -
4221 Mission Twp Shawnee Co 765,117 512,291 300,806 5,514 (8,454) 11,282 11,872 777 -
4228 Johnston Public Library 62,673 41,963 24,640 (3,382) (5,302) (4,833) (2,258) (189) -
4236 Sedgwick County Extension Council 205,570 137,641 80,820 4,123 (3,198) (2,223) (453) (148) -
4237 Seward County Conservation District 37,775 25,292 14,851 811 (136) 198 193 (6) -
4238 Winfield Recreation Commission 291,534 195,199 114,617 4,290 (2,771) (1,212) 677 (14) -
4254 City of Fairway 978,430 655,116 384,670 47,799 19,351 21,587 3,687 (544) -
4258 Center Twp Russell County 87,926 58,871 34,568 2,023 (334) 311 258 (24) -
4272 Kingman Recreation Commission 108,232 72,468 42,552 602 (2,002) (1,006) 245 - -
4273 Parsons Recreation Commission 216,861 145,201 85,259 13,489 3,941 (567) 924 55 -
4274 Stevens County Extension Council 43,618 29,205 17,149 378 (594) 32 100 (18) -
4275 City of Hardtner 41,865 28,031 16,459 2,021 (1,221) (881) 119 13 -
4276 City of Hartford 89,073 59,640 35,019 2,861 975 1,826 580 (37) -
4279 City of Victoria 245,348 164,275 96,459 5,888 595 1,597 (212) (186) -
4299 Wilson County Extension Council - - - (4,427) (4,322) (4,177) (2,311) (178) -
4305 Elwood Twp Barber County 70,102 46,938 27,561 643 (2,138) (1,648) (1,174) (144) -
4312 Graham County Public Library 61,567 41,222 24,205 (1,351) (1,904) 397 342 (11) -
4316 Brown County Conservation District 41,364 27,696 16,262 725 73 439 135 (17) -
4317 Ellsworth County Conservation Dist 46,895 31,399 18,437 1,343 159 523 284 (3) -
4346 Ellsworth County Extension Council - - - (1,422) - - - - -
4348 Stevens County Conservation Dist 31,368 21,003 12,332 (2,744) (3,592) (3,033) (388) 18 -
4353 City of Highland 269,474 180,429 105,944 7,362 (985) 3,827 4,003 224 -
4355 City of Linn 43,451 29,093 17,083 561 (322) 192 185 (9) -
4356 City of Nortonville 104,580 70,022 41,116 1,252 (3,612) (3,428) (768) (102) -
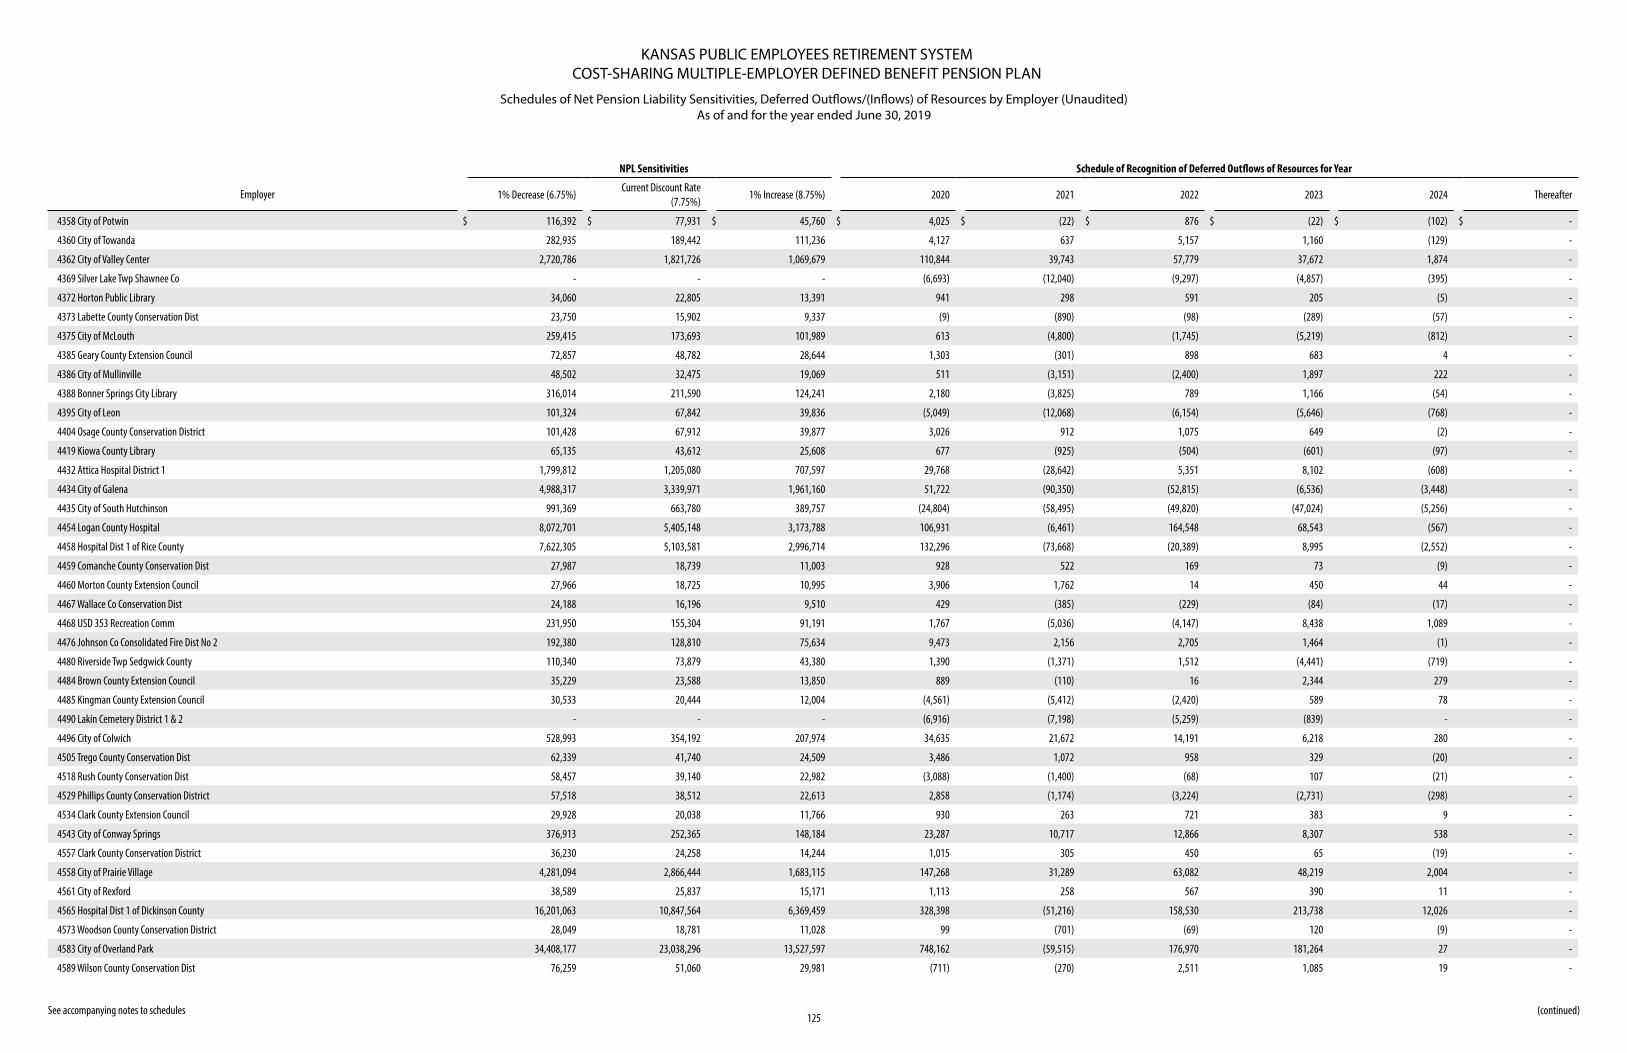
KANSAS PUBLIC EMPLOYEES RETIREMENT SYSTEMCOST-SHARING MULTIPLE-EMPLOYER DEFINED BENEFIT PENSION PLAN
Schedules of Net Pension Liability Sensitivities, Deferred Outflows/(Inflows) of Resources by Employer (Unaudited) As of and for the year ended June 30, 2019
See accompanying notes to schedules125
(continued)
NPL Sensitivities Schedule of Recognition of Deferred Outflows of Resources for Year
Employer 1% Decrease (6.75%)Current Discount Rate
(7.75%)1% Increase (8.75%) 2020 2021 2022 2023 2024 Thereafter
4358 City of Potwin $ 116,392 $ 77,931 $ 45,760 $ 4,025 $ (22) $ 876 $ (22) $ (102) $ -
4360 City of Towanda 282,935 189,442 111,236 4,127 637 5,157 1,160 (129) -
4362 City of Valley Center 2,720,786 1,821,726 1,069,679 110,844 39,743 57,779 37,672 1,874 -
4369 Silver Lake Twp Shawnee Co - - - (6,693) (12,040) (9,297) (4,857) (395) -
4372 Horton Public Library 34,060 22,805 13,391 941 298 591 205 (5) -
4373 Labette County Conservation Dist 23,750 15,902 9,337 (9) (890) (98) (289) (57) -
4375 City of McLouth 259,415 173,693 101,989 613 (4,800) (1,745) (5,219) (812) -
4385 Geary County Extension Council 72,857 48,782 28,644 1,303 (301) 898 683 4 -
4386 City of Mullinville 48,502 32,475 19,069 511 (3,151) (2,400) 1,897 222 -
4388 Bonner Springs City Library 316,014 211,590 124,241 2,180 (3,825) 789 1,166 (54) -
4395 City of Leon 101,324 67,842 39,836 (5,049) (12,068) (6,154) (5,646) (768) -
4404 Osage County Conservation District 101,428 67,912 39,877 3,026 912 1,075 649 (2) -
4419 Kiowa County Library 65,135 43,612 25,608 677 (925) (504) (601) (97) -
4432 Attica Hospital District 1 1,799,812 1,205,080 707,597 29,768 (28,642) 5,351 8,102 (608) -
4434 City of Galena 4,988,317 3,339,971 1,961,160 51,722 (90,350) (52,815) (6,536) (3,448) -
4435 City of South Hutchinson 991,369 663,780 389,757 (24,804) (58,495) (49,820) (47,024) (5,256) -
4454 Logan County Hospital 8,072,701 5,405,148 3,173,788 106,931 (6,461) 164,548 68,543 (567) -
4458 Hospital Dist 1 of Rice County 7,622,305 5,103,581 2,996,714 132,296 (73,668) (20,389) 8,995 (2,552) -
4459 Comanche County Conservation Dist 27,987 18,739 11,003 928 522 169 73 (9) -
4460 Morton County Extension Council 27,966 18,725 10,995 3,906 1,762 14 450 44 -
4467 Wallace Co Conservation Dist 24,188 16,196 9,510 429 (385) (229) (84) (17) -
4468 USD 353 Recreation Comm 231,950 155,304 91,191 1,767 (5,036) (4,147) 8,438 1,089 -
4476 Johnson Co Consolidated Fire Dist No 2 192,380 128,810 75,634 9,473 2,156 2,705 1,464 (1) -
4480 Riverside Twp Sedgwick County 110,340 73,879 43,380 1,390 (1,371) 1,512 (4,441) (719) -
4484 Brown County Extension Council 35,229 23,588 13,850 889 (110) 16 2,344 279 -
4485 Kingman County Extension Council 30,533 20,444 12,004 (4,561) (5,412) (2,420) 589 78 -
4490 Lakin Cemetery District 1 & 2 - - - (6,916) (7,198) (5,259) (839) - -
4496 City of Colwich 528,993 354,192 207,974 34,635 21,672 14,191 6,218 280 -
4505 Trego County Conservation Dist 62,339 41,740 24,509 3,486 1,072 958 329 (20) -
4518 Rush County Conservation Dist 58,457 39,140 22,982 (3,088) (1,400) (68) 107 (21) -
4529 Phillips County Conservation District 57,518 38,512 22,613 2,858 (1,174) (3,224) (2,731) (298) -
4534 Clark County Extension Council 29,928 20,038 11,766 930 263 721 383 9 -
4543 City of Conway Springs 376,913 252,365 148,184 23,287 10,717 12,866 8,307 538 -
4557 Clark County Conservation District 36,230 24,258 14,244 1,015 305 450 65 (19) -
4558 City of Prairie Village 4,281,094 2,866,444 1,683,115 147,268 31,289 63,082 48,219 2,004 -
4561 City of Rexford 38,589 25,837 15,171 1,113 258 567 390 11 -
4565 Hospital Dist 1 of Dickinson County 16,201,063 10,847,564 6,369,459 328,398 (51,216) 158,530 213,738 12,026 -
4573 Woodson County Conservation District 28,049 18,781 11,028 99 (701) (69) 120 (9) -
4583 City of Overland Park 34,408,177 23,038,296 13,527,597 748,162 (59,515) 176,970 181,264 27 -
4589 Wilson County Conservation Dist 76,259 51,060 29,981 (711) (270) 2,511 1,085 19 -
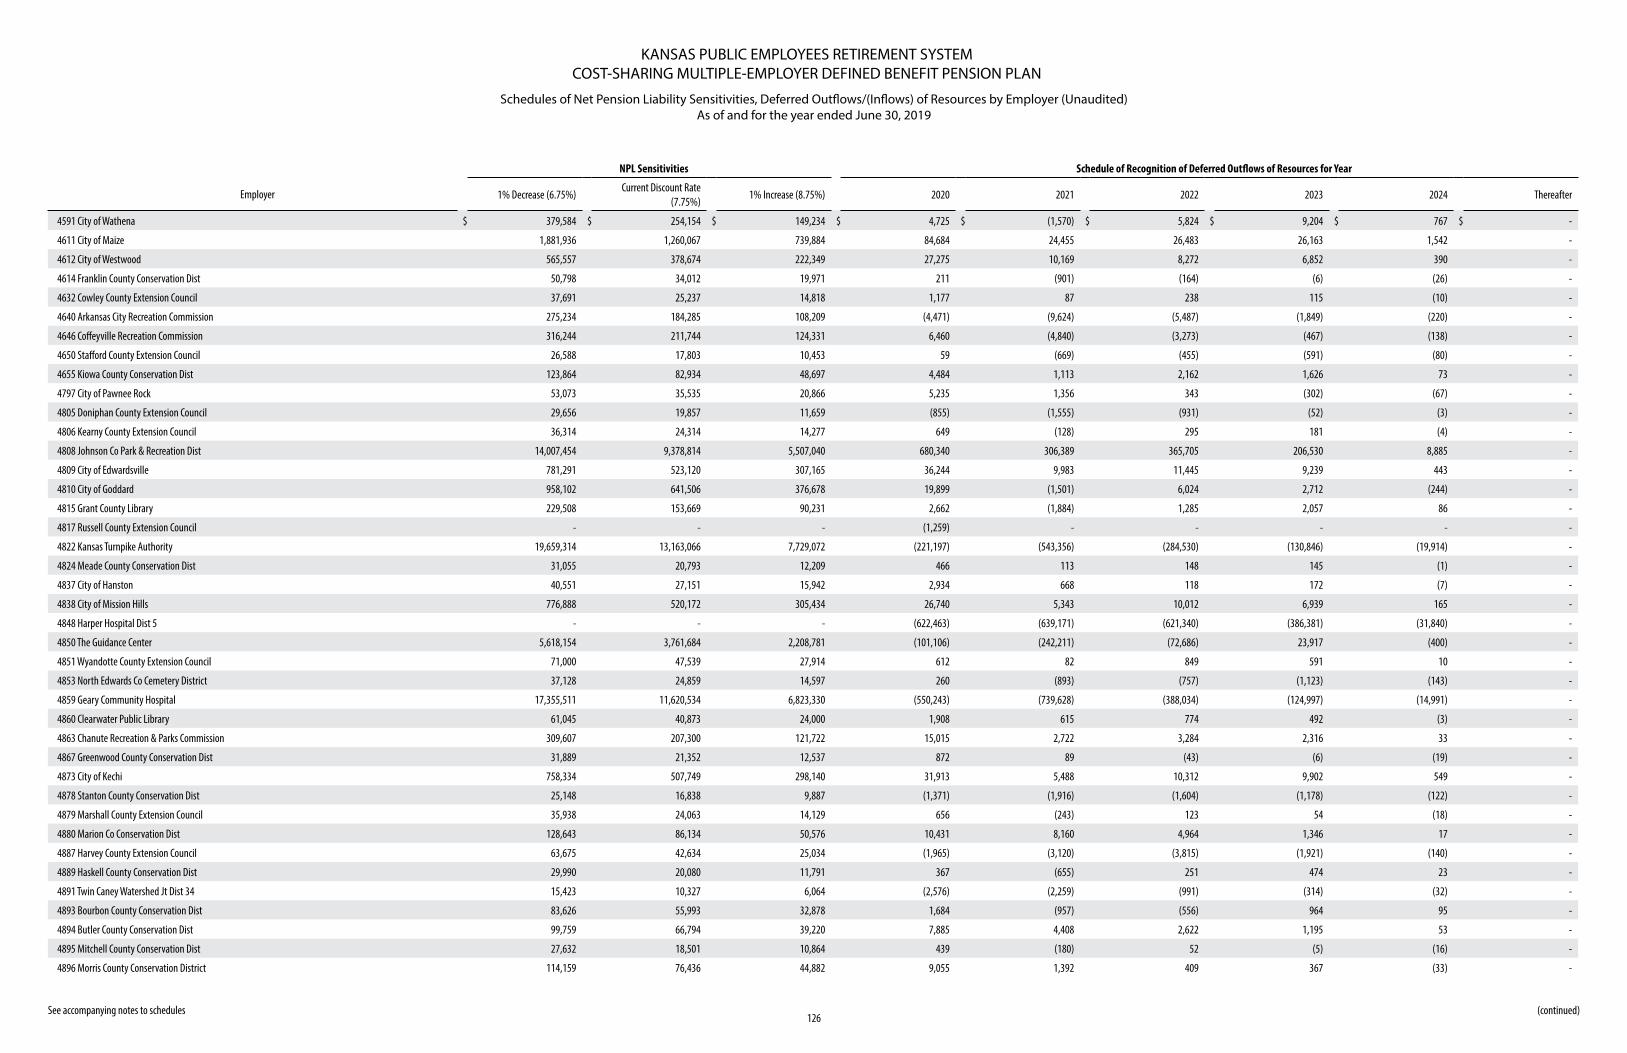
KANSAS PUBLIC EMPLOYEES RETIREMENT SYSTEMCOST-SHARING MULTIPLE-EMPLOYER DEFINED BENEFIT PENSION PLAN
Schedules of Net Pension Liability Sensitivities, Deferred Outflows/(Inflows) of Resources by Employer (Unaudited) As of and for the year ended June 30, 2019
See accompanying notes to schedules126
(continued)
NPL Sensitivities Schedule of Recognition of Deferred Outflows of Resources for Year
Employer 1% Decrease (6.75%)Current Discount Rate
(7.75%)1% Increase (8.75%) 2020 2021 2022 2023 2024 Thereafter
4591 City of Wathena $ 379,584 $ 254,154 $ 149,234 $ 4,725 $ (1,570) $ 5,824 $ 9,204 $ 767 $ -
4611 City of Maize 1,881,936 1,260,067 739,884 84,684 24,455 26,483 26,163 1,542 -
4612 City of Westwood 565,557 378,674 222,349 27,275 10,169 8,272 6,852 390 -
4614 Franklin County Conservation Dist 50,798 34,012 19,971 211 (901) (164) (6) (26) -
4632 Cowley County Extension Council 37,691 25,237 14,818 1,177 87 238 115 (10) -
4640 Arkansas City Recreation Commission 275,234 184,285 108,209 (4,471) (9,624) (5,487) (1,849) (220) -
4646 Coffeyville Recreation Commission 316,244 211,744 124,331 6,460 (4,840) (3,273) (467) (138) -
4650 Stafford County Extension Council 26,588 17,803 10,453 59 (669) (455) (591) (80) -
4655 Kiowa County Conservation Dist 123,864 82,934 48,697 4,484 1,113 2,162 1,626 73 -
4797 City of Pawnee Rock 53,073 35,535 20,866 5,235 1,356 343 (302) (67) -
4805 Doniphan County Extension Council 29,656 19,857 11,659 (855) (1,555) (931) (52) (3) -
4806 Kearny County Extension Council 36,314 24,314 14,277 649 (128) 295 181 (4) -
4808 Johnson Co Park & Recreation Dist 14,007,454 9,378,814 5,507,040 680,340 306,389 365,705 206,530 8,885 -
4809 City of Edwardsville 781,291 523,120 307,165 36,244 9,983 11,445 9,239 443 -
4810 City of Goddard 958,102 641,506 376,678 19,899 (1,501) 6,024 2,712 (244) -
4815 Grant County Library 229,508 153,669 90,231 2,662 (1,884) 1,285 2,057 86 -
4817 Russell County Extension Council - - - (1,259) - - - - -
4822 Kansas Turnpike Authority 19,659,314 13,163,066 7,729,072 (221,197) (543,356) (284,530) (130,846) (19,914) -
4824 Meade County Conservation Dist 31,055 20,793 12,209 466 113 148 145 (1) -
4837 City of Hanston 40,551 27,151 15,942 2,934 668 118 172 (7) -
4838 City of Mission Hills 776,888 520,172 305,434 26,740 5,343 10,012 6,939 165 -
4848 Harper Hospital Dist 5 - - - (622,463) (639,171) (621,340) (386,381) (31,840) -
4850 The Guidance Center 5,618,154 3,761,684 2,208,781 (101,106) (242,211) (72,686) 23,917 (400) -
4851 Wyandotte County Extension Council 71,000 47,539 27,914 612 82 849 591 10 -
4853 North Edwards Co Cemetery District 37,128 24,859 14,597 260 (893) (757) (1,123) (143) -
4859 Geary Community Hospital 17,355,511 11,620,534 6,823,330 (550,243) (739,628) (388,034) (124,997) (14,991) -
4860 Clearwater Public Library 61,045 40,873 24,000 1,908 615 774 492 (3) -
4863 Chanute Recreation & Parks Commission 309,607 207,300 121,722 15,015 2,722 3,284 2,316 33 -
4867 Greenwood County Conservation Dist 31,889 21,352 12,537 872 89 (43) (6) (19) -
4873 City of Kechi 758,334 507,749 298,140 31,913 5,488 10,312 9,902 549 -
4878 Stanton County Conservation Dist 25,148 16,838 9,887 (1,371) (1,916) (1,604) (1,178) (122) -
4879 Marshall County Extension Council 35,938 24,063 14,129 656 (243) 123 54 (18) -
4880 Marion Co Conservation Dist 128,643 86,134 50,576 10,431 8,160 4,964 1,346 17 -
4887 Harvey County Extension Council 63,675 42,634 25,034 (1,965) (3,120) (3,815) (1,921) (140) -
4889 Haskell County Conservation Dist 29,990 20,080 11,791 367 (655) 251 474 23 -
4891 Twin Caney Watershed Jt Dist 34 15,423 10,327 6,064 (2,576) (2,259) (991) (314) (32) -
4893 Bourbon County Conservation Dist 83,626 55,993 32,878 1,684 (957) (556) 964 95 -
4894 Butler County Conservation Dist 99,759 66,794 39,220 7,885 4,408 2,622 1,195 53 -
4895 Mitchell County Conservation Dist 27,632 18,501 10,864 439 (180) 52 (5) (16) -
4896 Morris County Conservation District 114,159 76,436 44,882 9,055 1,392 409 367 (33) -
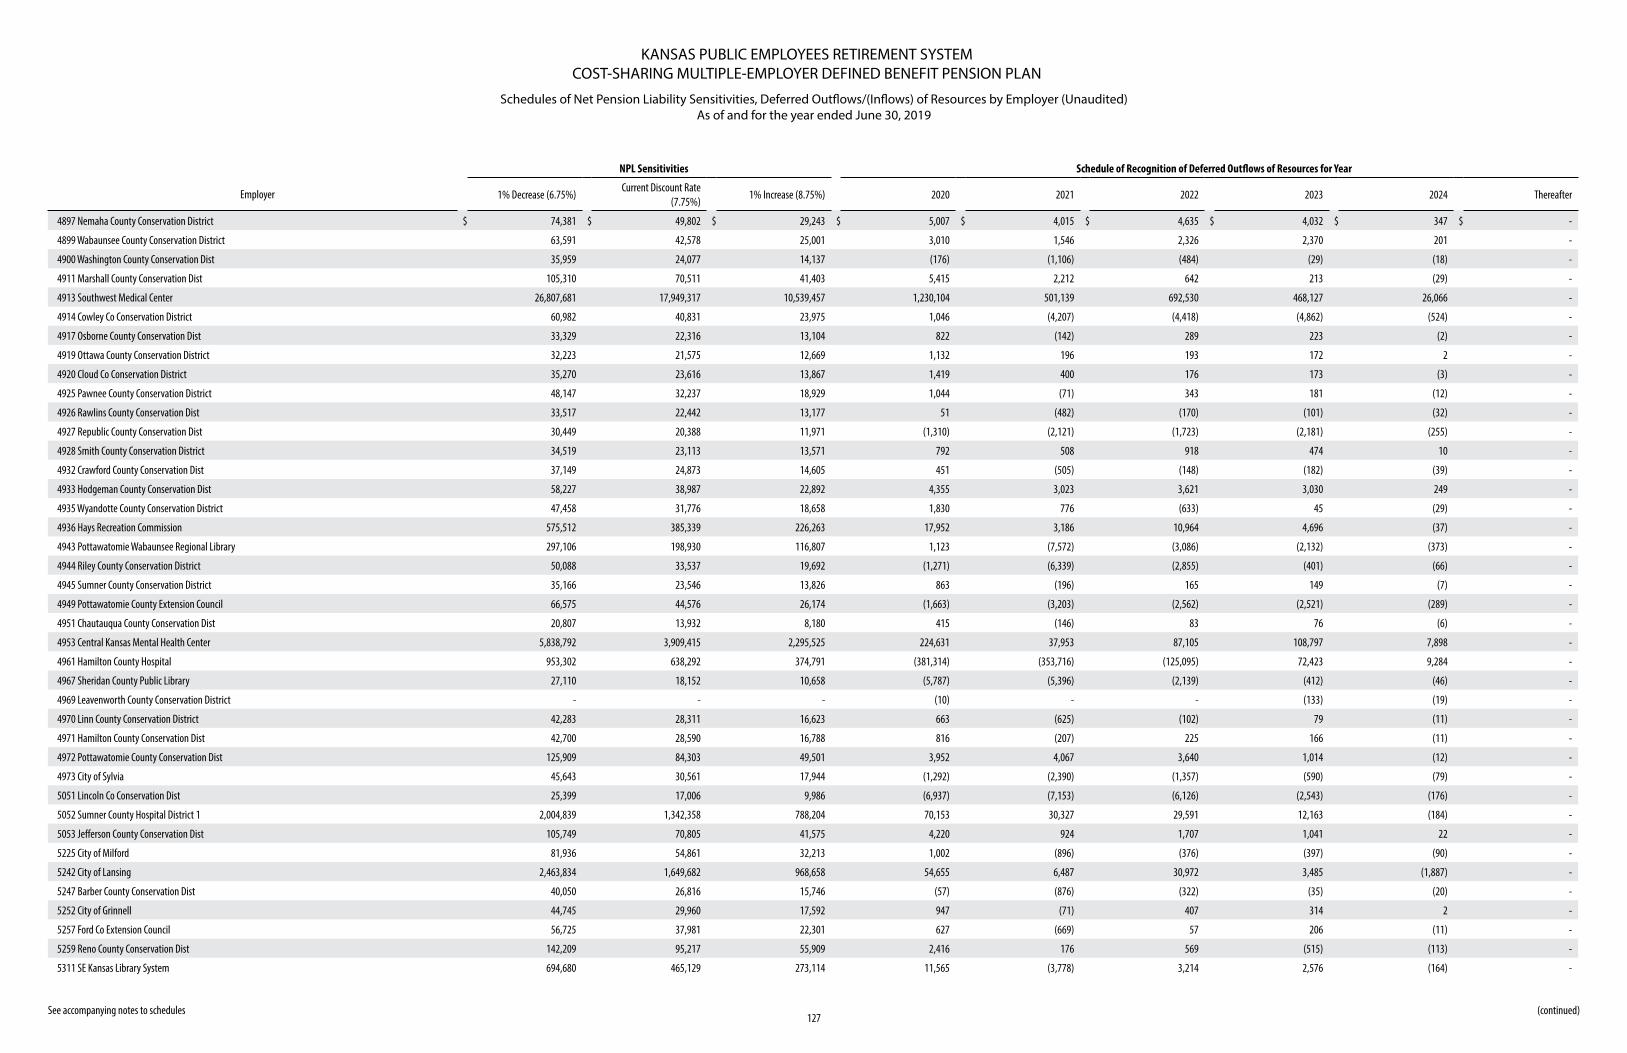
KANSAS PUBLIC EMPLOYEES RETIREMENT SYSTEMCOST-SHARING MULTIPLE-EMPLOYER DEFINED BENEFIT PENSION PLAN
Schedules of Net Pension Liability Sensitivities, Deferred Outflows/(Inflows) of Resources by Employer (Unaudited) As of and for the year ended June 30, 2019
See accompanying notes to schedules127
(continued)
NPL Sensitivities Schedule of Recognition of Deferred Outflows of Resources for Year
Employer 1% Decrease (6.75%)Current Discount Rate
(7.75%)1% Increase (8.75%) 2020 2021 2022 2023 2024 Thereafter
4897 Nemaha County Conservation District $ 74,381 $ 49,802 $ 29,243 $ 5,007 $ 4,015 $ 4,635 $ 4,032 $ 347 $ -
4899 Wabaunsee County Conservation District 63,591 42,578 25,001 3,010 1,546 2,326 2,370 201 -
4900 Washington County Conservation Dist 35,959 24,077 14,137 (176) (1,106) (484) (29) (18) -
4911 Marshall County Conservation Dist 105,310 70,511 41,403 5,415 2,212 642 213 (29) -
4913 Southwest Medical Center 26,807,681 17,949,317 10,539,457 1,230,104 501,139 692,530 468,127 26,066 -
4914 Cowley Co Conservation District 60,982 40,831 23,975 1,046 (4,207) (4,418) (4,862) (524) -
4917 Osborne County Conservation Dist 33,329 22,316 13,104 822 (142) 289 223 (2) -
4919 Ottawa County Conservation District 32,223 21,575 12,669 1,132 196 193 172 2 -
4920 Cloud Co Conservation District 35,270 23,616 13,867 1,419 400 176 173 (3) -
4925 Pawnee County Conservation District 48,147 32,237 18,929 1,044 (71) 343 181 (12) -
4926 Rawlins County Conservation Dist 33,517 22,442 13,177 51 (482) (170) (101) (32) -
4927 Republic County Conservation Dist 30,449 20,388 11,971 (1,310) (2,121) (1,723) (2,181) (255) -
4928 Smith County Conservation District 34,519 23,113 13,571 792 508 918 474 10 -
4932 Crawford County Conservation Dist 37,149 24,873 14,605 451 (505) (148) (182) (39) -
4933 Hodgeman County Conservation Dist 58,227 38,987 22,892 4,355 3,023 3,621 3,030 249 -
4935 Wyandotte County Conservation District 47,458 31,776 18,658 1,830 776 (633) 45 (29) -
4936 Hays Recreation Commission 575,512 385,339 226,263 17,952 3,186 10,964 4,696 (37) -
4943 Pottawatomie Wabaunsee Regional Library 297,106 198,930 116,807 1,123 (7,572) (3,086) (2,132) (373) -
4944 Riley County Conservation District 50,088 33,537 19,692 (1,271) (6,339) (2,855) (401) (66) -
4945 Sumner County Conservation District 35,166 23,546 13,826 863 (196) 165 149 (7) -
4949 Pottawatomie County Extension Council 66,575 44,576 26,174 (1,663) (3,203) (2,562) (2,521) (289) -
4951 Chautauqua County Conservation Dist 20,807 13,932 8,180 415 (146) 83 76 (6) -
4953 Central Kansas Mental Health Center 5,838,792 3,909,415 2,295,525 224,631 37,953 87,105 108,797 7,898 -
4961 Hamilton County Hospital 953,302 638,292 374,791 (381,314) (353,716) (125,095) 72,423 9,284 -
4967 Sheridan County Public Library 27,110 18,152 10,658 (5,787) (5,396) (2,139) (412) (46) -
4969 Leavenworth County Conservation District - - - (10) - - (133) (19) -
4970 Linn County Conservation District 42,283 28,311 16,623 663 (625) (102) 79 (11) -
4971 Hamilton County Conservation Dist 42,700 28,590 16,788 816 (207) 225 166 (11) -
4972 Pottawatomie County Conservation Dist 125,909 84,303 49,501 3,952 4,067 3,640 1,014 (12) -
4973 City of Sylvia 45,643 30,561 17,944 (1,292) (2,390) (1,357) (590) (79) -
5051 Lincoln Co Conservation Dist 25,399 17,006 9,986 (6,937) (7,153) (6,126) (2,543) (176) -
5052 Sumner County Hospital District 1 2,004,839 1,342,358 788,204 70,153 30,327 29,591 12,163 (184) -
5053 Jefferson County Conservation Dist 105,749 70,805 41,575 4,220 924 1,707 1,041 22 -
5225 City of Milford 81,936 54,861 32,213 1,002 (896) (376) (397) (90) -
5242 City of Lansing 2,463,834 1,649,682 968,658 54,655 6,487 30,972 3,485 (1,887) -
5247 Barber County Conservation Dist 40,050 26,816 15,746 (57) (876) (322) (35) (20) -
5252 City of Grinnell 44,745 29,960 17,592 947 (71) 407 314 2 -
5257 Ford Co Extension Council 56,725 37,981 22,301 627 (669) 57 206 (11) -
5259 Reno County Conservation Dist 142,209 95,217 55,909 2,416 176 569 (515) (113) -
5311 SE Kansas Library System 694,680 465,129 273,114 11,565 (3,778) 3,214 2,576 (164) -
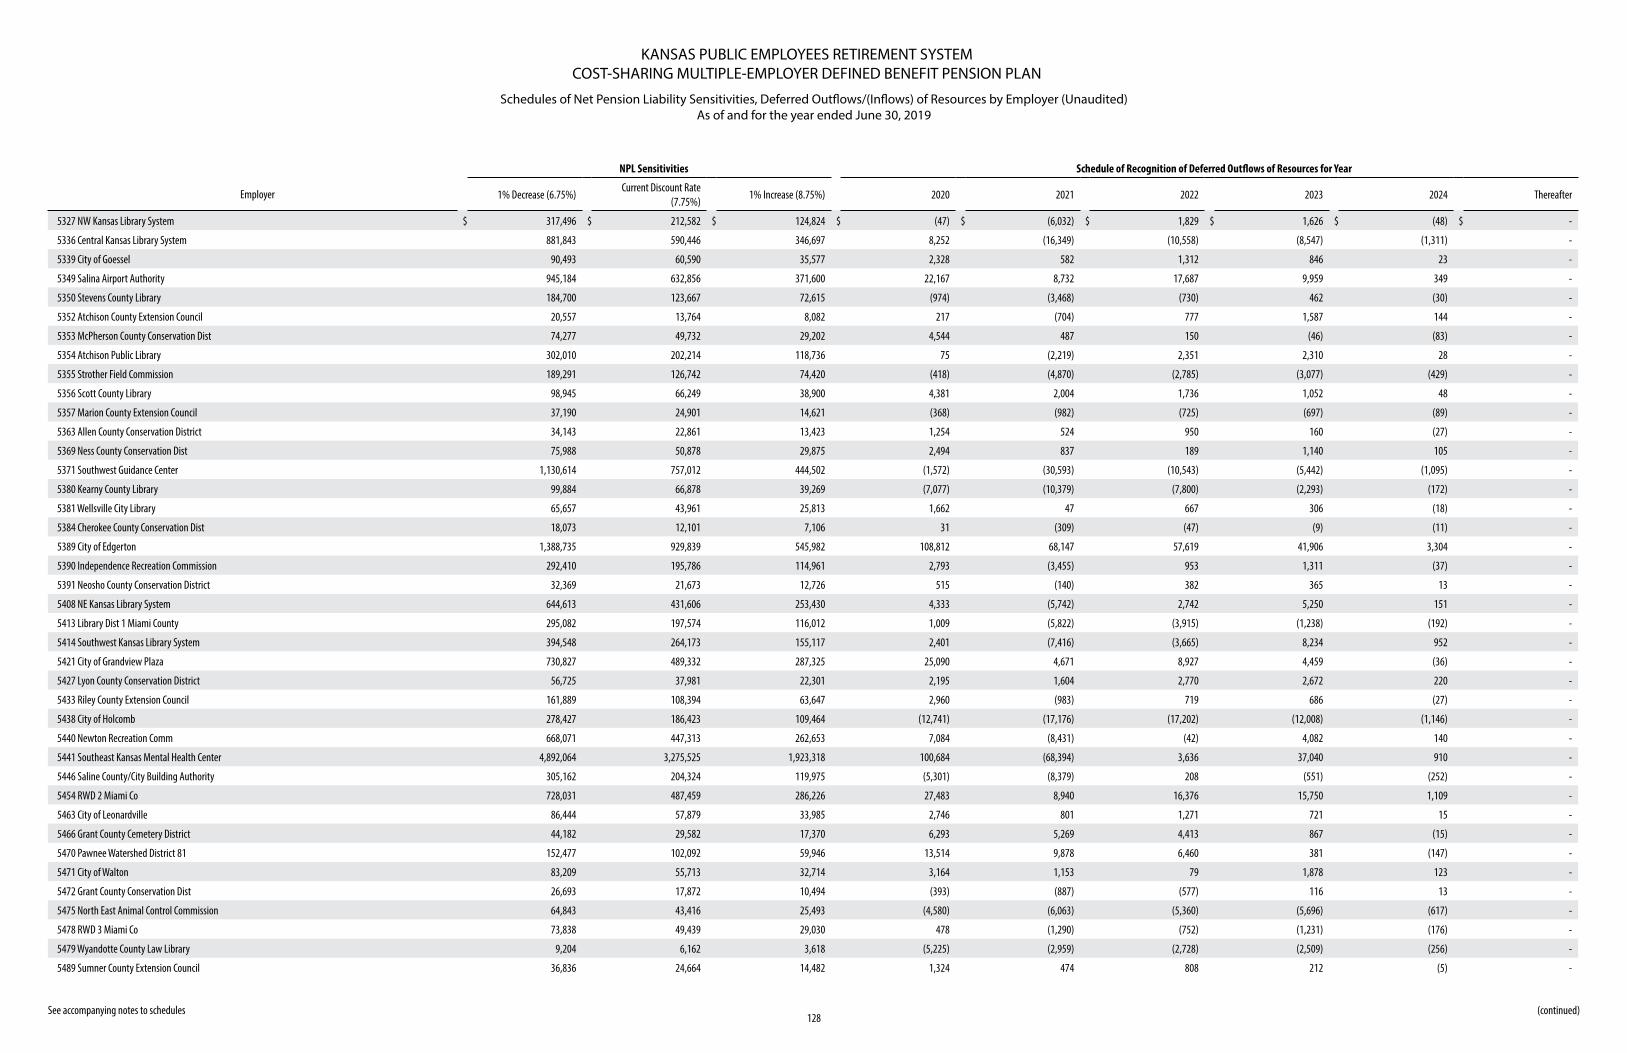
KANSAS PUBLIC EMPLOYEES RETIREMENT SYSTEMCOST-SHARING MULTIPLE-EMPLOYER DEFINED BENEFIT PENSION PLAN
Schedules of Net Pension Liability Sensitivities, Deferred Outflows/(Inflows) of Resources by Employer (Unaudited) As of and for the year ended June 30, 2019
See accompanying notes to schedules128
(continued)
NPL Sensitivities Schedule of Recognition of Deferred Outflows of Resources for Year
Employer 1% Decrease (6.75%)Current Discount Rate
(7.75%)1% Increase (8.75%) 2020 2021 2022 2023 2024 Thereafter
5327 NW Kansas Library System $ 317,496 $ 212,582 $ 124,824 $ (47) $ (6,032) $ 1,829 $ 1,626 $ (48) $ -
5336 Central Kansas Library System 881,843 590,446 346,697 8,252 (16,349) (10,558) (8,547) (1,311) -
5339 City of Goessel 90,493 60,590 35,577 2,328 582 1,312 846 23 -
5349 Salina Airport Authority 945,184 632,856 371,600 22,167 8,732 17,687 9,959 349 -
5350 Stevens County Library 184,700 123,667 72,615 (974) (3,468) (730) 462 (30) -
5352 Atchison County Extension Council 20,557 13,764 8,082 217 (704) 777 1,587 144 -
5353 McPherson County Conservation Dist 74,277 49,732 29,202 4,544 487 150 (46) (83) -
5354 Atchison Public Library 302,010 202,214 118,736 75 (2,219) 2,351 2,310 28 -
5355 Strother Field Commission 189,291 126,742 74,420 (418) (4,870) (2,785) (3,077) (429) -
5356 Scott County Library 98,945 66,249 38,900 4,381 2,004 1,736 1,052 48 -
5357 Marion County Extension Council 37,190 24,901 14,621 (368) (982) (725) (697) (89) -
5363 Allen County Conservation District 34,143 22,861 13,423 1,254 524 950 160 (27) -
5369 Ness County Conservation Dist 75,988 50,878 29,875 2,494 837 189 1,140 105 -
5371 Southwest Guidance Center 1,130,614 757,012 444,502 (1,572) (30,593) (10,543) (5,442) (1,095) -
5380 Kearny County Library 99,884 66,878 39,269 (7,077) (10,379) (7,800) (2,293) (172) -
5381 Wellsville City Library 65,657 43,961 25,813 1,662 47 667 306 (18) -
5384 Cherokee County Conservation Dist 18,073 12,101 7,106 31 (309) (47) (9) (11) -
5389 City of Edgerton 1,388,735 929,839 545,982 108,812 68,147 57,619 41,906 3,304 -
5390 Independence Recreation Commission 292,410 195,786 114,961 2,793 (3,455) 953 1,311 (37) -
5391 Neosho County Conservation District 32,369 21,673 12,726 515 (140) 382 365 13 -
5408 NE Kansas Library System 644,613 431,606 253,430 4,333 (5,742) 2,742 5,250 151 -
5413 Library Dist 1 Miami County 295,082 197,574 116,012 1,009 (5,822) (3,915) (1,238) (192) -
5414 Southwest Kansas Library System 394,548 264,173 155,117 2,401 (7,416) (3,665) 8,234 952 -
5421 City of Grandview Plaza 730,827 489,332 287,325 25,090 4,671 8,927 4,459 (36) -
5427 Lyon County Conservation District 56,725 37,981 22,301 2,195 1,604 2,770 2,672 220 -
5433 Riley County Extension Council 161,889 108,394 63,647 2,960 (983) 719 686 (27) -
5438 City of Holcomb 278,427 186,423 109,464 (12,741) (17,176) (17,202) (12,008) (1,146) -
5440 Newton Recreation Comm 668,071 447,313 262,653 7,084 (8,431) (42) 4,082 140 -
5441 Southeast Kansas Mental Health Center 4,892,064 3,275,525 1,923,318 100,684 (68,394) 3,636 37,040 910 -
5446 Saline County/City Building Authority 305,162 204,324 119,975 (5,301) (8,379) 208 (551) (252) -
5454 RWD 2 Miami Co 728,031 487,459 286,226 27,483 8,940 16,376 15,750 1,109 -
5463 City of Leonardville 86,444 57,879 33,985 2,746 801 1,271 721 15 -
5466 Grant County Cemetery District 44,182 29,582 17,370 6,293 5,269 4,413 867 (15) -
5470 Pawnee Watershed District 81 152,477 102,092 59,946 13,514 9,878 6,460 381 (147) -
5471 City of Walton 83,209 55,713 32,714 3,164 1,153 79 1,878 123 -
5472 Grant County Conservation Dist 26,693 17,872 10,494 (393) (887) (577) 116 13 -
5475 North East Animal Control Commission 64,843 43,416 25,493 (4,580) (6,063) (5,360) (5,696) (617) -
5478 RWD 3 Miami Co 73,838 49,439 29,030 478 (1,290) (752) (1,231) (176) -
5479 Wyandotte County Law Library 9,204 6,162 3,618 (5,225) (2,959) (2,728) (2,509) (256) -
5489 Sumner County Extension Council 36,836 24,664 14,482 1,324 474 808 212 (5) -
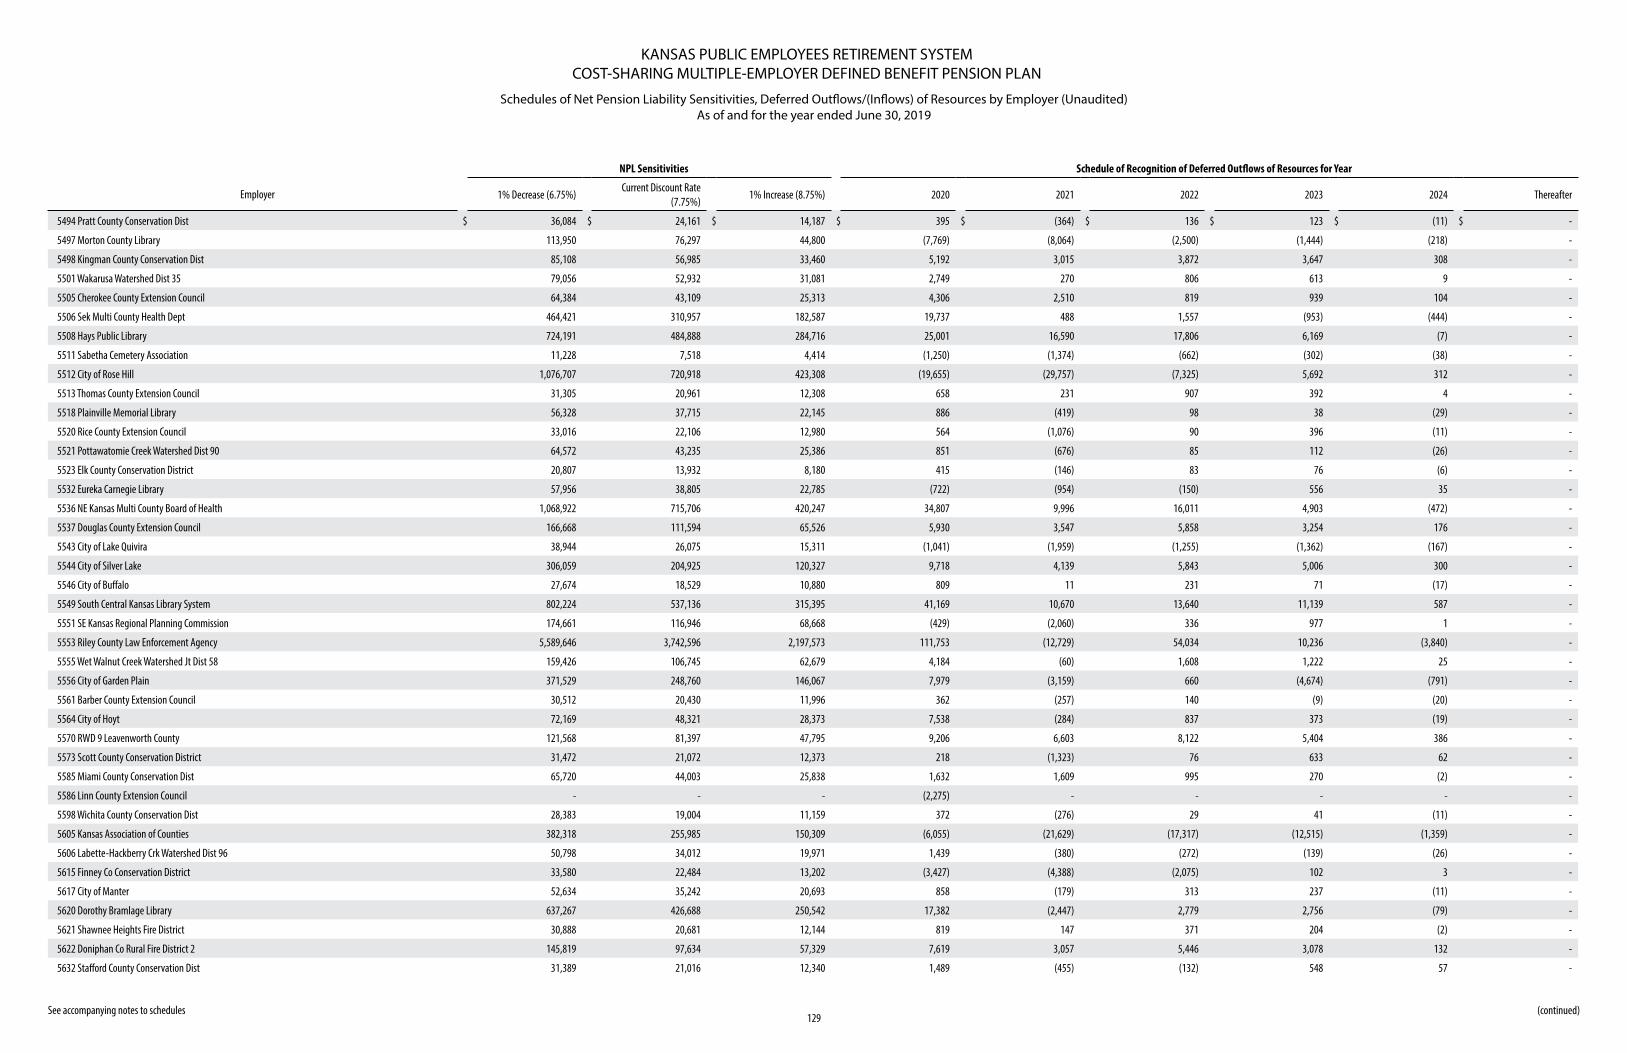
KANSAS PUBLIC EMPLOYEES RETIREMENT SYSTEMCOST-SHARING MULTIPLE-EMPLOYER DEFINED BENEFIT PENSION PLAN
Schedules of Net Pension Liability Sensitivities, Deferred Outflows/(Inflows) of Resources by Employer (Unaudited) As of and for the year ended June 30, 2019
See accompanying notes to schedules129
(continued)
NPL Sensitivities Schedule of Recognition of Deferred Outflows of Resources for Year
Employer 1% Decrease (6.75%)Current Discount Rate
(7.75%)1% Increase (8.75%) 2020 2021 2022 2023 2024 Thereafter
5494 Pratt County Conservation Dist $ 36,084 $ 24,161 $ 14,187 $ 395 $ (364) $ 136 $ 123 $ (11) $ -
5497 Morton County Library 113,950 76,297 44,800 (7,769) (8,064) (2,500) (1,444) (218) -
5498 Kingman County Conservation Dist 85,108 56,985 33,460 5,192 3,015 3,872 3,647 308 -
5501 Wakarusa Watershed Dist 35 79,056 52,932 31,081 2,749 270 806 613 9 -
5505 Cherokee County Extension Council 64,384 43,109 25,313 4,306 2,510 819 939 104 -
5506 Sek Multi County Health Dept 464,421 310,957 182,587 19,737 488 1,557 (953) (444) -
5508 Hays Public Library 724,191 484,888 284,716 25,001 16,590 17,806 6,169 (7) -
5511 Sabetha Cemetery Association 11,228 7,518 4,414 (1,250) (1,374) (662) (302) (38) -
5512 City of Rose Hill 1,076,707 720,918 423,308 (19,655) (29,757) (7,325) 5,692 312 -
5513 Thomas County Extension Council 31,305 20,961 12,308 658 231 907 392 4 -
5518 Plainville Memorial Library 56,328 37,715 22,145 886 (419) 98 38 (29) -
5520 Rice County Extension Council 33,016 22,106 12,980 564 (1,076) 90 396 (11) -
5521 Pottawatomie Creek Watershed Dist 90 64,572 43,235 25,386 851 (676) 85 112 (26) -
5523 Elk County Conservation District 20,807 13,932 8,180 415 (146) 83 76 (6) -
5532 Eureka Carnegie Library 57,956 38,805 22,785 (722) (954) (150) 556 35 -
5536 NE Kansas Multi County Board of Health 1,068,922 715,706 420,247 34,807 9,996 16,011 4,903 (472) -
5537 Douglas County Extension Council 166,668 111,594 65,526 5,930 3,547 5,858 3,254 176 -
5543 City of Lake Quivira 38,944 26,075 15,311 (1,041) (1,959) (1,255) (1,362) (167) -
5544 City of Silver Lake 306,059 204,925 120,327 9,718 4,139 5,843 5,006 300 -
5546 City of Buffalo 27,674 18,529 10,880 809 11 231 71 (17) -
5549 South Central Kansas Library System 802,224 537,136 315,395 41,169 10,670 13,640 11,139 587 -
5551 SE Kansas Regional Planning Commission 174,661 116,946 68,668 (429) (2,060) 336 977 1 -
5553 Riley County Law Enforcement Agency 5,589,646 3,742,596 2,197,573 111,753 (12,729) 54,034 10,236 (3,840) -
5555 Wet Walnut Creek Watershed Jt Dist 58 159,426 106,745 62,679 4,184 (60) 1,608 1,222 25 -
5556 City of Garden Plain 371,529 248,760 146,067 7,979 (3,159) 660 (4,674) (791) -
5561 Barber County Extension Council 30,512 20,430 11,996 362 (257) 140 (9) (20) -
5564 City of Hoyt 72,169 48,321 28,373 7,538 (284) 837 373 (19) -
5570 RWD 9 Leavenworth County 121,568 81,397 47,795 9,206 6,603 8,122 5,404 386 -
5573 Scott County Conservation District 31,472 21,072 12,373 218 (1,323) 76 633 62 -
5585 Miami County Conservation Dist 65,720 44,003 25,838 1,632 1,609 995 270 (2) -
5586 Linn County Extension Council - - - (2,275) - - - - -
5598 Wichita County Conservation Dist 28,383 19,004 11,159 372 (276) 29 41 (11) -
5605 Kansas Association of Counties 382,318 255,985 150,309 (6,055) (21,629) (17,317) (12,515) (1,359) -
5606 Labette-Hackberry Crk Watershed Dist 96 50,798 34,012 19,971 1,439 (380) (272) (139) (26) -
5615 Finney Co Conservation District 33,580 22,484 13,202 (3,427) (4,388) (2,075) 102 3 -
5617 City of Manter 52,634 35,242 20,693 858 (179) 313 237 (11) -
5620 Dorothy Bramlage Library 637,267 426,688 250,542 17,382 (2,447) 2,779 2,756 (79) -
5621 Shawnee Heights Fire District 30,888 20,681 12,144 819 147 371 204 (2) -
5622 Doniphan Co Rural Fire District 2 145,819 97,634 57,329 7,619 3,057 5,446 3,078 132 -
5632 Stafford County Conservation Dist 31,389 21,016 12,340 1,489 (455) (132) 548 57 -
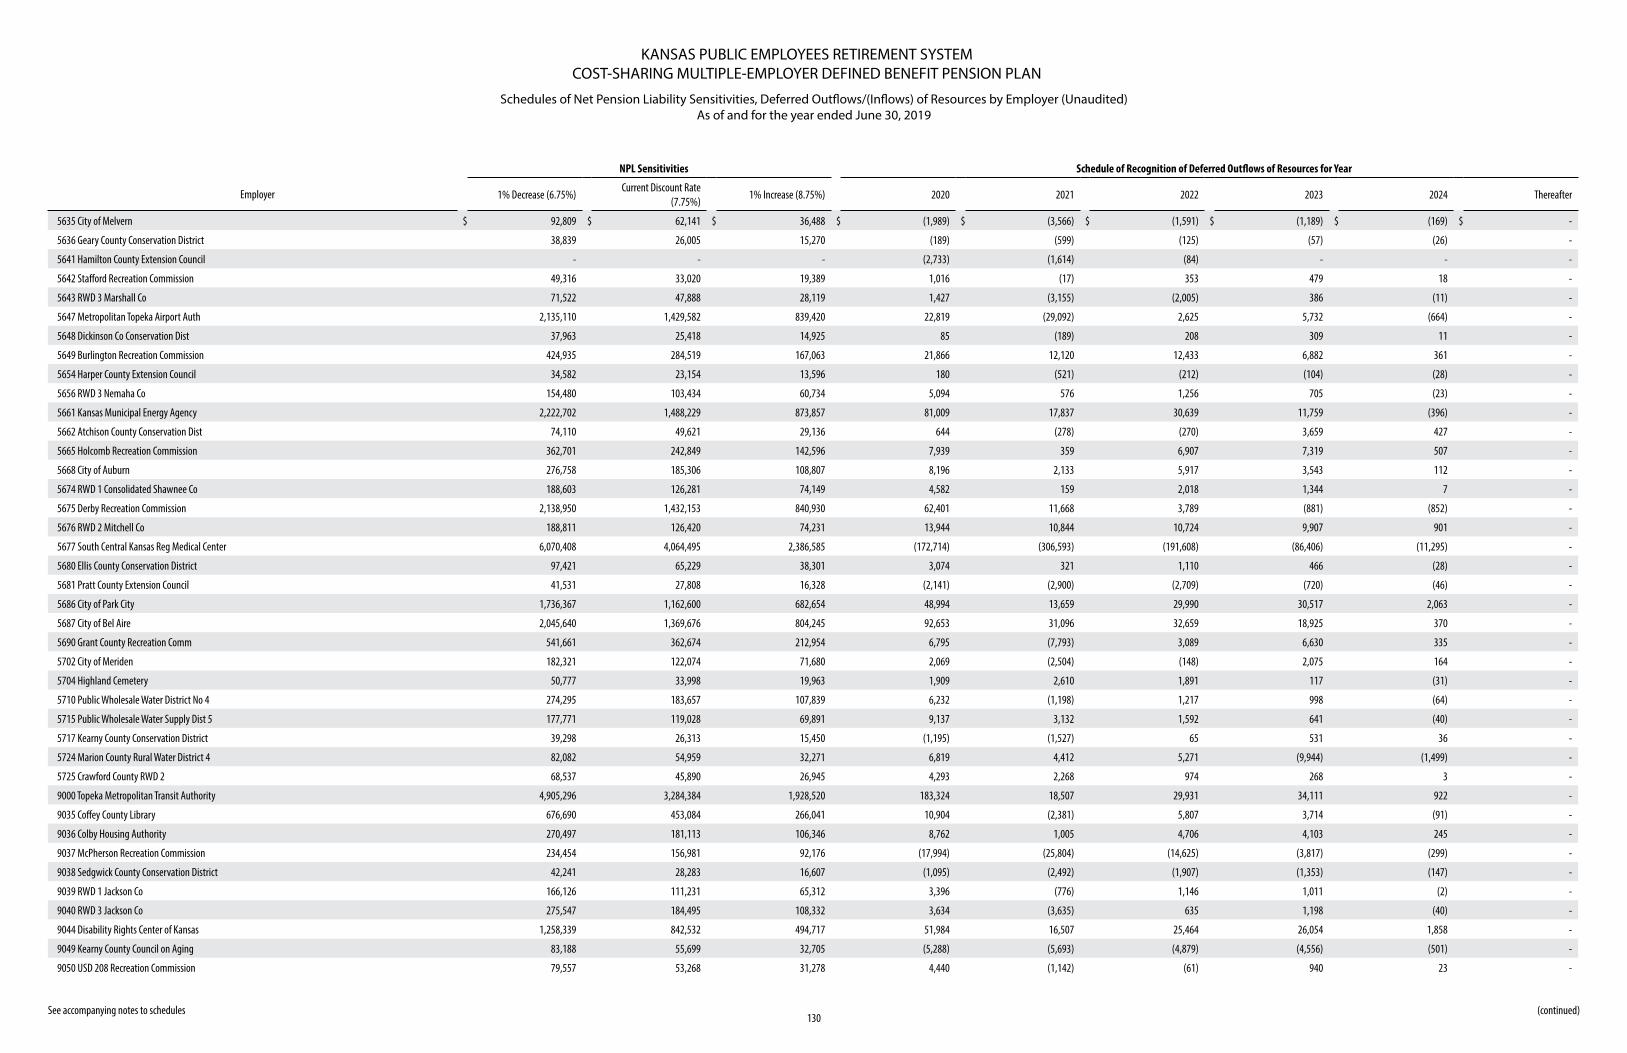
KANSAS PUBLIC EMPLOYEES RETIREMENT SYSTEMCOST-SHARING MULTIPLE-EMPLOYER DEFINED BENEFIT PENSION PLAN
Schedules of Net Pension Liability Sensitivities, Deferred Outflows/(Inflows) of Resources by Employer (Unaudited) As of and for the year ended June 30, 2019
See accompanying notes to schedules130
(continued)
NPL Sensitivities Schedule of Recognition of Deferred Outflows of Resources for Year
Employer 1% Decrease (6.75%)Current Discount Rate
(7.75%)1% Increase (8.75%) 2020 2021 2022 2023 2024 Thereafter
5635 City of Melvern $ 92,809 $ 62,141 $ 36,488 $ (1,989) $ (3,566) $ (1,591) $ (1,189) $ (169) $ -
5636 Geary County Conservation District 38,839 26,005 15,270 (189) (599) (125) (57) (26) -
5641 Hamilton County Extension Council - - - (2,733) (1,614) (84) - - -
5642 Stafford Recreation Commission 49,316 33,020 19,389 1,016 (17) 353 479 18 -
5643 RWD 3 Marshall Co 71,522 47,888 28,119 1,427 (3,155) (2,005) 386 (11) -
5647 Metropolitan Topeka Airport Auth 2,135,110 1,429,582 839,420 22,819 (29,092) 2,625 5,732 (664) -
5648 Dickinson Co Conservation Dist 37,963 25,418 14,925 85 (189) 208 309 11 -
5649 Burlington Recreation Commission 424,935 284,519 167,063 21,866 12,120 12,433 6,882 361 -
5654 Harper County Extension Council 34,582 23,154 13,596 180 (521) (212) (104) (28) -
5656 RWD 3 Nemaha Co 154,480 103,434 60,734 5,094 576 1,256 705 (23) -
5661 Kansas Municipal Energy Agency 2,222,702 1,488,229 873,857 81,009 17,837 30,639 11,759 (396) -
5662 Atchison County Conservation Dist 74,110 49,621 29,136 644 (278) (270) 3,659 427 -
5665 Holcomb Recreation Commission 362,701 242,849 142,596 7,939 359 6,907 7,319 507 -
5668 City of Auburn 276,758 185,306 108,807 8,196 2,133 5,917 3,543 112 -
5674 RWD 1 Consolidated Shawnee Co 188,603 126,281 74,149 4,582 159 2,018 1,344 7 -
5675 Derby Recreation Commission 2,138,950 1,432,153 840,930 62,401 11,668 3,789 (881) (852) -
5676 RWD 2 Mitchell Co 188,811 126,420 74,231 13,944 10,844 10,724 9,907 901 -
5677 South Central Kansas Reg Medical Center 6,070,408 4,064,495 2,386,585 (172,714) (306,593) (191,608) (86,406) (11,295) -
5680 Ellis County Conservation District 97,421 65,229 38,301 3,074 321 1,110 466 (28) -
5681 Pratt County Extension Council 41,531 27,808 16,328 (2,141) (2,900) (2,709) (720) (46) -
5686 City of Park City 1,736,367 1,162,600 682,654 48,994 13,659 29,990 30,517 2,063 -
5687 City of Bel Aire 2,045,640 1,369,676 804,245 92,653 31,096 32,659 18,925 370 -
5690 Grant County Recreation Comm 541,661 362,674 212,954 6,795 (7,793) 3,089 6,630 335 -
5702 City of Meriden 182,321 122,074 71,680 2,069 (2,504) (148) 2,075 164 -
5704 Highland Cemetery 50,777 33,998 19,963 1,909 2,610 1,891 117 (31) -
5710 Public Wholesale Water District No 4 274,295 183,657 107,839 6,232 (1,198) 1,217 998 (64) -
5715 Public Wholesale Water Supply Dist 5 177,771 119,028 69,891 9,137 3,132 1,592 641 (40) -
5717 Kearny County Conservation District 39,298 26,313 15,450 (1,195) (1,527) 65 531 36 -
5724 Marion County Rural Water District 4 82,082 54,959 32,271 6,819 4,412 5,271 (9,944) (1,499) -
5725 Crawford County RWD 2 68,537 45,890 26,945 4,293 2,268 974 268 3 -
9000 Topeka Metropolitan Transit Authority 4,905,296 3,284,384 1,928,520 183,324 18,507 29,931 34,111 922 -
9035 Coffey County Library 676,690 453,084 266,041 10,904 (2,381) 5,807 3,714 (91) -
9036 Colby Housing Authority 270,497 181,113 106,346 8,762 1,005 4,706 4,103 245 -
9037 McPherson Recreation Commission 234,454 156,981 92,176 (17,994) (25,804) (14,625) (3,817) (299) -
9038 Sedgwick County Conservation District 42,241 28,283 16,607 (1,095) (2,492) (1,907) (1,353) (147) -
9039 RWD 1 Jackson Co 166,126 111,231 65,312 3,396 (776) 1,146 1,011 (2) -
9040 RWD 3 Jackson Co 275,547 184,495 108,332 3,634 (3,635) 635 1,198 (40) -
9044 Disability Rights Center of Kansas 1,258,339 842,532 494,717 51,984 16,507 25,464 26,054 1,858 -
9049 Kearny County Council on Aging 83,188 55,699 32,705 (5,288) (5,693) (4,879) (4,556) (501) -
9050 USD 208 Recreation Commission 79,557 53,268 31,278 4,440 (1,142) (61) 940 23 -
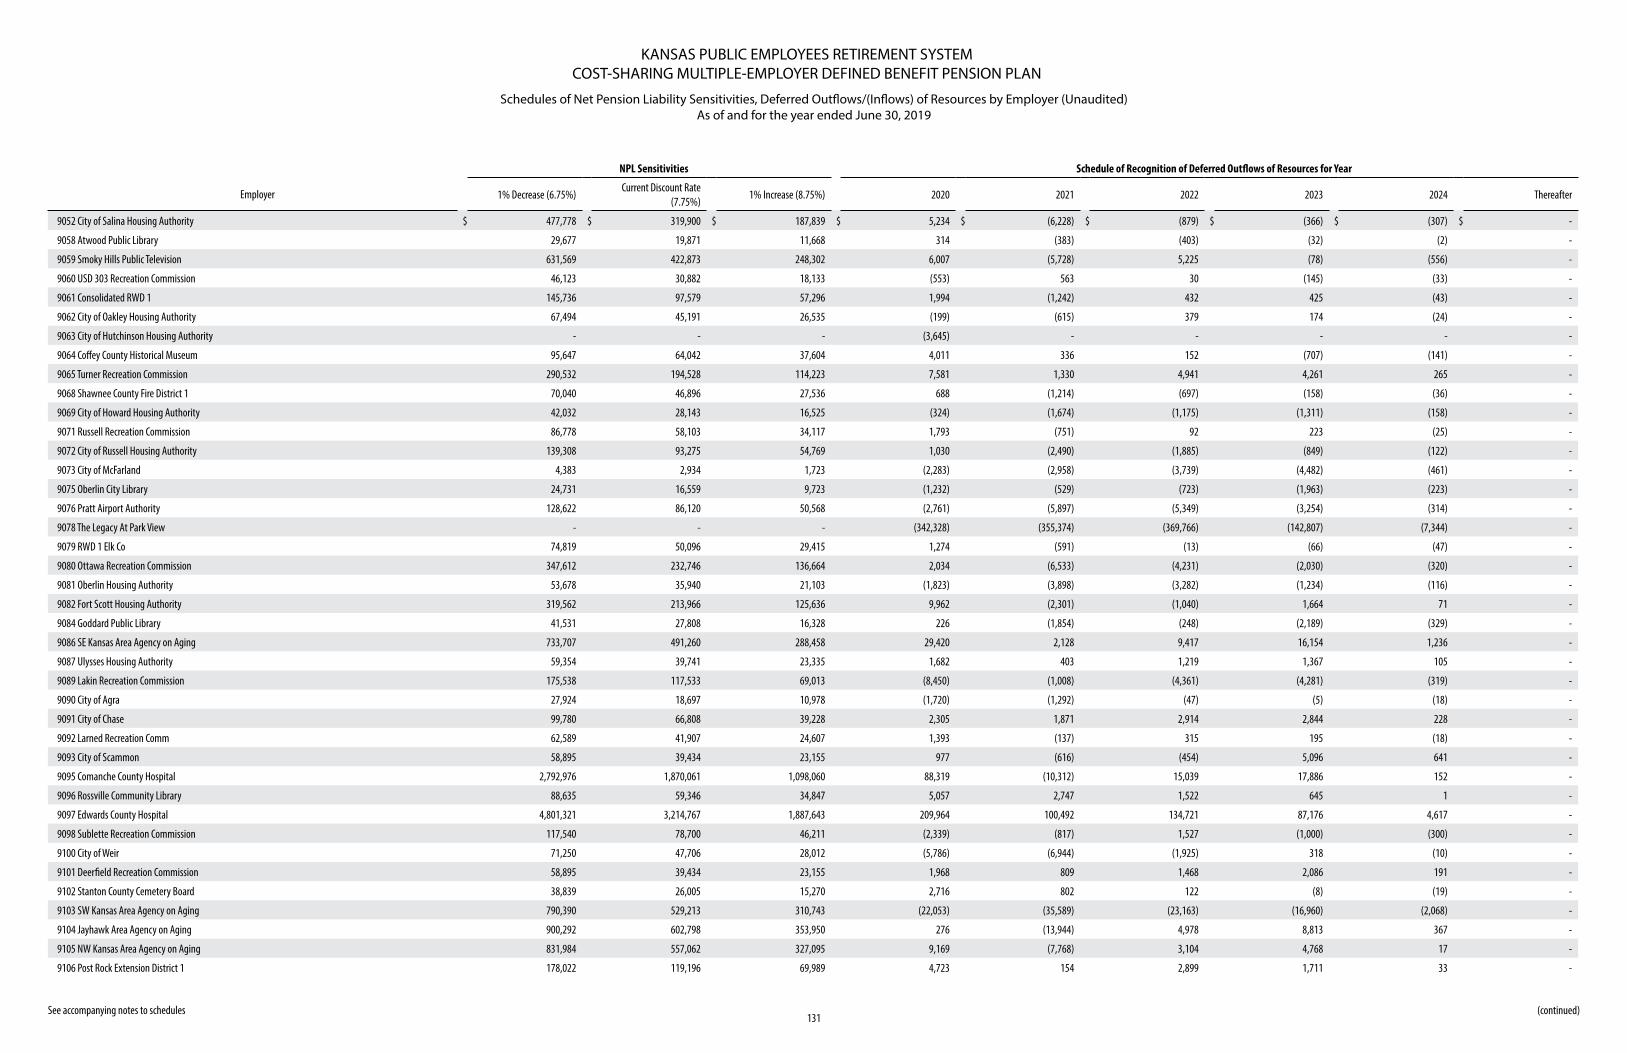
KANSAS PUBLIC EMPLOYEES RETIREMENT SYSTEMCOST-SHARING MULTIPLE-EMPLOYER DEFINED BENEFIT PENSION PLAN
Schedules of Net Pension Liability Sensitivities, Deferred Outflows/(Inflows) of Resources by Employer (Unaudited) As of and for the year ended June 30, 2019
See accompanying notes to schedules131
(continued)
NPL Sensitivities Schedule of Recognition of Deferred Outflows of Resources for Year
Employer 1% Decrease (6.75%)Current Discount Rate
(7.75%)1% Increase (8.75%) 2020 2021 2022 2023 2024 Thereafter
9052 City of Salina Housing Authority $ 477,778 $ 319,900 $ 187,839 $ 5,234 $ (6,228) $ (879) $ (366) $ (307) $ -
9058 Atwood Public Library 29,677 19,871 11,668 314 (383) (403) (32) (2) -
9059 Smoky Hills Public Television 631,569 422,873 248,302 6,007 (5,728) 5,225 (78) (556) -
9060 USD 303 Recreation Commission 46,123 30,882 18,133 (553) 563 30 (145) (33) -
9061 Consolidated RWD 1 145,736 97,579 57,296 1,994 (1,242) 432 425 (43) -
9062 City of Oakley Housing Authority 67,494 45,191 26,535 (199) (615) 379 174 (24) -
9063 City of Hutchinson Housing Authority - - - (3,645) - - - - -
9064 Coffey County Historical Museum 95,647 64,042 37,604 4,011 336 152 (707) (141) -
9065 Turner Recreation Commission 290,532 194,528 114,223 7,581 1,330 4,941 4,261 265 -
9068 Shawnee County Fire District 1 70,040 46,896 27,536 688 (1,214) (697) (158) (36) -
9069 City of Howard Housing Authority 42,032 28,143 16,525 (324) (1,674) (1,175) (1,311) (158) -
9071 Russell Recreation Commission 86,778 58,103 34,117 1,793 (751) 92 223 (25) -
9072 City of Russell Housing Authority 139,308 93,275 54,769 1,030 (2,490) (1,885) (849) (122) -
9073 City of McFarland 4,383 2,934 1,723 (2,283) (2,958) (3,739) (4,482) (461) -
9075 Oberlin City Library 24,731 16,559 9,723 (1,232) (529) (723) (1,963) (223) -
9076 Pratt Airport Authority 128,622 86,120 50,568 (2,761) (5,897) (5,349) (3,254) (314) -
9078 The Legacy At Park View - - - (342,328) (355,374) (369,766) (142,807) (7,344) -
9079 RWD 1 Elk Co 74,819 50,096 29,415 1,274 (591) (13) (66) (47) -
9080 Ottawa Recreation Commission 347,612 232,746 136,664 2,034 (6,533) (4,231) (2,030) (320) -
9081 Oberlin Housing Authority 53,678 35,940 21,103 (1,823) (3,898) (3,282) (1,234) (116) -
9082 Fort Scott Housing Authority 319,562 213,966 125,636 9,962 (2,301) (1,040) 1,664 71 -
9084 Goddard Public Library 41,531 27,808 16,328 226 (1,854) (248) (2,189) (329) -
9086 SE Kansas Area Agency on Aging 733,707 491,260 288,458 29,420 2,128 9,417 16,154 1,236 -
9087 Ulysses Housing Authority 59,354 39,741 23,335 1,682 403 1,219 1,367 105 -
9089 Lakin Recreation Commission 175,538 117,533 69,013 (8,450) (1,008) (4,361) (4,281) (319) -
9090 City of Agra 27,924 18,697 10,978 (1,720) (1,292) (47) (5) (18) -
9091 City of Chase 99,780 66,808 39,228 2,305 1,871 2,914 2,844 228 -
9092 Larned Recreation Comm 62,589 41,907 24,607 1,393 (137) 315 195 (18) -
9093 City of Scammon 58,895 39,434 23,155 977 (616) (454) 5,096 641 -
9095 Comanche County Hospital 2,792,976 1,870,061 1,098,060 88,319 (10,312) 15,039 17,886 152 -
9096 Rossville Community Library 88,635 59,346 34,847 5,057 2,747 1,522 645 1 -
9097 Edwards County Hospital 4,801,321 3,214,767 1,887,643 209,964 100,492 134,721 87,176 4,617 -
9098 Sublette Recreation Commission 117,540 78,700 46,211 (2,339) (817) 1,527 (1,000) (300) -
9100 City of Weir 71,250 47,706 28,012 (5,786) (6,944) (1,925) 318 (10) -
9101 Deerfield Recreation Commission 58,895 39,434 23,155 1,968 809 1,468 2,086 191 -
9102 Stanton County Cemetery Board 38,839 26,005 15,270 2,716 802 122 (8) (19) -
9103 SW Kansas Area Agency on Aging 790,390 529,213 310,743 (22,053) (35,589) (23,163) (16,960) (2,068) -
9104 Jayhawk Area Agency on Aging 900,292 602,798 353,950 276 (13,944) 4,978 8,813 367 -
9105 NW Kansas Area Agency on Aging 831,984 557,062 327,095 9,169 (7,768) 3,104 4,768 17 -
9106 Post Rock Extension District 1 178,022 119,196 69,989 4,723 154 2,899 1,711 33 -
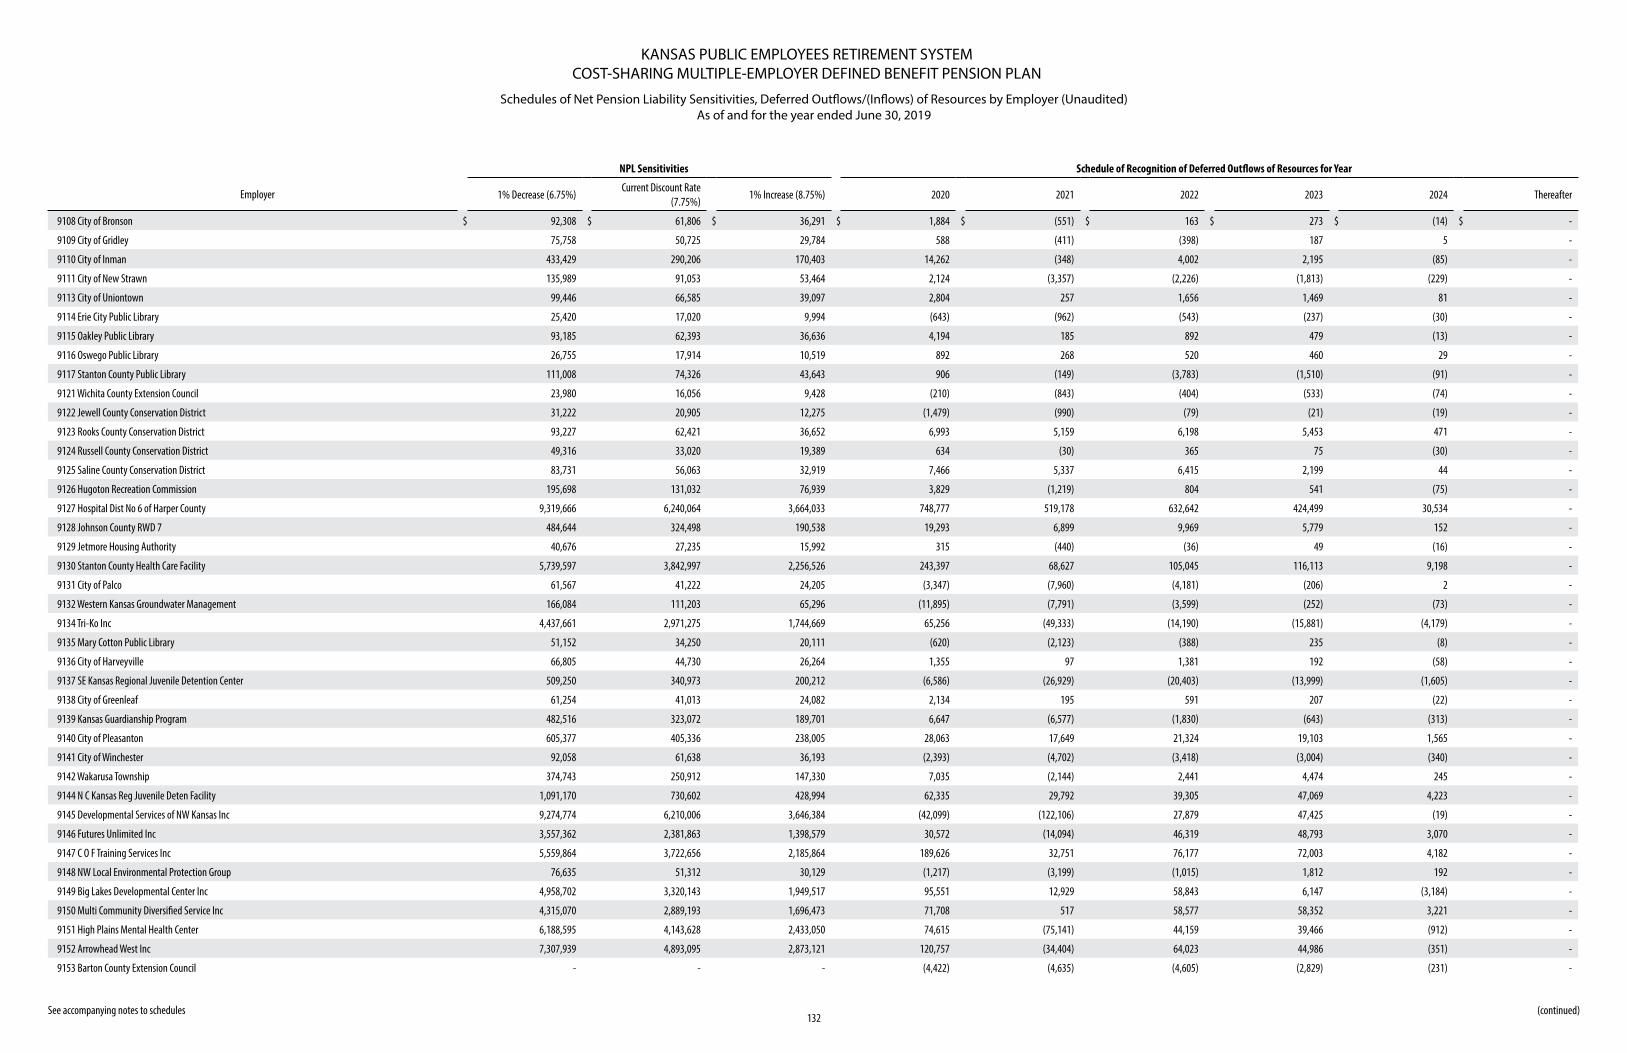
KANSAS PUBLIC EMPLOYEES RETIREMENT SYSTEMCOST-SHARING MULTIPLE-EMPLOYER DEFINED BENEFIT PENSION PLAN
Schedules of Net Pension Liability Sensitivities, Deferred Outflows/(Inflows) of Resources by Employer (Unaudited) As of and for the year ended June 30, 2019
See accompanying notes to schedules132
(continued)
NPL Sensitivities Schedule of Recognition of Deferred Outflows of Resources for Year
Employer 1% Decrease (6.75%)Current Discount Rate
(7.75%)1% Increase (8.75%) 2020 2021 2022 2023 2024 Thereafter
9108 City of Bronson $ 92,308 $ 61,806 $ 36,291 $ 1,884 $ (551) $ 163 $ 273 $ (14) $ -
9109 City of Gridley 75,758 50,725 29,784 588 (411) (398) 187 5 -
9110 City of Inman 433,429 290,206 170,403 14,262 (348) 4,002 2,195 (85) -
9111 City of New Strawn 135,989 91,053 53,464 2,124 (3,357) (2,226) (1,813) (229) -
9113 City of Uniontown 99,446 66,585 39,097 2,804 257 1,656 1,469 81 -
9114 Erie City Public Library 25,420 17,020 9,994 (643) (962) (543) (237) (30) -
9115 Oakley Public Library 93,185 62,393 36,636 4,194 185 892 479 (13) -
9116 Oswego Public Library 26,755 17,914 10,519 892 268 520 460 29 -
9117 Stanton County Public Library 111,008 74,326 43,643 906 (149) (3,783) (1,510) (91) -
9121 Wichita County Extension Council 23,980 16,056 9,428 (210) (843) (404) (533) (74) -
9122 Jewell County Conservation District 31,222 20,905 12,275 (1,479) (990) (79) (21) (19) -
9123 Rooks County Conservation District 93,227 62,421 36,652 6,993 5,159 6,198 5,453 471 -
9124 Russell County Conservation District 49,316 33,020 19,389 634 (30) 365 75 (30) -
9125 Saline County Conservation District 83,731 56,063 32,919 7,466 5,337 6,415 2,199 44 -
9126 Hugoton Recreation Commission 195,698 131,032 76,939 3,829 (1,219) 804 541 (75) -
9127 Hospital Dist No 6 of Harper County 9,319,666 6,240,064 3,664,033 748,777 519,178 632,642 424,499 30,534 -
9128 Johnson County RWD 7 484,644 324,498 190,538 19,293 6,899 9,969 5,779 152 -
9129 Jetmore Housing Authority 40,676 27,235 15,992 315 (440) (36) 49 (16) -
9130 Stanton County Health Care Facility 5,739,597 3,842,997 2,256,526 243,397 68,627 105,045 116,113 9,198 -
9131 City of Palco 61,567 41,222 24,205 (3,347) (7,960) (4,181) (206) 2 -
9132 Western Kansas Groundwater Management 166,084 111,203 65,296 (11,895) (7,791) (3,599) (252) (73) -
9134 Tri-Ko Inc 4,437,661 2,971,275 1,744,669 65,256 (49,333) (14,190) (15,881) (4,179) -
9135 Mary Cotton Public Library 51,152 34,250 20,111 (620) (2,123) (388) 235 (8) -
9136 City of Harveyville 66,805 44,730 26,264 1,355 97 1,381 192 (58) -
9137 SE Kansas Regional Juvenile Detention Center 509,250 340,973 200,212 (6,586) (26,929) (20,403) (13,999) (1,605) -
9138 City of Greenleaf 61,254 41,013 24,082 2,134 195 591 207 (22) -
9139 Kansas Guardianship Program 482,516 323,072 189,701 6,647 (6,577) (1,830) (643) (313) -
9140 City of Pleasanton 605,377 405,336 238,005 28,063 17,649 21,324 19,103 1,565 -
9141 City of Winchester 92,058 61,638 36,193 (2,393) (4,702) (3,418) (3,004) (340) -
9142 Wakarusa Township 374,743 250,912 147,330 7,035 (2,144) 2,441 4,474 245 -
9144 N C Kansas Reg Juvenile Deten Facility 1,091,170 730,602 428,994 62,335 29,792 39,305 47,069 4,223 -
9145 Developmental Services of NW Kansas Inc 9,274,774 6,210,006 3,646,384 (42,099) (122,106) 27,879 47,425 (19) -
9146 Futures Unlimited Inc 3,557,362 2,381,863 1,398,579 30,572 (14,094) 46,319 48,793 3,070 -
9147 C O F Training Services Inc 5,559,864 3,722,656 2,185,864 189,626 32,751 76,177 72,003 4,182 -
9148 NW Local Environmental Protection Group 76,635 51,312 30,129 (1,217) (3,199) (1,015) 1,812 192 -
9149 Big Lakes Developmental Center Inc 4,958,702 3,320,143 1,949,517 95,551 12,929 58,843 6,147 (3,184) -
9150 Multi Community Diversified Service Inc 4,315,070 2,889,193 1,696,473 71,708 517 58,577 58,352 3,221 -
9151 High Plains Mental Health Center 6,188,595 4,143,628 2,433,050 74,615 (75,141) 44,159 39,466 (912) -
9152 Arrowhead West Inc 7,307,939 4,893,095 2,873,121 120,757 (34,404) 64,023 44,986 (351) -
9153 Barton County Extension Council - - - (4,422) (4,635) (4,605) (2,829) (231) -
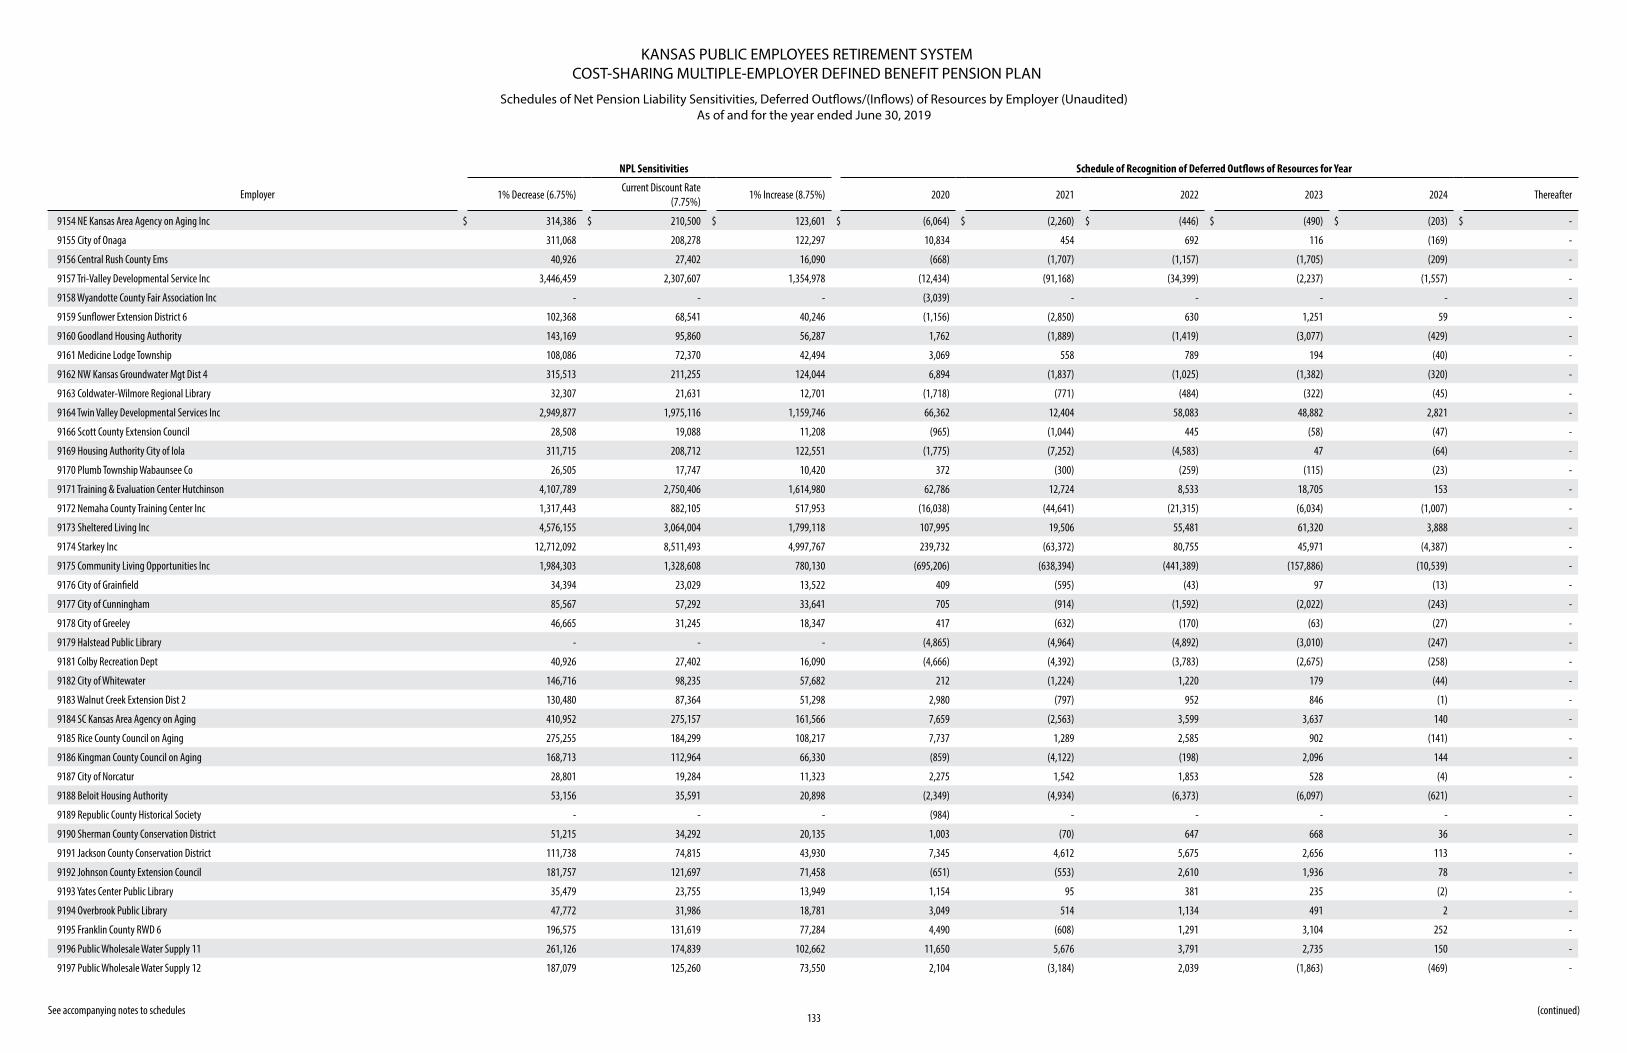
KANSAS PUBLIC EMPLOYEES RETIREMENT SYSTEMCOST-SHARING MULTIPLE-EMPLOYER DEFINED BENEFIT PENSION PLAN
Schedules of Net Pension Liability Sensitivities, Deferred Outflows/(Inflows) of Resources by Employer (Unaudited) As of and for the year ended June 30, 2019
See accompanying notes to schedules133
(continued)
NPL Sensitivities Schedule of Recognition of Deferred Outflows of Resources for Year
Employer 1% Decrease (6.75%)Current Discount Rate
(7.75%)1% Increase (8.75%) 2020 2021 2022 2023 2024 Thereafter
9154 NE Kansas Area Agency on Aging Inc $ 314,386 $ 210,500 $ 123,601 $ (6,064) $ (2,260) $ (446) $ (490) $ (203) $ -
9155 City of Onaga 311,068 208,278 122,297 10,834 454 692 116 (169) -
9156 Central Rush County Ems 40,926 27,402 16,090 (668) (1,707) (1,157) (1,705) (209) -
9157 Tri-Valley Developmental Service Inc 3,446,459 2,307,607 1,354,978 (12,434) (91,168) (34,399) (2,237) (1,557) -
9158 Wyandotte County Fair Association Inc - - - (3,039) - - - - -
9159 Sunflower Extension District 6 102,368 68,541 40,246 (1,156) (2,850) 630 1,251 59 -
9160 Goodland Housing Authority 143,169 95,860 56,287 1,762 (1,889) (1,419) (3,077) (429) -
9161 Medicine Lodge Township 108,086 72,370 42,494 3,069 558 789 194 (40) -
9162 NW Kansas Groundwater Mgt Dist 4 315,513 211,255 124,044 6,894 (1,837) (1,025) (1,382) (320) -
9163 Coldwater-Wilmore Regional Library 32,307 21,631 12,701 (1,718) (771) (484) (322) (45) -
9164 Twin Valley Developmental Services Inc 2,949,877 1,975,116 1,159,746 66,362 12,404 58,083 48,882 2,821 -
9166 Scott County Extension Council 28,508 19,088 11,208 (965) (1,044) 445 (58) (47) -
9169 Housing Authority City of Iola 311,715 208,712 122,551 (1,775) (7,252) (4,583) 47 (64) -
9170 Plumb Township Wabaunsee Co 26,505 17,747 10,420 372 (300) (259) (115) (23) -
9171 Training & Evaluation Center Hutchinson 4,107,789 2,750,406 1,614,980 62,786 12,724 8,533 18,705 153 -
9172 Nemaha County Training Center Inc 1,317,443 882,105 517,953 (16,038) (44,641) (21,315) (6,034) (1,007) -
9173 Sheltered Living Inc 4,576,155 3,064,004 1,799,118 107,995 19,506 55,481 61,320 3,888 -
9174 Starkey Inc 12,712,092 8,511,493 4,997,767 239,732 (63,372) 80,755 45,971 (4,387) -
9175 Community Living Opportunities Inc 1,984,303 1,328,608 780,130 (695,206) (638,394) (441,389) (157,886) (10,539) -
9176 City of Grainfield 34,394 23,029 13,522 409 (595) (43) 97 (13) -
9177 City of Cunningham 85,567 57,292 33,641 705 (914) (1,592) (2,022) (243) -
9178 City of Greeley 46,665 31,245 18,347 417 (632) (170) (63) (27) -
9179 Halstead Public Library - - - (4,865) (4,964) (4,892) (3,010) (247) -
9181 Colby Recreation Dept 40,926 27,402 16,090 (4,666) (4,392) (3,783) (2,675) (258) -
9182 City of Whitewater 146,716 98,235 57,682 212 (1,224) 1,220 179 (44) -
9183 Walnut Creek Extension Dist 2 130,480 87,364 51,298 2,980 (797) 952 846 (1) -
9184 SC Kansas Area Agency on Aging 410,952 275,157 161,566 7,659 (2,563) 3,599 3,637 140 -
9185 Rice County Council on Aging 275,255 184,299 108,217 7,737 1,289 2,585 902 (141) -
9186 Kingman County Council on Aging 168,713 112,964 66,330 (859) (4,122) (198) 2,096 144 -
9187 City of Norcatur 28,801 19,284 11,323 2,275 1,542 1,853 528 (4) -
9188 Beloit Housing Authority 53,156 35,591 20,898 (2,349) (4,934) (6,373) (6,097) (621) -
9189 Republic County Historical Society - - - (984) - - - - -
9190 Sherman County Conservation District 51,215 34,292 20,135 1,003 (70) 647 668 36 -
9191 Jackson County Conservation District 111,738 74,815 43,930 7,345 4,612 5,675 2,656 113 -
9192 Johnson County Extension Council 181,757 121,697 71,458 (651) (553) 2,610 1,936 78 -
9193 Yates Center Public Library 35,479 23,755 13,949 1,154 95 381 235 (2) -
9194 Overbrook Public Library 47,772 31,986 18,781 3,049 514 1,134 491 2 -
9195 Franklin County RWD 6 196,575 131,619 77,284 4,490 (608) 1,291 3,104 252 -
9196 Public Wholesale Water Supply 11 261,126 174,839 102,662 11,650 5,676 3,791 2,735 150 -
9197 Public Wholesale Water Supply 12 187,079 125,260 73,550 2,104 (3,184) 2,039 (1,863) (469) -
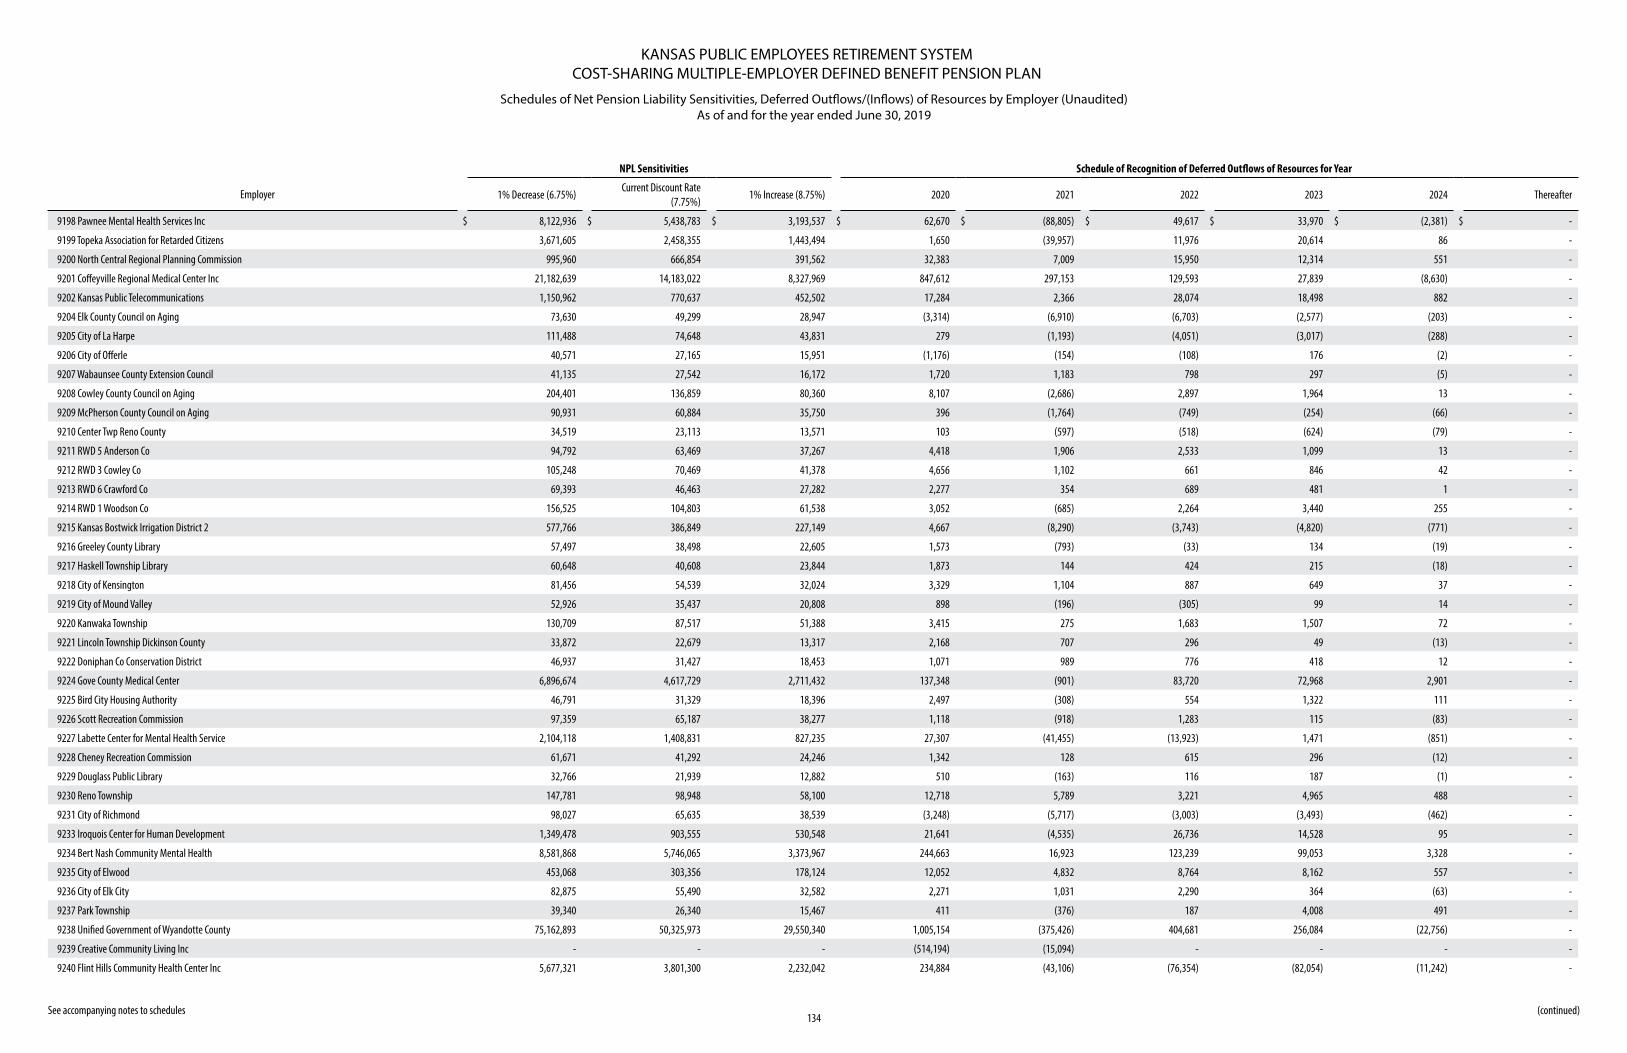
KANSAS PUBLIC EMPLOYEES RETIREMENT SYSTEMCOST-SHARING MULTIPLE-EMPLOYER DEFINED BENEFIT PENSION PLAN
Schedules of Net Pension Liability Sensitivities, Deferred Outflows/(Inflows) of Resources by Employer (Unaudited) As of and for the year ended June 30, 2019
See accompanying notes to schedules134
(continued)
NPL Sensitivities Schedule of Recognition of Deferred Outflows of Resources for Year
Employer 1% Decrease (6.75%)Current Discount Rate
(7.75%)1% Increase (8.75%) 2020 2021 2022 2023 2024 Thereafter
9198 Pawnee Mental Health Services Inc $ 8,122,936 $ 5,438,783 $ 3,193,537 $ 62,670 $ (88,805) $ 49,617 $ 33,970 $ (2,381) $ -
9199 Topeka Association for Retarded Citizens 3,671,605 2,458,355 1,443,494 1,650 (39,957) 11,976 20,614 86 -
9200 North Central Regional Planning Commission 995,960 666,854 391,562 32,383 7,009 15,950 12,314 551 -
9201 Coffeyville Regional Medical Center Inc 21,182,639 14,183,022 8,327,969 847,612 297,153 129,593 27,839 (8,630) -
9202 Kansas Public Telecommunications 1,150,962 770,637 452,502 17,284 2,366 28,074 18,498 882 -
9204 Elk County Council on Aging 73,630 49,299 28,947 (3,314) (6,910) (6,703) (2,577) (203) -
9205 City of La Harpe 111,488 74,648 43,831 279 (1,193) (4,051) (3,017) (288) -
9206 City of Offerle 40,571 27,165 15,951 (1,176) (154) (108) 176 (2) -
9207 Wabaunsee County Extension Council 41,135 27,542 16,172 1,720 1,183 798 297 (5) -
9208 Cowley County Council on Aging 204,401 136,859 80,360 8,107 (2,686) 2,897 1,964 13 -
9209 McPherson County Council on Aging 90,931 60,884 35,750 396 (1,764) (749) (254) (66) -
9210 Center Twp Reno County 34,519 23,113 13,571 103 (597) (518) (624) (79) -
9211 RWD 5 Anderson Co 94,792 63,469 37,267 4,418 1,906 2,533 1,099 13 -
9212 RWD 3 Cowley Co 105,248 70,469 41,378 4,656 1,102 661 846 42 -
9213 RWD 6 Crawford Co 69,393 46,463 27,282 2,277 354 689 481 1 -
9214 RWD 1 Woodson Co 156,525 104,803 61,538 3,052 (685) 2,264 3,440 255 -
9215 Kansas Bostwick Irrigation District 2 577,766 386,849 227,149 4,667 (8,290) (3,743) (4,820) (771) -
9216 Greeley County Library 57,497 38,498 22,605 1,573 (793) (33) 134 (19) -
9217 Haskell Township Library 60,648 40,608 23,844 1,873 144 424 215 (18) -
9218 City of Kensington 81,456 54,539 32,024 3,329 1,104 887 649 37 -
9219 City of Mound Valley 52,926 35,437 20,808 898 (196) (305) 99 14 -
9220 Kanwaka Township 130,709 87,517 51,388 3,415 275 1,683 1,507 72 -
9221 Lincoln Township Dickinson County 33,872 22,679 13,317 2,168 707 296 49 (13) -
9222 Doniphan Co Conservation District 46,937 31,427 18,453 1,071 989 776 418 12 -
9224 Gove County Medical Center 6,896,674 4,617,729 2,711,432 137,348 (901) 83,720 72,968 2,901 -
9225 Bird City Housing Authority 46,791 31,329 18,396 2,497 (308) 554 1,322 111 -
9226 Scott Recreation Commission 97,359 65,187 38,277 1,118 (918) 1,283 115 (83) -
9227 Labette Center for Mental Health Service 2,104,118 1,408,831 827,235 27,307 (41,455) (13,923) 1,471 (851) -
9228 Cheney Recreation Commission 61,671 41,292 24,246 1,342 128 615 296 (12) -
9229 Douglass Public Library 32,766 21,939 12,882 510 (163) 116 187 (1) -
9230 Reno Township 147,781 98,948 58,100 12,718 5,789 3,221 4,965 488 -
9231 City of Richmond 98,027 65,635 38,539 (3,248) (5,717) (3,003) (3,493) (462) -
9233 Iroquois Center for Human Development 1,349,478 903,555 530,548 21,641 (4,535) 26,736 14,528 95 -
9234 Bert Nash Community Mental Health 8,581,868 5,746,065 3,373,967 244,663 16,923 123,239 99,053 3,328 -
9235 City of Elwood 453,068 303,356 178,124 12,052 4,832 8,764 8,162 557 -
9236 City of Elk City 82,875 55,490 32,582 2,271 1,031 2,290 364 (63) -
9237 Park Township 39,340 26,340 15,467 411 (376) 187 4,008 491 -
9238 Unified Government of Wyandotte County 75,162,893 50,325,973 29,550,340 1,005,154 (375,426) 404,681 256,084 (22,756) -
9239 Creative Community Living Inc - - - (514,194) (15,094) - - - -
9240 Flint Hills Community Health Center Inc 5,677,321 3,801,300 2,232,042 234,884 (43,106) (76,354) (82,054) (11,242) -
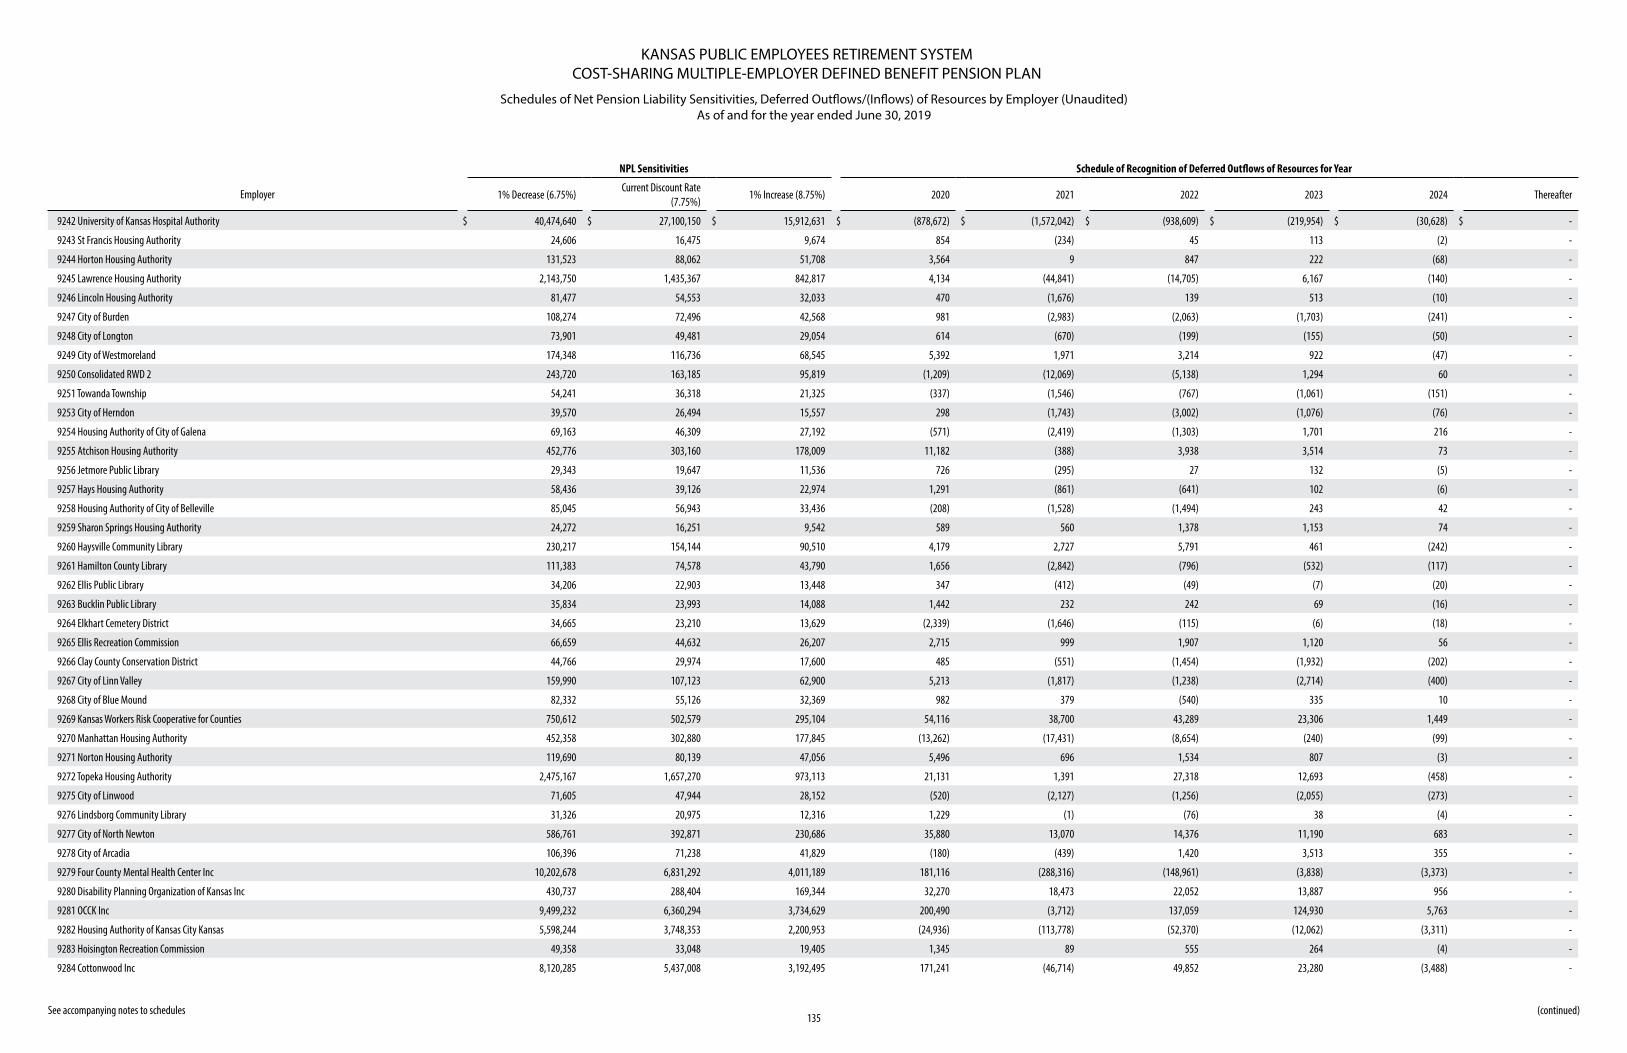
KANSAS PUBLIC EMPLOYEES RETIREMENT SYSTEMCOST-SHARING MULTIPLE-EMPLOYER DEFINED BENEFIT PENSION PLAN
Schedules of Net Pension Liability Sensitivities, Deferred Outflows/(Inflows) of Resources by Employer (Unaudited) As of and for the year ended June 30, 2019
See accompanying notes to schedules135
(continued)
NPL Sensitivities Schedule of Recognition of Deferred Outflows of Resources for Year
Employer 1% Decrease (6.75%)Current Discount Rate
(7.75%)1% Increase (8.75%) 2020 2021 2022 2023 2024 Thereafter
9242 University of Kansas Hospital Authority $ 40,474,640 $ 27,100,150 $ 15,912,631 $ (878,672) $ (1,572,042) $ (938,609) $ (219,954) $ (30,628) $ -
9243 St Francis Housing Authority 24,606 16,475 9,674 854 (234) 45 113 (2) -
9244 Horton Housing Authority 131,523 88,062 51,708 3,564 9 847 222 (68) -
9245 Lawrence Housing Authority 2,143,750 1,435,367 842,817 4,134 (44,841) (14,705) 6,167 (140) -
9246 Lincoln Housing Authority 81,477 54,553 32,033 470 (1,676) 139 513 (10) -
9247 City of Burden 108,274 72,496 42,568 981 (2,983) (2,063) (1,703) (241) -
9248 City of Longton 73,901 49,481 29,054 614 (670) (199) (155) (50) -
9249 City of Westmoreland 174,348 116,736 68,545 5,392 1,971 3,214 922 (47) -
9250 Consolidated RWD 2 243,720 163,185 95,819 (1,209) (12,069) (5,138) 1,294 60 -
9251 Towanda Township 54,241 36,318 21,325 (337) (1,546) (767) (1,061) (151) -
9253 City of Herndon 39,570 26,494 15,557 298 (1,743) (3,002) (1,076) (76) -
9254 Housing Authority of City of Galena 69,163 46,309 27,192 (571) (2,419) (1,303) 1,701 216 -
9255 Atchison Housing Authority 452,776 303,160 178,009 11,182 (388) 3,938 3,514 73 -
9256 Jetmore Public Library 29,343 19,647 11,536 726 (295) 27 132 (5) -
9257 Hays Housing Authority 58,436 39,126 22,974 1,291 (861) (641) 102 (6) -
9258 Housing Authority of City of Belleville 85,045 56,943 33,436 (208) (1,528) (1,494) 243 42 -
9259 Sharon Springs Housing Authority 24,272 16,251 9,542 589 560 1,378 1,153 74 -
9260 Haysville Community Library 230,217 154,144 90,510 4,179 2,727 5,791 461 (242) -
9261 Hamilton County Library 111,383 74,578 43,790 1,656 (2,842) (796) (532) (117) -
9262 Ellis Public Library 34,206 22,903 13,448 347 (412) (49) (7) (20) -
9263 Bucklin Public Library 35,834 23,993 14,088 1,442 232 242 69 (16) -
9264 Elkhart Cemetery District 34,665 23,210 13,629 (2,339) (1,646) (115) (6) (18) -
9265 Ellis Recreation Commission 66,659 44,632 26,207 2,715 999 1,907 1,120 56 -
9266 Clay County Conservation District 44,766 29,974 17,600 485 (551) (1,454) (1,932) (202) -
9267 City of Linn Valley 159,990 107,123 62,900 5,213 (1,817) (1,238) (2,714) (400) -
9268 City of Blue Mound 82,332 55,126 32,369 982 379 (540) 335 10 -
9269 Kansas Workers Risk Cooperative for Counties 750,612 502,579 295,104 54,116 38,700 43,289 23,306 1,449 -
9270 Manhattan Housing Authority 452,358 302,880 177,845 (13,262) (17,431) (8,654) (240) (99) -
9271 Norton Housing Authority 119,690 80,139 47,056 5,496 696 1,534 807 (3) -
9272 Topeka Housing Authority 2,475,167 1,657,270 973,113 21,131 1,391 27,318 12,693 (458) -
9275 City of Linwood 71,605 47,944 28,152 (520) (2,127) (1,256) (2,055) (273) -
9276 Lindsborg Community Library 31,326 20,975 12,316 1,229 (1) (76) 38 (4) -
9277 City of North Newton 586,761 392,871 230,686 35,880 13,070 14,376 11,190 683 -
9278 City of Arcadia 106,396 71,238 41,829 (180) (439) 1,420 3,513 355 -
9279 Four County Mental Health Center Inc 10,202,678 6,831,292 4,011,189 181,116 (288,316) (148,961) (3,838) (3,373) -
9280 Disability Planning Organization of Kansas Inc 430,737 288,404 169,344 32,270 18,473 22,052 13,887 956 -
9281 OCCK Inc 9,499,232 6,360,294 3,734,629 200,490 (3,712) 137,059 124,930 5,763 -
9282 Housing Authority of Kansas City Kansas 5,598,244 3,748,353 2,200,953 (24,936) (113,778) (52,370) (12,062) (3,311) -
9283 Hoisington Recreation Commission 49,358 33,048 19,405 1,345 89 555 264 (4) -
9284 Cottonwood Inc 8,120,285 5,437,008 3,192,495 171,241 (46,714) 49,852 23,280 (3,488) -
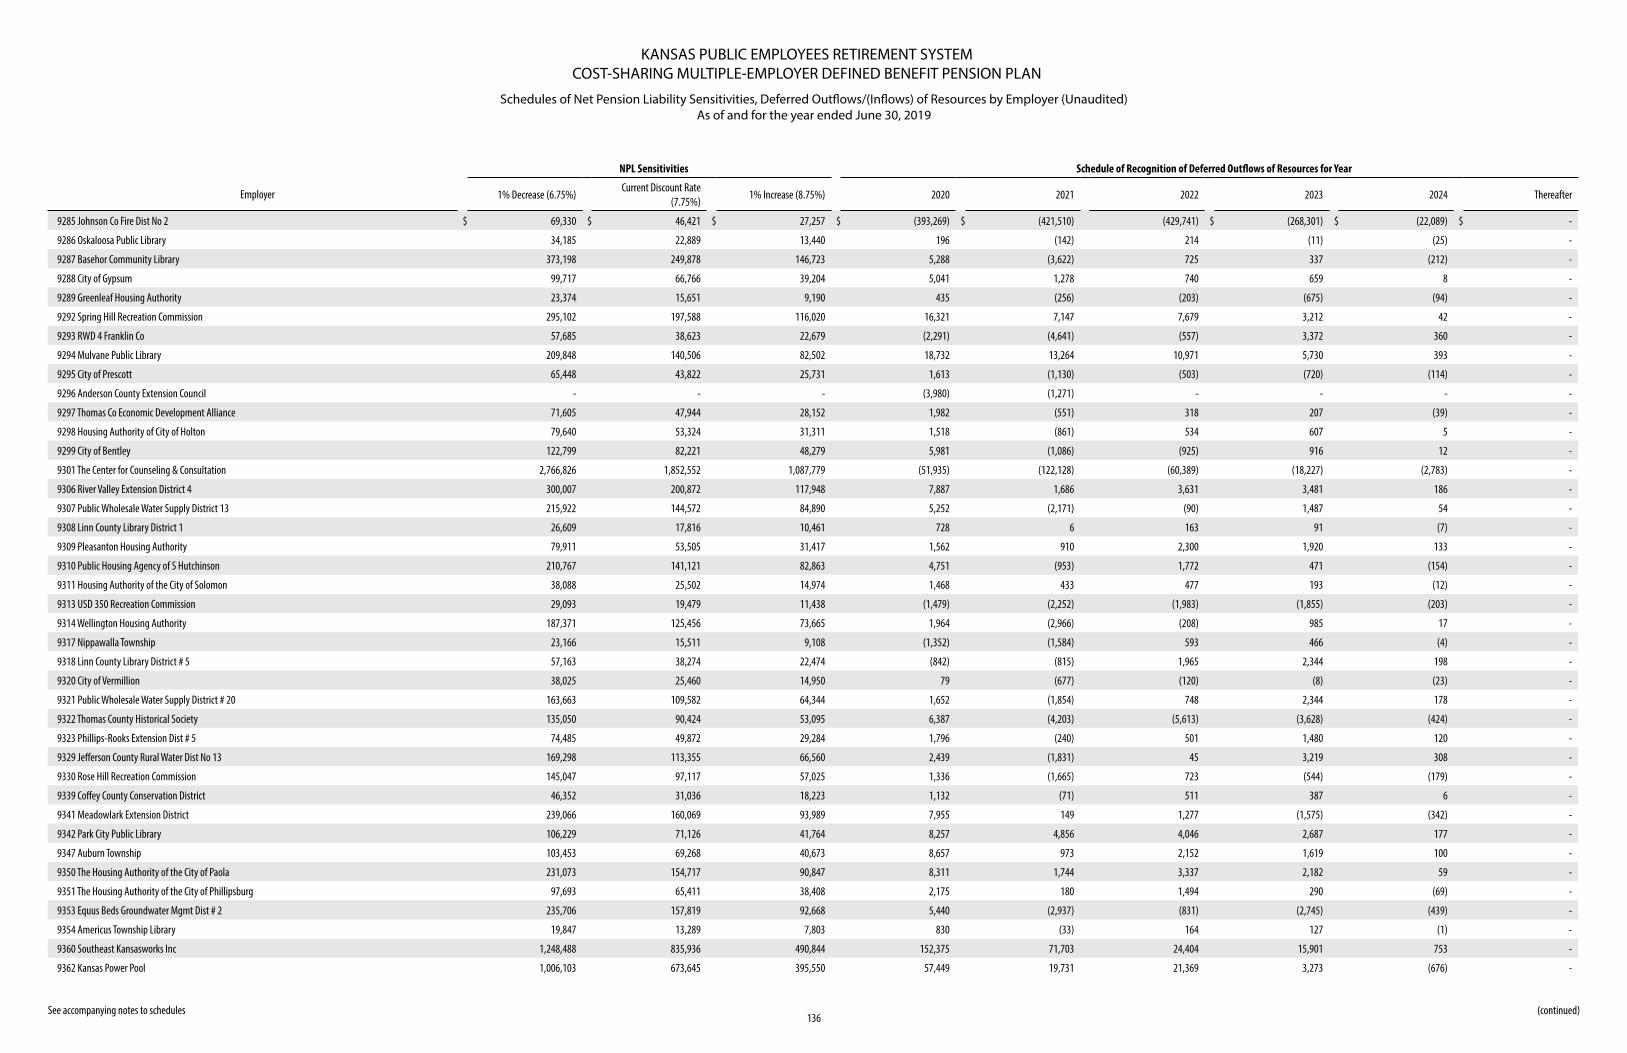
KANSAS PUBLIC EMPLOYEES RETIREMENT SYSTEMCOST-SHARING MULTIPLE-EMPLOYER DEFINED BENEFIT PENSION PLAN
Schedules of Net Pension Liability Sensitivities, Deferred Outflows/(Inflows) of Resources by Employer (Unaudited) As of and for the year ended June 30, 2019
See accompanying notes to schedules136
(continued)
NPL Sensitivities Schedule of Recognition of Deferred Outflows of Resources for Year
Employer 1% Decrease (6.75%)Current Discount Rate
(7.75%)1% Increase (8.75%) 2020 2021 2022 2023 2024 Thereafter
9285 Johnson Co Fire Dist No 2 $ 69,330 $ 46,421 $ 27,257 $ (393,269) $ (421,510) (429,741) $ (268,301) $ (22,089) $ -
9286 Oskaloosa Public Library 34,185 22,889 13,440 196 (142) 214 (11) (25) -
9287 Basehor Community Library 373,198 249,878 146,723 5,288 (3,622) 725 337 (212) -
9288 City of Gypsum 99,717 66,766 39,204 5,041 1,278 740 659 8 -
9289 Greenleaf Housing Authority 23,374 15,651 9,190 435 (256) (203) (675) (94) -
9292 Spring Hill Recreation Commission 295,102 197,588 116,020 16,321 7,147 7,679 3,212 42 -
9293 RWD 4 Franklin Co 57,685 38,623 22,679 (2,291) (4,641) (557) 3,372 360 -
9294 Mulvane Public Library 209,848 140,506 82,502 18,732 13,264 10,971 5,730 393 -
9295 City of Prescott 65,448 43,822 25,731 1,613 (1,130) (503) (720) (114) -
9296 Anderson County Extension Council - - - (3,980) (1,271) - - - -
9297 Thomas Co Economic Development Alliance 71,605 47,944 28,152 1,982 (551) 318 207 (39) -
9298 Housing Authority of City of Holton 79,640 53,324 31,311 1,518 (861) 534 607 5 -
9299 City of Bentley 122,799 82,221 48,279 5,981 (1,086) (925) 916 12 -
9301 The Center for Counseling & Consultation 2,766,826 1,852,552 1,087,779 (51,935) (122,128) (60,389) (18,227) (2,783) -
9306 River Valley Extension District 4 300,007 200,872 117,948 7,887 1,686 3,631 3,481 186 -
9307 Public Wholesale Water Supply District 13 215,922 144,572 84,890 5,252 (2,171) (90) 1,487 54 -
9308 Linn County Library District 1 26,609 17,816 10,461 728 6 163 91 (7) -
9309 Pleasanton Housing Authority 79,911 53,505 31,417 1,562 910 2,300 1,920 133 -
9310 Public Housing Agency of S Hutchinson 210,767 141,121 82,863 4,751 (953) 1,772 471 (154) -
9311 Housing Authority of the City of Solomon 38,088 25,502 14,974 1,468 433 477 193 (12) -
9313 USD 350 Recreation Commission 29,093 19,479 11,438 (1,479) (2,252) (1,983) (1,855) (203) -
9314 Wellington Housing Authority 187,371 125,456 73,665 1,964 (2,966) (208) 985 17 -
9317 Nippawalla Township 23,166 15,511 9,108 (1,352) (1,584) 593 466 (4) -
9318 Linn County Library District # 5 57,163 38,274 22,474 (842) (815) 1,965 2,344 198 -
9320 City of Vermillion 38,025 25,460 14,950 79 (677) (120) (8) (23) -
9321 Public Wholesale Water Supply District # 20 163,663 109,582 64,344 1,652 (1,854) 748 2,344 178 -
9322 Thomas County Historical Society 135,050 90,424 53,095 6,387 (4,203) (5,613) (3,628) (424) -
9323 Phillips-Rooks Extension Dist # 5 74,485 49,872 29,284 1,796 (240) 501 1,480 120 -
9329 Jefferson County Rural Water Dist No 13 169,298 113,355 66,560 2,439 (1,831) 45 3,219 308 -
9330 Rose Hill Recreation Commission 145,047 97,117 57,025 1,336 (1,665) 723 (544) (179) -
9339 Coffey County Conservation District 46,352 31,036 18,223 1,132 (71) 511 387 6 -
9341 Meadowlark Extension District 239,066 160,069 93,989 7,955 149 1,277 (1,575) (342) -
9342 Park City Public Library 106,229 71,126 41,764 8,257 4,856 4,046 2,687 177 -
9347 Auburn Township 103,453 69,268 40,673 8,657 973 2,152 1,619 100 -
9350 The Housing Authority of the City of Paola 231,073 154,717 90,847 8,311 1,744 3,337 2,182 59 -
9351 The Housing Authority of the City of Phillipsburg 97,693 65,411 38,408 2,175 180 1,494 290 (69) -
9353 Equus Beds Groundwater Mgmt Dist # 2 235,706 157,819 92,668 5,440 (2,937) (831) (2,745) (439) -
9354 Americus Township Library 19,847 13,289 7,803 830 (33) 164 127 (1) -
9360 Southeast Kansasworks Inc 1,248,488 835,936 490,844 152,375 71,703 24,404 15,901 753 -
9362 Kansas Power Pool 1,006,103 673,645 395,550 57,449 19,731 21,369 3,273 (676) -
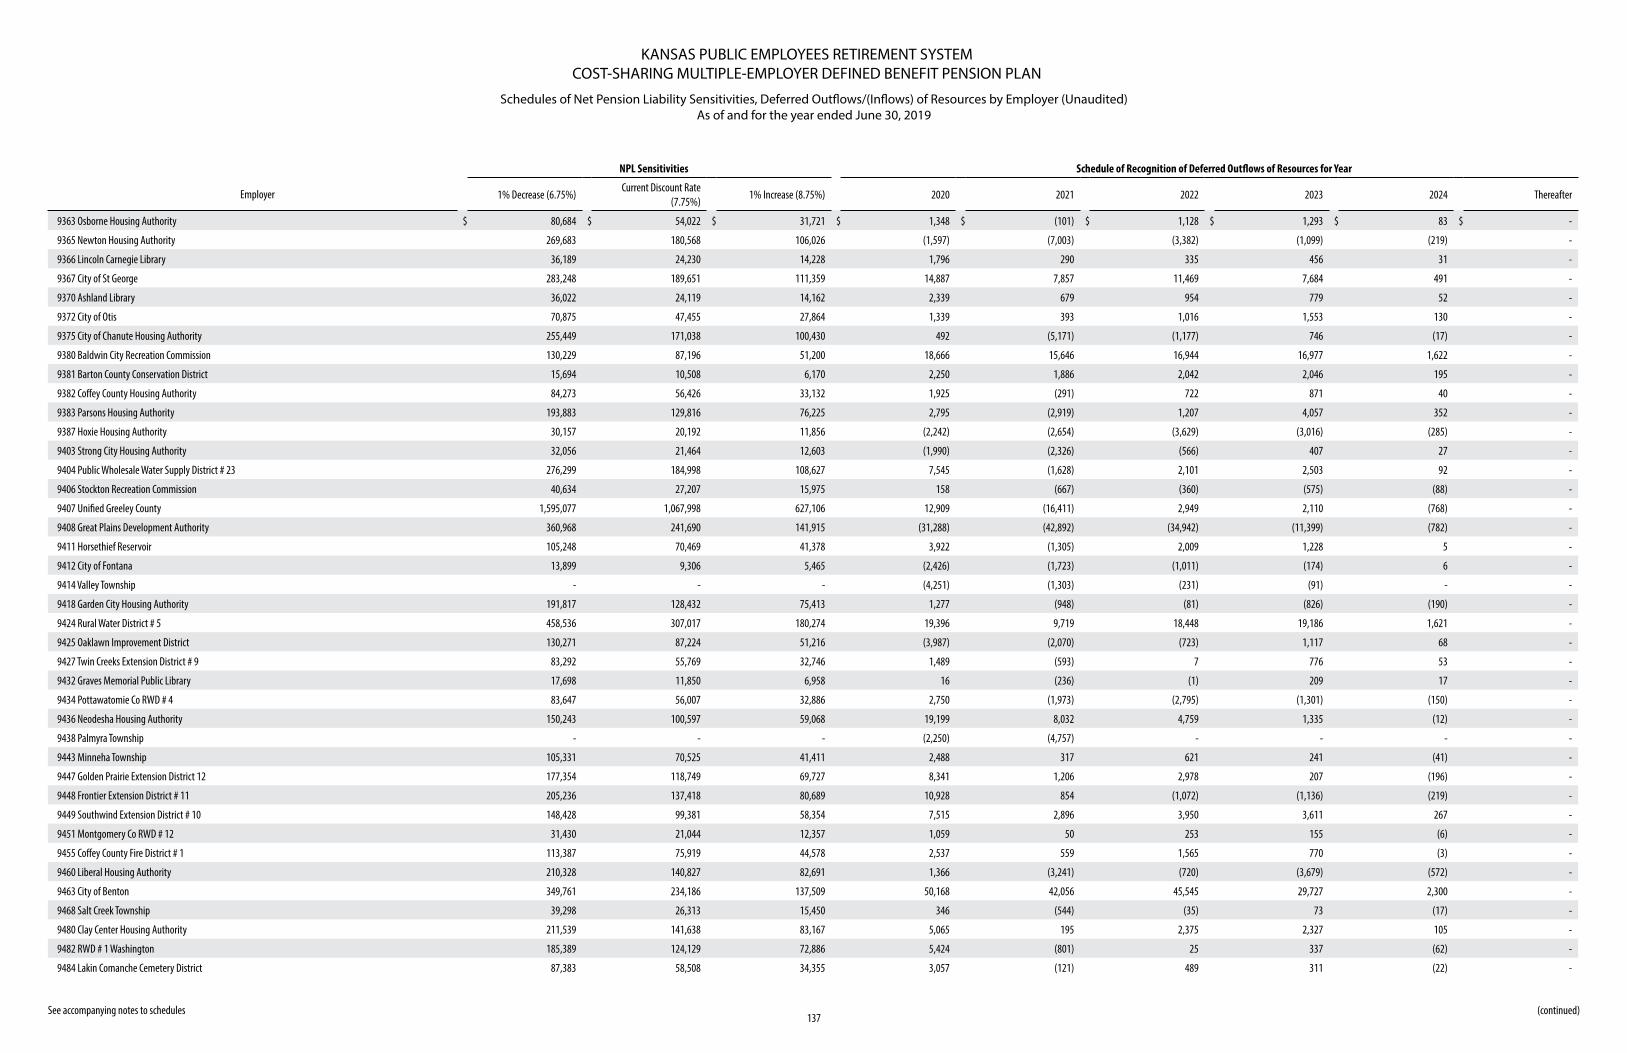
KANSAS PUBLIC EMPLOYEES RETIREMENT SYSTEMCOST-SHARING MULTIPLE-EMPLOYER DEFINED BENEFIT PENSION PLAN
Schedules of Net Pension Liability Sensitivities, Deferred Outflows/(Inflows) of Resources by Employer (Unaudited) As of and for the year ended June 30, 2019
See accompanying notes to schedules137
(continued)
NPL Sensitivities Schedule of Recognition of Deferred Outflows of Resources for Year
Employer 1% Decrease (6.75%)Current Discount Rate
(7.75%)1% Increase (8.75%) 2020 2021 2022 2023 2024 Thereafter
9363 Osborne Housing Authority $ 80,684 $ 54,022 $ 31,721 $ 1,348 $ (101) $ 1,128 $ 1,293 $ 83 $ -
9365 Newton Housing Authority 269,683 180,568 106,026 (1,597) (7,003) (3,382) (1,099) (219) -
9366 Lincoln Carnegie Library 36,189 24,230 14,228 1,796 290 335 456 31 -
9367 City of St George 283,248 189,651 111,359 14,887 7,857 11,469 7,684 491 -
9370 Ashland Library 36,022 24,119 14,162 2,339 679 954 779 52 -
9372 City of Otis 70,875 47,455 27,864 1,339 393 1,016 1,553 130 -
9375 City of Chanute Housing Authority 255,449 171,038 100,430 492 (5,171) (1,177) 746 (17) -
9380 Baldwin City Recreation Commission 130,229 87,196 51,200 18,666 15,646 16,944 16,977 1,622 -
9381 Barton County Conservation District 15,694 10,508 6,170 2,250 1,886 2,042 2,046 195 -
9382 Coffey County Housing Authority 84,273 56,426 33,132 1,925 (291) 722 871 40 -
9383 Parsons Housing Authority 193,883 129,816 76,225 2,795 (2,919) 1,207 4,057 352 -
9387 Hoxie Housing Authority 30,157 20,192 11,856 (2,242) (2,654) (3,629) (3,016) (285) -
9403 Strong City Housing Authority 32,056 21,464 12,603 (1,990) (2,326) (566) 407 27 -
9404 Public Wholesale Water Supply District # 23 276,299 184,998 108,627 7,545 (1,628) 2,101 2,503 92 -
9406 Stockton Recreation Commission 40,634 27,207 15,975 158 (667) (360) (575) (88) -
9407 Unified Greeley County 1,595,077 1,067,998 627,106 12,909 (16,411) 2,949 2,110 (768) -
9408 Great Plains Development Authority 360,968 241,690 141,915 (31,288) (42,892) (34,942) (11,399) (782) -
9411 Horsethief Reservoir 105,248 70,469 41,378 3,922 (1,305) 2,009 1,228 5 -
9412 City of Fontana 13,899 9,306 5,465 (2,426) (1,723) (1,011) (174) 6 -
9414 Valley Township - - - (4,251) (1,303) (231) (91) - -
9418 Garden City Housing Authority 191,817 128,432 75,413 1,277 (948) (81) (826) (190) -
9424 Rural Water District # 5 458,536 307,017 180,274 19,396 9,719 18,448 19,186 1,621 -
9425 Oaklawn Improvement District 130,271 87,224 51,216 (3,987) (2,070) (723) 1,117 68 -
9427 Twin Creeks Extension District # 9 83,292 55,769 32,746 1,489 (593) 7 776 53 -
9432 Graves Memorial Public Library 17,698 11,850 6,958 16 (236) (1) 209 17 -
9434 Pottawatomie Co RWD # 4 83,647 56,007 32,886 2,750 (1,973) (2,795) (1,301) (150) -
9436 Neodesha Housing Authority 150,243 100,597 59,068 19,199 8,032 4,759 1,335 (12) -
9438 Palmyra Township - - - (2,250) (4,757) - - - -
9443 Minneha Township 105,331 70,525 41,411 2,488 317 621 241 (41) -
9447 Golden Prairie Extension District 12 177,354 118,749 69,727 8,341 1,206 2,978 207 (196) -
9448 Frontier Extension District # 11 205,236 137,418 80,689 10,928 854 (1,072) (1,136) (219) -
9449 Southwind Extension District # 10 148,428 99,381 58,354 7,515 2,896 3,950 3,611 267 -
9451 Montgomery Co RWD # 12 31,430 21,044 12,357 1,059 50 253 155 (6) -
9455 Coffey County Fire District # 1 113,387 75,919 44,578 2,537 559 1,565 770 (3) -
9460 Liberal Housing Authority 210,328 140,827 82,691 1,366 (3,241) (720) (3,679) (572) -
9463 City of Benton 349,761 234,186 137,509 50,168 42,056 45,545 29,727 2,300 -
9468 Salt Creek Township 39,298 26,313 15,450 346 (544) (35) 73 (17) -
9480 Clay Center Housing Authority 211,539 141,638 83,167 5,065 195 2,375 2,327 105 -
9482 RWD # 1 Washington 185,389 124,129 72,886 5,424 (801) 25 337 (62) -
9484 Lakin Comanche Cemetery District 87,383 58,508 34,355 3,057 (121) 489 311 (22) -
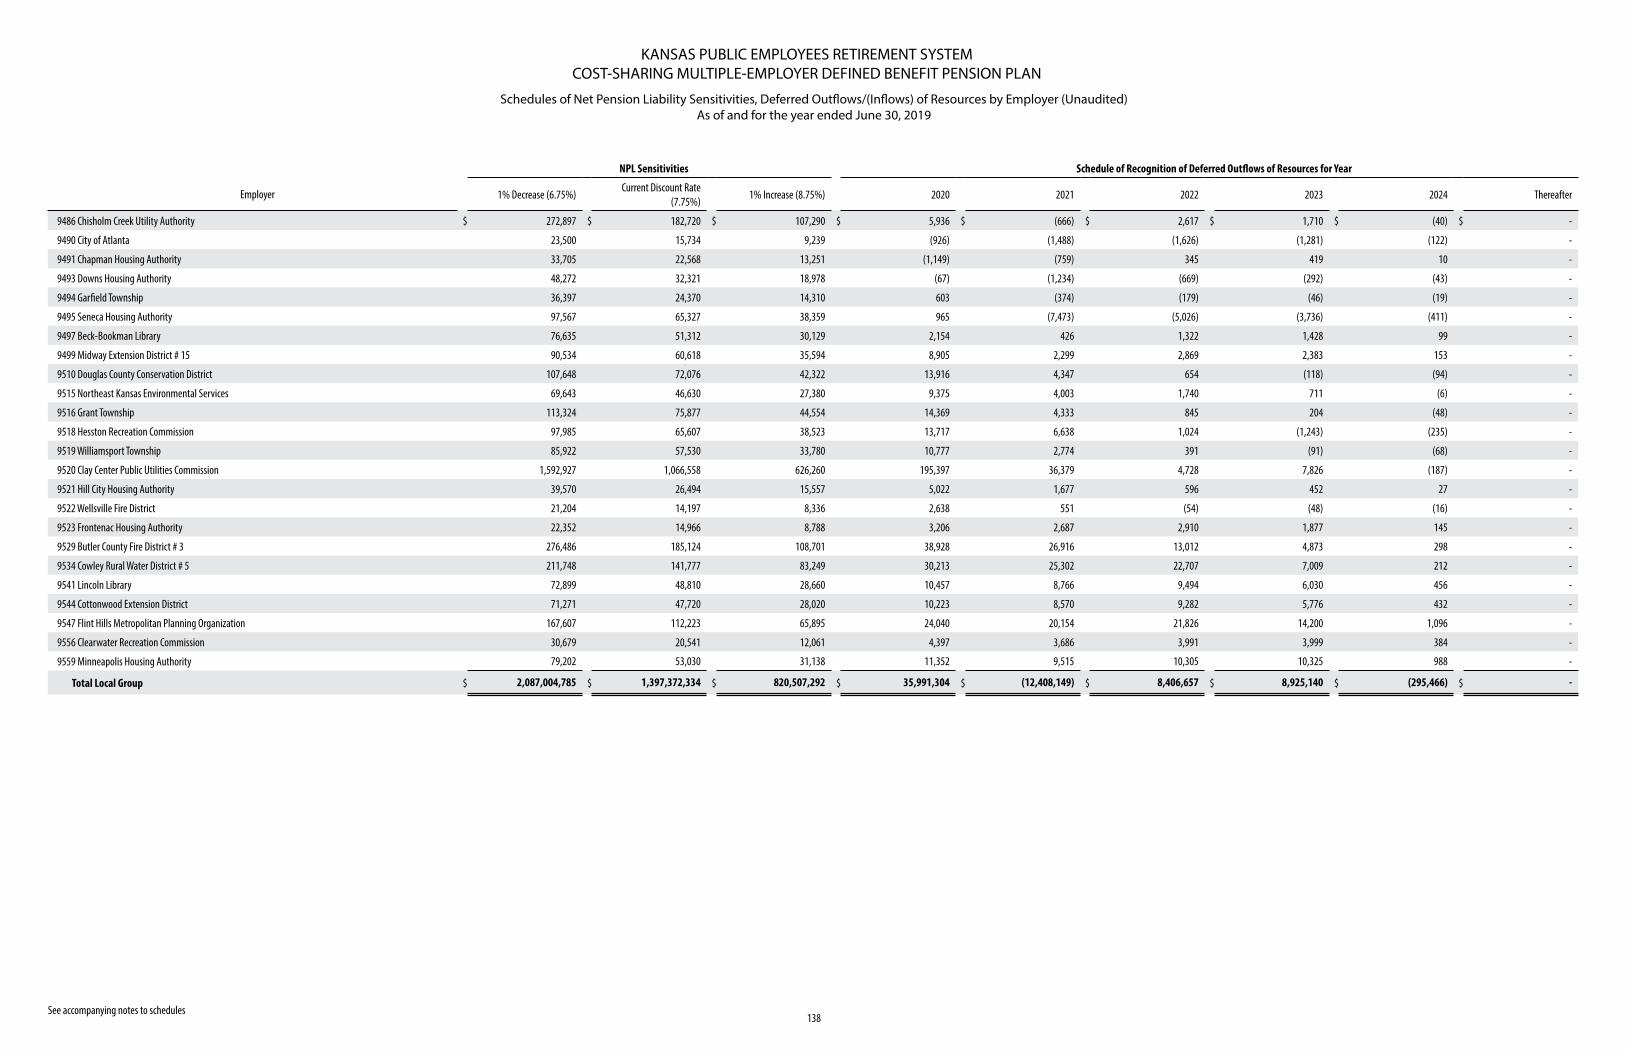
KANSAS PUBLIC EMPLOYEES RETIREMENT SYSTEMCOST-SHARING MULTIPLE-EMPLOYER DEFINED BENEFIT PENSION PLAN
Schedules of Net Pension Liability Sensitivities, Deferred Outflows/(Inflows) of Resources by Employer (Unaudited) As of and for the year ended June 30, 2019
See accompanying notes to schedules138
NPL Sensitivities Schedule of Recognition of Deferred Outflows of Resources for Year
Employer 1% Decrease (6.75%)Current Discount Rate
(7.75%)1% Increase (8.75%) 2020 2021 2022 2023 2024 Thereafter
9486 Chisholm Creek Utility Authority $ 272,897 $ 182,720 $ 107,290 $ 5,936 $ (666) $ 2,617 $ 1,710 $ (40) $ -
9490 City of Atlanta 23,500 15,734 9,239 (926) (1,488) (1,626) (1,281) (122) -
9491 Chapman Housing Authority 33,705 22,568 13,251 (1,149) (759) 345 419 10 -
9493 Downs Housing Authority 48,272 32,321 18,978 (67) (1,234) (669) (292) (43) -
9494 Garfield Township 36,397 24,370 14,310 603 (374) (179) (46) (19) -
9495 Seneca Housing Authority 97,567 65,327 38,359 965 (7,473) (5,026) (3,736) (411) -
9497 Beck-Bookman Library 76,635 51,312 30,129 2,154 426 1,322 1,428 99 -
9499 Midway Extension District # 15 90,534 60,618 35,594 8,905 2,299 2,869 2,383 153 -
9510 Douglas County Conservation District 107,648 72,076 42,322 13,916 4,347 654 (118) (94) -
9515 Northeast Kansas Environmental Services 69,643 46,630 27,380 9,375 4,003 1,740 711 (6) -
9516 Grant Township 113,324 75,877 44,554 14,369 4,333 845 204 (48) -
9518 Hesston Recreation Commission 97,985 65,607 38,523 13,717 6,638 1,024 (1,243) (235) -
9519 Williamsport Township 85,922 57,530 33,780 10,777 2,774 391 (91) (68) -
9520 Clay Center Public Utilities Commission 1,592,927 1,066,558 626,260 195,397 36,379 4,728 7,826 (187) -
9521 Hill City Housing Authority 39,570 26,494 15,557 5,022 1,677 596 452 27 -
9522 Wellsville Fire District 21,204 14,197 8,336 2,638 551 (54) (48) (16) -
9523 Frontenac Housing Authority 22,352 14,966 8,788 3,206 2,687 2,910 1,877 145 -
9529 Butler County Fire District # 3 276,486 185,124 108,701 38,928 26,916 13,012 4,873 298 -
9534 Cowley Rural Water District # 5 211,748 141,777 83,249 30,213 25,302 22,707 7,009 212 -
9541 Lincoln Library 72,899 48,810 28,660 10,457 8,766 9,494 6,030 456 -
9544 Cottonwood Extension District 71,271 47,720 28,020 10,223 8,570 9,282 5,776 432 -
9547 Flint Hills Metropolitan Planning Organization 167,607 112,223 65,895 24,040 20,154 21,826 14,200 1,096 -
9556 Clearwater Recreation Commission 30,679 20,541 12,061 4,397 3,686 3,991 3,999 384 -
9559 Minneapolis Housing Authority 79,202 53,030 31,138 11,352 9,515 10,305 10,325 988 -
Total Local Group $ 2,087,004,785 $ 1,397,372,334 $ 820,507,292 $ 35,991,304 $ (12,408,149) $ 8,406,657 $ 8,925,140 $ (295,466) $ -
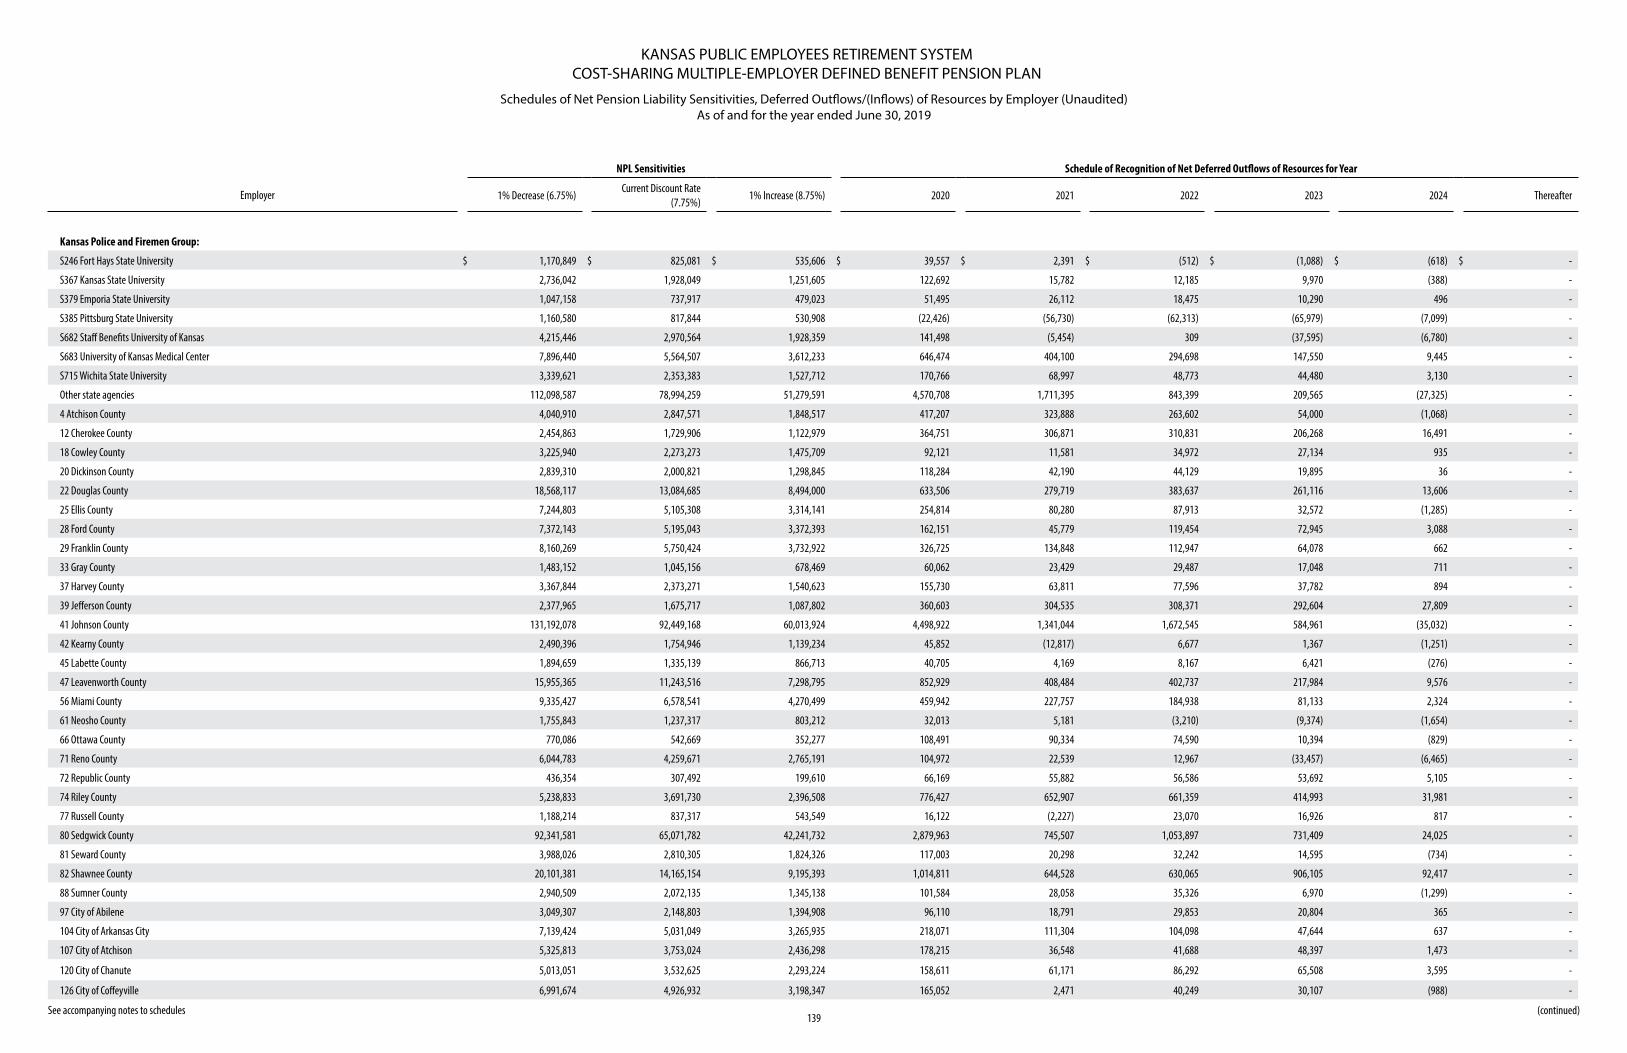
KANSAS PUBLIC EMPLOYEES RETIREMENT SYSTEMCOST-SHARING MULTIPLE-EMPLOYER DEFINED BENEFIT PENSION PLAN
Schedules of Net Pension Liability Sensitivities, Deferred Outflows/(Inflows) of Resources by Employer (Unaudited) As of and for the year ended June 30, 2019
See accompanying notes to schedules139
(continued)
NPL Sensitivities Schedule of Recognition of Net Deferred Outflows of Resources for Year
Employer 1% Decrease (6.75%)Current Discount Rate
(7.75%)1% Increase (8.75%) 2020 2021 2022 2023 2024 Thereafter
Kansas Police and Firemen Group:
S246 Fort Hays State University $ 1,170,849 $ 825,081 $ 535,606 $ 39,557 $ 2,391 $ (512) $ (1,088) $ (618) $ -
S367 Kansas State University 2,736,042 1,928,049 1,251,605 122,692 15,782 12,185 9,970 (388) -
S379 Emporia State University 1,047,158 737,917 479,023 51,495 26,112 18,475 10,290 496 -
S385 Pittsburg State University 1,160,580 817,844 530,908 (22,426) (56,730) (62,313) (65,979) (7,099) -
S682 Staff Benefits University of Kansas 4,215,446 2,970,564 1,928,359 141,498 (5,454) 309 (37,595) (6,780) -
S683 University of Kansas Medical Center 7,896,440 5,564,507 3,612,233 646,474 404,100 294,698 147,550 9,445 -
S715 Wichita State University 3,339,621 2,353,383 1,527,712 170,766 68,997 48,773 44,480 3,130 -
Other state agencies 112,098,587 78,994,259 51,279,591 4,570,708 1,711,395 843,399 209,565 (27,325) -
4 Atchison County 4,040,910 2,847,571 1,848,517 417,207 323,888 263,602 54,000 (1,068) -
12 Cherokee County 2,454,863 1,729,906 1,122,979 364,751 306,871 310,831 206,268 16,491 -
18 Cowley County 3,225,940 2,273,273 1,475,709 92,121 11,581 34,972 27,134 935 -
20 Dickinson County 2,839,310 2,000,821 1,298,845 118,284 42,190 44,129 19,895 36 -
22 Douglas County 18,568,117 13,084,685 8,494,000 633,506 279,719 383,637 261,116 13,606 -
25 Ellis County 7,244,803 5,105,308 3,314,141 254,814 80,280 87,913 32,572 (1,285) -
28 Ford County 7,372,143 5,195,043 3,372,393 162,151 45,779 119,454 72,945 3,088 -
29 Franklin County 8,160,269 5,750,424 3,732,922 326,725 134,848 112,947 64,078 662 -
33 Gray County 1,483,152 1,045,156 678,469 60,062 23,429 29,487 17,048 711 -
37 Harvey County 3,367,844 2,373,271 1,540,623 155,730 63,811 77,596 37,782 894 -
39 Jefferson County 2,377,965 1,675,717 1,087,802 360,603 304,535 308,371 292,604 27,809 -
41 Johnson County 131,192,078 92,449,168 60,013,924 4,498,922 1,341,044 1,672,545 584,961 (35,032) -
42 Kearny County 2,490,396 1,754,946 1,139,234 45,852 (12,817) 6,677 1,367 (1,251) -
45 Labette County 1,894,659 1,335,139 866,713 40,705 4,169 8,167 6,421 (276) -
47 Leavenworth County 15,955,365 11,243,516 7,298,795 852,929 408,484 402,737 217,984 9,576 -
56 Miami County 9,335,427 6,578,541 4,270,499 459,942 227,757 184,938 81,133 2,324 -
61 Neosho County 1,755,843 1,237,317 803,212 32,013 5,181 (3,210) (9,374) (1,654) -
66 Ottawa County 770,086 542,669 352,277 108,491 90,334 74,590 10,394 (829) -
71 Reno County 6,044,783 4,259,671 2,765,191 104,972 22,539 12,967 (33,457) (6,465) -
72 Republic County 436,354 307,492 199,610 66,169 55,882 56,586 53,692 5,105 -
74 Riley County 5,238,833 3,691,730 2,396,508 776,427 652,907 661,359 414,993 31,981 -
77 Russell County 1,188,214 837,317 543,549 16,122 (2,227) 23,070 16,926 817 -
80 Sedgwick County 92,341,581 65,071,782 42,241,732 2,879,963 745,507 1,053,897 731,409 24,025 -
81 Seward County 3,988,026 2,810,305 1,824,326 117,003 20,298 32,242 14,595 (734) -
82 Shawnee County 20,101,381 14,165,154 9,195,393 1,014,811 644,528 630,065 906,105 92,417 -
88 Sumner County 2,940,509 2,072,135 1,345,138 101,584 28,058 35,326 6,970 (1,299) -
97 City of Abilene 3,049,307 2,148,803 1,394,908 96,110 18,791 29,853 20,804 365 -
104 City of Arkansas City 7,139,424 5,031,049 3,265,935 218,071 111,304 104,098 47,644 637 -
107 City of Atchison 5,325,813 3,753,024 2,436,298 178,215 36,548 41,688 48,397 1,473 -
120 City of Chanute 5,013,051 3,532,625 2,293,224 158,611 61,171 86,292 65,508 3,595 -
126 City of Coffeyville 6,991,674 4,926,932 3,198,347 165,052 2,471 40,249 30,107 (988) -
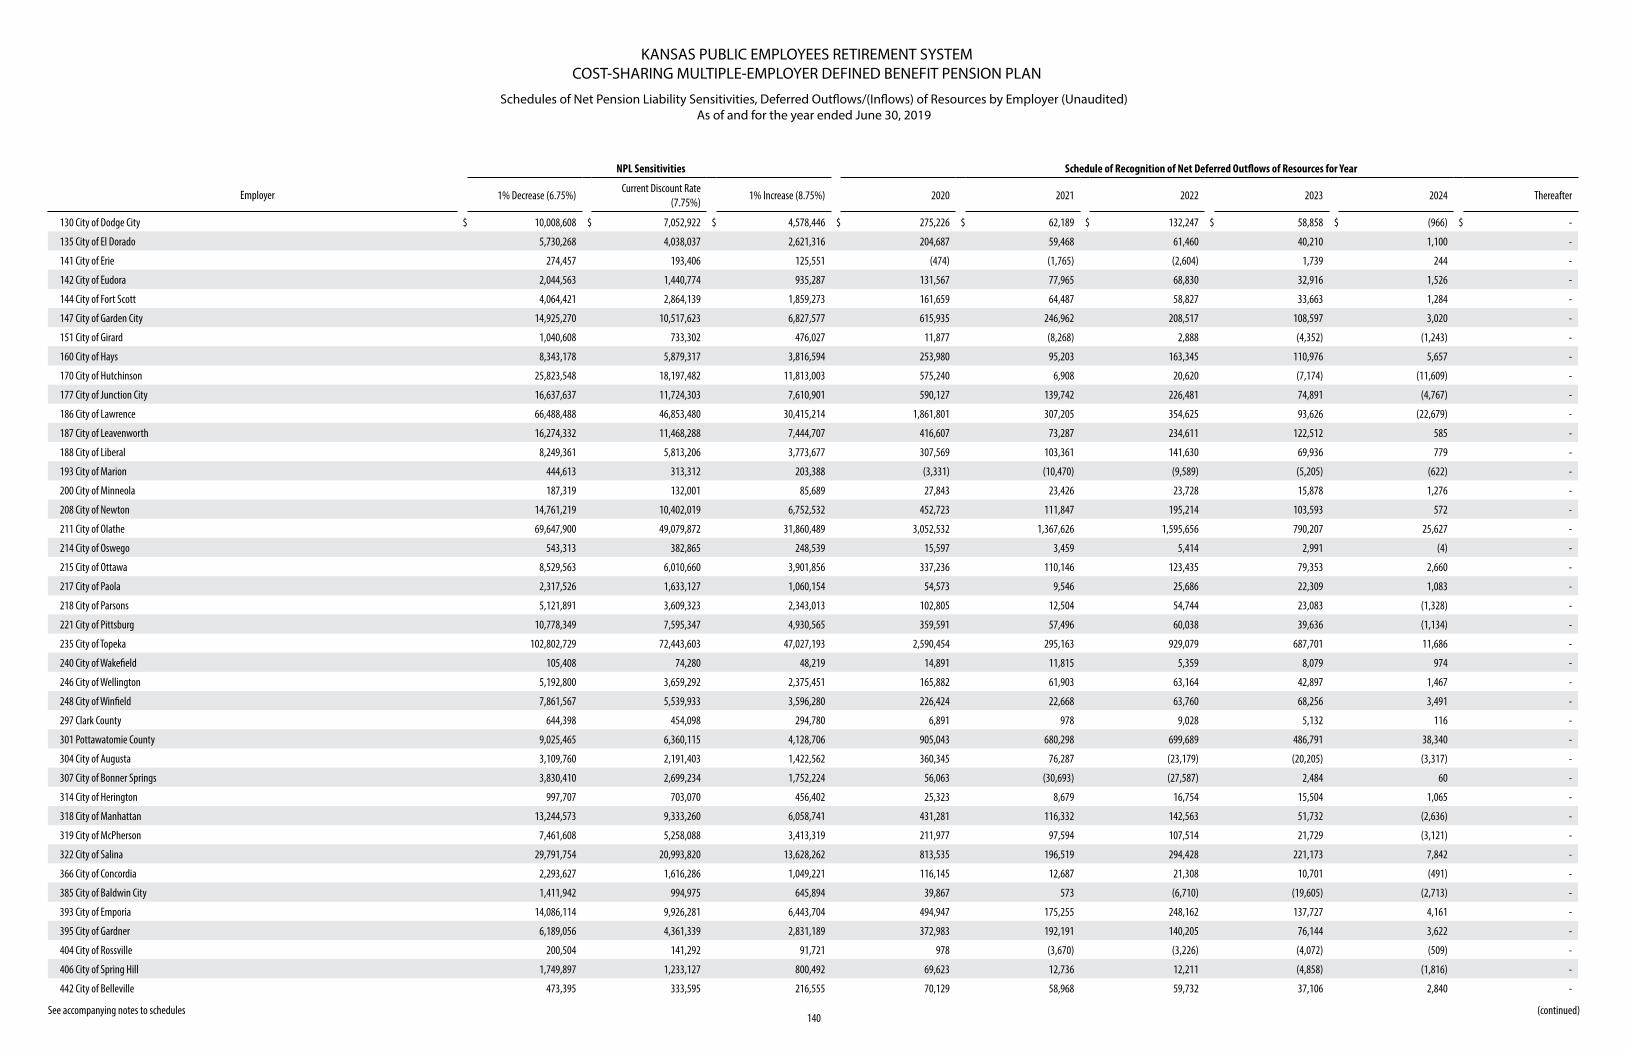
KANSAS PUBLIC EMPLOYEES RETIREMENT SYSTEMCOST-SHARING MULTIPLE-EMPLOYER DEFINED BENEFIT PENSION PLAN
Schedules of Net Pension Liability Sensitivities, Deferred Outflows/(Inflows) of Resources by Employer (Unaudited) As of and for the year ended June 30, 2019
See accompanying notes to schedules140
(continued)
NPL Sensitivities Schedule of Recognition of Net Deferred Outflows of Resources for Year
Employer 1% Decrease (6.75%)Current Discount Rate
(7.75%)1% Increase (8.75%) 2020 2021 2022 2023 2024 Thereafter
130 City of Dodge City $ 10,008,608 $ 7,052,922 $ 4,578,446 $ 275,226 $ 62,189 $ 132,247 $ 58,858 $ (966) $ -
135 City of El Dorado 5,730,268 4,038,037 2,621,316 204,687 59,468 61,460 40,210 1,100 -
141 City of Erie 274,457 193,406 125,551 (474) (1,765) (2,604) 1,739 244 -
142 City of Eudora 2,044,563 1,440,774 935,287 131,567 77,965 68,830 32,916 1,526 -
144 City of Fort Scott 4,064,421 2,864,139 1,859,273 161,659 64,487 58,827 33,663 1,284 -
147 City of Garden City 14,925,270 10,517,623 6,827,577 615,935 246,962 208,517 108,597 3,020 -
151 City of Girard 1,040,608 733,302 476,027 11,877 (8,268) 2,888 (4,352) (1,243) -
160 City of Hays 8,343,178 5,879,317 3,816,594 253,980 95,203 163,345 110,976 5,657 -
170 City of Hutchinson 25,823,548 18,197,482 11,813,003 575,240 6,908 20,620 (7,174) (11,609) -
177 City of Junction City 16,637,637 11,724,303 7,610,901 590,127 139,742 226,481 74,891 (4,767) -
186 City of Lawrence 66,488,488 46,853,480 30,415,214 1,861,801 307,205 354,625 93,626 (22,679) -
187 City of Leavenworth 16,274,332 11,468,288 7,444,707 416,607 73,287 234,611 122,512 585 -
188 City of Liberal 8,249,361 5,813,206 3,773,677 307,569 103,361 141,630 69,936 779 -
193 City of Marion 444,613 313,312 203,388 (3,331) (10,470) (9,589) (5,205) (622) -
200 City of Minneola 187,319 132,001 85,689 27,843 23,426 23,728 15,878 1,276 -
208 City of Newton 14,761,219 10,402,019 6,752,532 452,723 111,847 195,214 103,593 572 -
211 City of Olathe 69,647,900 49,079,872 31,860,489 3,052,532 1,367,626 1,595,656 790,207 25,627 -
214 City of Oswego 543,313 382,865 248,539 15,597 3,459 5,414 2,991 (4) -
215 City of Ottawa 8,529,563 6,010,660 3,901,856 337,236 110,146 123,435 79,353 2,660 -
217 City of Paola 2,317,526 1,633,127 1,060,154 54,573 9,546 25,686 22,309 1,083 -
218 City of Parsons 5,121,891 3,609,323 2,343,013 102,805 12,504 54,744 23,083 (1,328) -
221 City of Pittsburg 10,778,349 7,595,347 4,930,565 359,591 57,496 60,038 39,636 (1,134) -
235 City of Topeka 102,802,729 72,443,603 47,027,193 2,590,454 295,163 929,079 687,701 11,686 -
240 City of Wakefield 105,408 74,280 48,219 14,891 11,815 5,359 8,079 974 -
246 City of Wellington 5,192,800 3,659,292 2,375,451 165,882 61,903 63,164 42,897 1,467 -
248 City of Winfield 7,861,567 5,539,933 3,596,280 226,424 22,668 63,760 68,256 3,491 -
297 Clark County 644,398 454,098 294,780 6,891 978 9,028 5,132 116 -
301 Pottawatomie County 9,025,465 6,360,115 4,128,706 905,043 680,298 699,689 486,791 38,340 -
304 City of Augusta 3,109,760 2,191,403 1,422,562 360,345 76,287 (23,179) (20,205) (3,317) -
307 City of Bonner Springs 3,830,410 2,699,234 1,752,224 56,063 (30,693) (27,587) 2,484 60 -
314 City of Herington 997,707 703,070 456,402 25,323 8,679 16,754 15,504 1,065 -
318 City of Manhattan 13,244,573 9,333,260 6,058,741 431,281 116,332 142,563 51,732 (2,636) -
319 City of McPherson 7,461,608 5,258,088 3,413,319 211,977 97,594 107,514 21,729 (3,121) -
322 City of Salina 29,791,754 20,993,820 13,628,262 813,535 196,519 294,428 221,173 7,842 -
366 City of Concordia 2,293,627 1,616,286 1,049,221 116,145 12,687 21,308 10,701 (491) -
385 City of Baldwin City 1,411,942 994,975 645,894 39,867 573 (6,710) (19,605) (2,713) -
393 City of Emporia 14,086,114 9,926,281 6,443,704 494,947 175,255 248,162 137,727 4,161 -
395 City of Gardner 6,189,056 4,361,339 2,831,189 372,983 192,191 140,205 76,144 3,622 -
404 City of Rossville 200,504 141,292 91,721 978 (3,670) (3,226) (4,072) (509) -
406 City of Spring Hill 1,749,897 1,233,127 800,492 69,623 12,736 12,211 (4,858) (1,816) -
442 City of Belleville 473,395 333,595 216,555 70,129 58,968 59,732 37,106 2,840 -
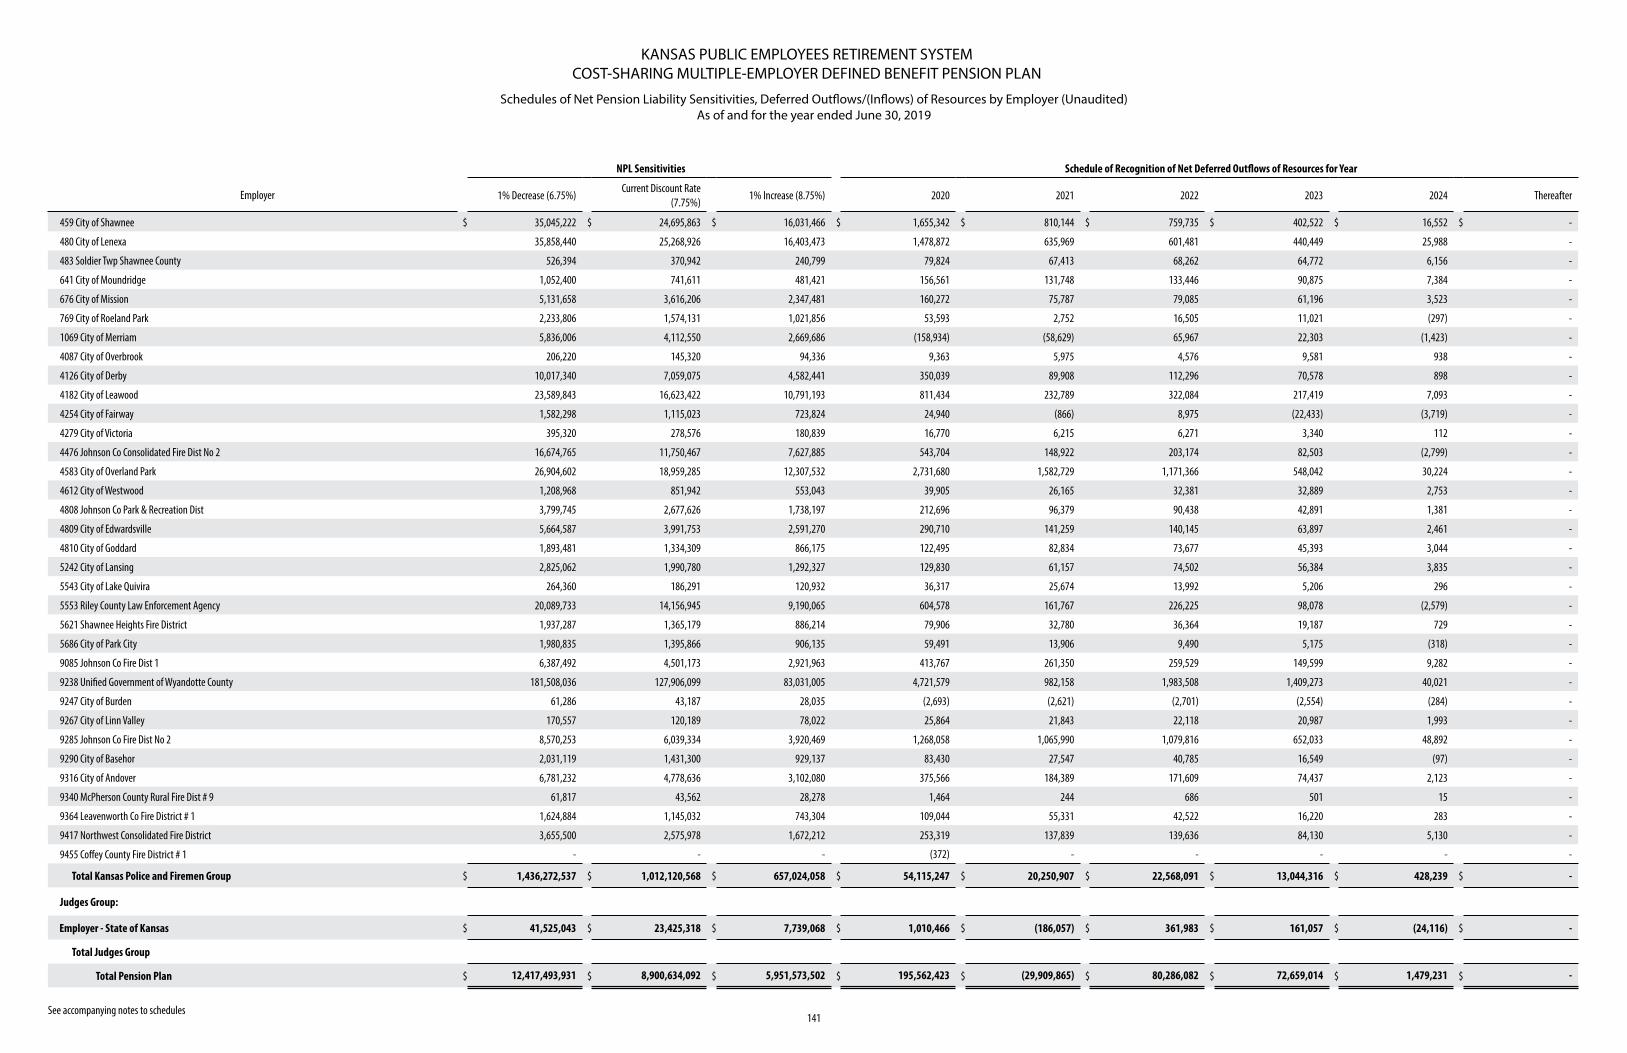
KANSAS PUBLIC EMPLOYEES RETIREMENT SYSTEMCOST-SHARING MULTIPLE-EMPLOYER DEFINED BENEFIT PENSION PLAN
Schedules of Net Pension Liability Sensitivities, Deferred Outflows/(Inflows) of Resources by Employer (Unaudited) As of and for the year ended June 30, 2019
See accompanying notes to schedules141
NPL Sensitivities Schedule of Recognition of Net Deferred Outflows of Resources for Year
Employer 1% Decrease (6.75%)Current Discount Rate
(7.75%)1% Increase (8.75%) 2020 2021 2022 2023 2024 Thereafter
459 City of Shawnee $ 35,045,222 $ 24,695,863 $ 16,031,466 $ 1,655,342 $ 810,144 $ 759,735 $ 402,522 $ 16,552 $ -
480 City of Lenexa 35,858,440 25,268,926 16,403,473 1,478,872 635,969 601,481 440,449 25,988 -
483 Soldier Twp Shawnee County 526,394 370,942 240,799 79,824 67,413 68,262 64,772 6,156 -
641 City of Moundridge 1,052,400 741,611 481,421 156,561 131,748 133,446 90,875 7,384 -
676 City of Mission 5,131,658 3,616,206 2,347,481 160,272 75,787 79,085 61,196 3,523 -
769 City of Roeland Park 2,233,806 1,574,131 1,021,856 53,593 2,752 16,505 11,021 (297) -
1069 City of Merriam 5,836,006 4,112,550 2,669,686 (158,934) (58,629) 65,967 22,303 (1,423) -
4087 City of Overbrook 206,220 145,320 94,336 9,363 5,975 4,576 9,581 938 -
4126 City of Derby 10,017,340 7,059,075 4,582,441 350,039 89,908 112,296 70,578 898 -
4182 City of Leawood 23,589,843 16,623,422 10,791,193 811,434 232,789 322,084 217,419 7,093 -
4254 City of Fairway 1,582,298 1,115,023 723,824 24,940 (866) 8,975 (22,433) (3,719) -
4279 City of Victoria 395,320 278,576 180,839 16,770 6,215 6,271 3,340 112 -
4476 Johnson Co Consolidated Fire Dist No 2 16,674,765 11,750,467 7,627,885 543,704 148,922 203,174 82,503 (2,799) -
4583 City of Overland Park 26,904,602 18,959,285 12,307,532 2,731,680 1,582,729 1,171,366 548,042 30,224 -
4612 City of Westwood 1,208,968 851,942 553,043 39,905 26,165 32,381 32,889 2,753 -
4808 Johnson Co Park & Recreation Dist 3,799,745 2,677,626 1,738,197 212,696 96,379 90,438 42,891 1,381 -
4809 City of Edwardsville 5,664,587 3,991,753 2,591,270 290,710 141,259 140,145 63,897 2,461 -
4810 City of Goddard 1,893,481 1,334,309 866,175 122,495 82,834 73,677 45,393 3,044 -
5242 City of Lansing 2,825,062 1,990,780 1,292,327 129,830 61,157 74,502 56,384 3,835 -
5543 City of Lake Quivira 264,360 186,291 120,932 36,317 25,674 13,992 5,206 296 -
5553 Riley County Law Enforcement Agency 20,089,733 14,156,945 9,190,065 604,578 161,767 226,225 98,078 (2,579) -
5621 Shawnee Heights Fire District 1,937,287 1,365,179 886,214 79,906 32,780 36,364 19,187 729 -
5686 City of Park City 1,980,835 1,395,866 906,135 59,491 13,906 9,490 5,175 (318) -
9085 Johnson Co Fire Dist 1 6,387,492 4,501,173 2,921,963 413,767 261,350 259,529 149,599 9,282 -
9238 Unified Government of Wyandotte County 181,508,036 127,906,099 83,031,005 4,721,579 982,158 1,983,508 1,409,273 40,021 -
9247 City of Burden 61,286 43,187 28,035 (2,693) (2,621) (2,701) (2,554) (284) -
9267 City of Linn Valley 170,557 120,189 78,022 25,864 21,843 22,118 20,987 1,993 -
9285 Johnson Co Fire Dist No 2 8,570,253 6,039,334 3,920,469 1,268,058 1,065,990 1,079,816 652,033 48,892 -
9290 City of Basehor 2,031,119 1,431,300 929,137 83,430 27,547 40,785 16,549 (97) -
9316 City of Andover 6,781,232 4,778,636 3,102,080 375,566 184,389 171,609 74,437 2,123 -
9340 McPherson County Rural Fire Dist # 9 61,817 43,562 28,278 1,464 244 686 501 15 -
9364 Leavenworth Co Fire District # 1 1,624,884 1,145,032 743,304 109,044 55,331 42,522 16,220 283 -
9417 Northwest Consolidated Fire District 3,655,500 2,575,978 1,672,212 253,319 137,839 139,636 84,130 5,130 -
9455 Coffey County Fire District # 1 - - - (372) - - - - -
Total Kansas Police and Firemen Group $ 1,436,272,537 $ 1,012,120,568 $ 657,024,058 $ 54,115,247 $ 20,250,907 $ 22,568,091 $ 13,044,316 $ 428,239 $ -
Judges Group:
Employer - State of Kansas $ 41,525,043 $ 23,425,318 $ 7,739,068 $ 1,010,466 $ (186,057) $ 361,983 $ 161,057 $ (24,116) $ -
Total Judges Group
Total Pension Plan $ 12,417,493,931 $ 8,900,634,092 $ 5,951,573,502 $ 195,562,423 $ (29,909,865) $ 80,286,082 $ 72,659,014 $ 1,479,231 $ -