Embed Size (px)
Citation preview
Socio Economic Impact Assessment of Tissue Culture Bananas in Kisii highlandsand South Nyanra in Kenya
Kassim Were Ali
C50/P/9157/04
Supervisors
1. Dr. Mary Mbithi
2. Dr. George Ruigu
W tffU S trr n r tTfnDjT£ AS I Af KICaNm
A thesis submitted in partial fulfillment for the requirement of the degree of Masters of Arts in Economics in the University of Nairobi, School of Economics
September 18, 2009

Declaration
I. Kassim Were All hereby declare that thi*» thesis is my original work and has not been presented for a degree in any other University.
Signature... ............ ................................................Date. ................
Kassim Were AH
C50/P/9157/04
ii
ApprovalThis thesis has been submitted for examination with our approval as University supervisors.
Signature................................................................ O w
I)r. Mary Mblthl
Supervisor. School of Economics. University of Nairobi
Signature .... ...............................Date J . P: &?..-.. O f
Dr. George Ruigu
Supervisor, School of Economics, University of Nairobi

Dedication
This work is specially dedicated to my late father Ah Kubcndc Were, my mother Zainabu
Kubende Nabwoba, my friends from Kenya Agricultural Research Institute in Kisii for
their contributions; Kidula, Nasambu and Divina, my late brother Ismael Omukonyi for
the encouragement and mentorship.
Iv

Acknowledgement
I am humbled to acknowledge the efforts of all who made this thesis a success. First, I am
very remorseful to God for the good health, gift of life and having given me the wisdom
throughout my studies. Special thanks to my late brother and father who sacrificed much
to educate me. It’s important to note that it was through their material and moral support
that I have been able to make it this far.
Secondly. I want to thank University of Nairobi. School of Economics for having
admitted me into a master’s programme. With heartfelt thanks. I would wish to direct my
sincere appreciation to my dear supervisors Dr. Mbilhi and Dr. Ruigu who guided and
instructed me through my socio economic analysis. I would also wish to thank Kidula of
KAR1 who assisted me in the statistical analysis, Nasambu Okoko and Divina Andima
for their inputs in questionnaire preparation and superv ision of data collection.
Last but not least. I want to thank my fellow colleagues at my work place, friends and
students for their assistance and encouragement all through the course of my study;
Mukuna Anne, Daniel Otungc. Salome Muriuki, Hellen Osiolo. Esther Kimani , Googc
Sikoyo and Stella Michelle Onditi.
v
Tabic of ContentDECLARATION-------------------- ---------
APPROVAL------------------------------------
dedication--------------------------acknowledgement--------------TABLE OF CO N TEN T---------------------
LIST OF TABLES----------------------------
LIST O F FIGURES--------------------------
ABBREVIATIONS AND ACRONYMS
a b s t r a c t ------------------------------------
1.0 INTRODUCTION-----------------------
1.1 BACKCIROUNO INFORMATION...........1.2 STATEMENT o r TMfc FROIII CM..........1.3 Rhhiarch uojbctivbs..................
/ 3.I General objective...................1,3 2 Specific objectives...................
1.4 JUSTIFICATION.........................................
2.0 LITERATURE REV IEW -------------
2.1 Theoreticai Literature............2.2 Empirical Literature...................2.3 OVERVIEW OF LflT-RATURE..............
III
IV
„ V
.II
..VI
VII
VII
...VIII
3.0 METHODOLOGY II3.1 Conceptual framework.....................3.2TnroRtrK Ai frampwork....................3.3 SENSITIVITY ANALYSIS.........................3.4 ARFAOFSIUDY..................................3.5 Sources of data.....................................3.6 Sampling procedure............................
II1317171717
4.0 RESULTS AND DISCUSSIONS______________________________________________________ 19
4 | Resold! and Discussions.......................................................................................................................194.1.1 Household socio economic characteristics............................................................................ I 94 .1 2 Market information on prices anti quantities.........................................................................224 1.3 The Cost o fT C Technology...................................................................................................... 244 1.4 The economic parameters on market response to change........................................................264 I S The Technology Adoption and agronomic usues..................................................................... 274 1 5 Total technology surplus..... ........... ................................................................................. 294.1.6 Sensitivity analysis........................... 30
5.0 SUMMARY, CONCLUSION. RECOMMENDATION AND AREAS FOR FI RTHER RESEARCH .31
vl
j . l Summary................................................................- ........... - ............. .....................................................315.2 Conclusion ...........................................................................................................................................................................................................................~ .....................................................................................315.3 Policy recommend* mon...................................................................... ........... ......................................325.4 AREAS IOK FURTHER RESEARCH................................................................................................................33
6.0 REFERENCES--------------------------------------------------------------------------------------------------------34
7. ANNEX----------------------------------------------------------------------------------------------------------------------
List of TablesTabi i 1: THE APPROACHES FOR assessing the impact of biotechnology applications.........................6Tabi h 2: The gender oistribui ion of household members......................................................................19Tabll 3: The total expenses ac ross distrk' i s ......................................................................................... .. 20Ta b u 4: The oeckkjn making a i household levels..................................................................................20Tabi r 3: The ranking ok family labour coniribuikjn to banana r u n ted activities................... 21l aiul 6: The assets acquired through income oeneraied from TC bananas.................................. 22Ta b u 7: the estimate market information variables............................................................................ 23Tabi r 8: The oistanct and jkansfort costs ior bananas.......................................................................24Tabi r 9 THE estimated cost of TC technology adoption......................................................................26Ta b u 10: The estimate markft response to change v a ria b u s ............................................................ 26Tabi f 11: The Estimate of technology adoption variabi f s ................................................................. 27Tabi f 12: The estimate of the total nxiiNoi ogy surpi x is .....................................................................29
List of figuresFigure 1: M oon of bio tkh n o i ogy progress in Kenya man ana market............................................ 14
vii
Abbreviations and AcronymsAC Average Cost
ANOVA - Analysis of Vanancc
AR -Average Revenue
BA -Benefits After Adoption
BB -Benefits Before Adoption
BCR -Benefit Cost Ratio
CGIAR -Consultative Group of International Agriculture Research
FAO -Food and Agriculture Organisation
FFS - Farmer Field School
GIA -Gross Income After Adoption
GIB -Gross Income Before Adoption
GMOs -Genetically Modified Organisms
1DRC -International Development Research Center
IPR -Intellectual Property Right
1RR -Internal Rale of Return
ISA A A International Service for the Acquisition of Agri-Biotech Applications
1SNAR -International Service for Agricultural Research
JKUAT - Jomo Kenyatta University of Agriculture and Technology
KARI -Kenya Agricultural Research Institute
KAPP -Kenya Agricultural Productivity Project
MC - Marginal Cost
MoA -Ministry- of Agriculture
MR - Marginal Revenue
NPV -Net Present Value
RF -Rockefeller Foundation
SPSS - Statistical Package for Social Scientists
TC -Tissue C ulture
viil
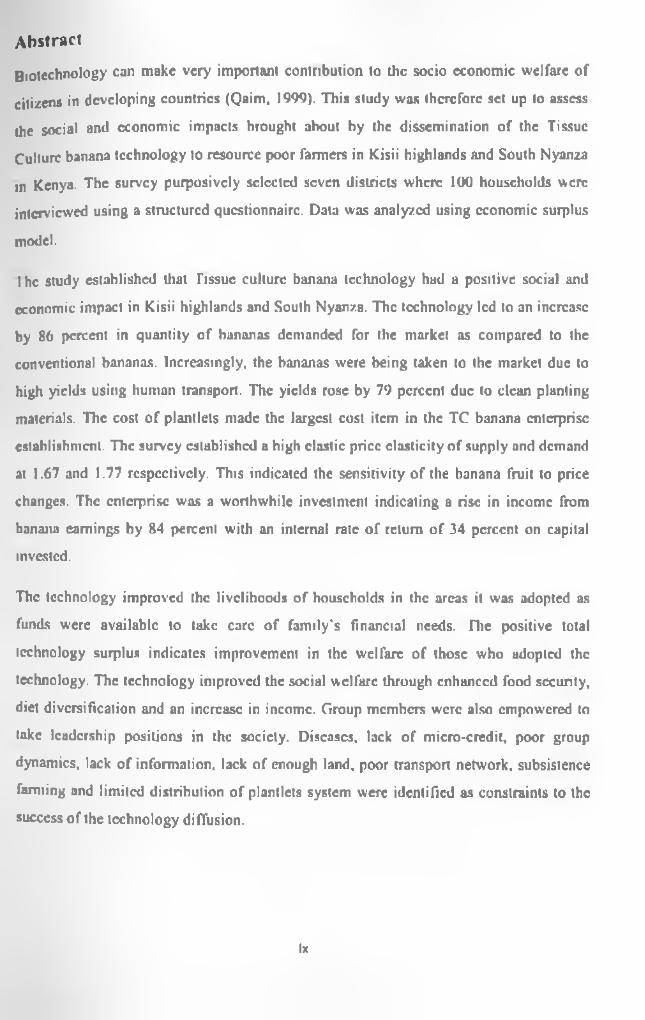
Abstract
Biotechnology can make very important contribution to the socio economic welfare of
citizens in developing countries (Qaim, 1999). This study was therefore set up to assess
the social and economic impacts brought ahout by the dissemination of the Tissue
Culture banana technology to resource poor farmers in Kisii highlands and South Nyanza
in Kenya. The survey purposivcly selected seven districts where 100 households were
interviewed using a structured questionnaire. Data was analyzed using economic surplus
model.
I he study established that Tissue culture banana technology had a positive social and
economic impact in Kisii highlands and South Nyun/.a. The technology led to an increase
by 86 percent in quantity of bananas demanded for the market as compared to the
conventional bananas. Increasingly, the bananas were being taken to the market due to
high yields using human transport. The yields rose by 79 percent due to clean planting
materials. The cost of plantlets made the largest cost item in the TC banana enterprise
establishment. The survey established a high elastic price elasticity of supply and demand
at 1.67 and 1.77 respectively. This indicated the sensitivity of the banana fruit to price
changes. The enterprise was a worthwhile investment indicating a rise in income from
banana earnings by 84 percent with an internal rate ol' return of 34 percent on capital
invested.
The technology improved the livelihoods of households in the areas it was adopted as
funds were available to take care of family's financial needs. Hie positive total
technology surplus indicates improvement in the welfare of those who adopted the
technology. The technology improved the social welfare through enhanced food security,
diet diversification and an increase in income. Group members were also empowered to
take leadership positions in the society. Diseases, lack of micro-credit, poor group
dynamics, lack of information, lack of enough land, poor transport network, subsistence
fanning and limited distribution of plantlets system were identified as constraints to the
success of the technology diffusion.
lx
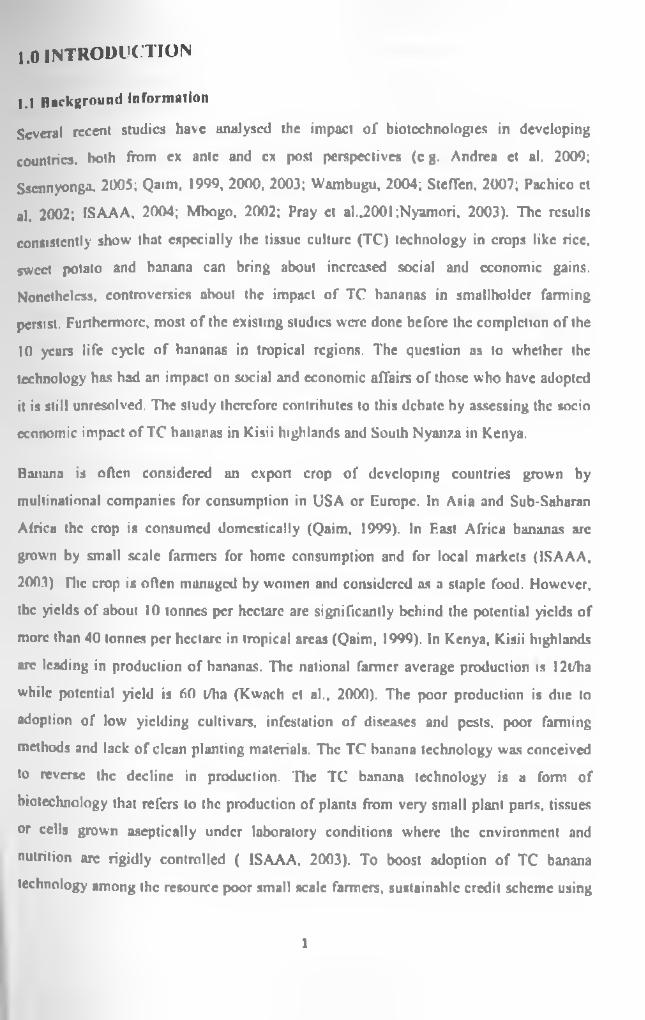
l.o INTRODUCTION
1.1 Background information
Several recent studies have analysed the impact of biotechnologies in developing
countries, both from ex ante and ex post perspectives (eg. Andrea et al. 2009;
Ssennyonga. 2005; Qaim, 1999, 2000, 2003; Wambugu, 2004; Steffen. 2007; Pachico et
al. 2002; ISAAA. 2004; Mbogo, 2002; Pray et al.,2001;Nyamori, 2003). The results
consistently show that especially the tissue culture (TC) technology in crops like rice,
sweet potato and banana can bring about increased social and economic gains.
Nonetheless, controversies about the impuct of TC bananas in smallholder farming
persist. Furthermore, most of the existing studies were done before the completion of the
10 years life cycle of bananas in tropical regions. The question as to whether the
technology has had an impact on social and economic affairs of those who have adopted
it is still unresolved. The study therefore contributes to this debate by assessing the socio
economic impact of TC bananas in Kisii highlands and South Nyanza in Kenya.
Banana is often considered an export crop of developing countries grown by
multinational companies for consumption in USA or Europe. In Asia and Sub-Saharan
Africa the crop is consumed domestically (Qaim. 1999). In F.ast Africa bananas arc
grown by small scale farmers for home consumption and for local markets (ISAAA,
2003) Hie crop is often managed by women and considered as a staple food. However,
the yields of about 10 tonnes per hectare are significantly behind the potential yields of
more than 40 tonnes per hectare in tropical areas (Qaim. 1999). In Kenya, Kisii highlands
arc leading in production of bananas. The national farmer average production is 12t/ha
while potential yield is 60 t/ha (Kwach et al., 2000). The poor production is due to
adoption of low yielding cultivars. infestation of diseases and pests, poor farming
methods and lack of clean planting materials. The TC banana technology was conceived
to reverse the decline in production. The TC banana technology is a fomi of
biotechnology that refers to the production of plants from very small plant parts, tissues
or cells grown aseptically under laboratory conditions where the environment and
nutrition are rigidly controlled ( ISAAA, 2003). To boost adoption of TC banana
technology among the resource poor small scale farmers, sustainable credit scheme using
1
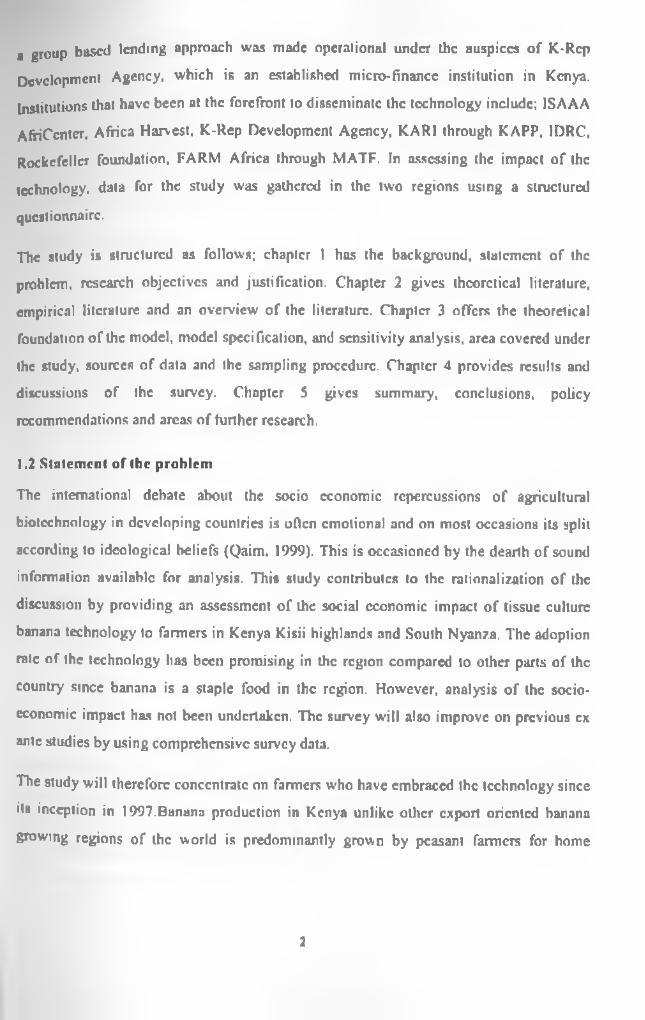
a group based lending approach was made operational under the auspices of K-Rep
Development Agency, which is an established micro-finance institution in Kenya.
Institutions that have been at the forefront to disseminate the technology include; ISAAA
AfriCenter, Africa Harvest, K-Rep Development Agency, KARI through KAPP, IDRC,
Rockefeller foundation, FARM Africa through MATF. In assessing the impact of the
technology, data for the study was gathered in the two regions using a structured
questionnaire.
The study is structured us follows; chapter I has the background, statement of the
problem, research objectives and justification. Chapter 2 gives theoretical literature,
empirical literature and an overview of the literature. Chapter 3 offers the theoretical
foundation of the model, model specification, and sensitivity analysis, area covered under
the study, sources of data and the sampling procedure. Chapter 4 provides results and
discussions of the survey. Chapter 5 gives summary, conclusions, policy
recommendations and areas of further research.
1.2 Statement of the problem
The international debate about the socio economic repercussions of agricultural
biotechnology in developing countries is often emotional and on most occasions its split
according to ideological beliefs (Qaim. 1999). This is occasioned by the deanh of sound
information available for analysis. This study contributes to the rationalization of the
discussion by providing an assessment of the social economic impact of tissue culture
banana technology to farmers in Kenya Kisii highlands and South Nyanza. The adoption
rate of the technology has been promising in the region compared to other parts of the
country since banana is a staple food in the region. However, analysis of the socio
economic impact has not been undertaken. The survey will also improve on previous ex
ante studies by using comprehensive survey data.
The study will therefore concentrate on farmers who have embraced the technology since
its inception in 1997.Banana production in Kenya unlike other export oriented banana
growing regions of the world is predominantly grown by peasant farmers for home
2
consumption ami the national market. It is the most popular eating fruit in the country and
the cooking varieties serve as important staple food (ISAAA. 2003).
In 2005 the area in Kenya under bananas was 83.687 hectares (MOA. 2006). To
individual producers banana is usually part of a diversified cropping pattern including
semi subsistence commodities and domestic cash crops that render a continuous in-kind
and in-cash income flow under very low input regimes.
1.3 Research objectives
1.3.1 General objective
To assess the social economic impact of tissue culture bananas.
1.3.2 Specific objectives
I) To estimate the economic impact of TC technology in the region.
ii) To assess the social impact of TC technology on the existing social set up.
ill) To give policy recommendation based on (i) and (ii) above on enhancing the
technology uptake in order to have a higher impact.
1.4 Justification
Solid information is available about the short and long-term effects of TC technology
under farmer’s conditions in Kenya (Qaim. 1999). The impact assessment is therefore
earned out within an ex-post analytical framework. It builds up on farm level data. The
data would help rationalize discussions on the impact of agricultural biotechnology in
various forums and debates both at national and international levels In view of the
benefits accrued socially and economically the study would prompt the government
through the ministry of agriculture and trade to come up with a policy framework to
support the players along the banana sub sector value chain. Already a banana policy
exists (Karembu. 2007) but a lot has to be done in terms of quantifying the importance of
the fruit. The empirical analyzed data would act as a catalyst to attract investors into the
banana value chain that is currently characterized by lack of clanty and information about
the potential gains of banana as a commercial fruit.
3

The information generated will form a basis for stakeholders in the banana sector and die
government to make informed decisions about the potential of the crop in alleviating food
insecurity. The socio economic impact documented will be used as evidence by
researchers and policy makers for the need to come up with farmer and market driven
biotechnologies that would help improve livelihoods of the society.
A
2.0 l i t e r a t u r e r e v i e w
2.1 Theoretical Literature
Technology has great impact on production. It improves quality, efficiency, output and
lowers costs (Gittinger. 1982). Investment in technology through research and
development leads to inventions and innovations that lead to high production. It also
improves factor productivity through training of labour (Graff, 2000). Technology leads
to capital labour substitution for capital intensive technology. It ulso requires heavy
investment in education, research and development that may he costly to the society and
firms. It sometimes violates ethics like cloning. Despite all these, technology is vital for
production and its demerits to benefits arc insignificant (Alston ct al., 1995).
Genetic modified technology as evaluated by (Graham et al., 2008) showed that it has
substantial net economic benefits at the farm level. The technology reduces pesticide
spraying by 224 million kg (equivalent to about 40 percent of the annual volume of
pesticide active ingredient applied to arable crops in the European Union) and as a result,
it decreases the environmental impact associated with pesticide use by more than 15
percent. He further notes that CM technology has also significantly reduced the release of
greenhouse gas emissions from agriculture, which, in 2005, was equivalent to removing 4
million cars from the roads.
Biotechnology as discussed in an international symposium organized to assess its social
economic impact on modem vegetable production in tropical Asia by (Jayamangkala et
al. 2009) found out that the improved technology led to a rise in farmers profits,
facilitated industry restructuring, enhanced industry professionalism focusing on market
development and increased consumption. In Philippines, (Morooka, 1982) asserted that
land reform and improved biotechnology arc the major factors that influence the socio
economic situation of a village society.
Tissue culture technology as evaluated by (Wambugu, 2004) has had positive impact to
those who adopted it. The benefits include potentially unlimited multiplication of selected
plant lines, elimination of pathogens, production of iruc-to-lypc multiplication material of
5
desirable plan1 lines, indefinite storage of genetic resources through long-term
maintenance of propagule inventories.
The socio economic impact of the tissue culture technology done by (l'AO, 2005) in
China. Kenya. Vietnam and Benin, on sweet potato, banana and rice, respectively showed
Out the technology increased yields and agricultural incomes, had high internal rate of
return compared to capital investment, led to availability of affordable seeds, led to
creation of rural micro enterprises, improved health standards, shorter growing seasons
and resistance to local stresses
2.2 E m p iric a l Literature
Technology adoption has been the main agenda in international forums (Qaim, 1999).
Recent studies done by (Andrea, ct.al. 2009) show significant impacts of technology on
the socio economic welfare of those w ho adopt it. One of the studies assessing the impact
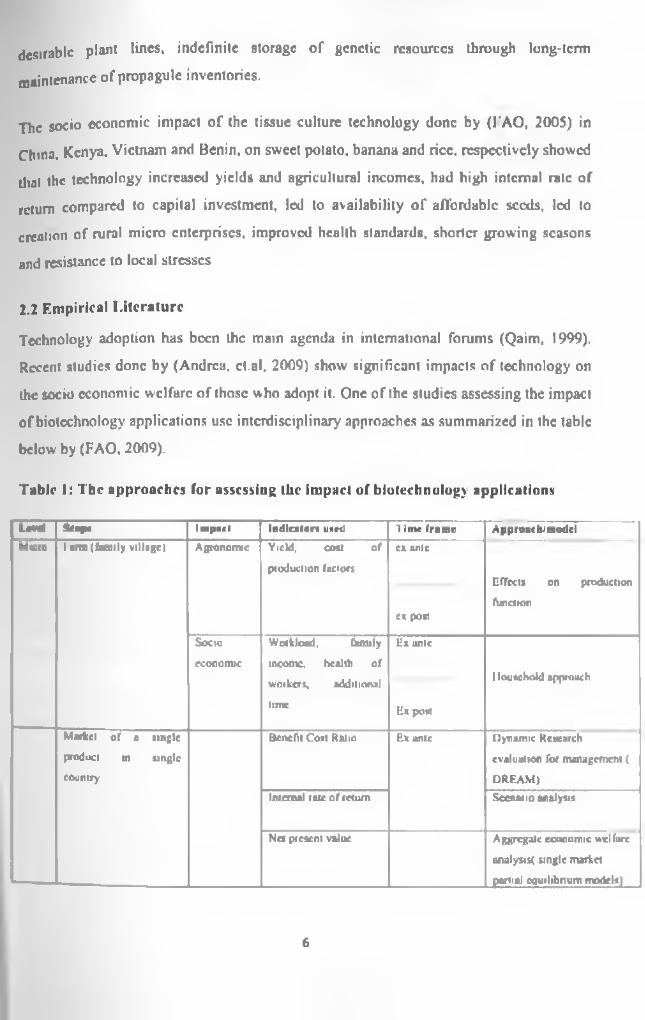
of biotechnology applications use interdisciplinary approaches as summarized in the table
below by (FAO, 2009).
Table 1: The approaches for assessing the impact of biotechnology applications
Level Scop* Impact Indicator! used 1 line frame Approach; modelMicro lurm (family village) Agronomic Yield, cost of
production factors
ex ante
ex port
Effects on production
function
Socio Workload, family Ex ante
economic income, health of
workeTJ, additional
lime Ex port
1 lounchoM approach
Market of a Jingle
product in Jingle
country
Benefit Coni Ratio P.x ante Dynamic Research
evaluation for management (
DREAM)Internal rare of return Scenario analysis
Net present value Aggregate economic welfare
analysis* single market
partial equilibrium models)
6
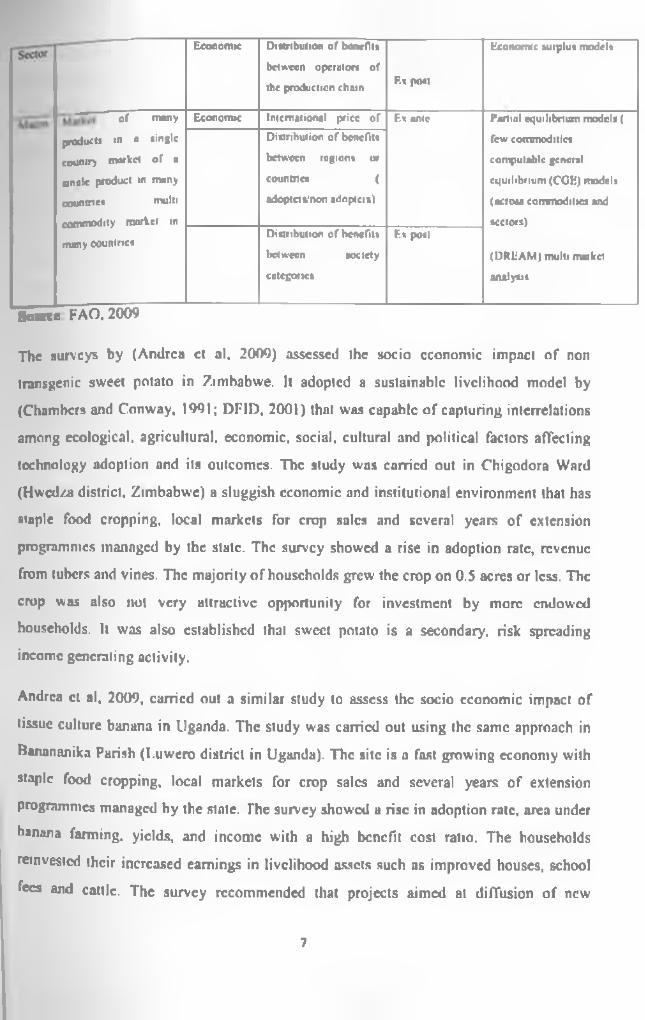
Economic Distribution of benefit*
between operulon of
the production chain F.s post
Economic surplus model*
of many Economic International price of F.s ante Partial equilibrium model* {
product* in a ainglc Distribution of benefit* few commodities
country market of u between region* or computable general
ynclc product in many countries ( equilibrium (COB) model*
countries multi adopter Vnon odoptcis) (across commodities and
commodity market in sectors)
many countriesDistribution of benefit*
1 id wren society
F.s post
(DREAM) multi markclcategoric* analysis
Source FAQ. 2009
The surveys by (Andrea ct al. 2009) assessed the soeio economic impact of non
transgenic sweet potato in Zimbabwe. It adopted a sustainable livelihood model by
(Chambers and Conway. 1991; DFID, 2001) that was capable of capturing interrelations
among ecological, agricultural, economic, social, cultural and political factors affecting
technology adoption and its outcomes. The study was carried out in Chigodora Ward
(Hwcdza district. Zimbabwe) a sluggish economic and institutional environment that has
staple food cropping, local markets for crop sales and several years of extension
programmes managed by the state. The survey showed a rise in adoption rate, revenue
from tubers and vines. The majority of households grew the crop on 0.5 acres or less. The
crop was also not very attractive opportunity for investment by more endowed
households. It was also established that sweet potato is a secondary, risk spreading income generating activity.
Andrea cl al, 2009, carried out a similar study to assess the soeio economic impact of
tissue culture banana in Uganda. The study was carried out using the same approach in
Banananika Parish (I.uwero district in Uganda). The site is a fast growing economy with
staple food cropping, local markets for crop sales and several years of extension
programmes managed by the state. The survey showed a rise in adoption rate, area under
banana farming, yields, and income with a high benefit cost ratio. The households
reinvested their increased earnings in livelihood assets such ns improved houses, school
fees and cattle. The survey recommended that projects aimed at diffusion of new
7
technology should include service packages to technically assist the adopters and that
adoption patterns and impacts should he considered ex ante in the project design in order
to maximize the socio economic impact.
Qaim. 1999- assessed the potential impact of banana biotechnology in Kenya. The aim of
(he study was to find out the benefits of adopting the technology by small scale farmers.
The study employed the economic surplus model where aggregate benefits and
distribution outcomes were analysed using an ex-ante conceptual frame work. Data was
collected during the second half of 1998. The study showed a potential increase in yields
and incomes. It also established a per unit cost reduction in production and high internal
rate of return compared to capital invested in the banana enterprise. The findings led to
conclusion that the technology would change the livelihoods of the small scale farmers. It
was also established that for the technology to have a higher impact it has to be
accompanied by capacity building of farmers and a financial package to help in purchase
of plantlcts and inputs.
Mbogo. 2001. undertook a survey on economic analysis of the production of TC bananas
and an assessment of their market potential in relation to Nairobi as a metropolitan
market The study had five specific objectives as follow's;
i) To develop on station and on farm activities linked with farmers, extension
services, NGOs and other end users to ensure that TC bananas arc evaluated
distributed marketed and utilized, primarily but not exclusively, by small scale
farmers.
ii) To investigate the market opportunities for different banana cultivars in relation to
the TC banana production technology.
iii) To explore the possibility of using TC plants to establish “in situ" nurseries from
which clean suckers can be obtained as a preferred source of planting material of
a Juvenile TC plants and convcctional suckers.
tv) To create a model project to show successful application of biotechnology for
bananas and other commodity crops.
8
v) To suggest policy interventions under which the optimal conditions under which
TC innovations could be adopted to benefit small scale farmers.
The data for the study was gathered from groups in Maragua that had adopted the
technology. The study established that banana value chain was not clear and the cooking
varieties were most preferred in the market. It also revealed that good agronomic
practices would help in use of suckers to disseminate the technology. The survey
recommended a diffusion project for the technology and proposed an intervention by the
government to control the quality of plunllcls production in order to reduce the number of
somactonal variants.
Mbogo. 2002, conducted a baseline survey on the socio economic impact of TC banana
project in Kenya. The study was done in a project funded by FARM Africa and
implemented by 1SAAA and KAR1. The study aimed at evaluating the economic worth of
TC banana project. Data analysis was done using discounting benefits costs ratio model.
Data for the study was gathered using a stratified random sample of 72 banana farmers in
Maragua and Murang’a region in Central Province. Kenya were interviewed using a
structuicd questionnaire. The survey showed that the TC banana enterprise was
worthwhile investment with a high rate of return compared to the capital invested. The
technology adoption led to a rise in income, women participation in farming activities
and high trade margins. The discounted streams of costs and benefits over 10 years
period showed a benefit cost ratio of 4.8. The survey recommended up-scaling of the
technology diffusion with a micro-credit component.
Nyamori, 2003, analysed the socio economic background of tissue culture banana
production in Nyanza. The project was funded by FARM Africa and implemented by
1SAAA and KARl-Kisii. The aims of the study was to identify the empirical social
economic factors that influence adoption of the TC technology in the region, identify
constraints to adoption with a view to recommending strategies that would boost take up
of the innovation, to gather information that would form a basis for monitoring nnd
evaluation. The data for the study was gathered from six groups that had 123 members.
I he study showed that the main socio economic factors influencing adoption were
gender, price of plantlcts, food culture, yield, information dissemination. The main
9
constraints to adoption were; high plant lets prices, small land sizes per household, lack of
information, lack of capital and high level of illiteracy among the residents. The
information gathered that formed a basis for monitoring and evaluation was that: female
participating in the technology were more than males, majority of the households that
were members of the farmer field schools were poor. The survey also established that
banana provided an average of Kshs 500 per month that constitutes 20 percent of the total
income generated from farm activities. Land handling within the three districts was found
to be 1.8 acres with approximately 0.153 acres devoted to TC and 0.223 acres to non TC
banana production.
Ogunsuni ct al., 2005, analyzed the socio economic impact assessment of maize
production technology to farmer's welfare in South West, Nigeria. The aim of the study
was to assess the socio economic impact of improved maize technology on farmer's
welfare. Hie study was carried out in three States namely Oyo, Osun and Ondo States out
of the 8 States in South West Nigeria The economic surplus model was used for the ex
post assessment. The data to calculate social gains was categorized into 4 broad areas;
market data on observed prices and quantities, agronomic evidence and costs of the
technology being adopted, economic parameters on the market response to change
(elasticity’s of supply and demand), research and extension costs incurred in obtaining
the new technology. The study revealed a higher internal rate of return compared to
initial capital investment indicating that the maize technologies had contributed
significantly to members well being The survey recommended that technologies should
be pro-poor, fanners driven and that young people should be encouraged to take to
growing maize as it had proved to he a remunerative crop.
2.3 Overview of literature
I he literature review has shown that there is a need to conduct a socio economic
evaluation of the TC banana technology 10 years after its adoption because no study has
been done. The study would add value by providing sound up to date data of 10 years
which is a period that completes the life cycle of bananas in tropical regions (Qaim, 1999).
10
3.0 Methodology
3.1 Conceptual framework
Socio economic impact assessment of technology can be done through eight approaches
namely; House hold approach. Economic surplus model .Partial equilibrium model.
Scenario analysis. Dynamic Research Evaluation for Management (DREAM), Multi
market and multi commodity model. Computable General Equilibrium models (CGE),
Sustainable Livelihoods Approach (SL.A) frame work ( FAO, 2009).
This study adopts economic surplus approach. The model is able to ascertain distribution
benefits between operators of the banana production value chain with an ex post time
frame as die technology is already in the field ut varying levels of adoption by farmers.
The data needed to calculate social economic gain falls into seven categories namely;
1) Household socio economic characteristics;
2) Market information on prices and quantities;
3) Costs of the technology being adopted;
4) Economic parameters on market response to change ( elasticity’s of supply and
demand, technology shift factor, supply share for producers and per unit cost
reduction);
5) Technology adoption and agronomic evidence;
6) Total technology surplus; and
7) Sensitivity analysis.
Household social economic characteristics that include; sex. age, marital status, highest
level of education, number of years in school, relationship with the household head und
occupation, expenditure pattern, infrastructure, decision making, contribution of family
labour, nutrition, asset purchase and banana ranking was found from the survey questionnaire.
Market information on the Price (P) and Quantity (Q) of the bananas that is afTcctcd by
technology change was found by the average of prices from respondents. The quantity
demanded (qd) was established as the sum of tlic marketed produce after adoption. The
11
uantity demanded for home consumption was found by getting the sum of home
consumption (h) The quantity supplied was found as the total production (Qs).
Marketing information of the region was also established through the survey
questionnaire.
The TC banana technology adoption costs which include; plantation establishment costs
and recurrent costs required to obtain the increased yields associated with the new
technology were found from the surveyed households. Investment costs before and after
adoptions were obtained from the survey data. The per unit reduction in cost of
production and interest rale used by the micro finance institution was established as
useful data for analysis. Per unit cost reduction was calculated by finding the difference
between per unit cost before adoption and per units cost after adoption of the TC banana
technology. Information on economic parameters on market response to change; the price
elasticity of banana supply (EM >w as calculated using the formulae in equation (1)
AQs rV Q
*••••••*< .0 )
Price Plasticity of bananas demanded (E^ was calculated using the formulae in equation
(9)
6Qd PAp Q (2)
The supply share for producers (SS i) was calculated by dividing the quantity supplied of
bananas by the total number of producers.
I lie technology shift factor (K ) was calculated by multiplying the cost reduction per
unit factor by the adoption rule as shown in equation ( 3)
AT =Ci + Ai.................................................. (3)
The technology uptake and agronomic data on the adoption rate, stream of benefits before
and after adoption, consumption behaviour, changes in income, yield gains, value
addition, number of farmers reached by the technology and the micro credit were found
12
from the household surveys. The streams of benefits and costs were discounted to
establish the benefit cost ratio. The information on adoption rates came from farm
surveys and extension workers estimates. The adoption rate (t) is the ratio of area of
improved varieties to total area of the crop in Kisii highlands and south Nyanza region.
The data found served as an input in the economic impact assessment determination. The
total technology surplus was established hy getting the sum of producer surplus and
economic surplus. Sensitivity data was found by varying the variables found from the
survey.
3.2 Theoretical framework
The socio economic impact of TC banana technology in Kisii highlands and South
Nyan/a in Kenya is projected using the consumer surplus model. The model is the most
common approach for the evaluation of conunodity related technological progress in
agriculture (Norton and Davis. 1981; Alston cl al.. 1995). Recently the approach has been
used in ex ante and ex post impact assessment of different non transgenic crop
technologies impact studies (e.g. Qaim 1999, Qaim 2003, Zephaniah, 2009; Ogunsumi ct
al. 2005. Krishna and Qaim, 2007).
The assumptions of the model arc dial:
i) The market clears at a single price ( p) i.e. price being the same for consumers;
ii) Bananas arc assumed to be a homogeneous product regardless of who produces
them or where they arc produced;
iii) There ore (n) producer groups in the project area;
iv) A closed economy since foreign trade in banana is negligible;
v) Equilibrium price is determined by domestic demand and supply; and
vi) Spill over to other markets are disregarded as banana employs a small fraction of
all factors of production in Kenyan agriculture.
The rationale of live economic surplus model is that the technology adoption results in a
rightward shift of the supply curve from Soto S|. On condition that the constant demand
curve Dm prevails, this results in a new equilibrium with lower price Pi and an increased
quantity demanded, Q| for the commodity (Fig 1)
13
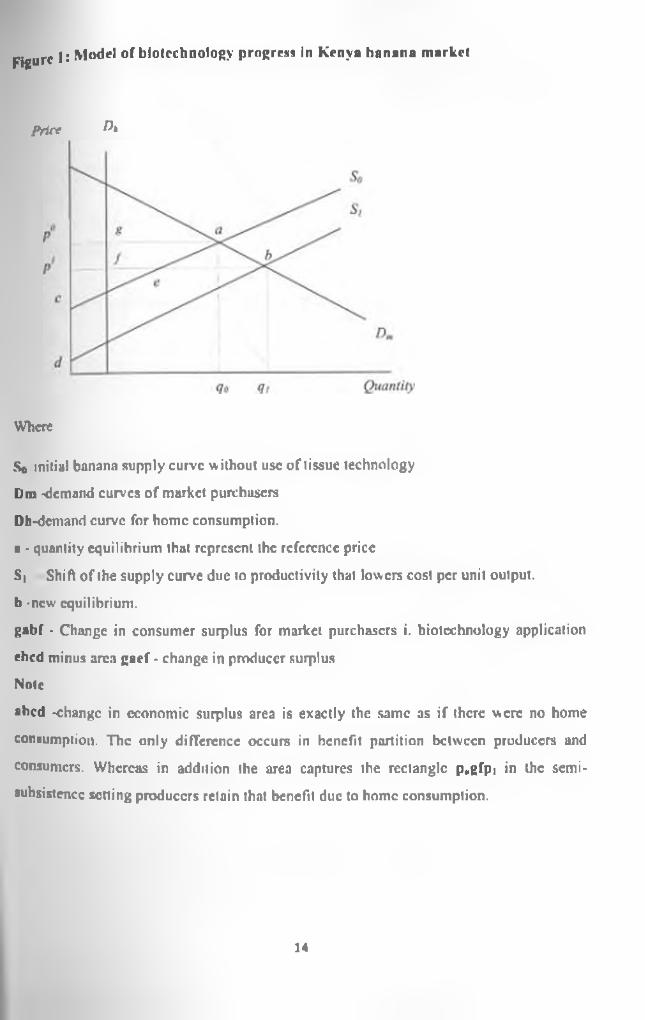
]: Model of biotechnology progress in Kenya banana marketFigure
price f>“
Where
S« initial banana supply curve w ithout use of tissue technology
Dm -demand curves of market purchasers
Dh-demand curve for home consumption,
a - quantity equilibrium that represent the reference price
S| Shift of the supply curve due to productivity that lowers cost per unit output.
b -new equilibrium.
gabf - Change in consumer surplus for market purchasers i. biotechnology application
rbed minus area gaef - change in producer surplus
Note
abed -change in economic surplus area is exactly the same as if there were no home
consumption. The only difference occurs in benefit partition between producers and
consumers. Whereas in addition the area captures the rectangle p<,gfpi in the semi
subsistence setting producers retain that benefit due to home consumption.
14
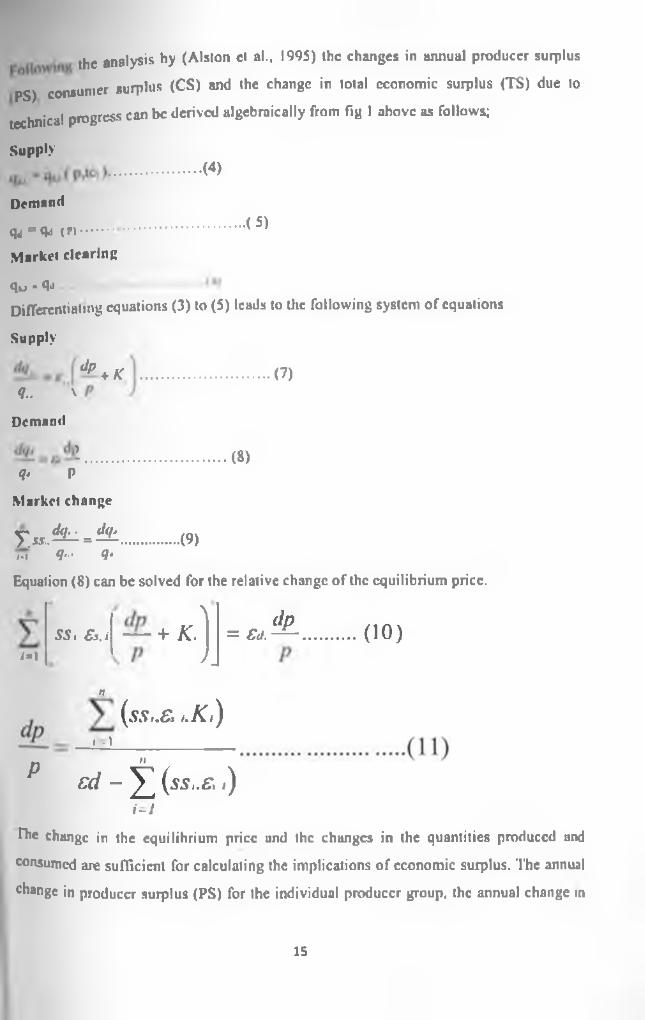
the analysis by (Alston ct al., 1995) the changes in annual producer surplus
PS) consumer surplus (CS) and the change in total economic surplus (TS) due to
technical progress can be derived algebraically from fig I above as follows;
Supply
............................ ( 4 )
Demand•(5)qa • qj < *>.......................
Market clearing
qu - qj .... ......................Differentiating equations (3) to (5) leads to the following system of equations
Supply
............................ (7)9., v
dp + K
Demand
1 ( 8)9* P
Market change
y . u , . ^ = ^ .......m 9 - 9*Equation (8) can be solved for the relative change of the equilibrium price.
•(9)
/=!SS i Ss.i — + K .
\
/ _
(Ip= CcJ.— ( 10)
P
n
( s s i.& i .K i )/ = !__________________
Hcd - ^ (ss,.& /)
i-1
fhe change in the equilibrium price und the changes in the quantities produced and
consumed are sufficient for calculating the implications of economic surplus. The annual
change in producer surplus (PS) for the individual producer group, the annual change in
15
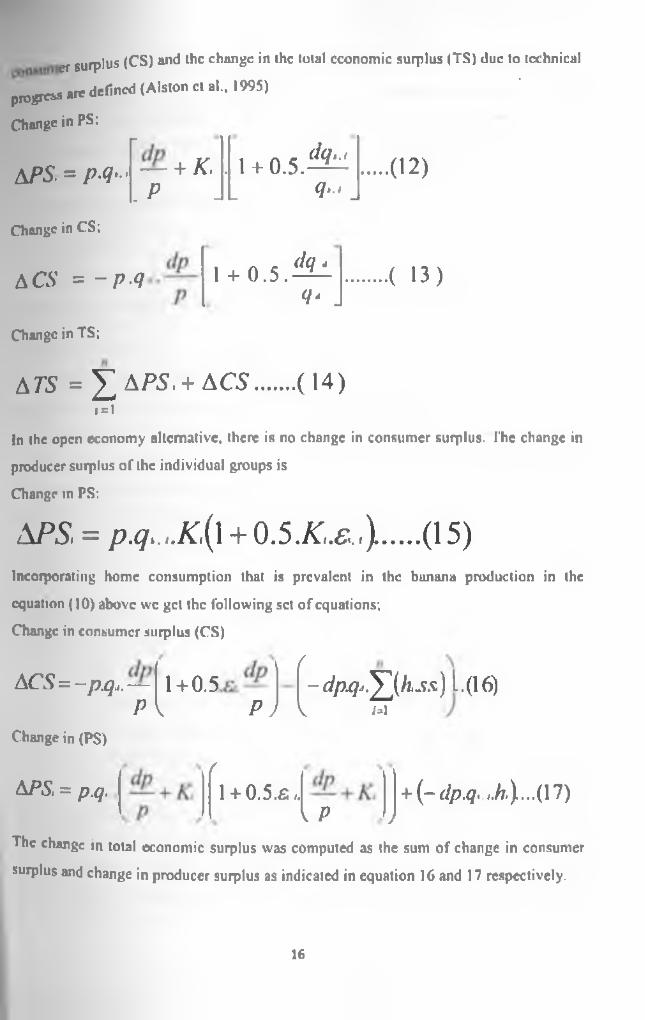
er surplus (CS) and the change in the total economic surplus (TS) due to technical
progi*3*8 are defined (Alston ct al.. 1995)
Change in PS;
APS. = p .q S ~ + K’ . 1 + 0 . 5 . ^ ......( 1 2 )
Change in CS;
ACS = - p . q 1 + 0 . 5 .
Change in TS;
+ K, . _ dq.j 1 + 0 .5 .-2—
. P J L &•* J
dq 4(i‘ J
.( 1 3 )
ATS = Y j APS, + A C S .........( 1 4 )1 = 1
In the open economy alternative, there is no change in consumer surplus. The change in
producer surplus of the individual groups is
Change in PS:
APS, = p.q,.,.K,(\ + 0.5.K,.&.,)..... (15)Incorporating home consumption that is prevalent in the banana production in the
equation (10) above we get the following set of equations;
Change in consumer surplus (CS)
- d p jq j^ j j i s . s) L. (16)M
ACS=-p.q,.— 1 + 0.5f
P \ P J VChange in (PS)
APS, = p.q./
1 + 0 .5 .S r.{ P )
+ (-dp.q,.,.k\...(\l)
The change in total economic surplus was computed as the sum of change in consumer
surplus and change in producer surplus as indicated in equation 16 and 17 respectively.
16
3j sensitivity analysis.
Sensitivity analysis was done by estimating the internal rate of return of the banana
enterprise and then varying variables that arc prone to uncertainty and have an influence
on the welfare and the profitability of the banana enterprise The supply shift factors, the
per unit cost reduction, the price elasticity of supply and the demand and the adoption
rates were varied to establish their impact on the data found from the survey.
3.4 Area of study
The snidy covered seven districts namely: Kisii highlands (Gucha. Kisii central, Masaba,
Nyamira, Kisii south), South Nyun/a (Rachuonyo and Homabay).
3.5 Source* of data
The study used both primary and secondary data Primary data was collected using a
structured questionnaire where the statistical data collected was on market information on
prices and quantities, costs of the technology, data on market response to change, total
technology suiplus and data on technology adoption.
Secondary data was obtained from TC banana technology stakeholders who include;
KARI, ISAAA, K-RIiP Development Agency, Plan International, National AIDS Control
Council JKUAT, Africa Harvest and MoA. The statistical data collected was on
technology adoption and agronomic issues.
3.6 Sampling procedure
A survey methodology was modeled to enable estimation of the impact of TC banana
technology. The districts that had benefited from the TC banana technology were
purposively selected. Data from KARI-RRC was used to determine number of farmers
who had adopted the technology from various districts and the numbers to be interviewed
were fixed per district. The various District Agricultural Officers were contacted to send
enumerators from their various districts who had knowledge of the areas. The district
Agricultural Officers employed cluster sampling technique to identify divisions where
respondents were to he selected. The enumerators sampled the respondents randomly
from the divisions and interviewed them. The Ministry' of Agriculture staffs were also
interviewed to add objectivity in the study. The total number of households surveyed was
17
100 with 60 from Kisii highlands and 40 from South Nyanza. The sample size was
chosen based on time, resources, population, desired result and confidence level of data
to be analysed*
18
4 o r e s u l t s a n d d is c u s s io n s
4 I Results and Discussions
4 i | Household socio economic characteristics
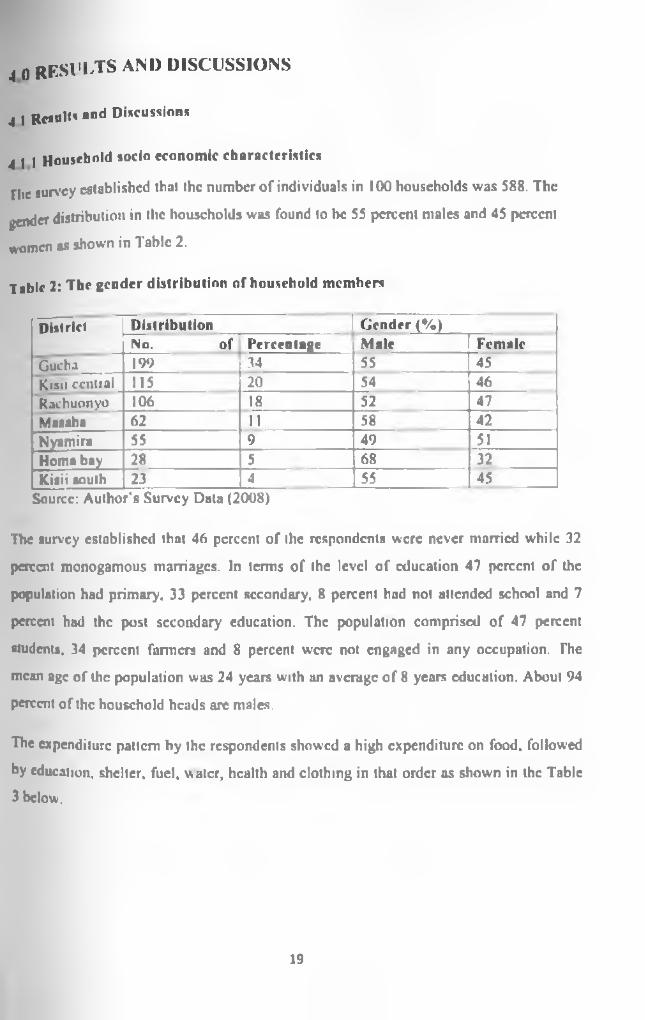
flic survey established that the number of individuals in 100 households was 588. The
gender distribution in the households wus found to be 55 percent males and 45 percent
women as shown in Table 2.
T able 2: The gender distribution of household members
District Distribution | Gender (%)No. of Percentage Male Female
Gucha 199 34 55 45Kisii central 115 20 54 46Rachuonyo 106 18 52 47Musaba 62 11 58 42Nyamira 55 9 49 51Homa bay 28 5 68 32Kisii south 23 4 55 45
Source: Author's Survey Data (2008)
The survey established that 46 percent of the respondents were never married while 32
percent monogamous marriages. In terms of the level of education 47 percent of the
population had primary, 33 percent secondary. 8 percent had not attended school and 7
percent had the post secondary education. The population comprised of 47 percent
students, 34 percent fanners and 8 percent were not engaged in any occupation. The
mean age of the population was 24 years with an average of 8 years education. About 94
percent of the household heads are males.
The expenditure pattern by the respondents showed a high expenditure on food, followed
by education, shelter, fuel, water, health and clothing in that order as shown in the Table 3 below.
19
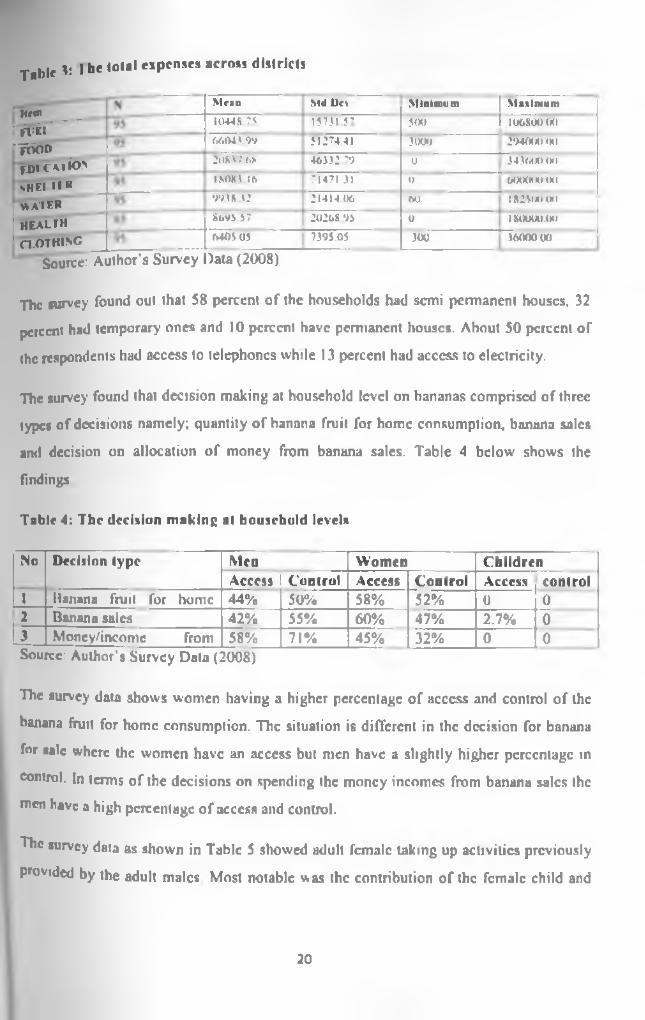
v | he total expenses across districtsTable
ruM______[7v5p b o o I joutA iiw
sHH I»« WVIKK HEALTH CLOTWNC
Source: Author’s Survey
Mean Sid Dev Minimum Mailmum10448.7$ 15731 5 ' 500 106800 00
66043.99 51274.4! 3000 29400000
208J7.68 46332 79 0 34360000
18083.16 7I47IJ1 0 60000000
0MS.32-... . ■ ■
21414.06 60 182500.008693.57 20268.95
0180000.00
6405.03 7J95.05 300 3600000
)ata (2008)
The survey found out that 58 percent of the households had semi permanent houses, 32
percent had temporary ones and 10 percent have permanent houses. About 50 percent of
the respondents had access to telephones while 13 percent had access to electricity.
The survey found that decision making at household level on bananas comprised of three
types of decisions namely; quantity of banana fruit for home consumption, banana sales
ami decision on allocation of money from banana sales. Table 4 below shows the
findings
Table 4: The decision making at household levels
No Decision type Men Women ChildrenAccess C'untrol Access Control Access control
I Banana fruit for home 44% 50% 58% 52% 0 02 Banana sales 42% 55% 60% 47% 2.7% 0
1 3 Moncy/incomc from 58% 71% 45% 32% 0 0Source: Author’s Survey Data (2008)
The survey data shows women having a higher percentage of access and control of the
banana fruit for home consumption. The situation is different in the decision for banana
for sate where the women have an access but men have a slightly higher percentage in
control. In terms of the decisions on spending the money incomes from banana sales the
men have a high percentage of ucccss and control.
The survey data as shown in Table 5 showed adult female taking up activities previously
provided by the adult males Most notable was the contribution of the female child and
20
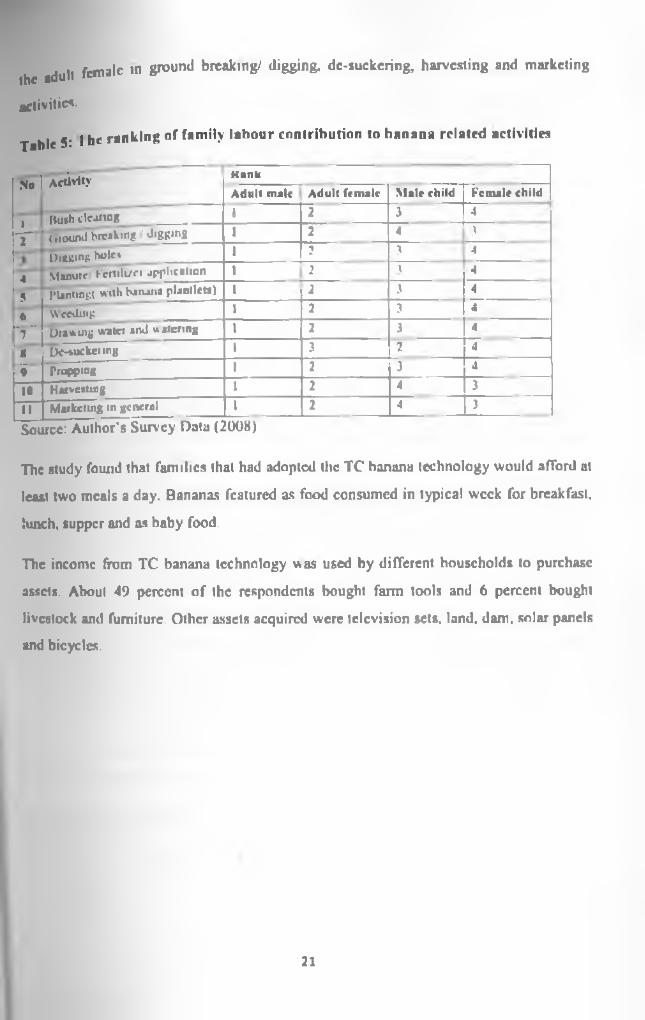
female in ground breaking/ digging, dc-suckcring, harvesting and marketingthe adult
activities
Table 5:I he ranking of family labour contribution to banana related activities
N .1 Activity Kank
Adult male Adult female M ale child Female child
Bush clewing 1 2 3 4J — 2 "fhourul breaking / digging 1 2 4 3
Diluting hole* 1 2 3 4—
4 Manure’ Fertili/ci application 1 2 3 4— ■■ 5 "Planting with banana plantlcU) 1 2 3 4
6 Weeding 1 2 3 4
“ 7 ~ D ialing Wile* and watering 1 2 3 4L
* DewcVximg 1 3 2 4
r Propping 1 2 3 4
10 Harvesting 1 2 4 3
11 Marketing in general 1 2 4 3
Source: Author's Survey Data (2008)
The study found that families that had adopted the TC banana technology would afford ut
least two meals a day. Bananas featured as food consumed in typical week for breakfast,
lunch, supper and as baby food.
The income from TC banana technology was used by different households to purchase
assets. About 49 percent of the respondents bought farm tools and 6 percent bought
livestock and furniture. Other assets acquired were television sets, land, dam. solar panels
and bicycles.
21
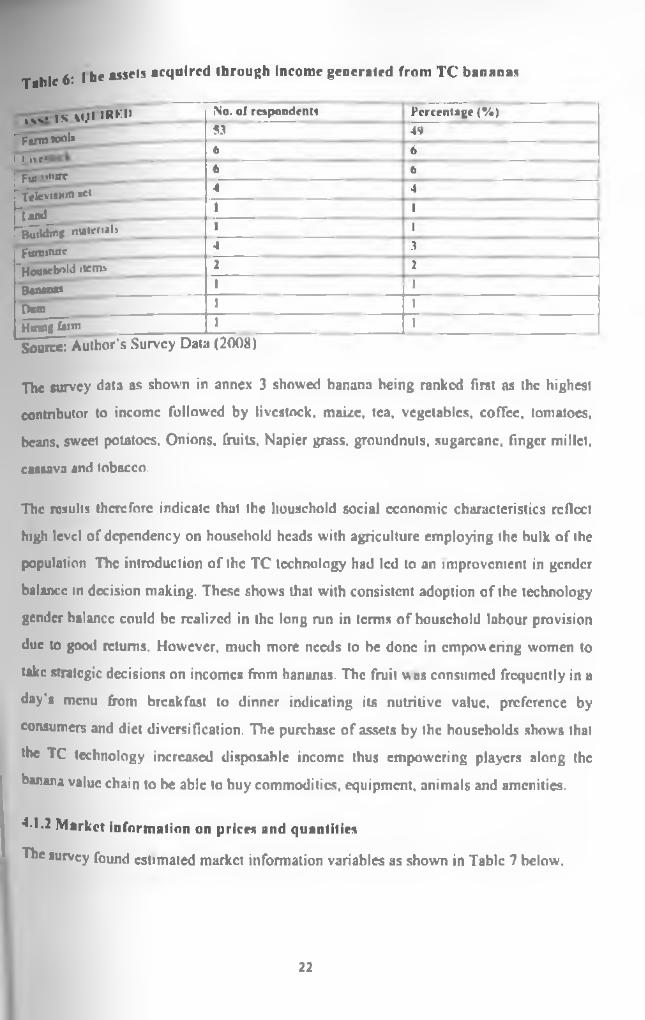
Table 6: I he assets acquired through income generated from TC bananas
vss. , s M.lt IKH> No. of respondents Percentage (*/•)
rF irm tools S3 49
1 I nc; ______ 6 6
I pa l in t 6 6
hfelcvisxin set 4 4
hund 1 1fc w T n g maienab 1 1
Furniture 4 3
"Household items 2 2
Banna* 1 1Pam 1 t
Hump fatm 1 1Source: Author’s Survey Data (2008)
The survey data as shown in annex 3 showed banana being ranked first as the highest
contributor to income followed by livestock, maize, tea, vegetables, coffee, tomatoes,
beans, sweet potatoes. Onions, fruits, Napier grass, groundnuts, sugarcane, finger millet,
cassava and tobacco.
The results therefore indicate that the household social economic characteristics reflect
high level of dependency on household heads with agriculture employing the bulk of the
population The introduction of the TC technology had led to an improvement in gender
balance in decision making. These shows that with consistent adoption of the technology
gender balance could be realized in the long run in terms of household labour provision
due to good returns. However, much more needs to be done in empowering women to
take strategic decisions on incomes from bananas. The fruit w as consumed frequently in a
day’s menu from breakfast to dinner indicating its nutritive value, preference by
consumers and diet diversification. The purchase of assets by the households shows that
the TC technology increased disposable income thus empowering players along the
banana value chain to be able to buy commodities, equipment, animals and amenities.
4.1.2 Market information on prices and quantities
The survey found estimated market information variables as shown in Table 7 below.
22
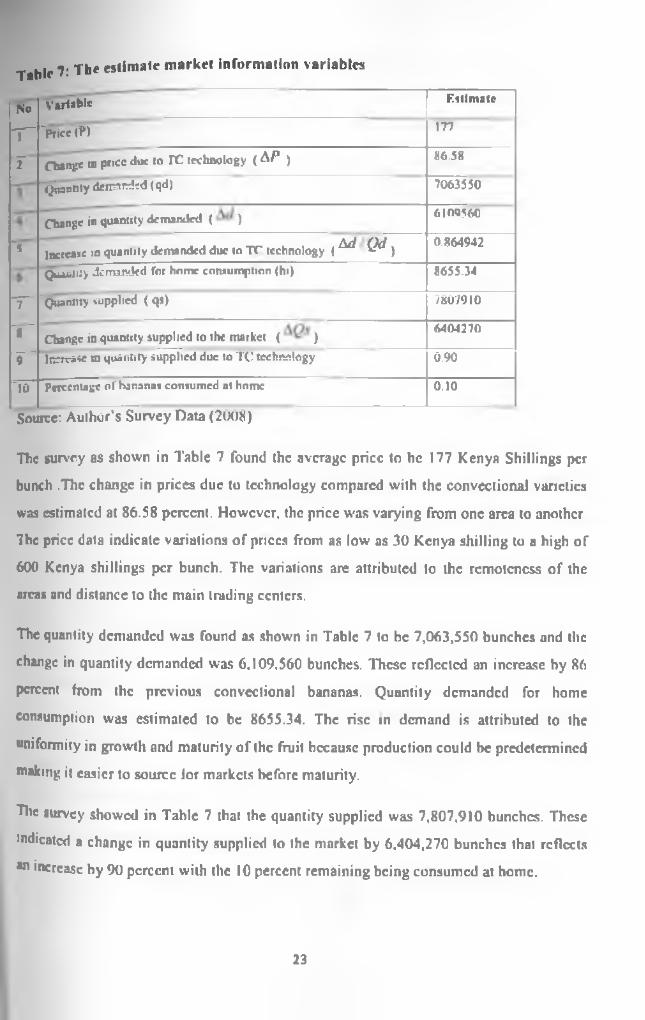
Table 7: The estimate market information variables
No
T ”
Variable Estim ate
"PrieTtP) 177
i Change in price due to rC technology ( A/* ) 86.58
Q ^n n ty demanded (qd) 7063550
Change in quantity demanded ( ) 6109560
"5 Increase in quantity demanded due to TC technology ( ^ ^ )0.864942
Quantity demanded for home consumption (hi) 8655.34
T ~ "Quantity supplied ( qs) 7807910
~ s ~ Change in quantity supplied to the market ( )6404270
T ~ Increase m quannty supplied due to TC technology 0.90
n r Percentage o f banana* consumed at home 0.10
Source: Author’s Survey Data (2008)
The survey as shown in Table 7 found the average price to he 177 Kenya Shillings per
bunch .The change in prices due to technology compared with the convections! varieties
was estimated at 86.58 percent. However, the price was varying from one area to another
The price data indicate variations of prices from as low as 30 Kenya shilling to a high of
600 Kenya shillings per bunch. The variations are attributed to the remoteness of the
areas and distance to the main trading centers.
The quantity demanded was found as shown in Table 7 to be 7,063,550 bunches and the
change in quantity demanded was 6,109.560 bunches. These reflected an increase by 86
percent from the previous convectionai bananas. Quantity demanded for home
consumption was estimated to be 8655.34. The rise in demand is attributed to the
uniformity in growth and maturity of the fruit because production could be predetermined
making it easier to source lor markets before maturity.
Tlie survey showed in Table 7 that the quantity supplied was 7,807,910 bunches. These
indicated a change in quantity supplied to the market by 6,404,270 bunches that reflects
“n increase by 90 percent with the 10 percent remaining being consumed at home.
23
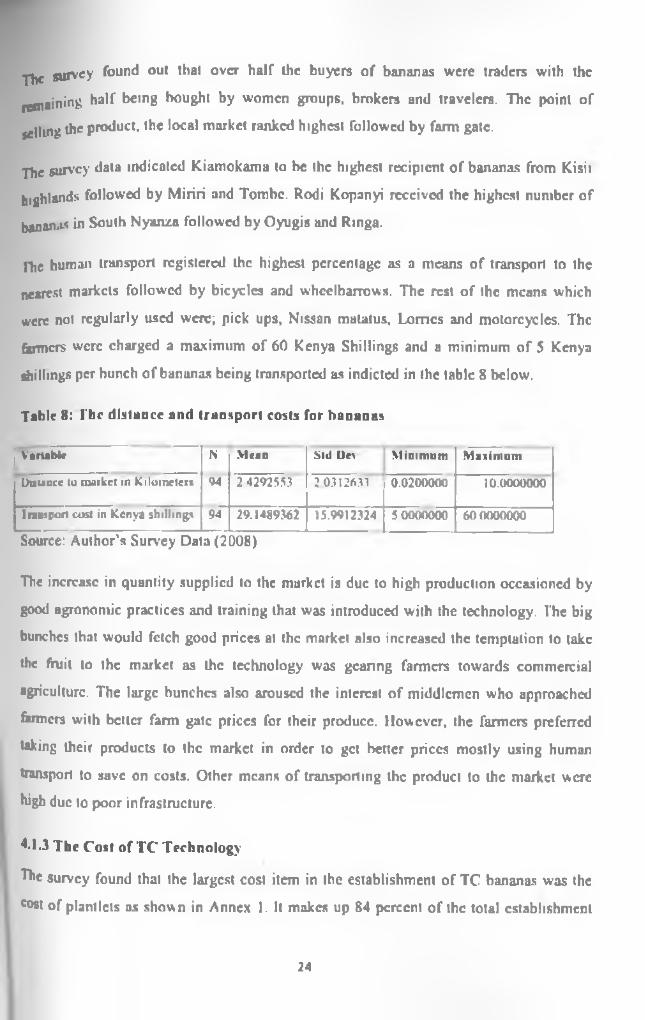
jhe survey found out that over half the buyers of bananas were traders with the
remaining half being bought by women groups, brokers and travelers. The point of
selling the product, the local market ranked highest followed by farm gate.
yhe survey data indicated Kiamokama to be the highest recipient of bananas from Kisii
highlands followed by Miriri and Tombe. Rodi Kopanyi received the highest number of
banon.is in South Nyanza followed by Oyugis and Ringa.
Ihe human transport registered the highest percentage as a means of transport to the
nearest markets followed by bicycles and wheelbarrows. The rest of the means which
were not regularly used were; pick ups, Nissan matatus. Lorries and motorcycles. The
farmers were charged a maximum of 60 Kenya Shillings and a minimum of 5 Kenya
shillings per bunch of bananas being transported as indicted in the table 8 below.
Table 8: The distance and transport costs for bananas
| Variable N Mean Mil D u M inim um MaximumDistance to market in Kilometers 94 24292553 2.0312633 0 .020 0 0 0 0 10.0000000
transport cost in Kenya shillings 94 29.1489362 15.9912324 5.0000000 60 0000000
Source: Author’s Survey Data (2 008)
The increase in quantity supplied to the market is due to high production occasioned by
good agronomic practices and training that was introduced with the technology. The big
bunches that would fetch good prices at the market also increased the temptation to take
the fruit to the market as the technology was gearing farmers towards commercial
agriculture. The large bunches also aroused the interest of middlemen who approached
farmers with belter farm gate prices for their produce. However, the farmers preferred
taking their products to the market in order to get better prices mostly using human
transport to save on costs. Other means of transporting the product to the market were
high due to poor infrastructure.
•*•1.3 The Cost of TC Technology
The survey found that the largest cost item in the establishment of TC bananas was the
cost of plantlcls as shown in Annex 1. It makes up 84 percent of the total establishment
24
^ The current commercial price of vitro plants in Kenya was found to be Kenya
5^ 111, ^ 100 from KARI and Genetic Technologies International Limited (GT1L) which
combined with inputs is high.
The recurrent annual cost for banana production is shown in Annex 1. The expenditure
for fertilizer and manure made the larger component of the recurrent expenditure. Other
costs included; weeding, de-suckering and mulching, pesticides, watering, pre-harvest
propping of stems and interest on loan given to purchase plantlcts. The recurrent cost
expenditure for manure and fertilizer was high because the TC bananas require
appropriate nutrients for satisfactory growth and development. The need for clean field
conditions also increased the costs of the recurrent expenditure on the crop.
The interest on loan from K-Rep Development Agency was established to be 16 percent
on reducing balance. About 51 percent of those interviewed had access to micro-credit to
purchase dairy cows, farm tools, establish businesses, purchase of TC banana plantlcts
and inputs. The main sources of credit funds to establish the orchards were from K-RFP
Development Agency. KARI, personal savings. Plan International and National Aids
Control Council, Merry go round and Kenya Commercial Bank. The funds especially
from K-Rep Development Agency came inform of micro credit which was considered as
an innovative component put into TC banana technology to boost adoption and diffusion
of the technology to farmers. The survey found the following as problems encountered in
repaying the loans advanced to them in kind; the farmers who had good harvests diverted
the funds meant for repayment to other financial activities including payment of school
fees, the grace period for loun repayment was too short, the interest rate of 16 percent was
quite high for agricultural produce. It was established that during the project penod funds
were also embezzled by a loans officer and records disappeared. The survey found that
the production was not as good as projected due to unfavorable weather conditions
making repayment difficult.
25
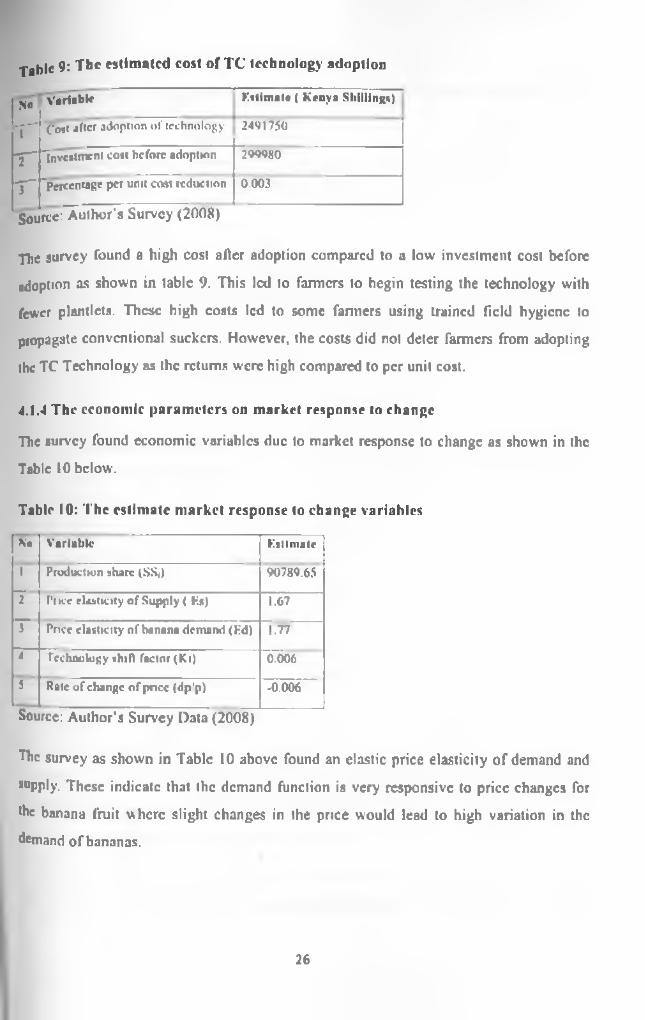
Table 9: The estimated cost of TC technology adoption
|N o Variable estim ate ( Kenya Shillings)
- r 'Cost after adoption o f technology 2491750
T " Investm ent cost before adoption 299980
7 ~ "percentage per unit cost reduction
. .1 ... . ̂ AAO v
0.003
Source: Author's Survey (2008)
The survey found a high cost after adoption compared to a low investment cost before
adoption as shown in table 9. This led to farmers to begin testing the technology with
fewer plantlcts. These high costs led to some fanners using trained field hygiene to
propagate conventional suckers. However, the costs did not deter farmers from adopting
the TC Technology as the returns were high compared to per unit cost.
4.1.4 The economic parameters on market response to change
The survey found economic variables due to market response to change as shown in the
Table 10 below.
Table 10: The estimate market response to change variables
No Variable Estimate
I
7
T
Production share (SS|) 90789.65
Price elasticity o f Supply ( Ka) 1.67
Price elasticity o f banana demand (Fd) 1.77
4 Technology shift factor (Ki) 0.006
5 Rate o f change o f pnee (dp'p) -0.006
Source: Author's Survey Data (2008)
The survey as shown in Table 10 above found an elastic price elasticity of demand and
supply. These indicate that the demand function is very responsive to price changes for
the banana fruit where slight changes in the price would lead to high variation in the
demand of bananas.
26
The positive technology shift factor indicated that the use of the technology would have
an equally positive impact on the supply side of the factors of production in the banana sub-sector.
The survey established a negative rale of change of price. This shows that a reduction in
price due to increased supply occasioned by high production of bananas due to the TC technology udoplion.
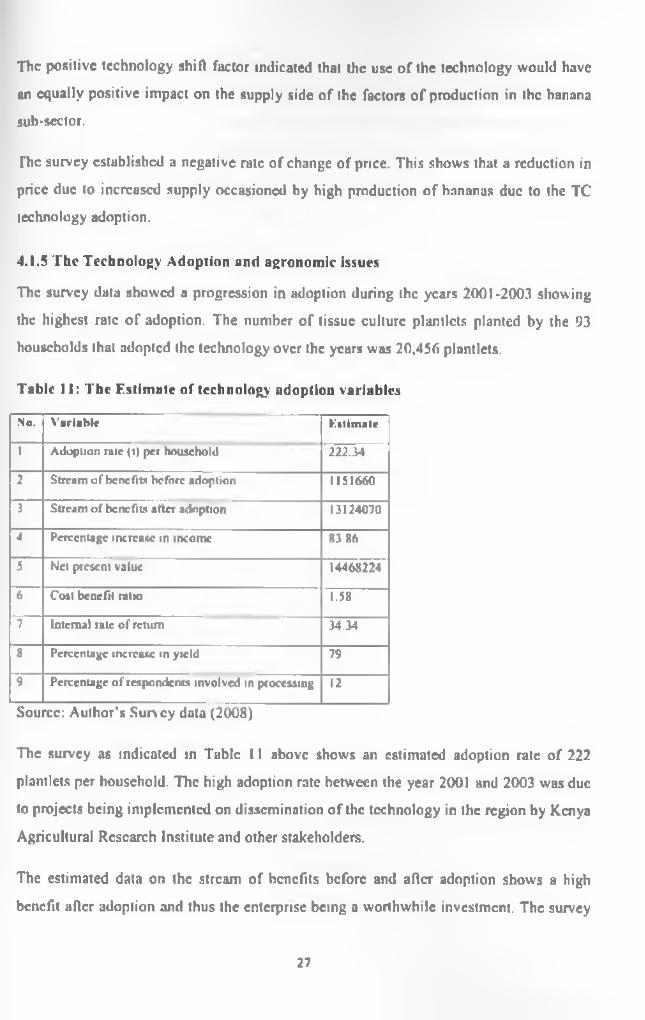
4.1.5 The Technology Adoption and agronomic issues
The survey data showed a progression in adoption during the years 2001-2003 showing
the highest rate of adoption. The number of tissue culture plantlcts planted by the 93
households that adopted the technology over the years was 20.456 plantlcts.
Table 11: The Estimate of technology adoption variables
No. V ariable Kstimatr
1 Adaption rate (1) per household 222.34
2 Stream o f benefits before adoption 1151660
3 Stream o f benefits after adoption 13124070
4 Percentage increase in income 83 86
5 Net present value 14468224
6 Cost bene fit ratio 1.58
7 Internal rate o f return 34.34
8 Percentage increase in yield 79
9 Percentage o f respondents involved in processing 12
Source: Author’s Survey data (2008)
The survey as indicated in Table 11 above shows an estimated adoption rate of 222
plantlets per household. The high adoption rate between the year 2001 and 2003 was due
to projects being implemented on dissemination of the technology in the region by Kenya
Agricultural Research Institute and other stakeholders.
The estimated data on the stream of benefits before and after adoption shows a high
benefit after adoption and thus the enterprise being a worthwhile investment. The survey
27
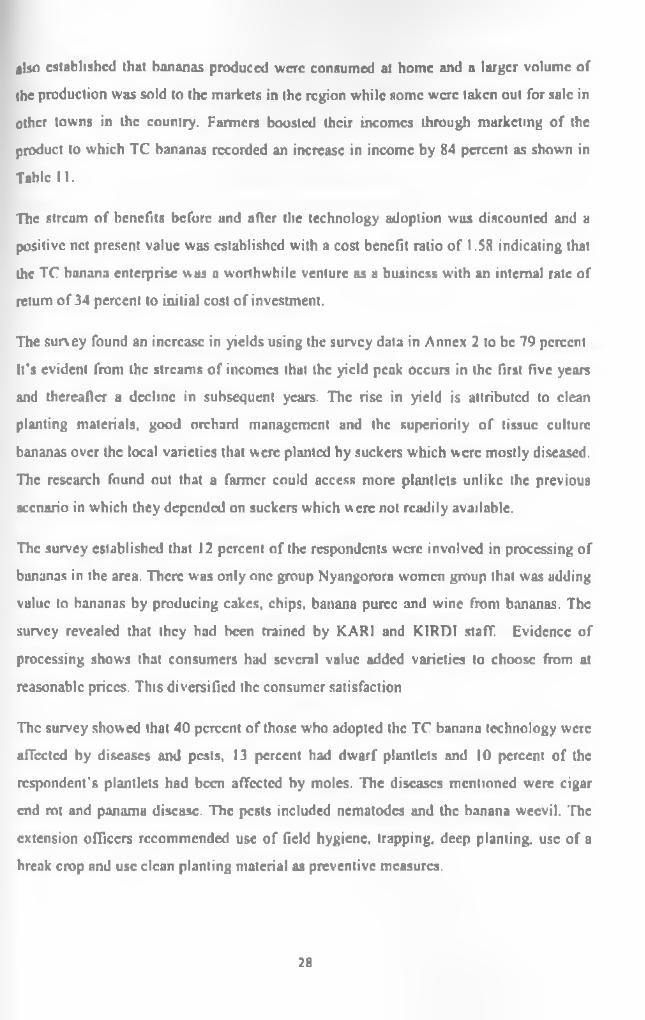
also established that bananas produced were consumed at home and a larger volume of
the production was sold to the markets in the region while some were taken out for sale in
other towns in the country. Farmers boosted their incomes through marketing of the
product to which TC bananas recorded an increase in income by 84 percent as shown in
Table 11.
The stream of benefits before and after the technology adoption was discounted and a
positive net present value was established with a cost benefit ratio of 1.58 indicating that
the TC banana enterprise was a worthwhile venture us a business with an internal rate of
return of 34 percent to initial cost of investment.
The survey found an increase in yields using the survey data in Annex 2 to be 79 percent
It’s evident from the streams of incomes that the yield peak occurs in the first five years
and thereafter a decline in subsequent years. The rise in yield is attributed to clean
planting materials, good orchard management and the superiority of tissue culture
bananas over the local varieties that were planted by suckers which were mostly diseased.
The research found out that a farmer could access more plantlcts unlike the previous
scenario in which they depended on suckers which were not readily available.
The survey established that 12 percent of the respondents were involved in processing of
bananas in the area. There was only one group Nyangorora women group that was adding
value to bananas by producing cakes, chips, banana puree and wine from bananas. The
survey revealed that they had been trained by KARI and KIRDI staff. Evidence of
processing shows that consumers had several value added varieties to choose from at
reasonable prices. This diversified the consumer satisfaction
The survey show ed that 40 percent of those who adopted the TC banana technology were
uiTcctcd by diseases and pests, 13 percent had dwarf plantlcts and 10 percent of the
respondent’s plantlcts had been affected by moles. The diseases mentioned were cigar
end rot and panama disease. The pests included nematodes and the banana weevil. The
extension officers recommended use of field hygiene, trapping, deep planting, use of a
break crop and use clean planting material as preventive measures.
28
A number of problems including: inadequate capital, unfavorable weather conditions,
lack of market, difficult management practices, low yields than expected, lack of enough
land, poor transport network, lack of funds for inputs, accessibility of plantlcts not easy,
poor soils, low prices, poor ripening methods were mentioned as problems encountered
by farmers who adopted the technology. It was also noted that limited distribution system
for plantlcts w as a major constraint compounded by the high cost of the plantleis.
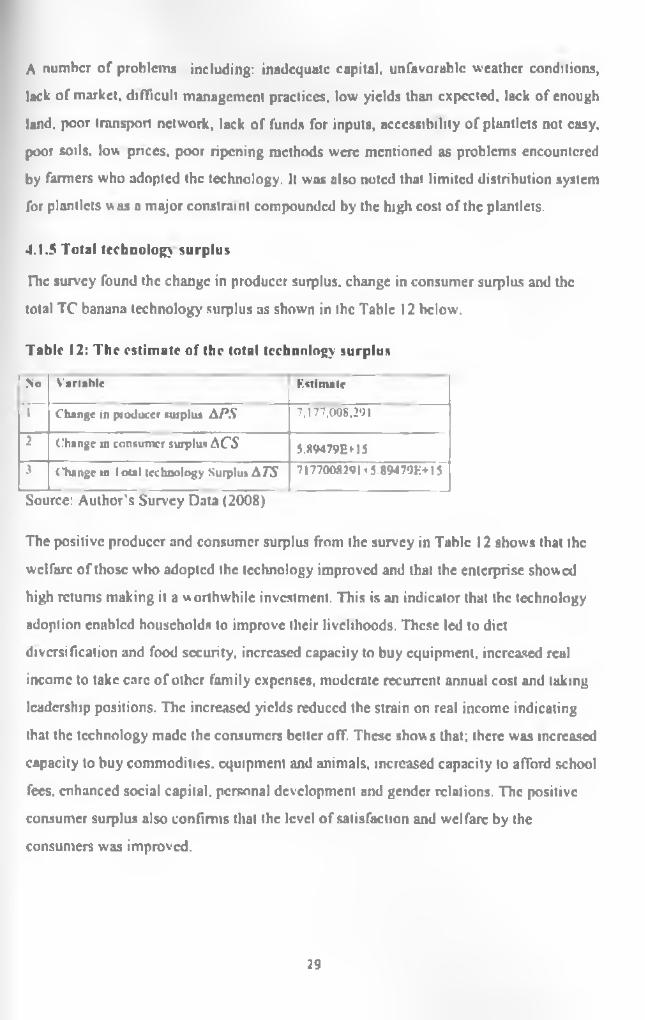
4.1.5 Total technology surplus
The survey found the change in producer surplus, change in consumer surplus and the
total TC banana technology' surplus as shown in the Table 12 below.
Table 12: The estimate of the total technology surplus
f N o
T ~
Variable Kftimatc
Change in ptuducer surplus APS 7.177.008.291
2 Change in consumer surplus ACS 5.89479EU5i C h a n g e in 1 otal technology Surplus ATS
__ _ A .1 * _ «*»
7 1770082911 5.89479H+15
Source: Author's Survey Data (2008)
The positive producer and consumer surplus from the survey in Table 12 shows that the
welfare of those who adopted the technology improved and that the enterprise show ed
high returns making it a worthwhile investment. This is an indicator that the technology
adoption enabled households to improve their livelihoods. These led to diet
diversification and food security, increased capacity to buy equipment, increased real
income to take care of other family expenses, moderate recurrent annual cost and taking
leadership positions. The increased yields reduced the strain on real income indicating
that the technology made the consumers better off. These show s that; there was increased
capacity to buy commodities, equipment and animals, increased capacity to afford school
fees, enhanced social capital, personal development and gender relations. The positive
consumer surplus also confirms that the level of satisfaction and welfare by the
consumers was improved.
29
4.1.6 Sensitivity analysis
Sensitivity analysis was done on variables that arc prone to uncertainty and have an
influence on the welfare and profitability of the banana enterprises. The supply shift
factors: per unit cost reduction (c) and adoption rate (A) were varied and had no influence
on the internal rate of return which was still above 16 percent. The percentage is
considered as the profitability cut ofT point as it was the interest rate used by the micro
finance institutions that funded the capital investment during the TC’ banana technology
dissemination.
Sensitivity to price elasticity of supply and demand was tested The variation had an
effect on the distribution where a reduction in supply elasticity shifts more benefits from
consumers to producers. The reduction in price elasticity of demand leads to an increase
in consumer surplus that impact negatively to producers thus reducing the yield.
30
5.0 SUMMARY, CONCLUSIONS, RECOMMENDATIONS AND AREAS FOR FURTHER RESEARCH
5.1 Summary
Tissue culture banana technology had a positive social and economic impact in Kisii
highlands and South Nyan/a The technology led to an increase by 86 percent in quuntity
of bananas demanded for the market as compared to the conventional bananas.
Increasingly, the bananas were being taken to the market due to high yields using human
transport. The yields rose by 79 percent due clean planting materials. The cost of plantlets
made the largest cost item in the TC banana enterprise establishment. The micro credit
component in the project was innovative as it helped in casing capital constraint to
adoption.
The survey established a high clastic price elasticity of supply and demand at 1.67 und
1.77 respectively. This indicated the sensitivity of the banana fruit to price changes. The
enterprise was a worthwhile investment indicating a rise in income from banana earnings
by 84 percent with an internal rate of return of 34 percent on capital invested.
The tccluiology improved the livelihoods of households in the areas it was adopted as
funds were available to take care of family’s financial needs. The positive total
technology surplus indicates improvement in the welfare of those who adopted the
technology. However, diseases, dwarf plantlets and moles affected the adoption rate.
5.2 Conclusions
Tissue culture banana technology improved the welfare of residents in Kisii highlands
and South Nyan/a in Kenya. The crop was readily accepted as it’s a staple food in the
region. The technology led to an increase in yields, rise in income and diversity in
consumer satisfaction due to value Oaddition. ITespitc the rise in plantation establishment
cost, the benefits were higher than capital invested. Pre-determined production made it
easier for producers to source for markets and the remaining surplus delivered to
processors for value addition The funds generated were utilized for wealth creation and
thus increasing the economic worth of the residents. It was also established that banana is
an individual business where marketing boards and cooperatives do not exist.
31
Diffusion of the technology led to gender balance in decision making on households
issues especially on funds usage after sale of produce and contribution of household
labour to production. Food security and diet diversification was enhanced due to an
increase in production. The availability of food led to a rise in disposable income that was
used to purchase assets, pay school fees, health and other family related costs.
The TC banana technology improved livelihoods of women who were able to access
income from the sale of the produce. These enhanced social, personal development and
gender relations. The group members were also empowered to take leadership at different
levels in the region. It should be noted that the micro credit component factored in the
technology diffusion process was crucial to the success of the project as it solved the
capital problem.
However, it's crucial to note that diseases, lack of farmers driven micro credit package ,
lack of a good sustainability mechanism, banana marketed as subsistence crop, lack of
enough land, poor transport network and limited distribution of plantlets were constraints
to the success of the technology.
5.3 Tolley recommendations
Policy recommendations target the ministry of agriculture and trade which play a major
role in the banana value chain. Technologies should be developed and disseminated
bearing the socio economic status of users in mind that is poor resource farmers and
should be cost effective for proper adaptation. Sustuinability of the technology should be
the focus of research and extension. In order to enhance the social economic impact of
TC banana technology more research needs to be done to reduce disease prevalence in
the banana sub sector. Policy support is required for input delivery system of micro
finance institutions to be fanners driven other than their present focus of being profit
oriented. The government should market banana as a high value crop through provision
of good infrastructure and favourable investment environment to facilitate value addition
of the crop. The government should work with the players along the banana value chain
to establish low cost village laboratoncs and satellite nurseries in the banana growing
areas to solve the problem of plantlets distribution. There is a need to educate young
32
Kenyans to take to agriculture and especially to growing of TC bananas since it has been
proven in this study to be a remunerative crop enterprise for those who adopted and
sustained the use of recommended practices.
5.4 Areas for further researchi) Technology spill over -Is the wide utilization of research products over a range of
agricultural production conditions or environments and cutting across
geographical boundaries. The TC banana technology has had a wide ranging
spillover cITccts arising from cross border trade in bananas and coming up of TC
banana hardening nurseries. The estimated impact does not include these
spillovers due to trade between the regions. This is meant for future research.
ii) Tissue culture banana has been adopted in the whole country and the project went
far as Tanzania. Uganda and Rwanda. Therefore it’s imperative that future
research could encompass data from these countries for comparison purposes.
iii) Research on banana diseases needs to be stepped up for further research in order
to increase the yields.
33
6.0 REFERENCESAndrea. S., Zephania. D., Fabio, M.. Patrizo. W., 2009. Socio F.conomic Impacts of non
transgenic biotechnologies in developing countries: ease of plant micro propagation in
Africa. FAO 2009.
Alston. J.M, Norton. G.W. & Pardey. P.G. 1995. Science under scarcity: principles and
practice for agricultural research evaluation and priority setting. Cornel University Press,
Ithaca, NY.
Ashley. Carney. 1999. Sustainable livelihoods: lessons from early experience. DFID.
London
Bagamba,F.,Sscnnyonga,J.W.,Katungi,F..,Ragana,P.,Katwijukwe,A.,Tushemercirwc,W.K
.& Gold 2001. Current Banana Production and productivity in Bumunanika Sub-County,
Central Uganda. Baseline Study. ICIE. Nairobi.
Beam Business Options Ltd 2001.Survey of Institutional Consumption of bananas in
Nairobi. ISAAA AfriCenter, Nairobi. Kenya.
Beam Business Options Ltd 2002. TC banana project micro credit Annual report for year
2002, ISAAA AfriCenter, Nairobi. Kenya.
CGIAR. 2006. Guidelines for preparing 2007-09 medium term plans and 2007 financial
plans. Washington, D.C.
Chambers, R. & Conway, G. 1991. Sustainable rural livelihoods: practical concepts for
the 21“ century, institute of Development studies (IDS), Discussion paper No 296.
CIMMYT economic program (1993): The adoption of agricultural technology: A guide
for survey design, Mexico, D.F, CIMMYT.
DFID. 2001. Sustainable Livelihood Guidance Sheets
Falck-Zepcda, J., Traxlcr, G. &NcIson, R.G.2000. Rent creation and distribution from
biotechnology innovations. The ease study of Bt cotton and herbicide-tolerant soybeans
in 1997. Agribusiness. February 2000, VoI.I6.issuel. p. 21-32.
34
Falck-Zcpcda, J., Cohen, J., Meinzcn-Dick, R &Komcn, J.2002. Biotechnology and
sustainable livelihoods, bindings and recommendations of an international consultation,
ISNAR, Briefing paper 54
FA0.2005. Annotated Bibliography on the Economic and Socio Economic Impact of
Biotechnology in Developing countries. Rome(Awrtfrrrm-
Gittingcr. F. 1982. Economic Analysis of Agricultural projc£AMThc John Hopkins
University Press: Baltimore, Maryland, USA.
Graff, E. 2000. The role of economic research in the Evolution of International
Agricultural Biotechnology
Graham, B., Peter, B., 2003. Global impact of biotech crops: socio economic
environmental elTccts in first 10 years of commercial use. Vol.9 number 3, article 2
Economics ltd., Dorchester, UK.
Hareau, G., Norton. G.W., Mills, B.F. Peterson, E.2005. Potential Benefits of Transgenic
Rice in Asia: A general equilibrium Analysis, Quarterly Journal of international
Agriculture, Vol.44. No.3, p.229-246.
Harsch, E. 2004. Farmers embrace African Miracle rice high yielding Ncrica varieties to
combat hunger and rural poverty, in: Africa recovery. Vol. 17, No.4. p.10-22.
Hossain,F..Pray, C.E..Lu.Y..Huang,J .Fan.C.&Hu.R. 2004. Genetically Modified cotton
and Fanners health in China, International Journal of occupational and Environmental
health, vol. 10. No. 3. p.296-303.
ISAAA 2000-2004. Diffusion of tissue culture banana biotechnology to small holder
farmers in Kenya. Annual report
Jayamangkala, N., Bait, P., 2009. International symposium on the social economic impact
of modem vegetable production technology in tropical Asia Chiang Mai Thailand.
Jcnnctt, C.. Affleck Hall, L., Hailey, D. 2003. Journal of Telemedicine and Telecare
35
KARl 2000. Biotec lino logy to benefit Small scale Banuna producers in Kenya-phasc II.
Project proposal submitted to International Development Research Center (IDRC) and
the Rockefeller Foundation.
Kamau and Beam Business options. 2000. Banana Market Survey in Nairobi City and its
Hnvirons, ISAAA AfriCcntcr. Nairobi. Kenya.
Karembu, M.. 2007: Banana policy. Nairobi. Kenya.
Kamrany, C., Nake, M., 1974. Technology: measuring the socio economic impact of
manufacturing automation. Cambridge. Massachusetts. USA.
Kung’u. C.2000. An Evaluation Report on the project "Biotechnology to Benefit Small-
scale Banana producers in Kenya" ISAAA AfriCcntcr, Nairobi. Kenya.
Krishna. V., Qaim, M., 2007. Potential impacts of BT egg plant on Economic surplus and
farmer’s health in India. University of Hohenheim, Stuttgart. Germany.
Kwach 2000.Performance of banana cultivars in South Western Kenya. Acta Hort.
(ISHS) 540: 239-246.
l.usty, C. ASmalc, M.2003.Eds. Assessing the social Economic Impact of Improved
banana varieties in Fast Africa, proceedings of an interdisciplinary research design
workshop jointly organized by IN1BAP and 1FPRI in Kampala, November 7-11, 2002.
Mbogo, S.2002. Economic Analysis of the production of Tissue culture bananas and
Assessment of their Market potential in Relation to Nairobi as a metropolitan market,
ISAAA AfriCcntcr Economics Research Report. Nairobi Kenya, April 2001.
Mbogo. S., Wambugu, F.M. & Wakhusama, S. 2003. Socio economic Impact of
biotechnology applications: some lessons from the pilot tissue culture banana production
promotion project in Kenya, 1997-2002. paper submitted at the XXV/IAAF. conference,
Durban. South Africa.
MOA, 2006. Annual agricultural report in Kenya.
36
Morooka, Y., 1982. Socio economic impact of technology transfer on a Philippine
Village; Same lessons from technical cooperation with Japan. FFTC hooks scries no. 31.
Moschini.G .I npan.H &Sobolevsky,A.200. Roundup Ready soybeans and welfare effects
in the soybean complex. Agribusiness, Vol.16, P.33-35.
Moschini.G..&Lapan.H.1997.Intcllcctual Property rights and the welfare effects on
Agricultural R&D. American Journal of Agricultural Economics,Vol. 79,No.4,p.l229-
1242.
Mugwagwa. J. 2004. Assessing the State of adoption. Development and Commercial
utilization of Micro propagation Technologies in Zimbabw e .FAO-SDRR, Rome.
Nyamori, 2003. Socio economic background of tissue culture banana production in
Nyanza
Ogunsumi, G., Omobolanc, L., Olu. S., 2005. Socio economic impact assessment of
Maize production technology on farmer's welfare in South West, Nigeria.
Pachico, D., Escobcr, Z., Rivas, L., Gottret, V. &Pcrcz, S. 2002. Income and employment
effects of transgenic herbicide resistant cassava in Colombia: a preliminary simulation, in
Evenson, R., Santanicllo, V., Zilberman, D. (Eds), Economic and Social issues in
agricultural biotechnology, CAB. Wallingford.
Pray C., Ma. I).. Huang. J. &Qiao, and F. 2001. Impact of Bt cotton in China. World
development, Vol.29, No.5, p.813-825.
Posada. B. C.. P. Knight., G. Fain. C. Coker. D. Veal, and R. Coker. 2004. Socio-
Economic Survey of Nursery Automation. Poster presented at the 49th Annual Southern
Nursery Association Research Conference and Trade Show. Atlanta. Georgia. August 11-
12. 2004.
Qaim, M. 1999. Assessing the Impact of Banana Biotechnology in Kenya, Assessing the
Impact of Banana Biotechnology in Kenya, ISAAA Briefs No. 10, ISAAA: Ithaca. New
York.
37
Qaim, M. 2000. Potential Impacts of Crop Biotechnology in Developing countries, Peter
Lang Vcrlag. Frankfurt.
Qaim.M.&de Jan\Ty,A. 2003. Genetically Modified Crops. Corporate pricing strategics,
and fanners adoption :The ease study of Bt Cotton in Argentina, American Journal of
agricultural Hconomics,Vol.85.No.4,p.814-828.
Qaim. M. &Zilberman, D.2003. Yield effects of genetically modified crops in developing
countries, science, February7,2003, vol.299, issue 5608, p.900-903.
Republic of Kenya. Ministry of Planning and National Development, Central Bureau of
Statistics. (ROK/CBS). 1997. Welfare Monitoring Survey in Kenya (WMS, 1997): Basic
reports (Nairobi, Central Bureau of Statistics, Kenya).
Ssennyonga. J.W.2005. Assessing the socio economic impact of micro propagated
technologies on farming households in Uganda.
Sonia. H., 2008. Socio economic impact of low cost carriers on the central F.astcm
European market. Poznan University of Economics, Poland.
Steinfield, C.. White. P.. 2003. Community level socio economic impact of electronic
commerce
Steffen, A. 2007. Report on the peer review of the paper "The Socio-economic impact of
plant micro propagation technologies in selected African Countries". FAO-SDRR. Rome
Uycn.N.V..Ho.T.V.,Tung.P.X.,Vander Zaag.P.&Walker.T.S.1996. Economic Impact of
the rapid multiplication of high yielding, late blight resistant varieties in Dalat,
Vietnam.In:T.S. Walker and C.C.Crissman (eds) Case studies of the economic impact of
C1P related tccluiologies. International potato center, Lima, Peru.
Wambugu, F.2001. The Benefits of Biotechnology for Small-Scale Banana Producers in
Kenya. ISAAA Briefs No.22: ISAAA: Ithaca. New York, USA
Wambugu. F. 2001. Modifying Africa: How biotechnology can benefit the poor and the
Hungry, A ease Study from Kenya, Nairobi. Kenya.
38

Wambugu, F.2004. Foo<i, Nutrition and Economic empowerment: the Case for scaling up
the Tissue Culture Banana project to the rest of Africa. Paper presented at the
NF.PAD/IGAD regional conference "Agricultural successes in greater hom of Africa"
held in Nairobi. Kenya, November 22-25. 2004.
Zinimcrmann. R &Qaim, M. 2004. Potential health benefits of Golden Rice: a Philippine
case study. Food policy 29, p. 147-168
39
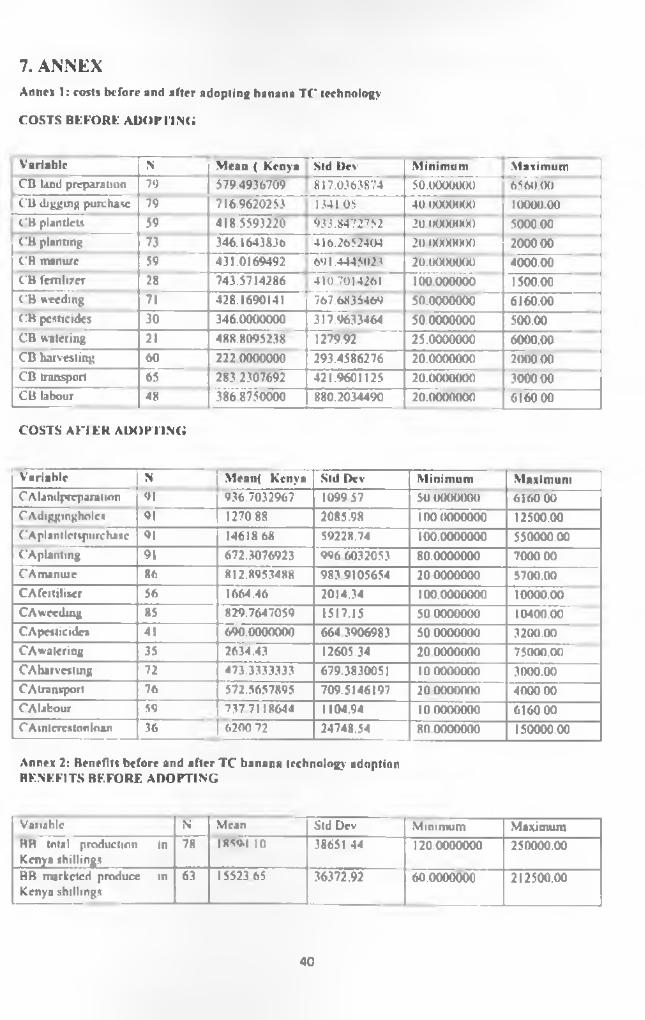
7. ANNEXAnnex 1: cost* before and after adopting banana T C technology
COSTS BEFORE ADOPTING
Variable N M ean ( Kenya Std Dev M inim um M aximumCB land preparation 79 579.4936709 817.0363874 50.0000000 f 6560.00
[ CBdiggingpurchasc 79 716.9620253 1341.05 40.0000000 10000.00CB plantlcts 59 418.5593220 933.8472752 20.0000000 500000CB planting 73 346.1643836 416.2652404 20.0000000 200000CB manure 59 431.0169492 691.4445023 20.0000000 4000.00CB fertilizer 28 743.5714286 410.7014261 100.000000 1500.00CB weeding 71 428.1690141 767.6835469 50,0000000 6160.00CB pesticides 30 346.0000000 317.9633464 50.0000000 500.00CB watering 21 488.8095238 1279.92 25.0000000 6000.00CB harvesting 60 2220000000 293.4586276 20.0000000 2000 00CB transport 65 283 2307692 421.9601125 20.0000000 3000 00CB labour 48 386 8750000 880.2034490 20.0000000 6160 00
COSTS AFTEK ADOPTING
V ariable N j M ean( Kenya Std Dev M inim um M aximumC Alandprcparation 91 936.7032967 1099 57 50 0000000 6160 00CAdiggingholcs 91 1270 88 2085.98 100 <1000000 12500.00CA plant Ictspurchase 91 1461868 59228.74 100.0000000 550000.00CAplanting 91 672.3076923 996 6032053 80.0000000 7000 00CAmanutc 86 812.8953488 983 9105654 20 0000000 5700.00CAfeitiliset 56 1664.46 2014.34 100.0000000 10000.00CA weeding 85 829.7647059 1517.15 50 0000000 10400.00CApcsticide* 41 690.0000000 664 3906983 50 0000000 3200.00CAwalering 35 2634.43 12605.34 20 0000000 75000.00CA harvesting 72 473.3333333 679.3830051 10 ooooooo 3000.00CAtranxport 76 572.5657895 709.5146197 200000000 4000 00CA labour 59 737 7118644 1104.94 10 0000000 6160 00OAmlcrcstonloan 36 6200 72 24748.54 80 0000000 150000.00
Annex 2: Benefits before and a fte r T C banana technology adoption BENEFITS BEFORE ADOPTING
Variable N Mean Std Dev Minimum MaximumHH total production In Kenya shillings
78 i s s a t io 386S1 44 120.0000000 250000.00
BB marketed produce in Kenya shillings
63 15523.65 36372.92 60.0000000 212500.00
40
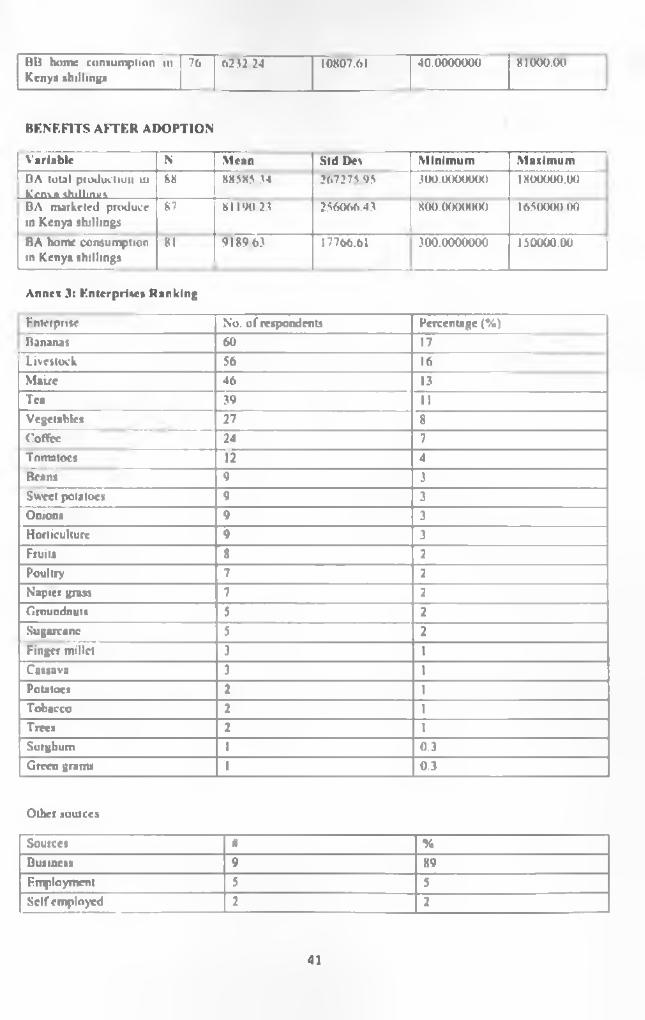
BB home consumption in 76 6232.24 10807.61 40.0000000 81000.00Kenya shillings
BENEFITS A FTER ADOPTION
Variable N M ean Std Dev M inimum M aximumBA total production in Kenya shillings________
88 885X5.34 267275.95 300.0000000 1800000.00
BA marketed produce in Kenya shillings
87 81190.23 256066.43 800.(KXXHKK) 165000000
BA home consumption in Kenya shillings
81 9189.63
______________
17766.61 300.0000000 150000.00
Annex 3: Enterprise* B anking
Enterprise No. o f respondents Percentage (%)Bananas 60 17Livestock 56 16
Maize 46 13Tea 39 11
Vegetables 27 8
CotTcc 24 7Tomatoes 12 4Beans 9 3Sweet potatoes 9 3Onions 9 3Horticulture 9 3Fruits 8 2
Poultry 7 2
Napier grass 7 2
Groundnuts 5 2
Sugarcane 5 2
Finger millet 3 1
Cassava 3 1
Potatoes 2 1
Tobacco 2 1
Tree* 2 1
Sorghum l 0.3Green grams 1 0.3
Other sources
Sources 0 %Business 9 X9Employment 5 5Self employed 2 2
41
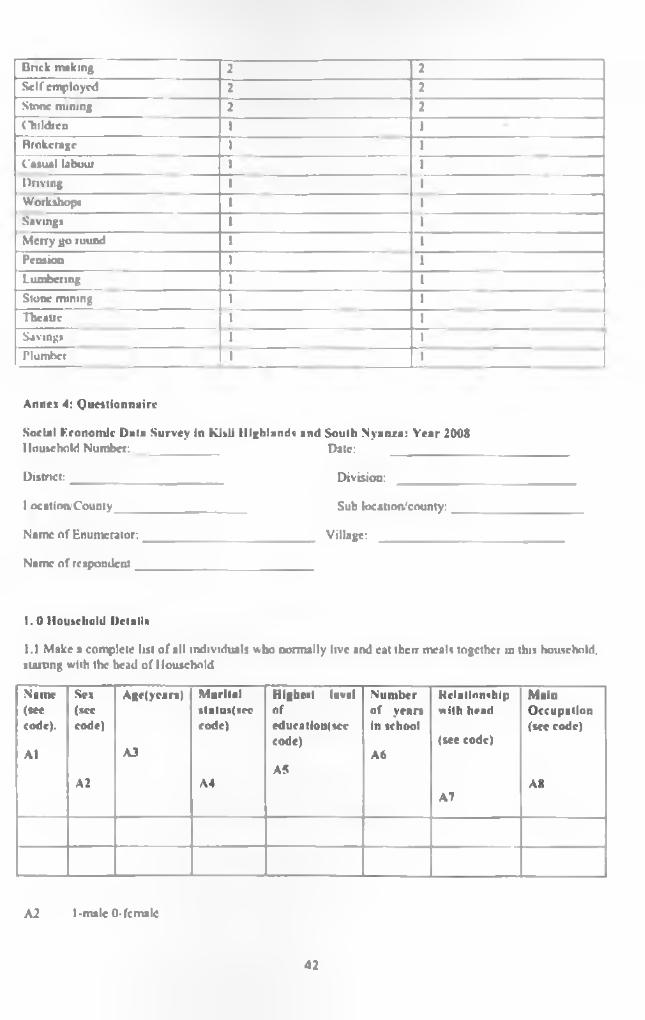
Bnck nuking 2 2
Self employed 2 2
Stone mining 2 2
Children 1 1
Brokerage 1 1
Casual labour 1 1
Driving 1 1
Workshops 1 1
Savings 1 1
Merry go round 1 1
Pension 1 1
Lumbering 1 1
Stone mining 1 1
Theatre 1 1
Savings 1
Plumber 1 1
Annex 4: Q uestionnaire
Social Economic D ata Survey In Kisll Highlands and South .Nyanza: Y ear 2008Household N um ber:______________ Date: _____________
D istrict:___ _________ Division: ________
l ocation County_____________________ Sub loeatinn/enunty:__________________
Name of Enum erator:_________ Village: ______________
Name of respondent______________________________
1 .0 Household Details
1.1 Make a complete list o f all individuals who normally live and eat their meals together in this household, starting with the head o f 1 louschold
Nome(seecode).
A t
Sex(seecode)
A2
Age(ycarx)
A3
M aritalstatus(«cccode)
A4
Highest level ofed uca tion see code)
A5
N um ber of y e a n in school
A6
Relationship with head
(see code)
A7
M ainO ccupation (sec code)
A8
A2 1-male 0-female
42
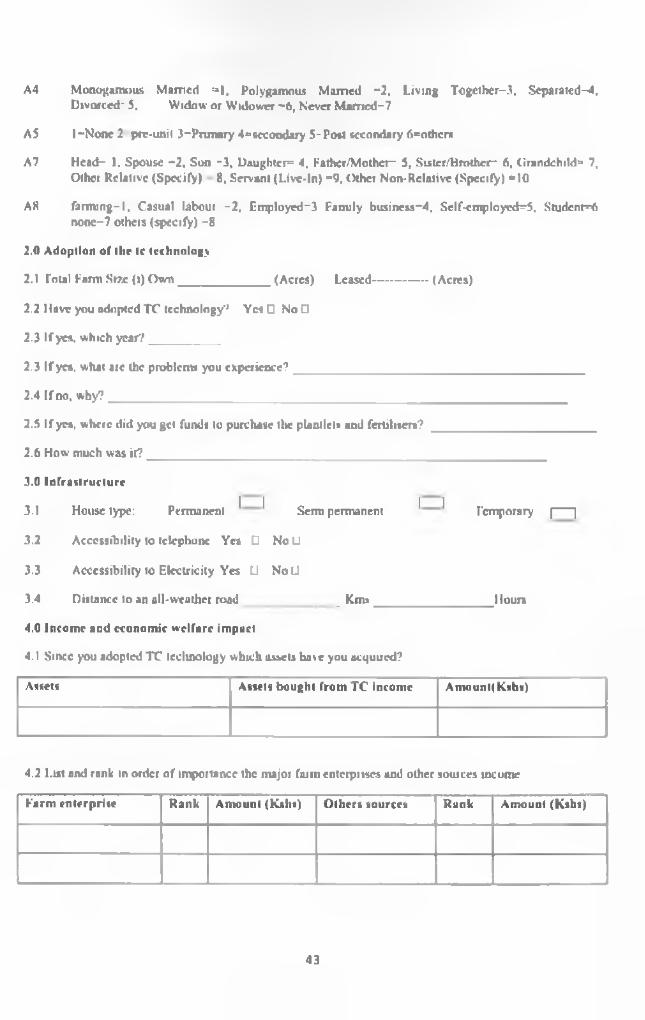
A4 Monogamous M am ed =*|, Polygamous M amed -2 , Living Together-?, Separated-4. Divorced- 3, Widow or Widower - 6 , Never M am ed -7
A5 1 -N one 2 I»re-unil 3 -P ru m ry 4 ° secondary 5 -Post secondary 6 =othcn»
A7 H ead- 1. Spouse - 2 . Son -3 , Daughter^ 4, Father/Mother- 5, Sistcr/Brothcr- 6 , Grandchild^ 7, Other Relative (Specify) 8 . Servant (Live-In) -9 . Other Non-Relative (Specify) -1 0
A8 farm ing-1. Casual labour -2 . Employed-3 Family business-4, Self-em ployed^, S tu d e n ts none-7 others (specrlV) - 8
2.0 Adoption of the le technology
2 .1 fo u l Farm Size (t) O w n _______________ (Acres) Leased--------------- (Acres)
2.2 I love you adopted TC technology1' Yes □ No 0
2.3 If yes, which year?____________
2.3 If yes, what arc the problems you e x p e r i e n c e ? __________________________________________
2.4 If no, why? _______________________
2.5 If yes, where did you gel fund* to purchase the plantlet* and fertilisers? ___________________________
2.6 How much was i t? __________ _________________________________________
3.0 In frastructu re
3.1 House type: Permanent ' ̂ Semipermanent ' ̂ Temporary |----- 1
3.2 Accessibility to telephone Yes U NoLI
3.3 Accessibility to Electricity Yes U N o Ll
3.4 Distance to an all-weather road ____________ Km* __________________ Hours
4.0 Income and economic w elfare impact
4.1 Since you adopted TC tcclmology which asset* have you acquired?
Assets Assets bought from TC income Am ount(Kshs)
4.2 Tut and rank in order of importance the major farm enterprises and other sources income
Farm enterprise Rank Amount (Kalis) O thers sources R ank Amount (Kshs)
43
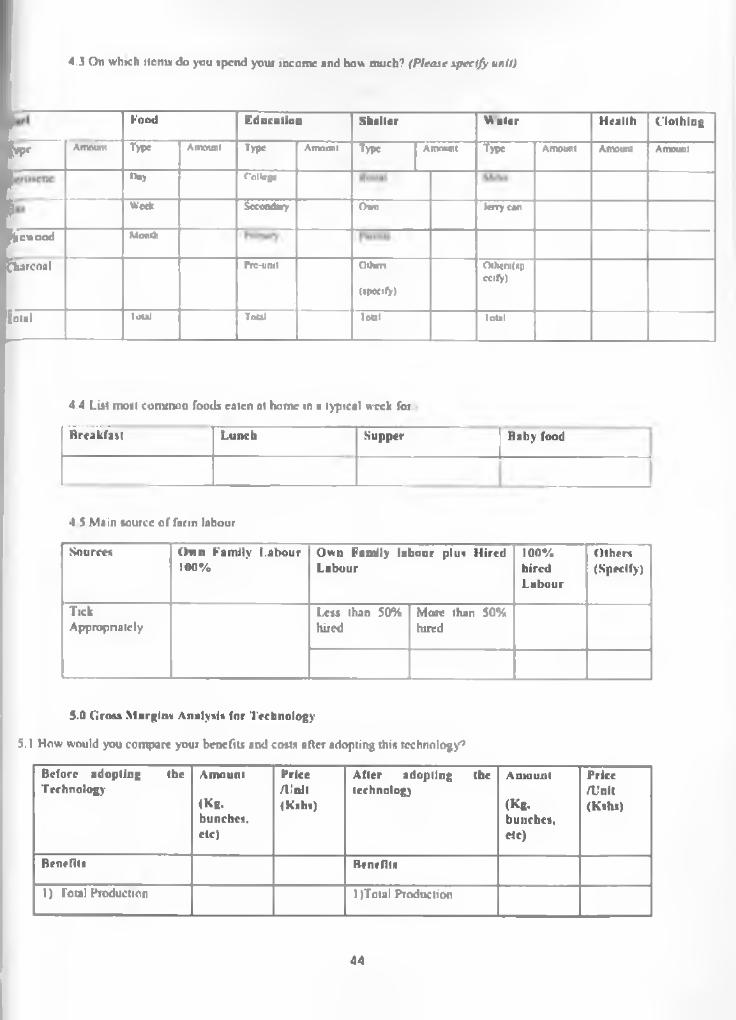
4.3 On which items do you upend your income and how much? (Please specify uni I)
TVP‘- Amount
Food
Type Amount
Education
Type Amount
Shelter
TyS- Amount
W ater
Type Amount
Health
Amount
Clothing
Amount
n»y College
SecondaryWeds Own terry can
uc wood
Ttarcoal
Month
t*fC-unit Others
opeeityy
Othcrsfspcctryy
oral total Tout lout total
4.4 List most conunun foods ealen at home in a typical week for
Breakfast Lunch Supper Baby food
4 5 Main source o f farm labour
Sources O w n Family Labour 100%
Own Family labour plus Hired Labour
100%hiredLabour
O thers(Specify)
TickAppropriately
Less than 50% hired
More than 50% hired
S.O G rout M argins Analysis for Technology
5.1 How would you compare your benefits and costs after adopting this technology?
Before adopting the Technology
Amount
(Kg.bunches.etc)
Price A;'nit (Kshs)
After adopting the technology
Amount
(Kg.bunches.Me)
Price/Unit(Kshs)
Benefits Benefits
1) Total Production l)Tntal Production
44
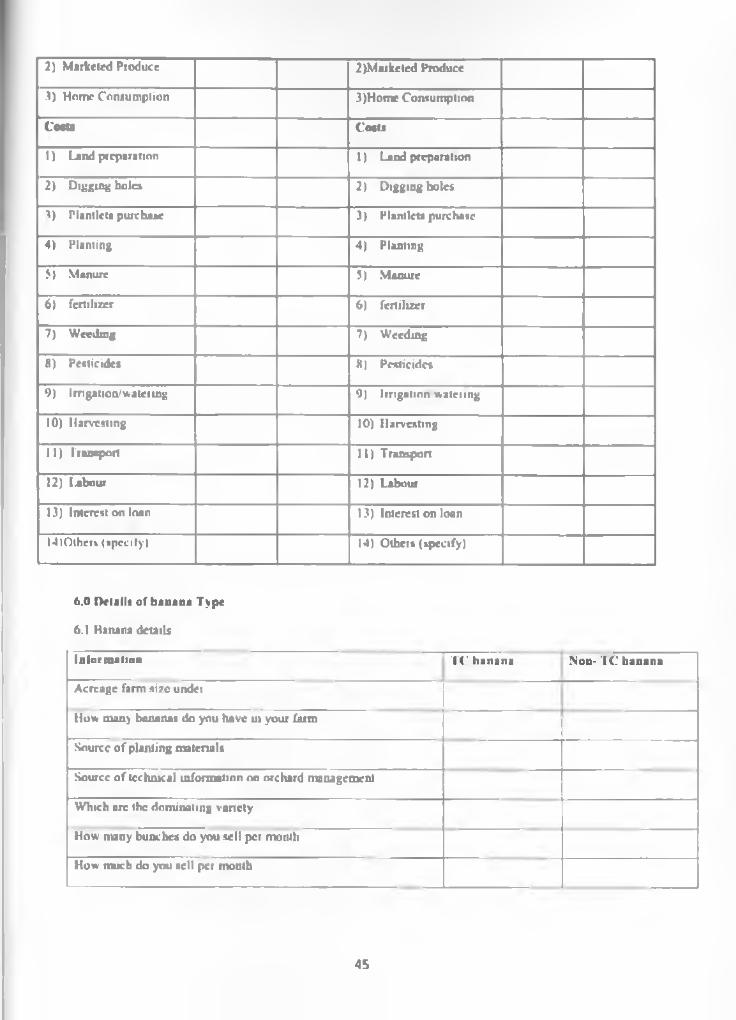
2) Marketed Produce 2)Maikcted Produce
3) Home Consumption 3)Home Consumption
C o m Costs
1) Land preparation 1) Land preparation
2) Digging holes 2) Digging holes
3) Plantlcts purchase 3) Plantlcts purchase
4) Planting 4) Planting
5) Manure 3) Manure
6 ) fertilizer 6 ) fertilizer
7) Weeding 7) Weeding
8 ) Pesticides 8 ) Pesticides
9) Imgation'wateiing 9) Irrigation watciing
10) Harvesting 10) Harvesting
11) Transport 11) Transport
12) labour 12) Labour
13) Interest on loan 13) Interest on loan
M lO thm (specify) 14) Othcis (specify)
6.0 Details of banana Type
6.1 Banana details
Inform ation TC banana Non- T C banana
Acreage farm size undei
How n u n ) bananas do you have ui your form ■
Source o f planting materials
Source o f technical information on orchard management
Which arc the dominating variety
How many bunches do you sell per month
How much do you sell per month
45
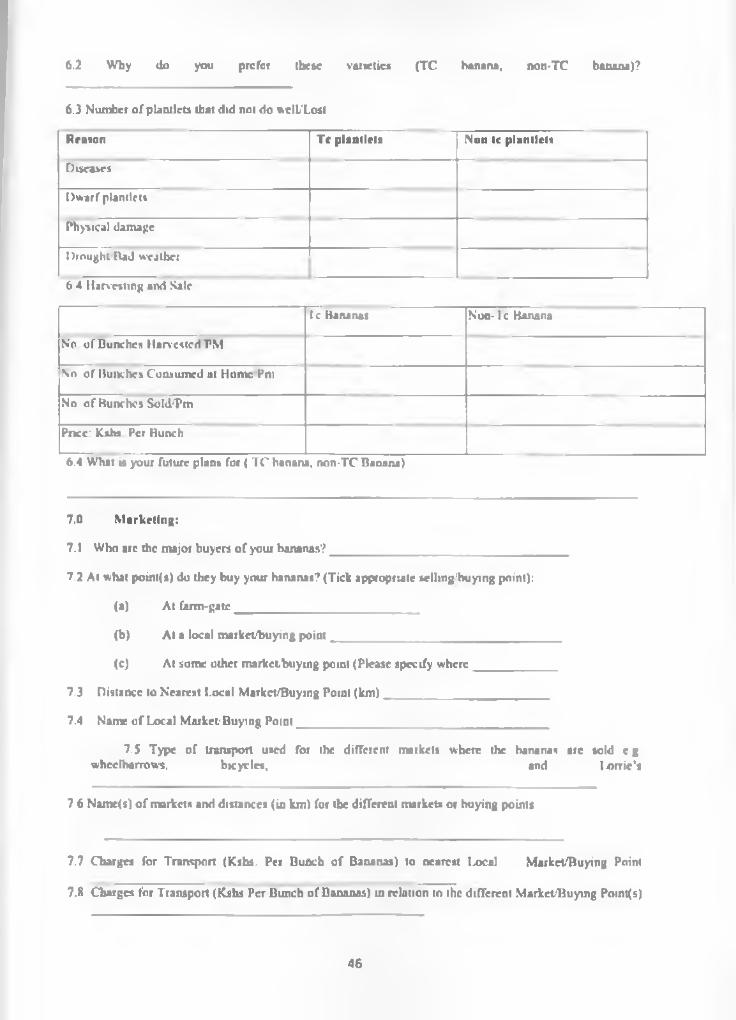
6.2 Why «lo you prefer these varieties (TC banana, non-TC banana)?
6.3 Number of plantlcts that did not do welt'Lost
Reason Tc p lan tlrls Non tc plantlcts
Diseases
Dwarf plantlcts
Physical damage
Droughi'Dad weather
6.4 Harvesting and Sale
Tc Bananas Non- 1c Banana
No. of Bunches HarvestedPM
No. of Bunches Consumed at Hom ePm
No o f Bunches Sold'Pm
Knee: Kshs. Per Bunch
6.4 What is your future plant for ( TC banana, non-TC Banana)
7.0 M arketing:
7 .1 Who arc the major buyers o f your bananas?________________
7.2 At what point(s) do they buy your bananas? (Tick appropriate telling'buying point):
(a) At farm -gate____________
(b) At a local m arketbuying p o in t______________________________________
(c) At some other m arketbuying point (Please specify w here______________
7.3 Distance to Nearest Local Market/Buying Point (km)
7.4 Name o f Local M arket'Buying Point_____
7.5 Type o f transport used for the different markets where the hananas arc told e g whcclharrows. bicycles, and I-orric’s
7 6 Name(s) o f markets and distances (in km) for the different markets or buying points
7.7 Charges for Transport (Ksht. Per Bunch o f Bananas) to nearest !-ocal Market/Buying Point
7.8 Charges for Transport (Kshs Per Bunch o f Bananas) in relation to the different Market/Buying Points)
46
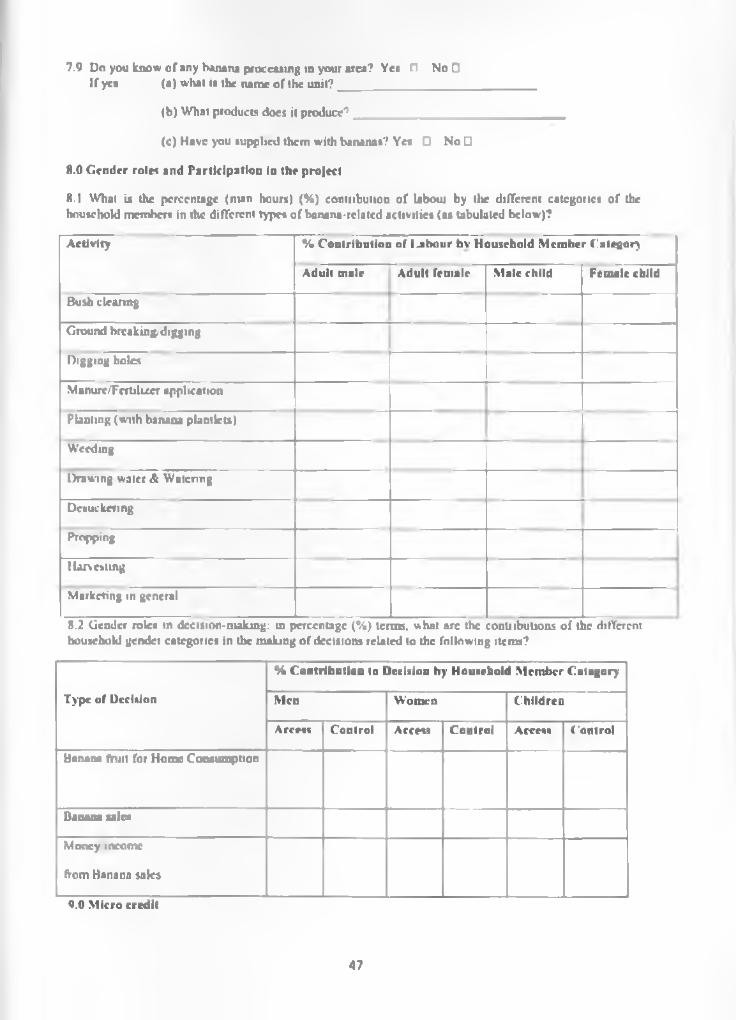
7.9 Do you know o f any banana processing in your area? Yes n No 0 If yea (a) what ii the name of the un it?___ __________________
(b) What products does it produce’’
(c) Have you supplied them with bananas? Ye* □ N o U
8.0 G ender roles and Participation in the project
8.1 What is the percentage (ntan hours) {% ) contribution of (about by the different categories o f the household members in the different types of banana-related activities (as tabulated below)?
Activity % C ontribution of la b o u r hv Household M em ber Category
Adult male Adult female M ale child Female child
Bush clearing
Ground breaking digging
Digging holes
Manurc/Fertilizer application“
Planting (with banana plantlets)
Weeding
Drawing water & Watering
Dcsuckcring
Propping
Harvesting
Marketing in general
8.2 Gender roles in decision-making: in percentage (%) terms, what arc the contributions o f t le differenthousehold gender categories in the making of decisions related to the following items?
% C ontribu tion to Decision by Household M em ber Category
Type of Decision Men W omen C hildren
Areess C ontrol Access C ontrol Access C ontrol
Banana font for Home Consumption
Banana sales
Money income
horn Banana tales
9.0 M icro credit
47
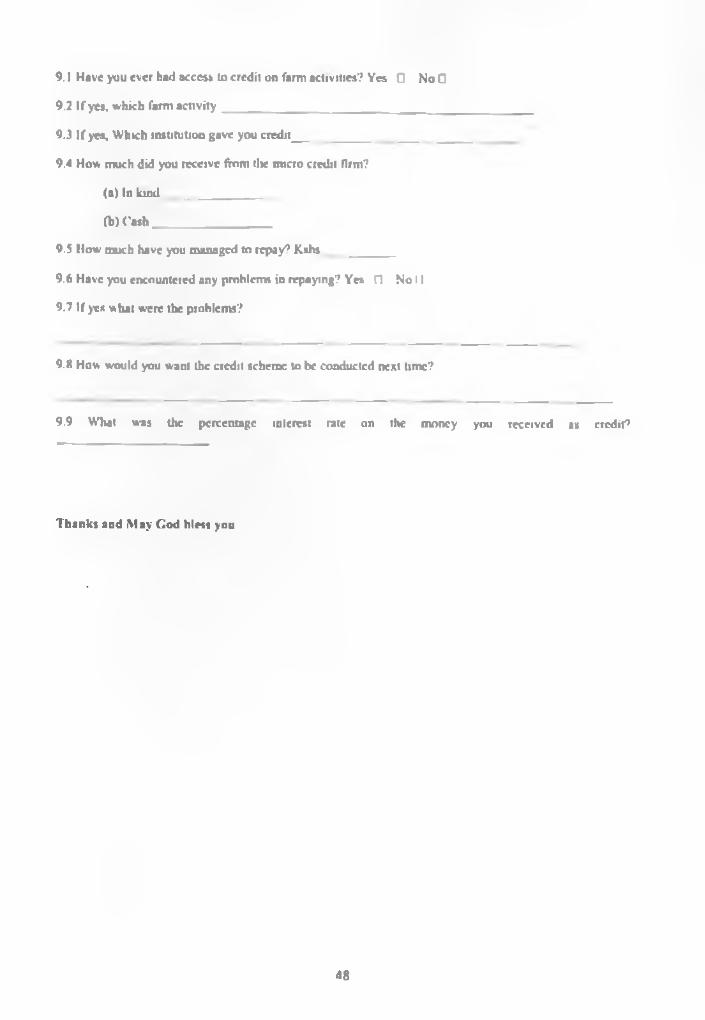
9 .1 Have you ever hail bcccm. to credit on farm activities? Yes 0 No 0
9.2 If yea. which farm activity _______________ _____________________
9.3 If yes. Which institution gave you credit_____________ ________ __
9.4 How much did you receive from tlse micro credit firm?
(a) In la n d __________________
(b) ( 'a s h ____________________
9.5 How much have you managed to repay? Kshs __
9.6 Have you encountcied any problems in repaying? Yea n No 11
9.7 If yes what were the problems?
9.H How would you want the credit scheme to be conducted next time?
9.9 What was the percentage interest rate on the money you received ax
Thanks and M ay C od bless you
credit7
48