Embed Size (px)
DESCRIPTION
Early Intervention Graduates Go to Kindergarten: Findings from the National Early Intervention Longitudinal Study (NEILS). Kathleen Hebbeler Donna Spiker SRI International Presented at OSEP Early Childhood Conference Washington, DC December 2005. Questions to be Addressed Today. - PowerPoint PPT Presentation
Citation preview
1
Early Intervention Graduates Go to Kindergarten:
Findings from the National Early Intervention Longitudinal
Study (NEILS)
Kathleen Hebbeler Donna SpikerSRI International
Presented at OSEP Early Childhood ConferenceWashington, DC December 2005
2
Questions to be Addressed Today
• What are the child and family outcomes for former recipients of early intervention when the child enters kindergarten?
• What are the child’s experiences in kindergarten and what services are being received?
3
National Early Intervention Longitudinal Study (NEILS)
• Conducted by SRI International Frank Porter Graham Child
Development Institute Research Triangle Institute American Institutes for Research
• 10-year study funded by OSEP in 1995
4
Study Design
• Longitudinal. NEILS followed children and families from the time they enter early intervention through kindergarten.
• Families were recruited when they enrolled in early intervention for the first time.
• Families were recruited from September 1997 to November 1998.
5
NEILS Findings Presented Today
• Today’s findings based on telephone interviews with family member conducted when:
Child began early intervention (N=3200; 96%)
Child was 36 to 40 months of age (N=2584; 77%)
Child was entering kindergarten (N=2298; 69%).
• Asked a series of questions about child’s behavior, health, and development.
• Last round of family kindergarten interviews was completed in December 2004.
• Data are weighted to represent the nation.
6
Who are the Infants and Toddlers Entering Early
Intervention?
7
Key Findings
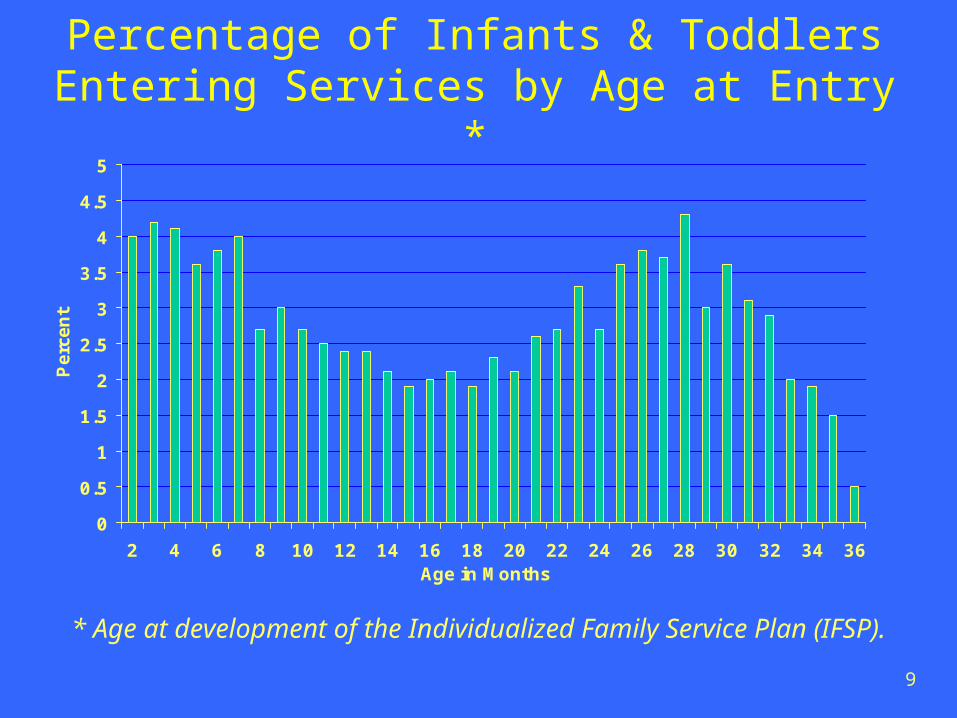
Children are more likely to begin services before 8 months and after 18 months than in the time in between.
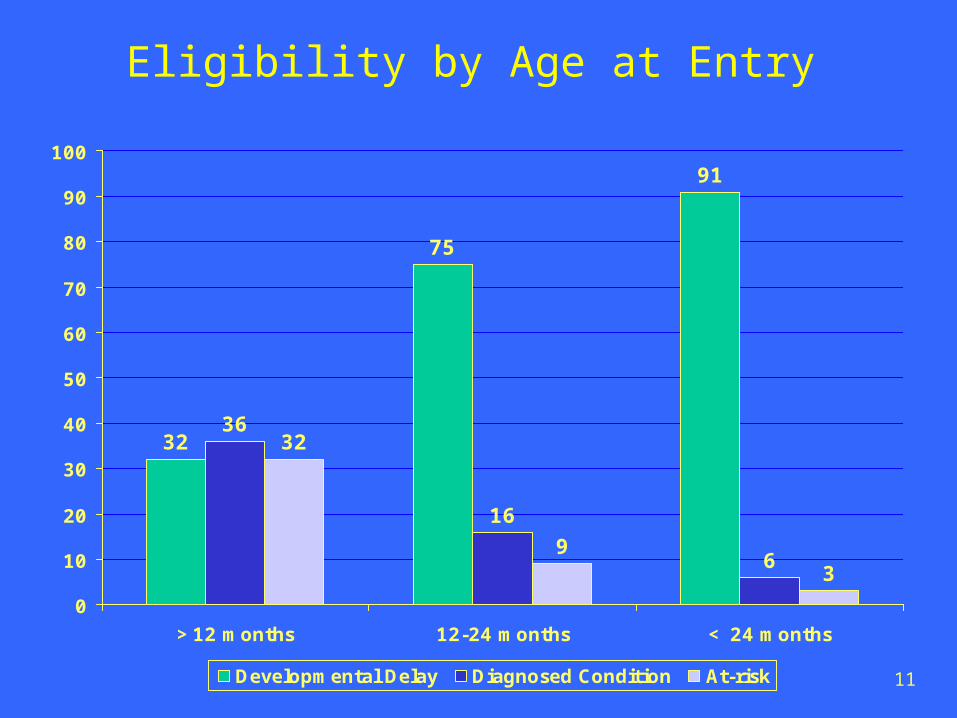
When children begin early intervention is strongly related to the reason why they are eligible for services.
There is no typical child in early intervention.
8
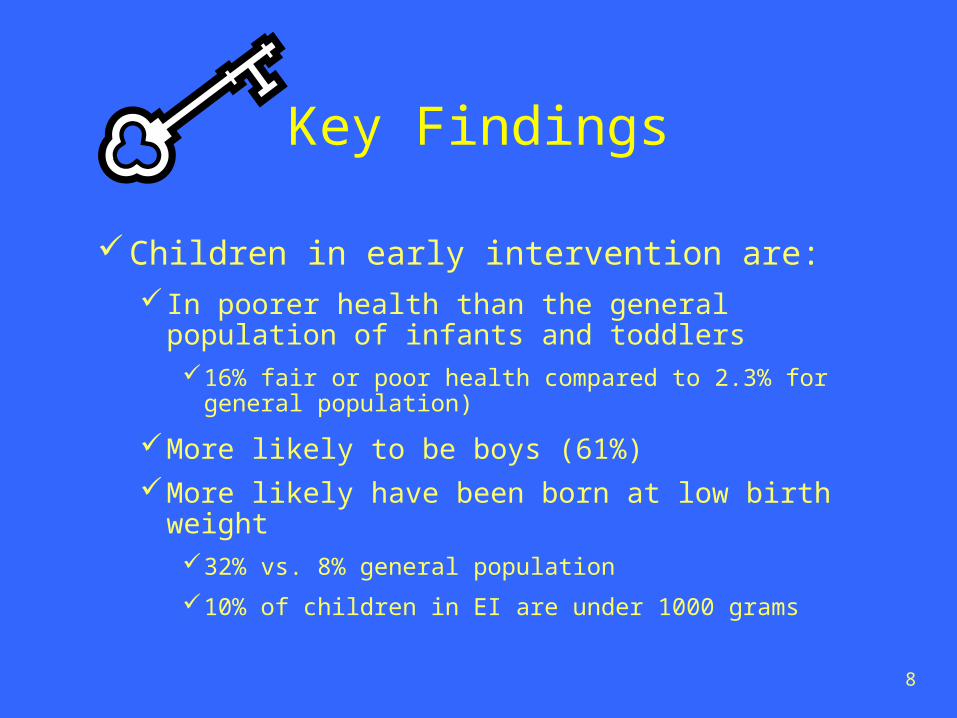
Key Findings
Children in early intervention are: In poorer health than the general population
of infants and toddlers16% fair or poor health compared to 2.3% for
general population)
More likely to be boys (61%)More likely have been born at low birth
weight
32% vs. 8% general population
10% of children in EI are under 1000 grams
9
Percentage of Infants & Toddlers Entering Services by Age at Entry *
0
0.5
1
1.5
2
2.5
3
3.5
4
4.5
5
2 4 6 8 10 12 14 16 18 20 22 24 26 28 30 32 34 36Age in Months
Per
cent
* Age at development of the Individualized Family Service Plan (IFSP).
10
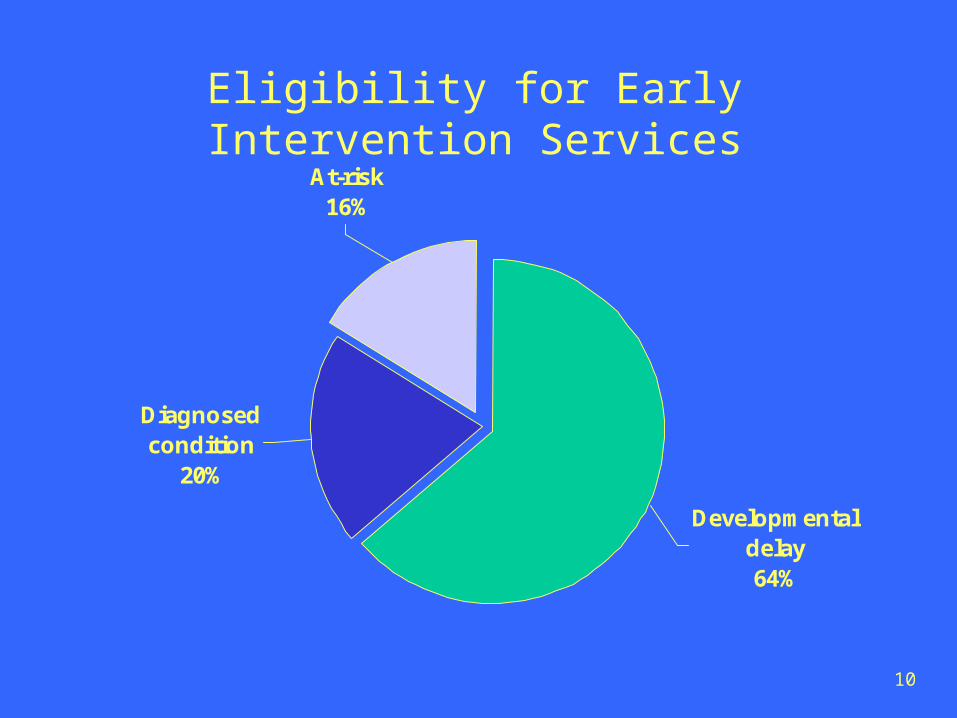
Eligibility for Early Intervention Services
Diagnosedcondition
20%
Developmental delay64%
At-risk16%
11
Eligibility by Age at Entry
32
75
91
36
16
6
32
93
0
10
20
30
40
50
60
70
80
90
100
>12 months 12-24 months < 24 months
Developmental Delay Diagnosed Condition At-risk
12
Child Outcomes at Kindergarten
13
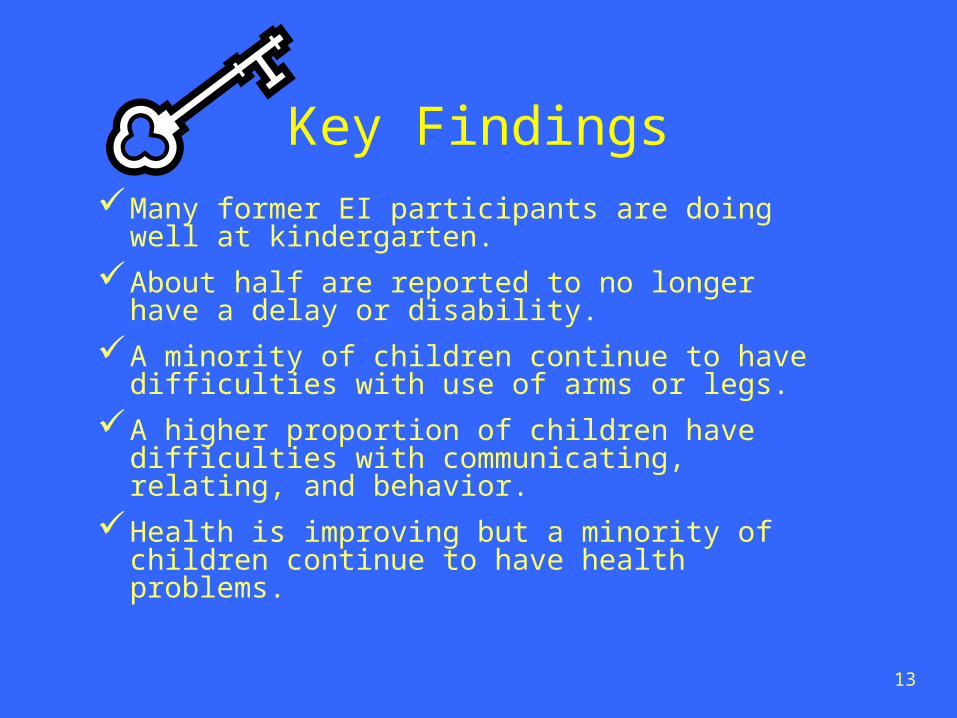
Key FindingsMany former EI participants are doing well
at kindergarten.
About half are reported to no longer have a delay or disability.
A minority of children continue to have difficulties with use of arms or legs.
A higher proportion of children have difficulties with communicating, relating, and behavior.
Health is improving but a minority of children continue to have health problems.
14
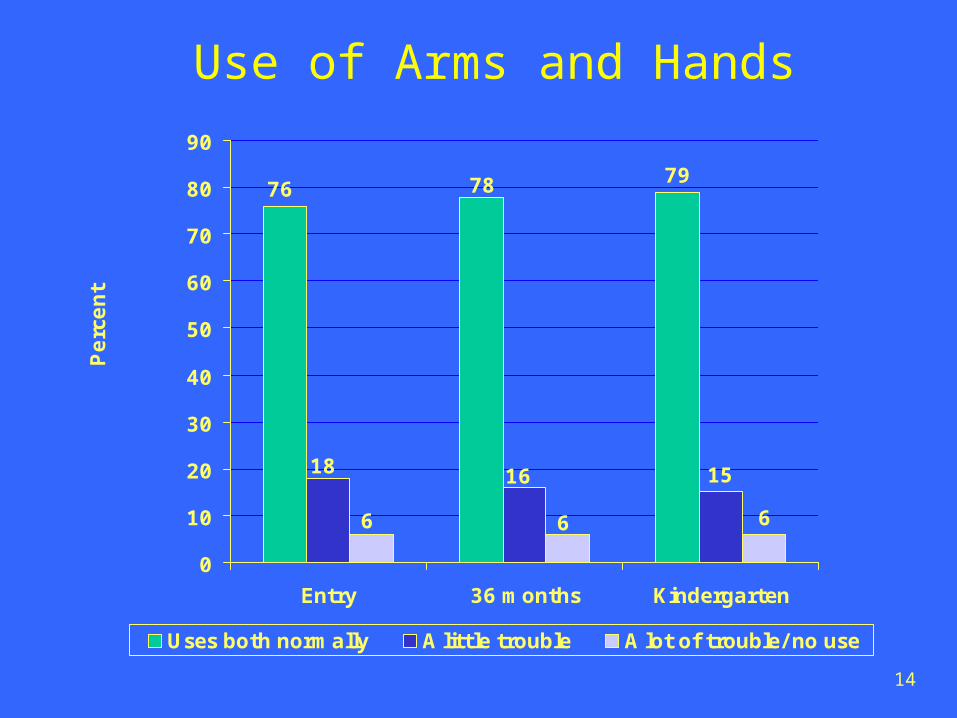
Use of Arms and Hands
79
15
6
76 78
18 16
6 6
0
10
20
30
40
50
60
70
80
90
Entry 36 months Kindergarten
Perc
ent
Uses both normally A little trouble A lot of trouble/ no use
15
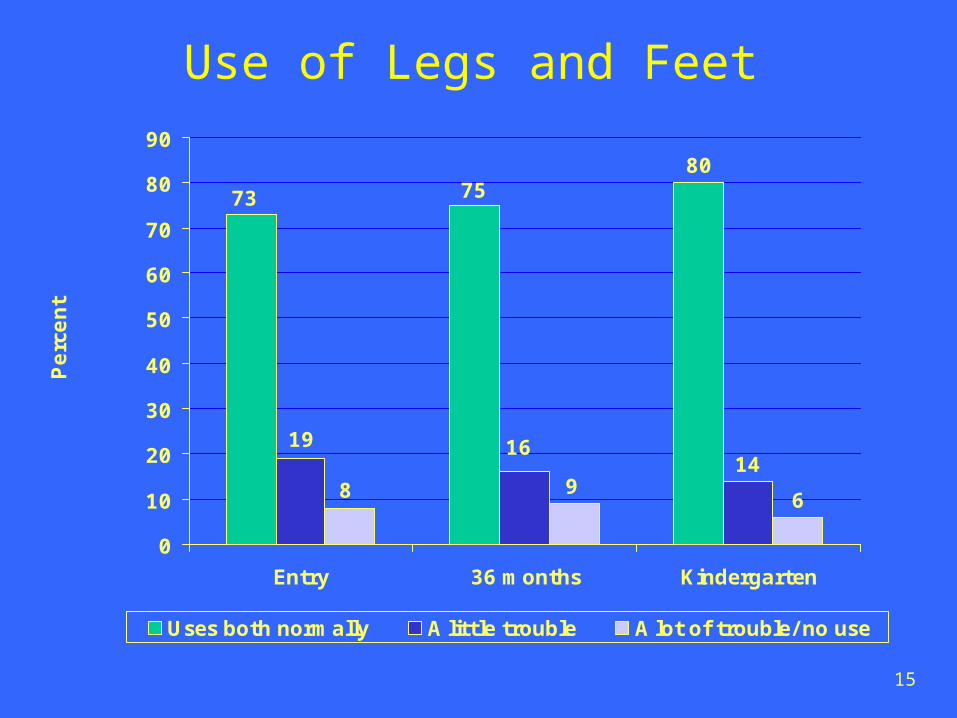
Use of Legs and Feet
80
14
6
7573
1619
98
0
10
20
30
40
50
60
70
80
90
Entry 36 months Kindergarten
Perc
ent
Uses both normally A little trouble A lot of trouble/ no use
16
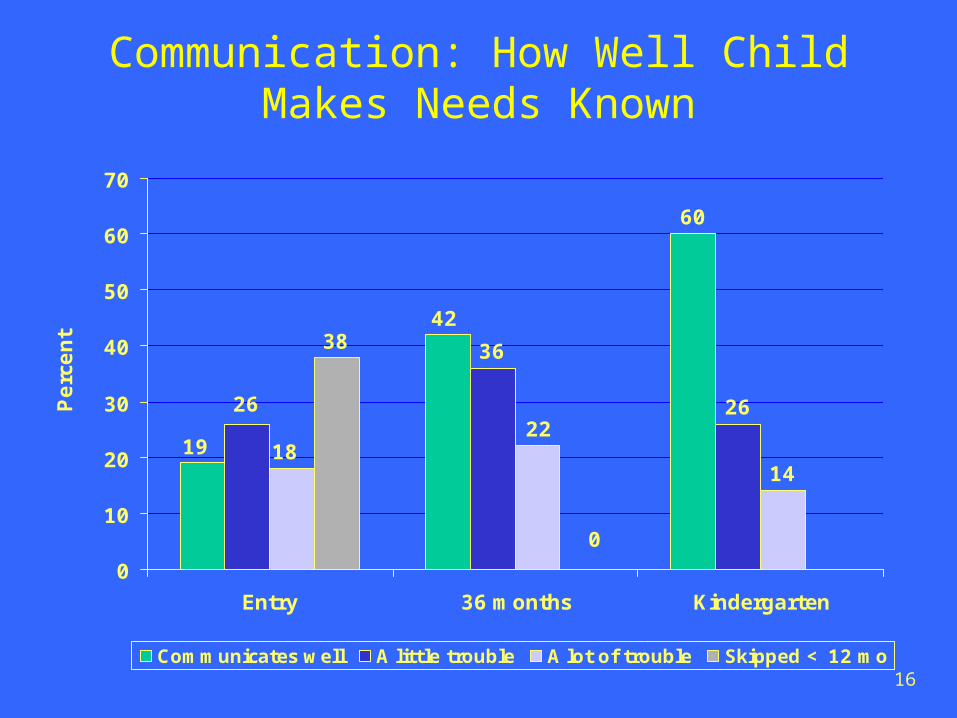
Communication: How Well Child Makes Needs Known
60
26
14
42
19
36
2622
18
0
38
0
10
20
30
40
50
60
70
Entry 36 months Kindergarten
Perc
ent
Communicates well A little trouble A lot of trouble Skipped < 12 mo
17
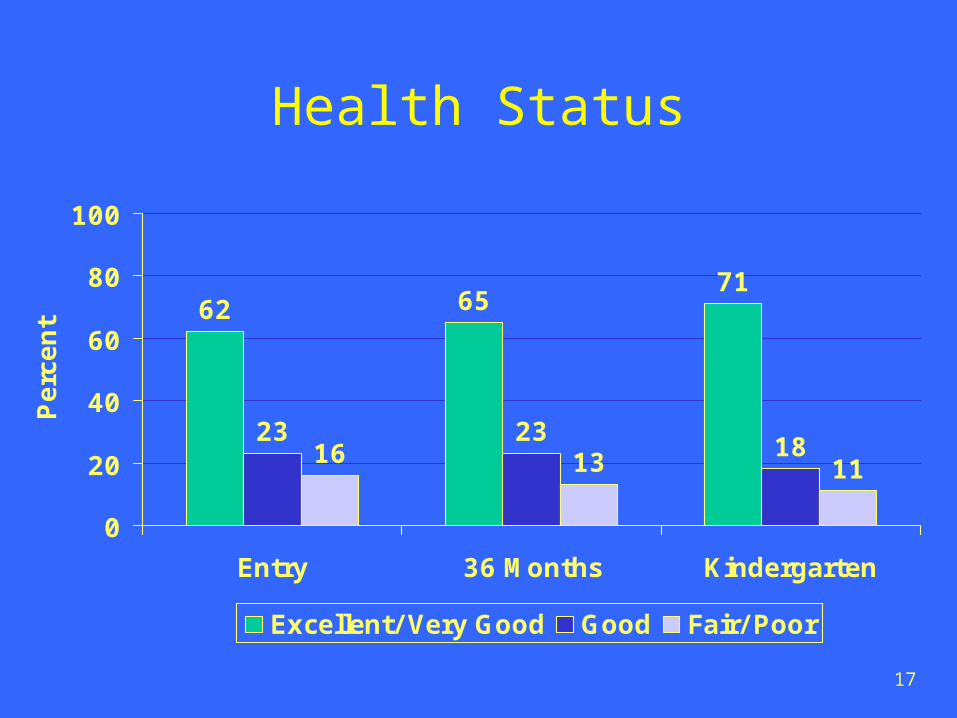
Health Status
11
716562
182323
1316
0
20
40
60
80
100
Entry 36 Months Kindergarten
Perc
ent
Excellent/ Very Good Good Fair/ Poor
18
Health (Continued)
• Activities limited by health problem – 17%
• Currently taking medication for a condition or problem – 32% Taking medication for
behavior/mood/activity/attention – 22%
• Use any kind of medical device – 12%
19
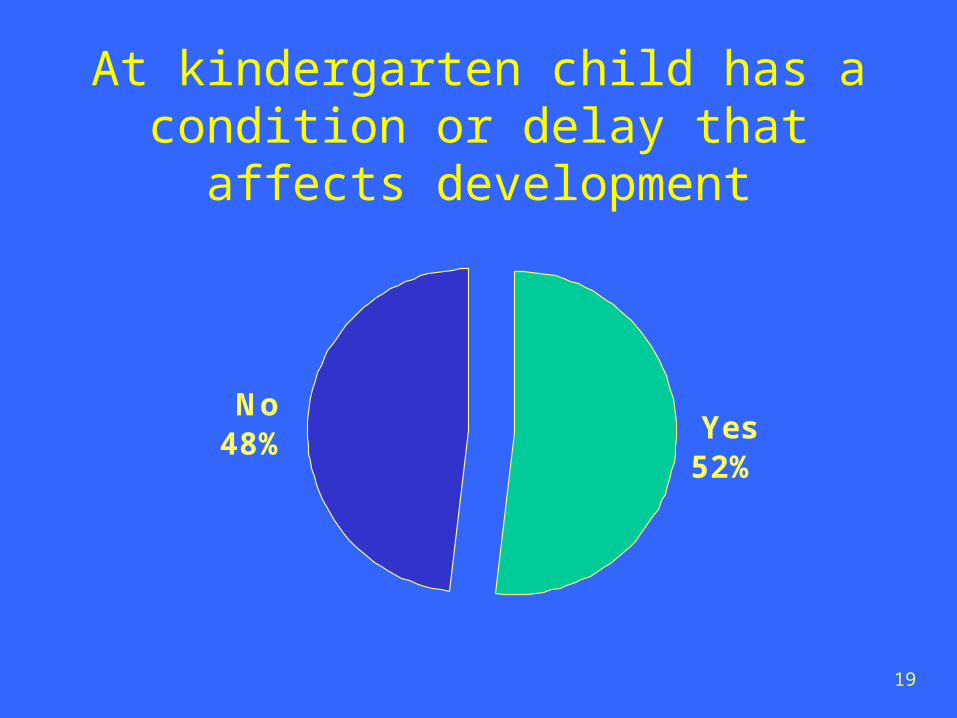
At kindergarten child has a condition or delay that affects
development
Yes52%
No48%

20
Age at IFSP by Has Delay or Disability at
Kindergarten 57
48 5043
52 50
0
10
20
30
40
50
60
Birth < 12 months 12 < 24 months 24 to < 31 months
% o
f ch
ildre
n
Has condition No condition
21
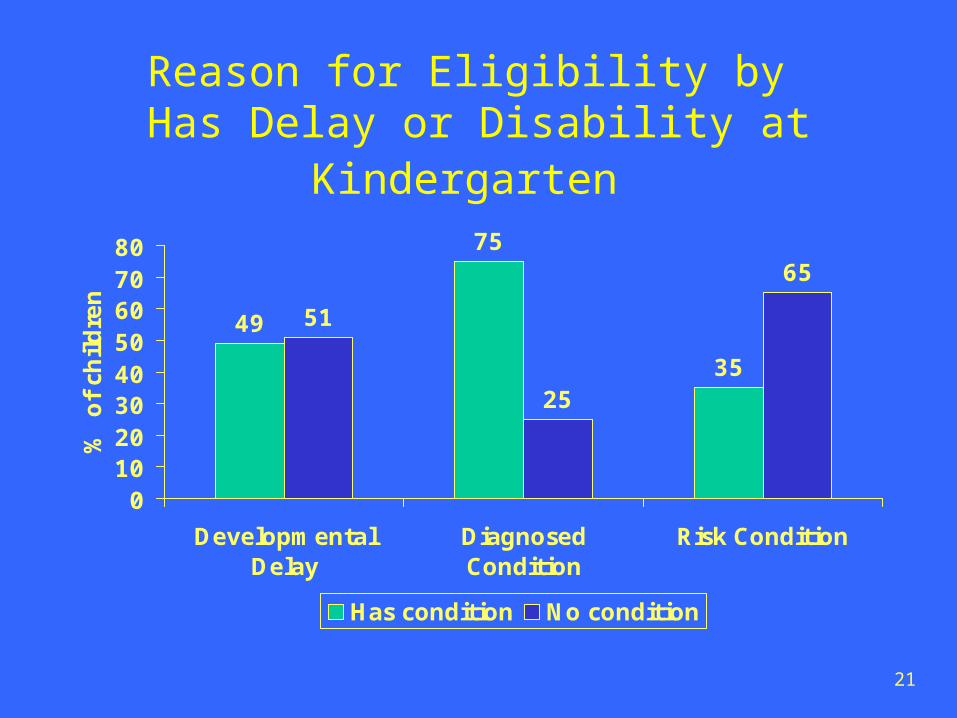
Reason for Eligibility by Has Delay or Disability at
Kindergarten
49
75
35
51
25
65
01020304050607080
DevelopmentalDelay
DiagnosedCondition
Risk Condition
% o
f ch
ildre
n
Has condition No condition
22
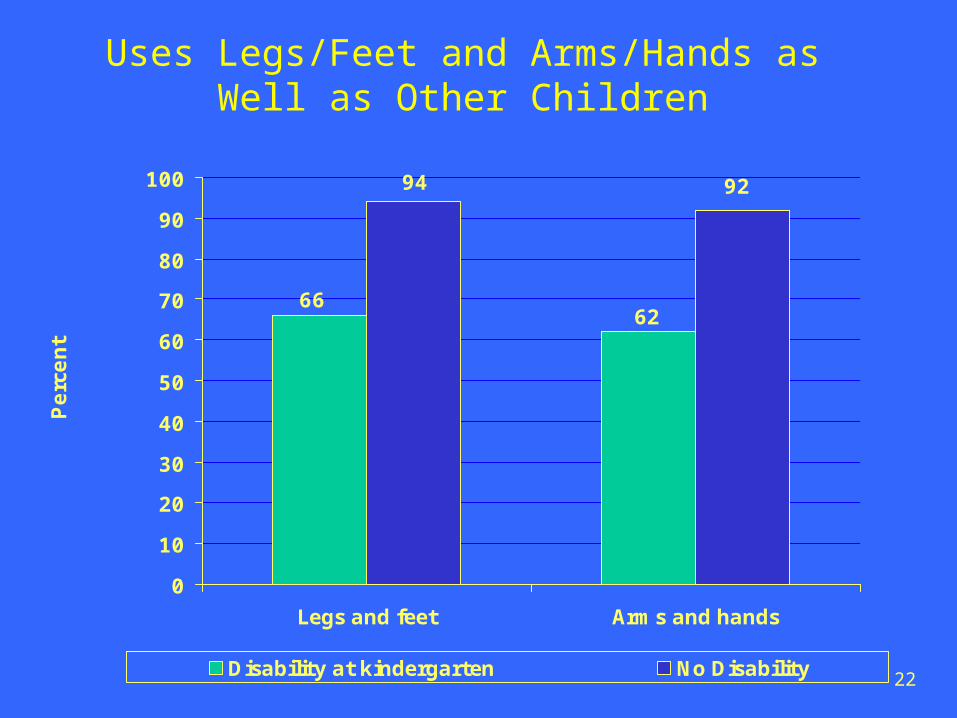
Uses Legs/Feet and Arms/Hands as Well as Other Children
6266
9294
0
10
20
30
40
50
60
70
80
90
100
Legs and feet Arms and hands
Perc
ent
Disability at kindergarten No Disability
23
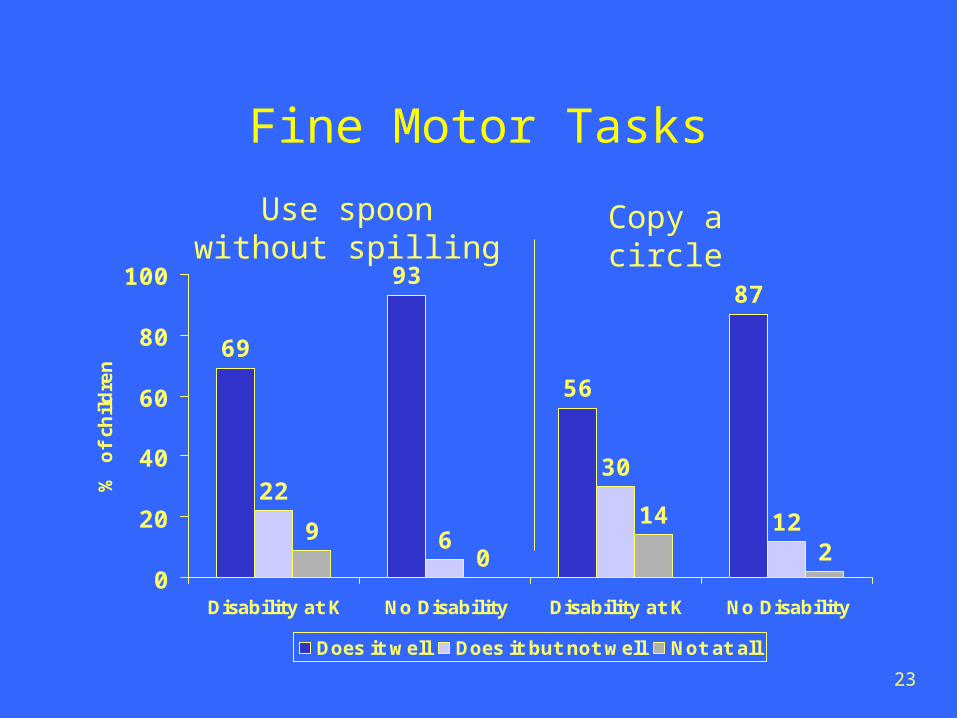
Fine Motor Tasks
69
93
56
87
22
6
30
1290
14
20
20
40
60
80
100
Disability at K No Disability Disability at K No Disability
% o
f ch
ildre
n
Does it well Does it but not well Not at all
Use spoon without spilling
Copy a circle
24
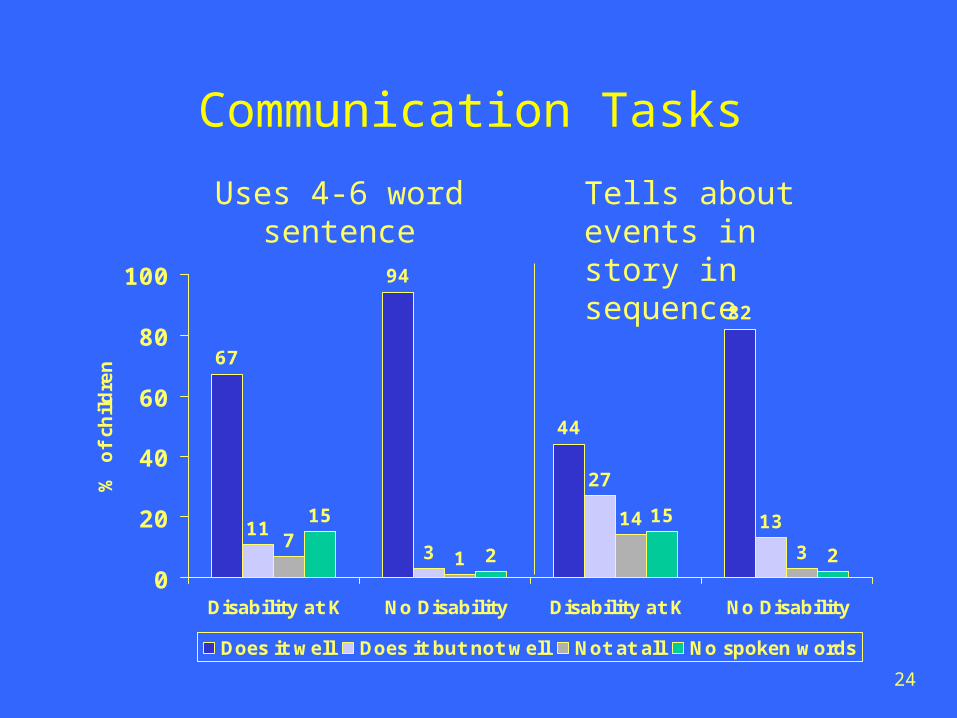
Communication Tasks
67
94
44
82
113
27
137
1
14
3
15
2
15
20
20
40
60
80
100
Disability at K No Disability Disability at K No Disability
% o
f ch
ildre
n
Does it well Does it but not well Not at all No spoken words
Uses 4-6 word sentence
Tells about events in story in sequence
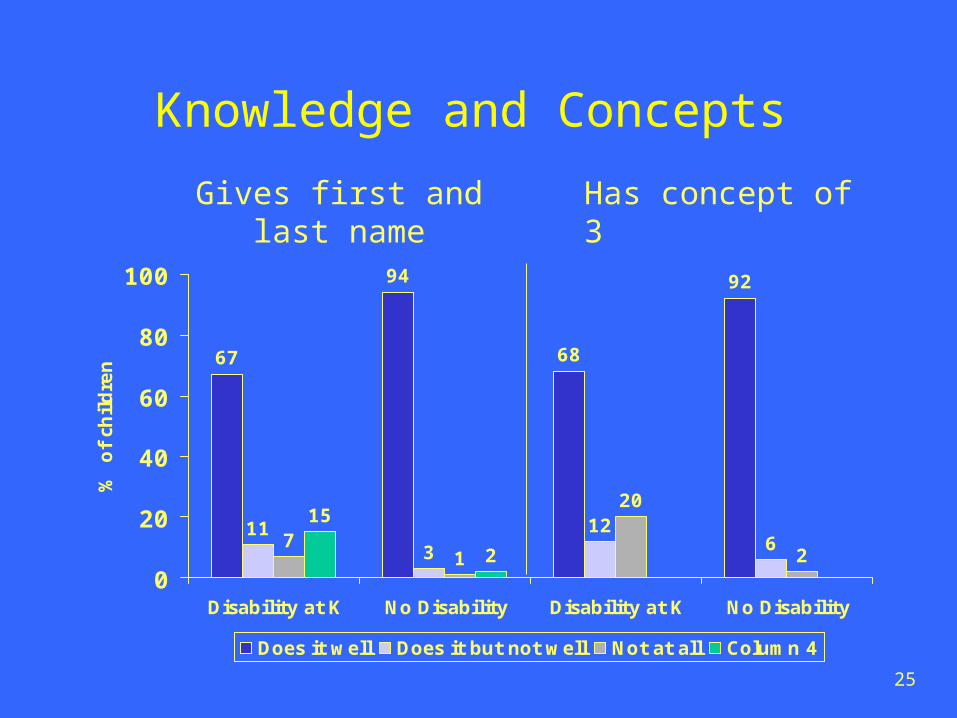
25
Knowledge and Concepts
67
94
68
92
113
1267
1
20
2
15
20
20
40
60
80
100
Disability at K No Disability Disability at K No Disability
% o
f ch
ildre
n
Does it well Does it but not well Not at all Column 4
Gives first and last name
Has concept of 3
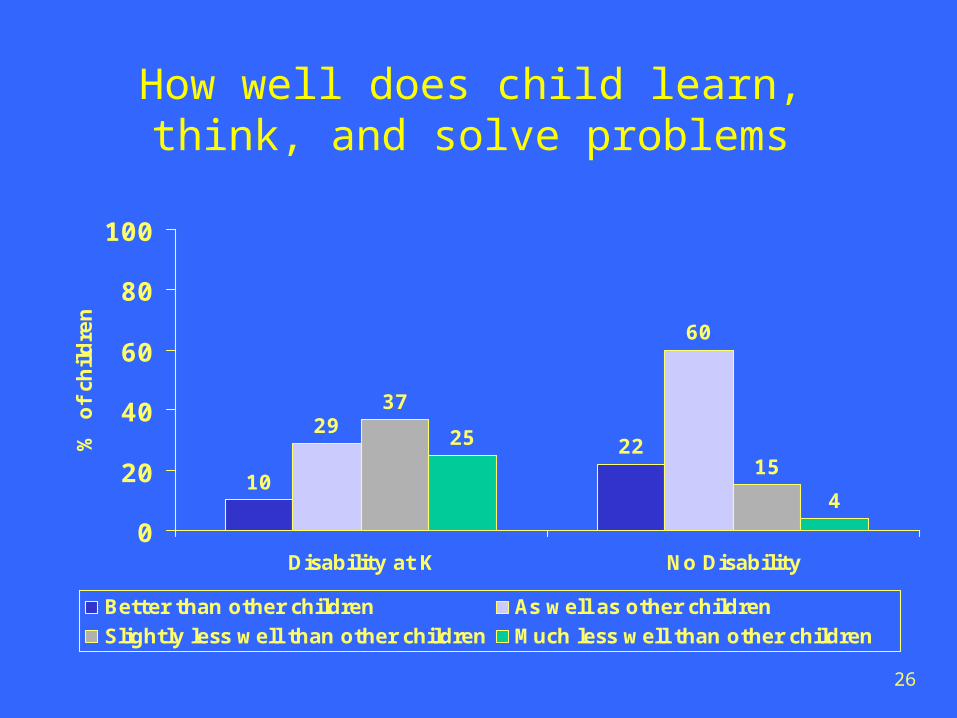
26
How well does child learn, think, and solve problems
10
2229
60
37
1525
4
0
20
40
60
80
100
Disability at K No Disability
% o
f ch
ildre
n
Better than other children As well as other childrenSlightly less well than other children Much less well than other children
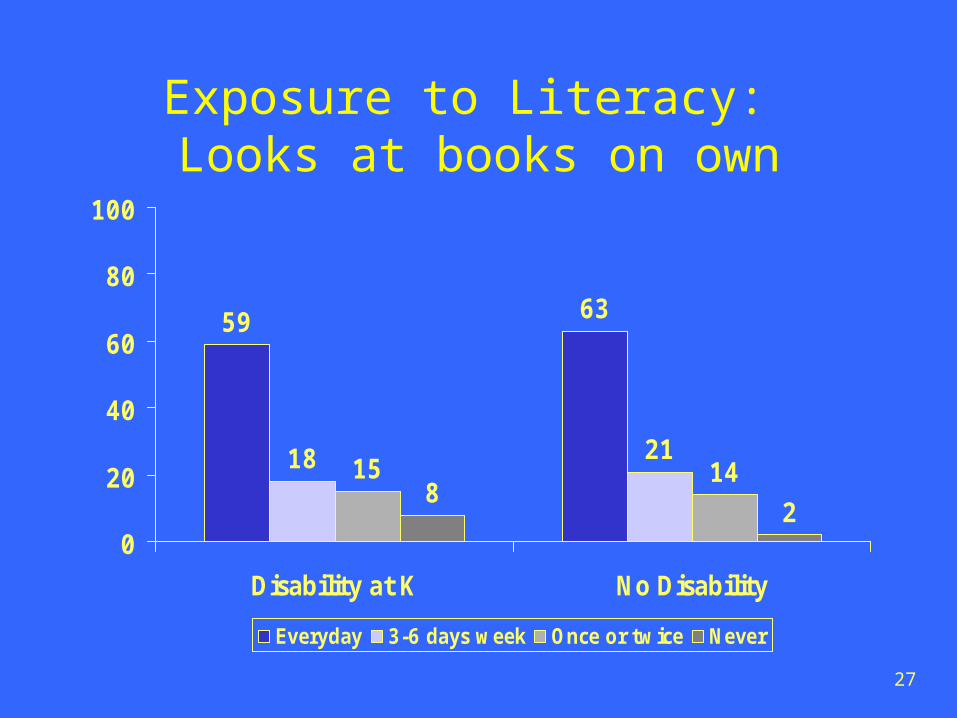
27
Exposure to Literacy: Looks at books on own
59 63
18 2115 14
82
0
20
40
60
80
100
Disability at K No Disability
Everyday 3-6 days week Once or twice Never

28
Social Skills and Behavior
39
79
44
80
32
16
32
1419
4
16
510
28
10
20
40
60
80
100
Disability at K No Disability Disability at K No Disability
Typical for age Mild difficulty/ inappropriateModerate difficulty/ inappropriate Severe difficulty/ inappropriate
Social skills Appropriateness of behavior
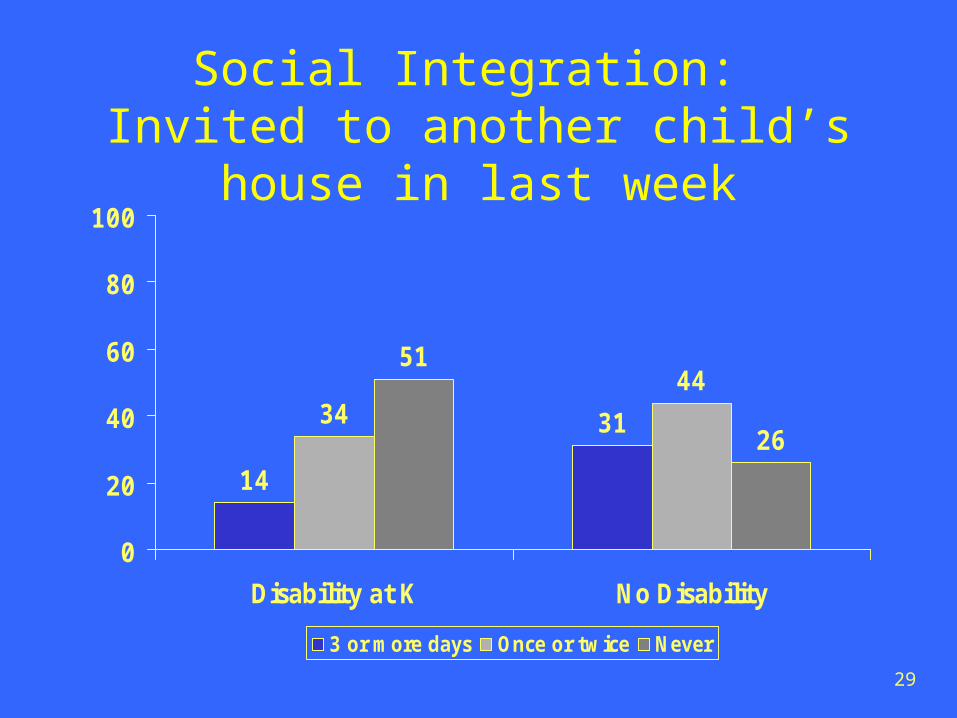
29
Social Integration: Invited to another child’s house in last
week
14
313444
51
26
0
20
40
60
80
100
Disability at K No Disability
3 or more days Once or twice Never
30
Kindergarten Experiences
and Receipt of
Special Education
31
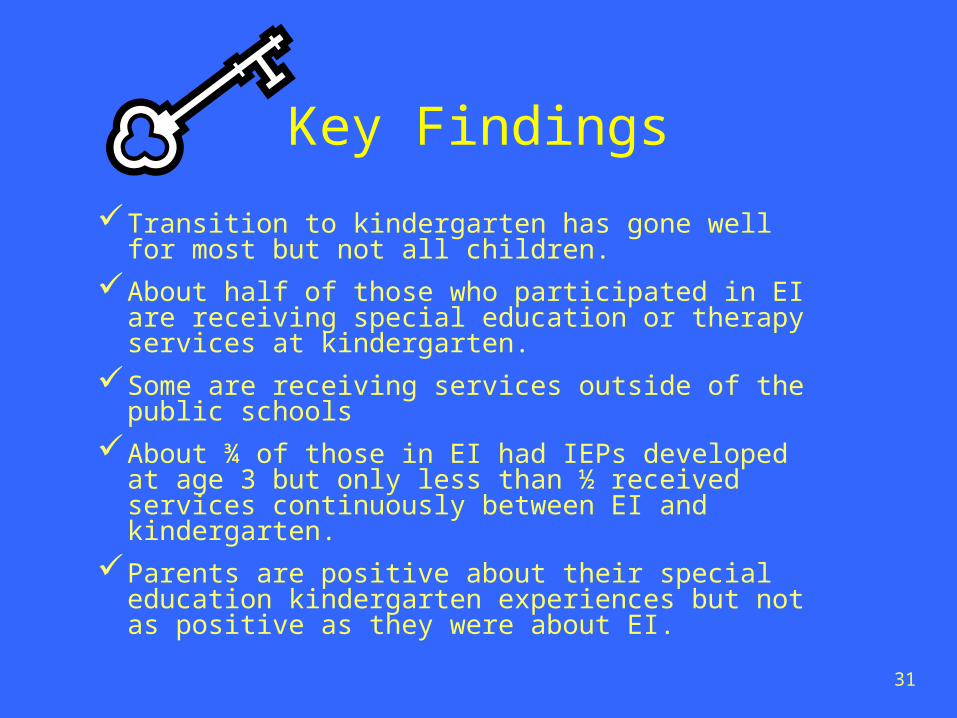
Key Findings
Transition to kindergarten has gone well for most but not all children.
About half of those who participated in EI are receiving special education or therapy services at kindergarten.
Some are receiving services outside of the public schools
About ¾ of those in EI had IEPs developed at age 3 but only less than ½ received services continuously between EI and kindergarten.
Parents are positive about their special education kindergarten experiences but not as positive as they were about EI.
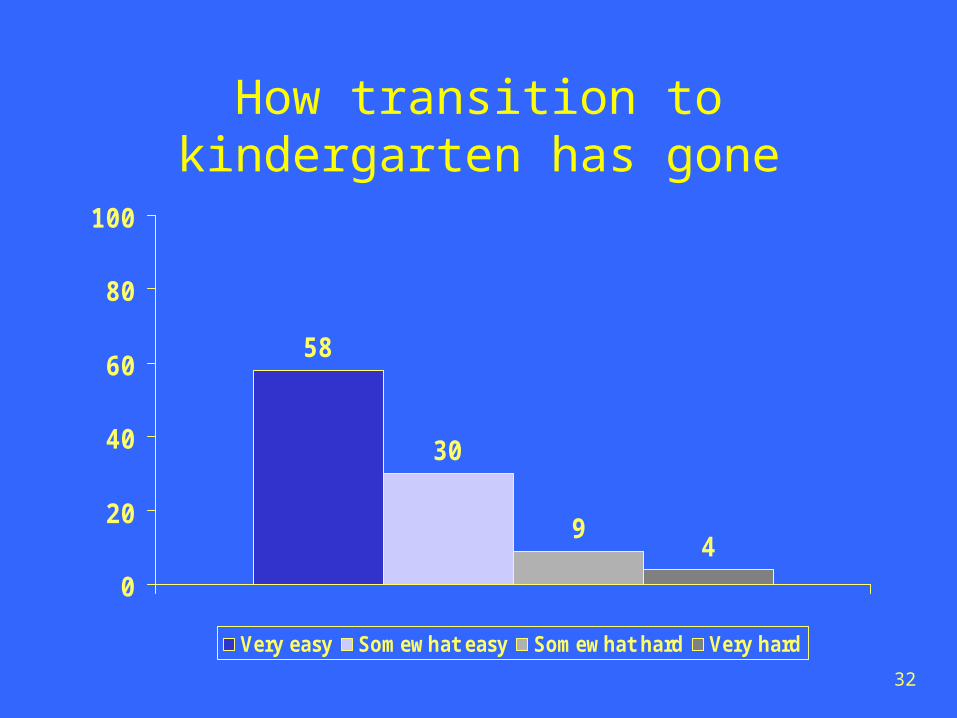
32
How transition to kindergarten has gone
58
30
94
0
20
40
60
80
100
Very easy Somewhat easy Somewhat hard Very hard
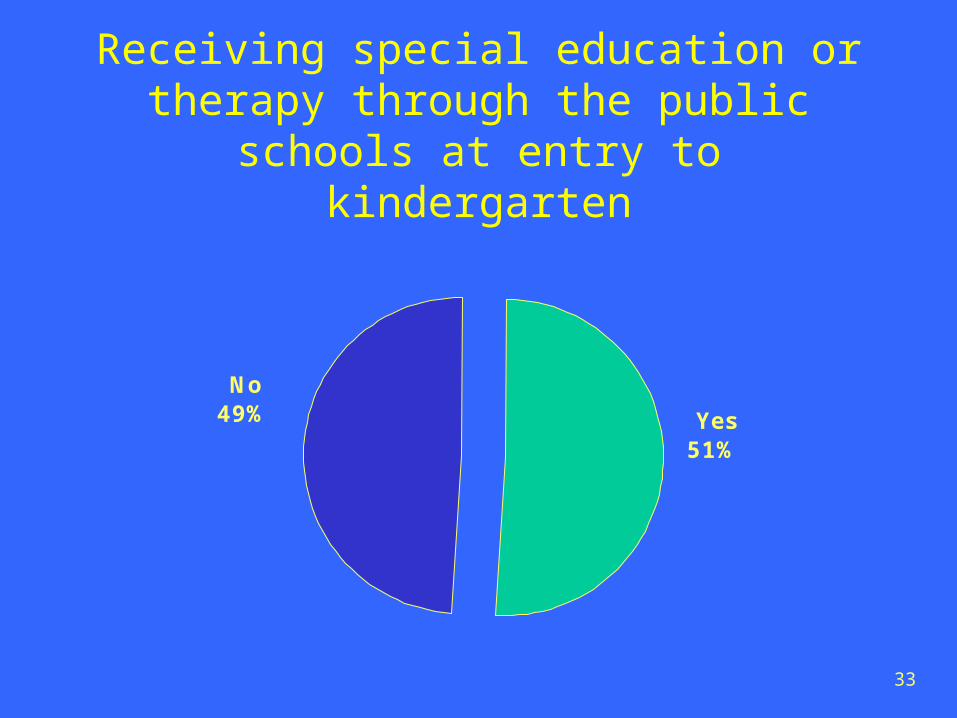
33
Receiving special education or therapy through the public schools
at entry to kindergarten
Yes51%
No49%
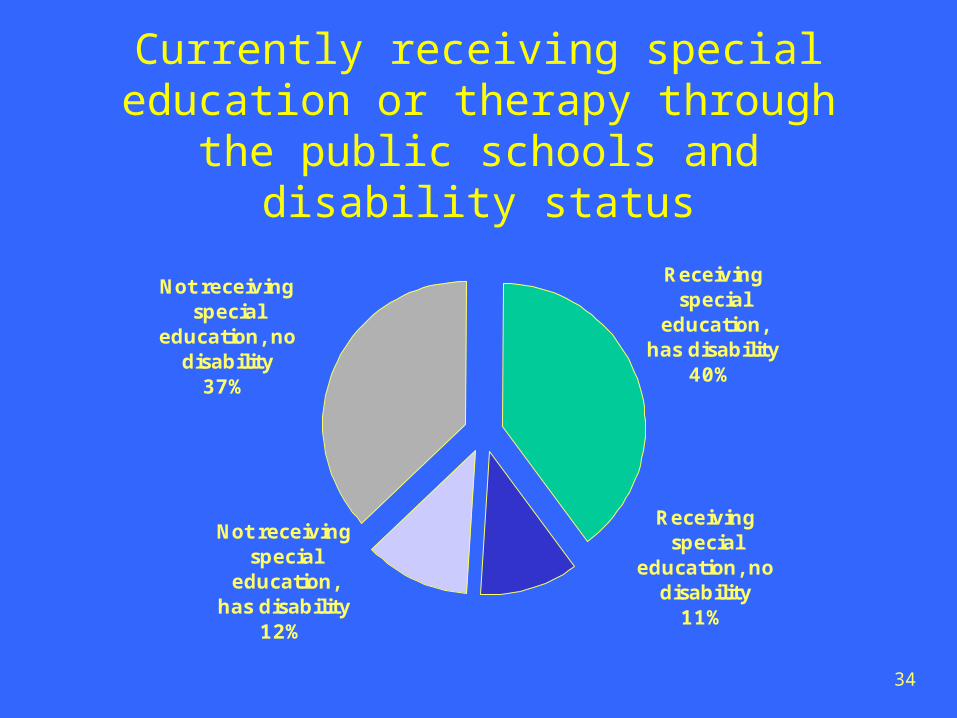
34
Currently receiving special education or therapy through the
public schools and disability status
Not receiving special
education, has disability
12%
Not receiving special
education, no disability
37%
Receiving special
education, has disability
40%
Receiving special
education, no disability
11%
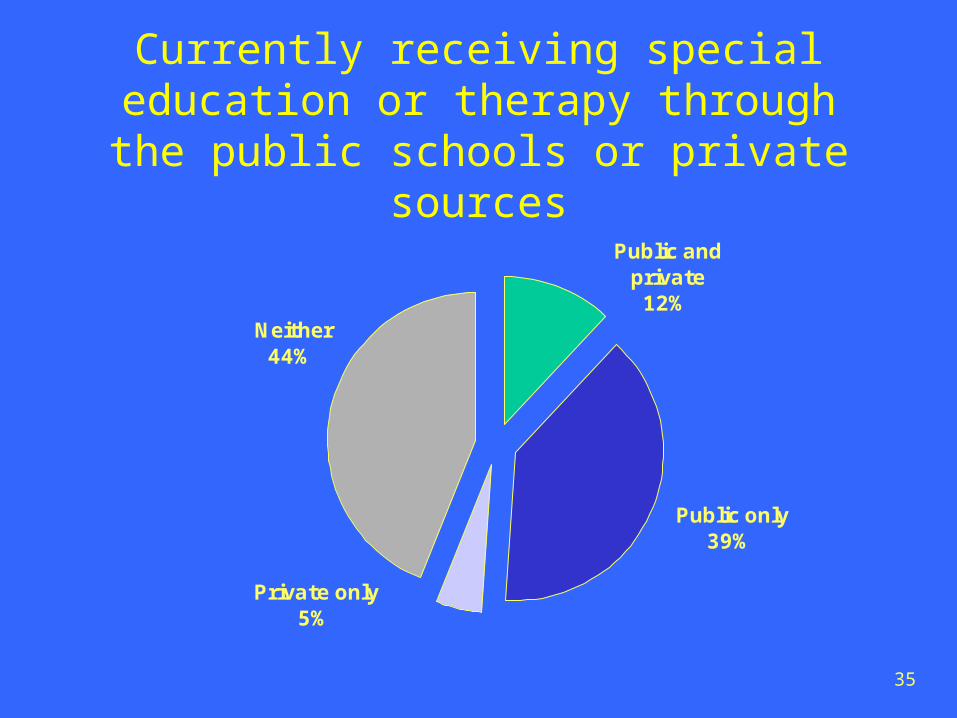
35
Currently receiving special education or therapy through the public schools or private sources
Private only5%
Neither44%
Public and private12%
Public only39%
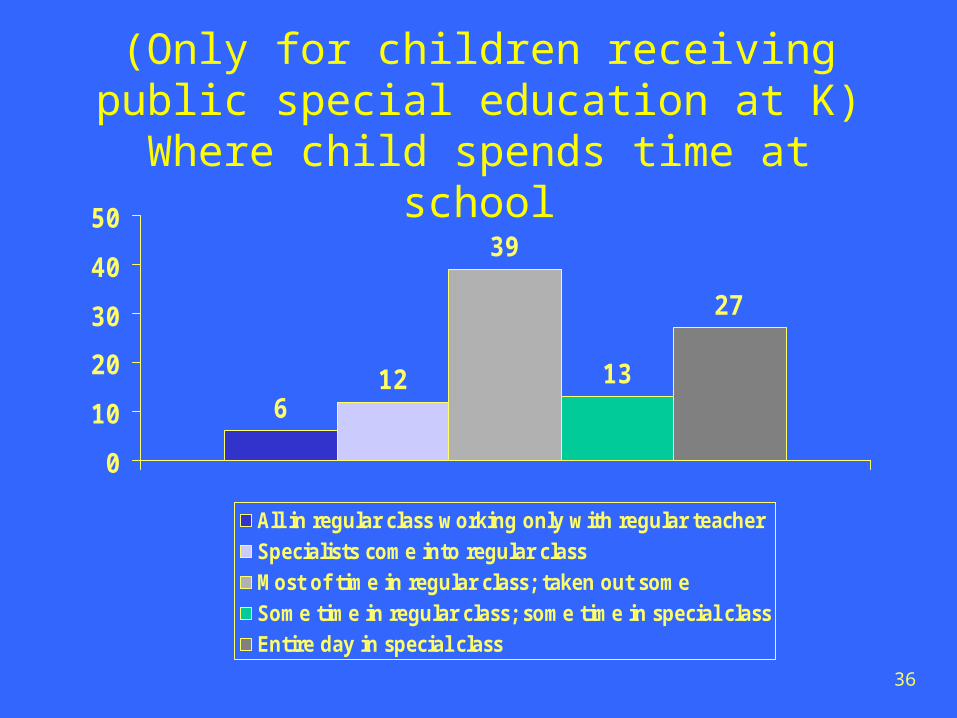
36
(Only for children receiving public special education at K) Where child
spends time at school
612
39
13
27
0
10
20
30
40
50
All in regular class working only with regular teacherSpecialists come into regular classMost of time in regular class; taken out someSome time in regular class; some time in special classEntire day in special class
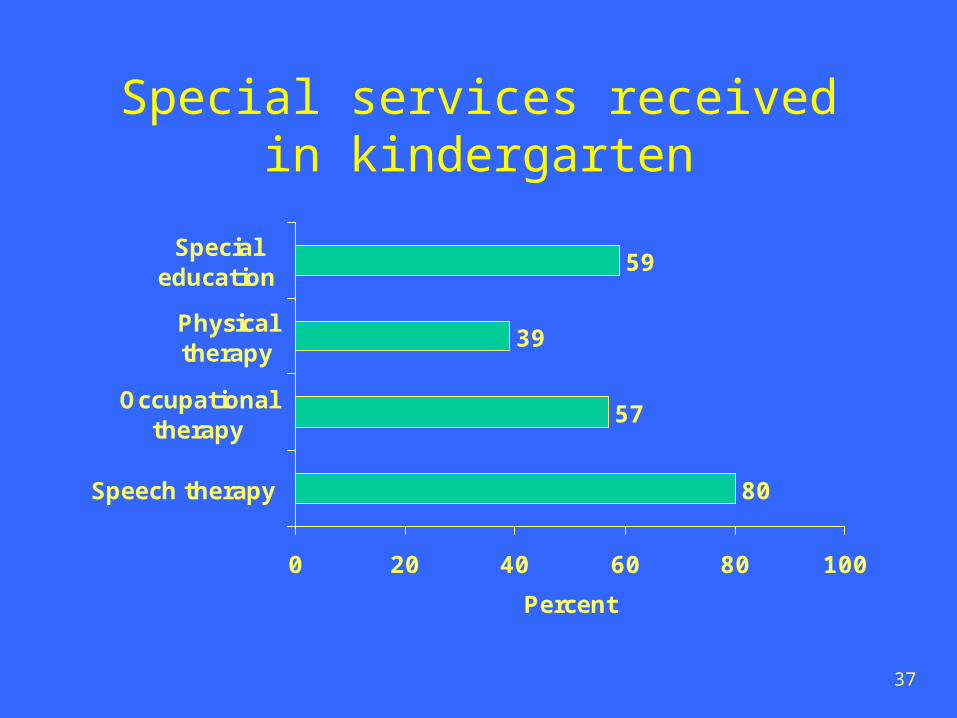
37
Special services received in kindergarten
80
57
39
59
0 20 40 60 80 100
Speech therapy
Occupationaltherapy
Physicaltherapy
Specialeducation
Percent
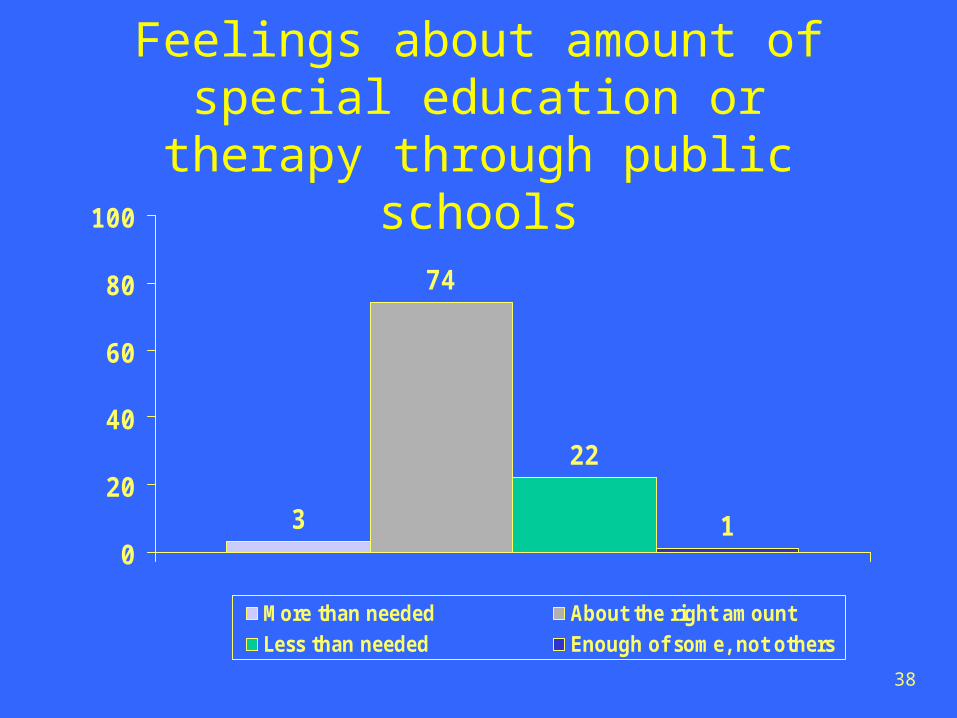
38
Feelings about amount of special education or therapy
through public schools
3
74
22
10
20
40
60
80
100
More than needed About the right amountLess than needed Enough of some, not others
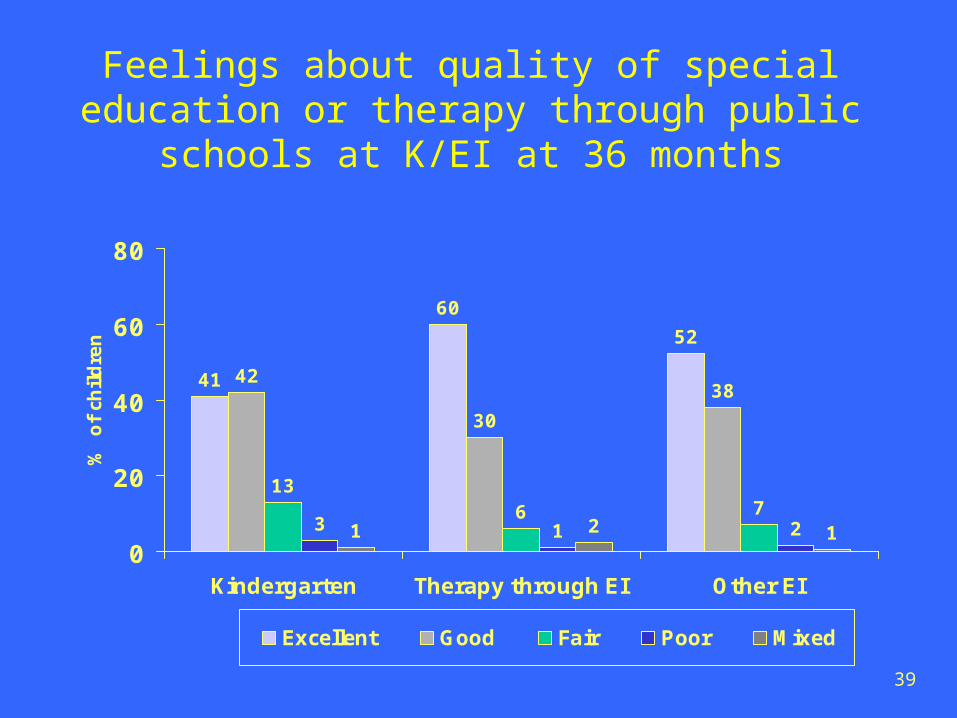
39
Feelings about quality of special education or therapy through public
schools at K/EI at 36 months
41
60
52
42
30
38
136 7
3 1 21 2 10
20
40
60
80
Kindergarten Therapy through EI Other EI
% o
f ch
ildre
n
Excellent Good Fair Poor Mixed
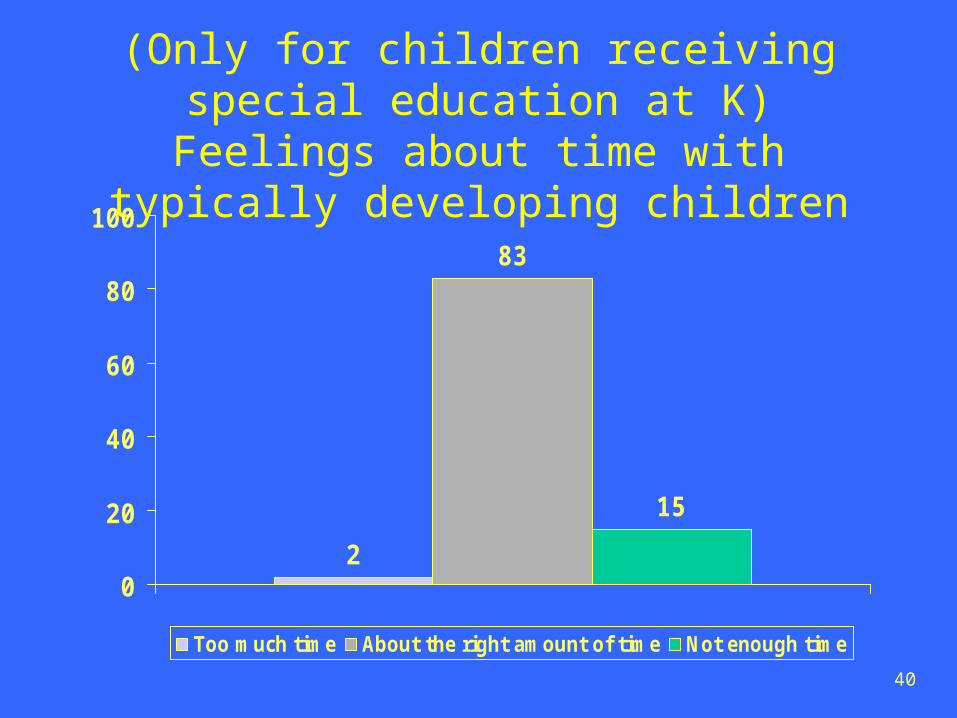
40
(Only for children receiving special education at K) Feelings about time with typically developing children
2
83
15
0
20
40
60
80
100
Too much time About the right amount of time Not enough time
41
Services Between Early Intervention and Kindergarten
• 77% report an IEP was developed for the child around 3 years of age 69% of them were receiving special
education or therapy through the public schools at kindergarten
• 63% report child has received services through the public schools sometime between EI and kindergarten

42
Services Between Early Intervention and Kindergarten
• 45% report child has received services continuously between EI and kindergarten
• Among those who received preschool services through public schools, speech therapy (76%) most frequent service
• 21% report child received services not paid for by the public schools between EI and kindergarten
43
Family Outcomes
and Perceptions
at Kindergarten
44
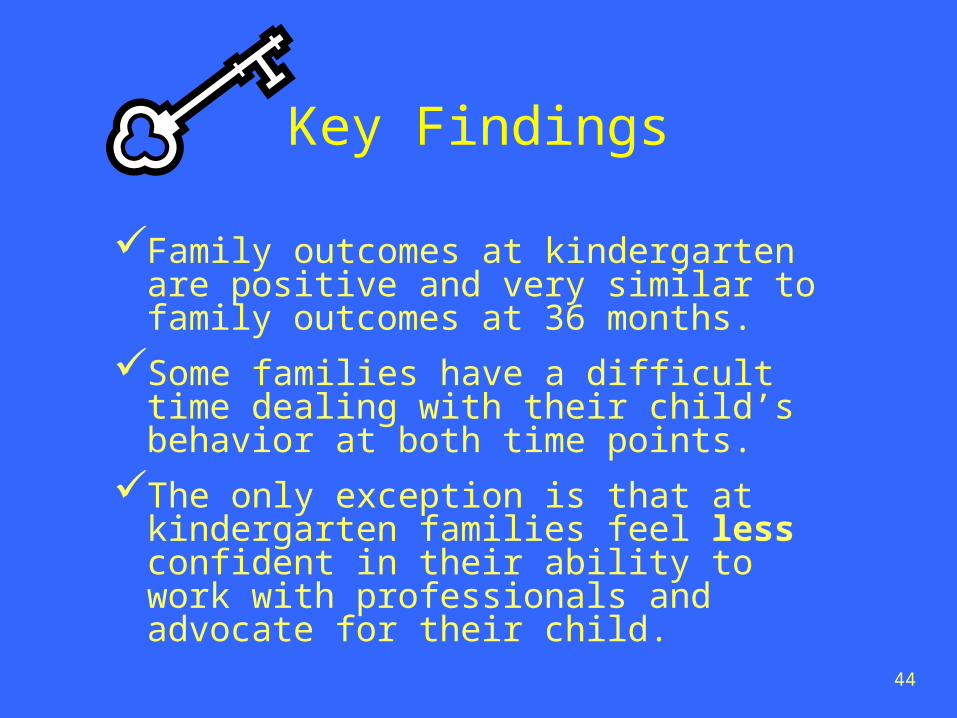
Key Findings
Family outcomes at kindergarten are positive and very similar to family outcomes at 36 months.
Some families have a difficult time dealing with their child’s behavior at both time points.
The only exception is that at kindergarten families feel less confident in their ability to work with professionals and advocate for their child.
45
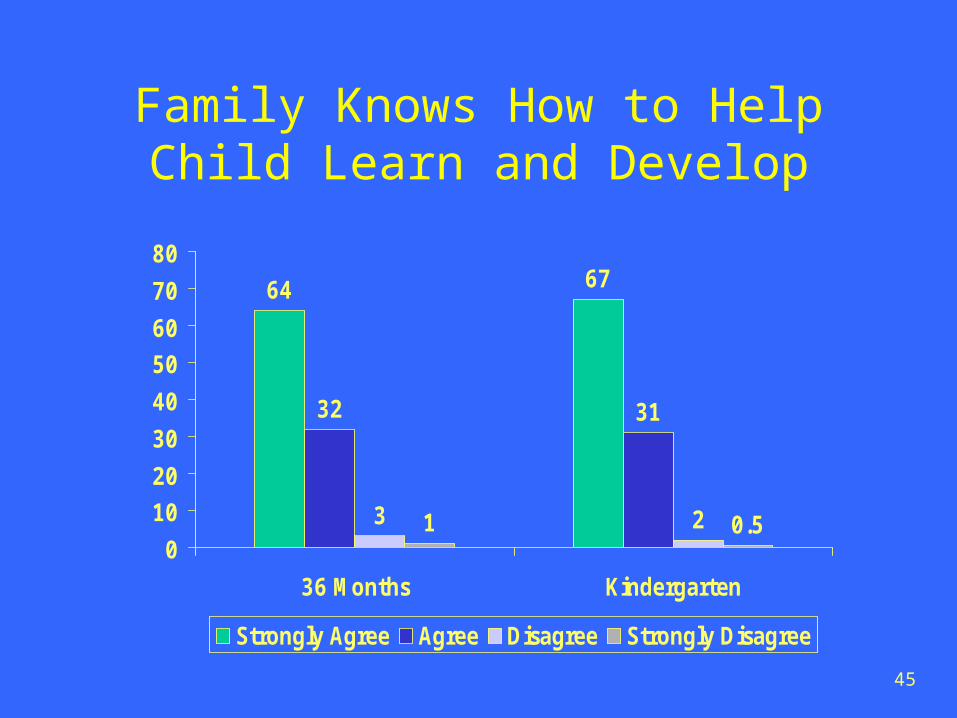
Family Knows How to Help Child Learn and Develop
64 67
32 31
3 21 0.50
10
20
30
40
50
60
70
80
36 Months Kindergarten
Strongly Agree Agree Disagree Strongly Disagree
46
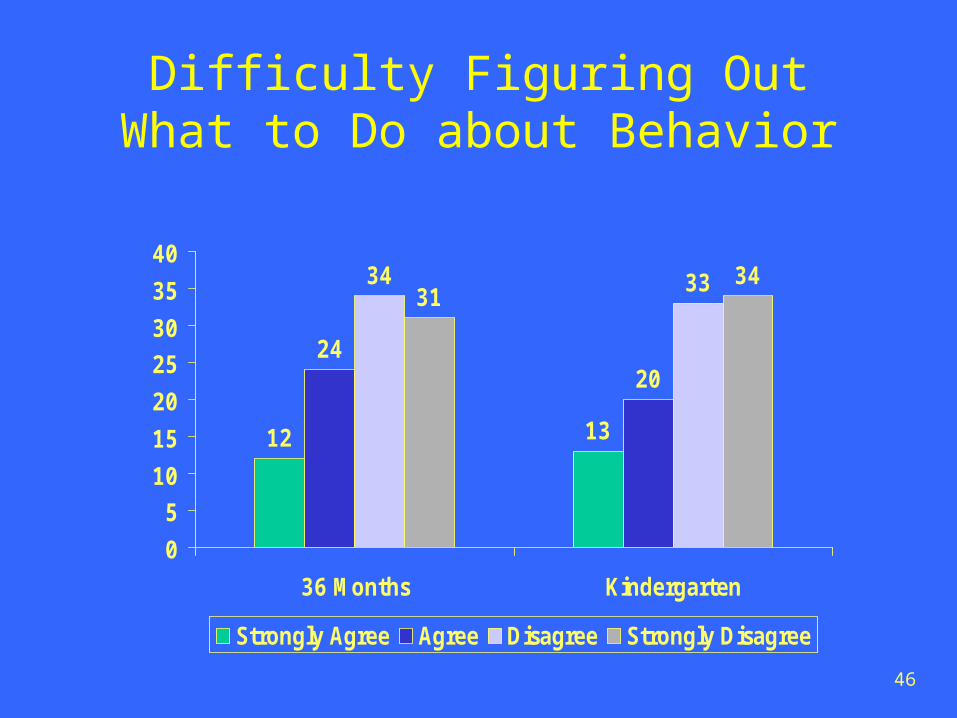
Difficulty Figuring Out What to Do about Behavior
12 13
2420
34 3331
34
0
5
10
15
20
25
30
35
40
36 Months Kindergarten
Strongly Agree Agree Disagree Strongly Disagree
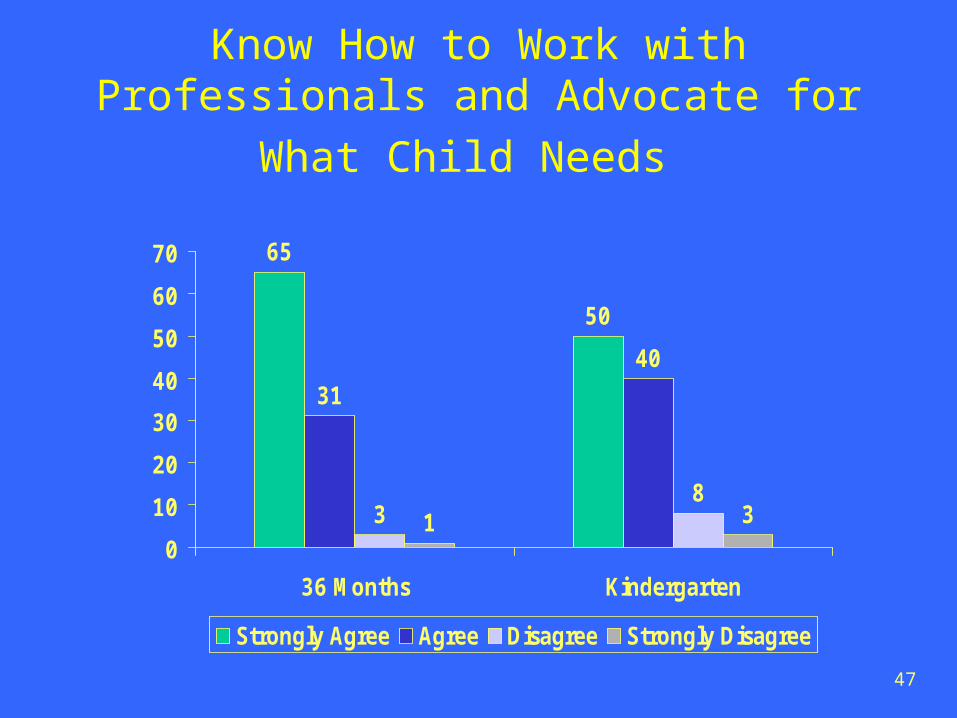
47
Know How to Work with Professionals and Advocate for What
Child Needs
65
50
31
40
38
1 30
10
20
30
40
50
60
70
36 Months Kindergarten
Strongly Agree Agree Disagree Strongly Disagree
48
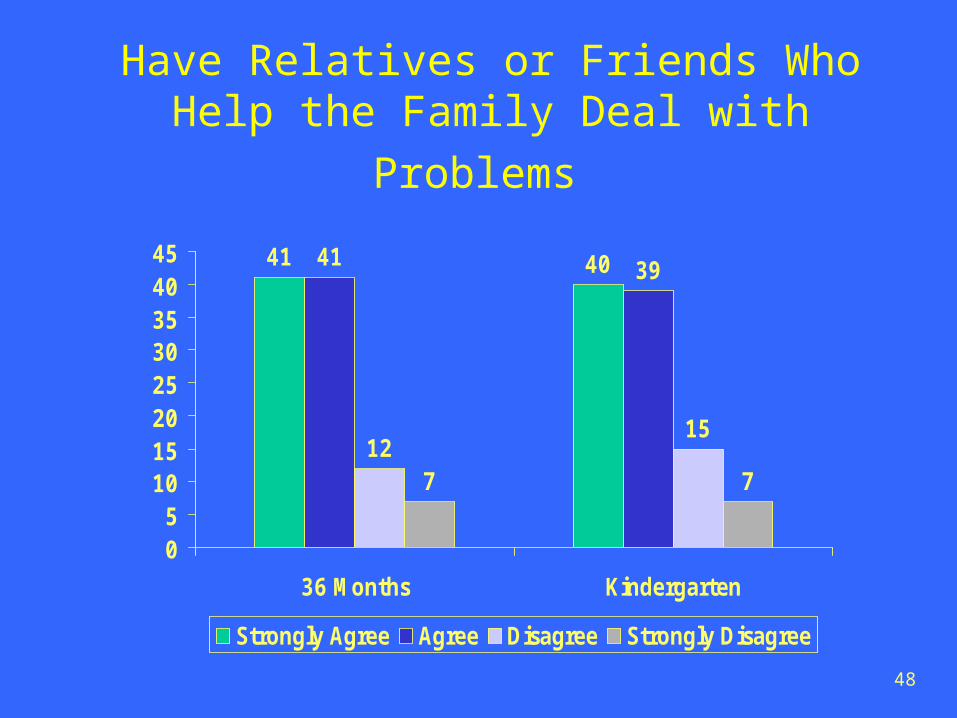
Have Relatives or Friends Who Help the Family Deal with Problems
41 4041 39
1215
7 7
05
1015202530354045
36 Months Kindergarten
Strongly Agree Agree Disagree Strongly Disagree
49
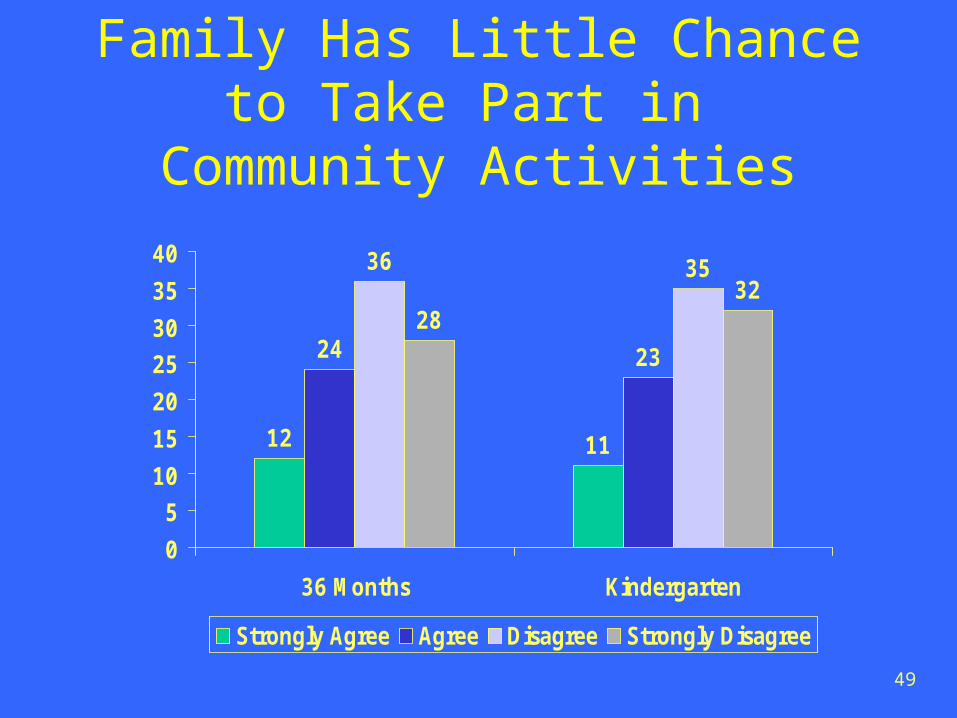
Family Has Little Chance to Take Part in Community
Activities
12 11
24 23
36 35
2832
0
5
10
15
20
25
30
35
40
36 Months Kindergarten
Strongly Agree Agree Disagree Strongly Disagree
50
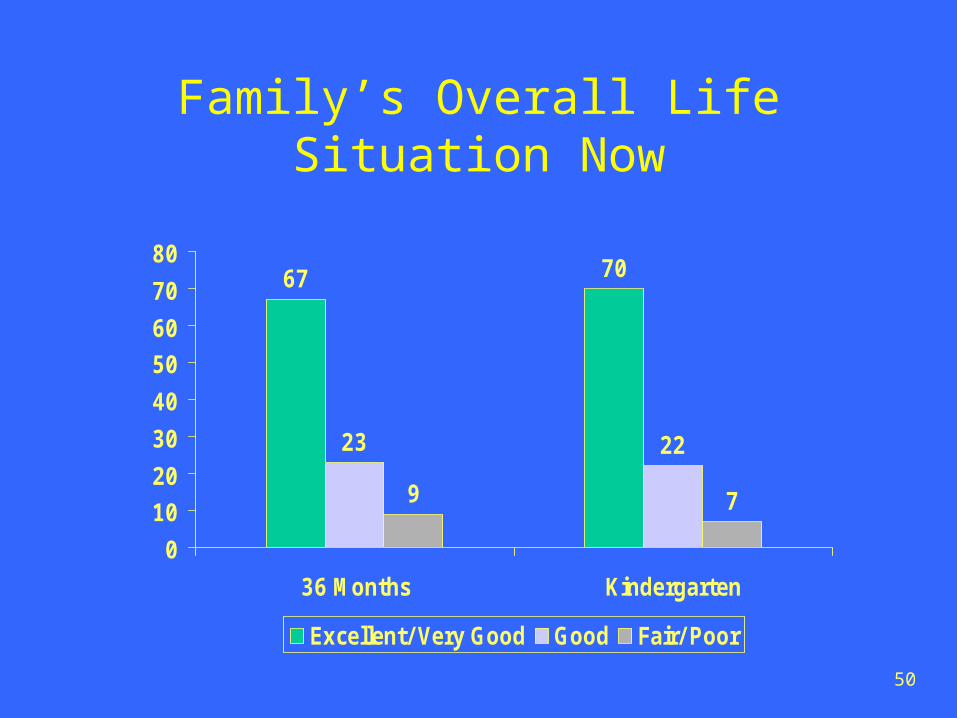
Family’s Overall Life Situation Now
67 70
23 22
9 7
0
10
20
30
40
50
60
70
80
36 Months Kindergarten
Excellent/ Very Good Good Fair/ Poor
51
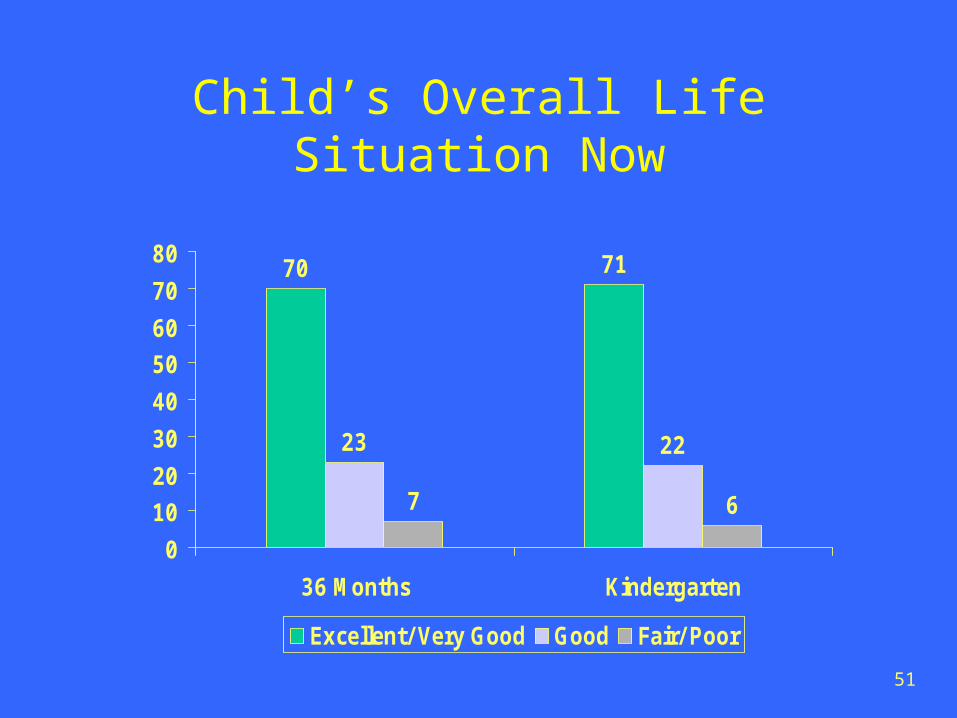
Child’s Overall Life Situation Now
70 71
23 22
7 6
0
10
20
30
40
50
60
70
80
36 Months Kindergarten
Excellent/ Very Good Good Fair/ Poor
52
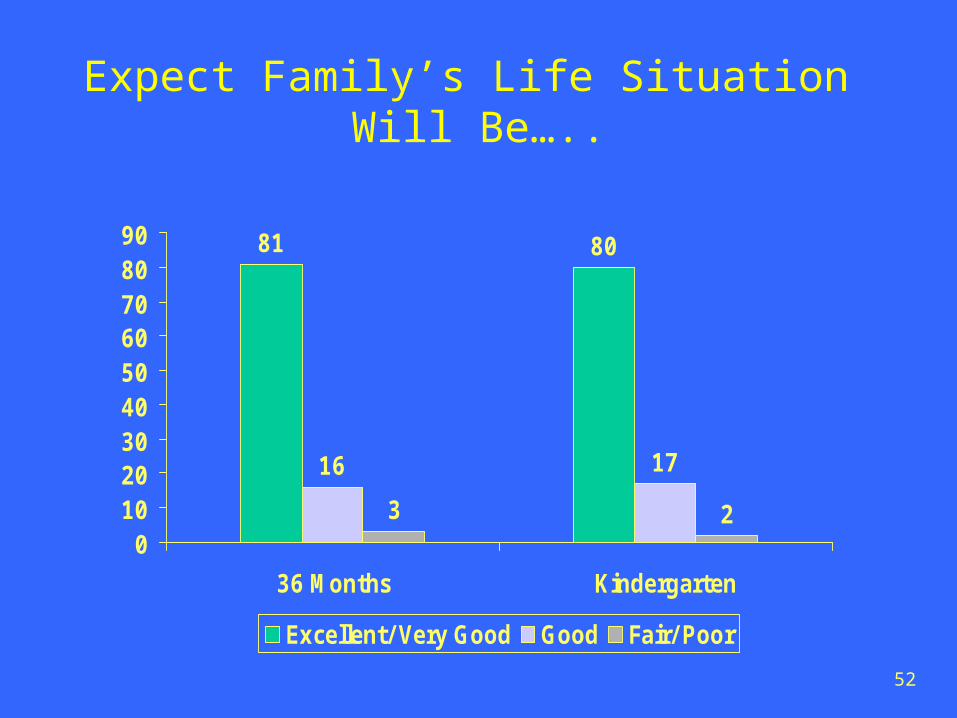
Expect Family’s Life Situation Will Be…..
81 80
16 17
3 20
102030405060708090
36 Months Kindergarten
Excellent/ Very Good Good Fair/ Poor
53
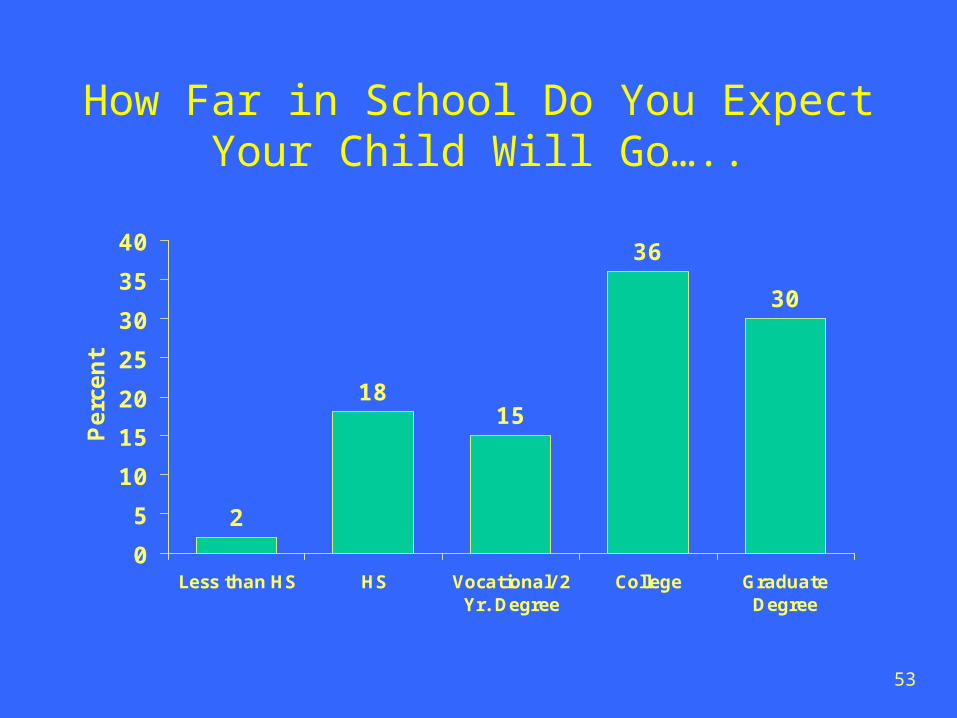
How Far in School Do You Expect Your Child Will Go…..
2
1815
36
30
0
5
10
15
20
25
30
35
40
Less than HS HS Vocational/ 2Yr. Degree
College GraduateDegree
Perc
ent
54
Early Intervention Retrospective
55
Key Finding
At kindergarten, families still are pleased with the quality of early intervention education services and see it as having had an impact on their child’s development and on their family.
56
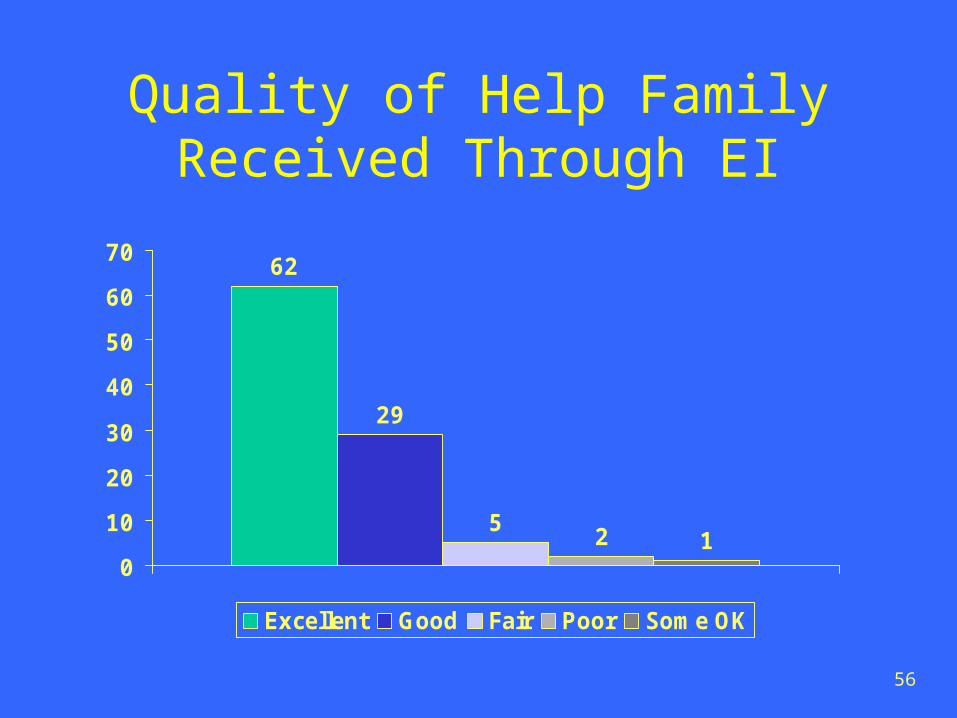
Quality of Help Family Received Through EI
62
29
52 1
0
10
20
30
40
50
60
70
Excellent Good Fair Poor Some OK
57
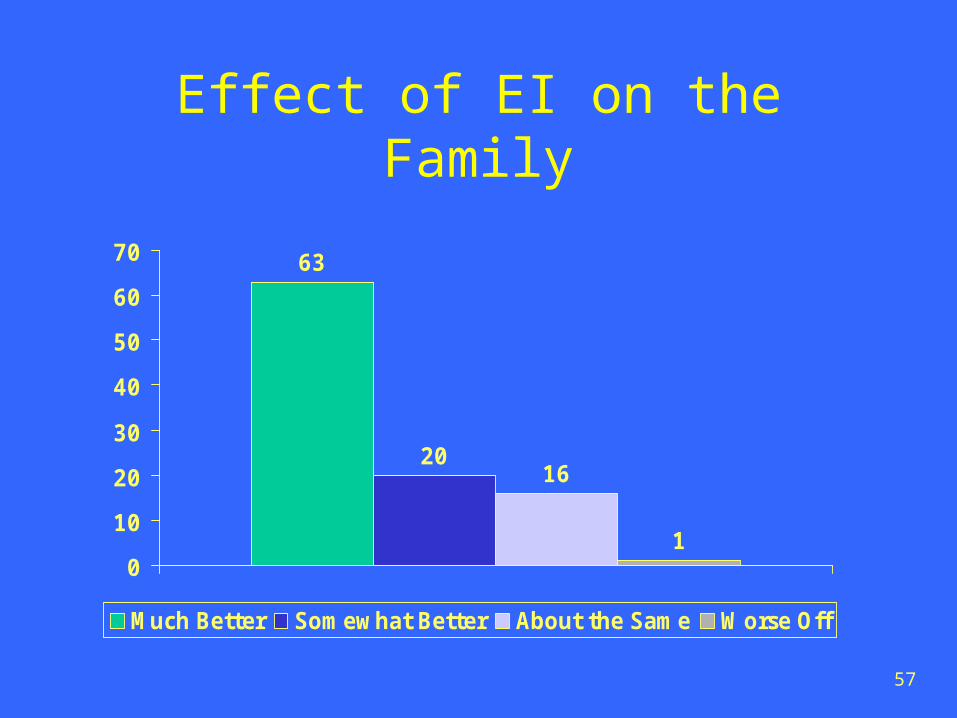
Effect of EI on the Family
63
2016
10
10
20
30
40
50
60
70
Much Better Somewhat Better About the Same Worse Off
58
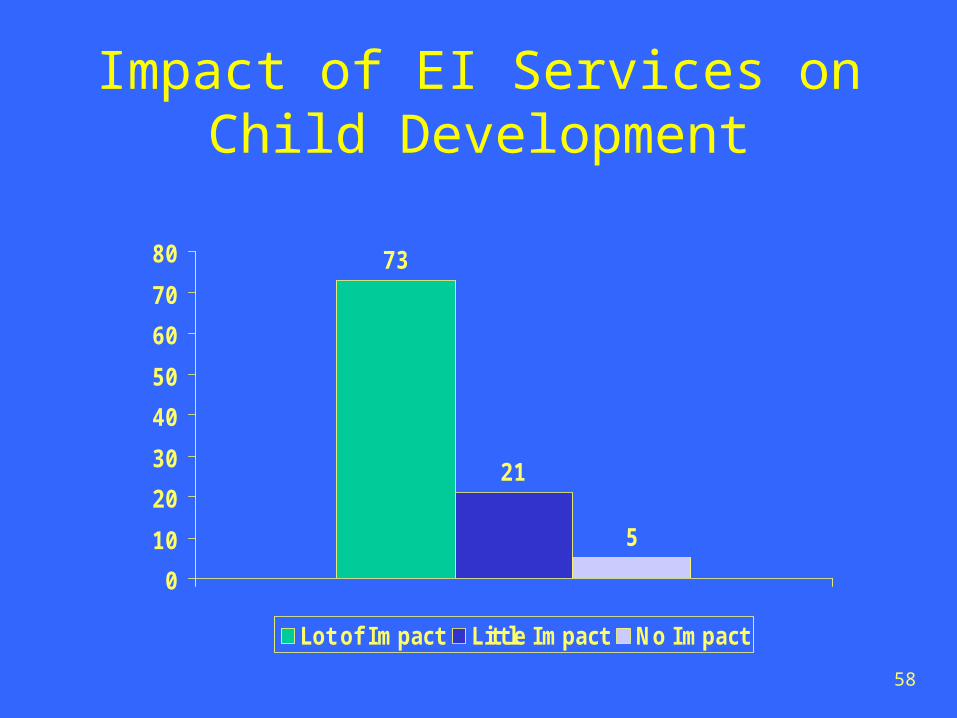
Impact of EI Services on Child Development
73
21
5
0
10
20
30
40
50
60
70
80
Lot of Impact Little Impact No Impact
59
Conclusions
• Early intervention is serving children with a variety of different conditions and delays.
• In addition to having a delay or disability, EI participants differ from the general population in ways that probably have consequences for long term outcomes (e.g., poor health and poverty).
• By kindergarten, about half of those who received early intervention are no longer considered to have a disability. We need to do more analyses to have a better sense of
who these children are and how they differ from those who are still considered to have a delay or a disability.
60
Conclusions• Many former EI participants are experiencing
good outcomes at kindergarten. A small proportion of those who no longer have a delay or disability have indicators of possible future difficulties.
• Problem areas are communication, relating to others, and behavior.
• About half of the children are no longer receiving special education services.
• Most family outcomes are positive, especially their hope for the future and their expectations for their children.
• At kindergarten, most families see EI as having had a positive impact on their children and families.
61
NEILS Web Site:www.sri.com/neils


![NU[I]SIMA PANDUROVI] MILAN \OKOVI] @ENSKI GLAS (spiker) MU[KI GLAS (spiker) Premijera 25. H 2002, na II programu Radio-Beograda. @agor glasova u eksterijeru, s …](https://img.pdfslide.net/doc/110x75/60064472e02c1a385f6e9023/-nui-sima-pandurovi-milan-okovi-enski-glas-spiker-muki-glas-spiker-premijera.jpg)