Embed Size (px)
Citation preview
CE in the SPMCE in the SPM
Kathleen S. Short, Ph. D.U.S. Census Bureau
Consumer Expenditure Survey Data Users’ Needs Forum
June 21- 22, 2010
Commerce Department NewsFOR IMMEDIATE RELEASEFOR IMMEDIATE RELEASE
CONTACT OFFICE OF PUBLIC AFFAIRSTuesday, March 2, 2010y, ,
Census Bureau to Develop Supplemental Poverty Measure (SPM), with assistance from the Bureau of Labor Statistics and in consultation with other appropriate agencies and outside experts will beappropriate agencies and outside experts, will be responsible for the measure’s technical design.
SPMSPM
• An Interagency Technical Working Group Provided a roadmap– Provided a roadmap
– 1995 National Academy of Science Measuring Poverty– Extensive research on poverty measurement past 15 years
• Additional details can be found at http://www census gov/hhes/www/povmeas/SPM TWGObservahttp://www.census.gov/hhes/www/povmeas/SPM_TWGObservations.pdf.
Ob ti f th I tObservations from the Interagency Technical Working Group on Developing a
Supplemental Poverty MeasureSupplemental Poverty Measure
• The SPM would not replace the official poverty measure
• Will be updated every year• Improved as new data, new methods, and further
h b il blresearch become available
BLS Role
• Conducted research on the poverty thresholds
• Provided expenditure-based thresholds to the Census Bureau
• Will continue to play this role with the SPM
Basis for SPM
• Broadly based on the recommendations of the National Academies of Science (NAS) in their 1995National Academies of Science (NAS) in their 1995 report, Measuring Poverty
• Informed by the research of the past 15 years
• Specifies a series of initial choices in the development of the SPM
National Academy of SciencesNational Academy of Sciences Recommendations
• Consumer Expenditure Survey [CE] Interview data• Reference family of two adults and two children • Basic bundle –food, clothing, shelter, utilities (FCSU)
P f di di• Percentage of median expenditures• Multiplier for other needs of 15% - 25%
Three years of quarterly data• Three years of quarterly data
SPMSPM
What are the differences?
8
Data
• U.S. Consumer Expenditure Interview Survey
• Each threshold, 5 years of data– 1995: 1990 Q2 – 1995 Q11995: 1990 Q2 1995 Q1– 2009: 2004 Q2 - 2009 Q1
• Assume quarters are independent
9
Whose spending?
• Poverty thresholds -- Consumer Unit
• Income side -- All related individuals who live at the same address, any co-resident unrelated children
f f ( fwho are cared for by the family (such as foster children), and any cohabitors and their children
• Equivalized expenditures for the reference sample
Equivalized?
• Estimation sample - all units with exactly two children.
• Adjusted to represent 2 adult and 2 child unit with equivalence scaleequivalence scale
• Published thresholds presented as spending p p gthresholds for a 2 adult and 2 child unit
11
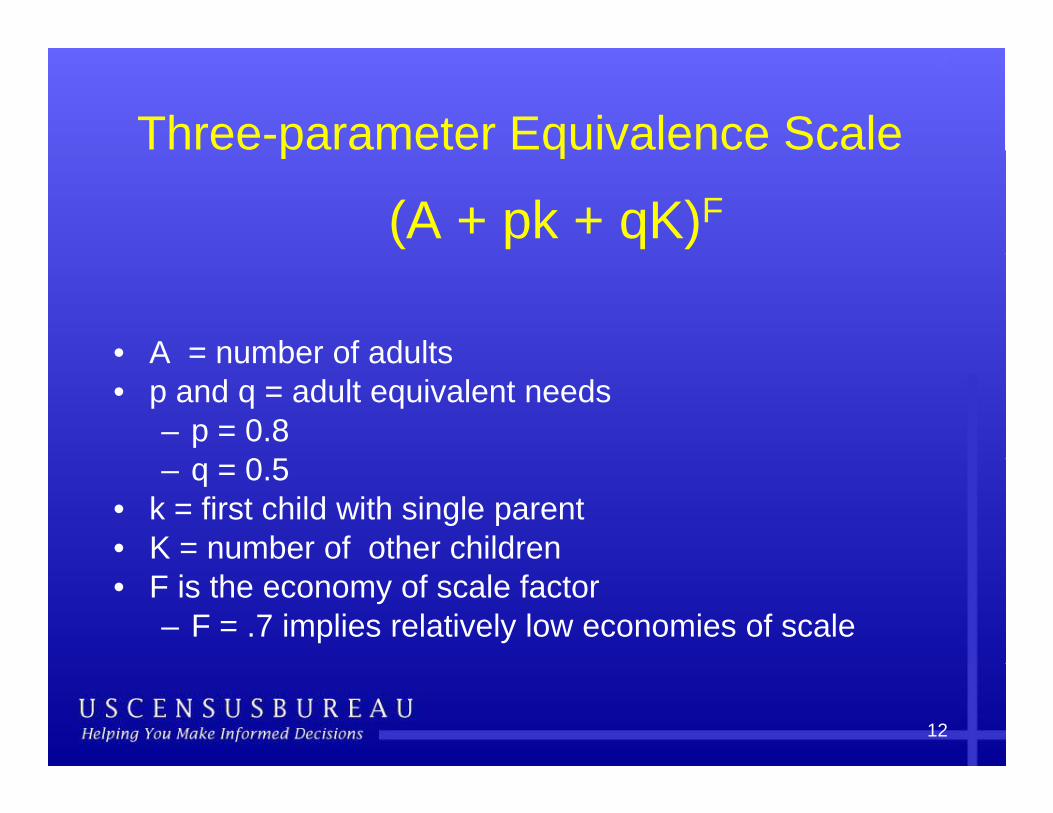
Three-parameter Equivalence Scalep q
(A + pk + qK)F
• A = number of adults• A = number of adults• p and q = adult equivalent needs
– p = 0.80 5– q = 0.5
• k = first child with single parent• K = number of other children• F is the economy of scale factor
– F = .7 implies relatively low economies of scale
12
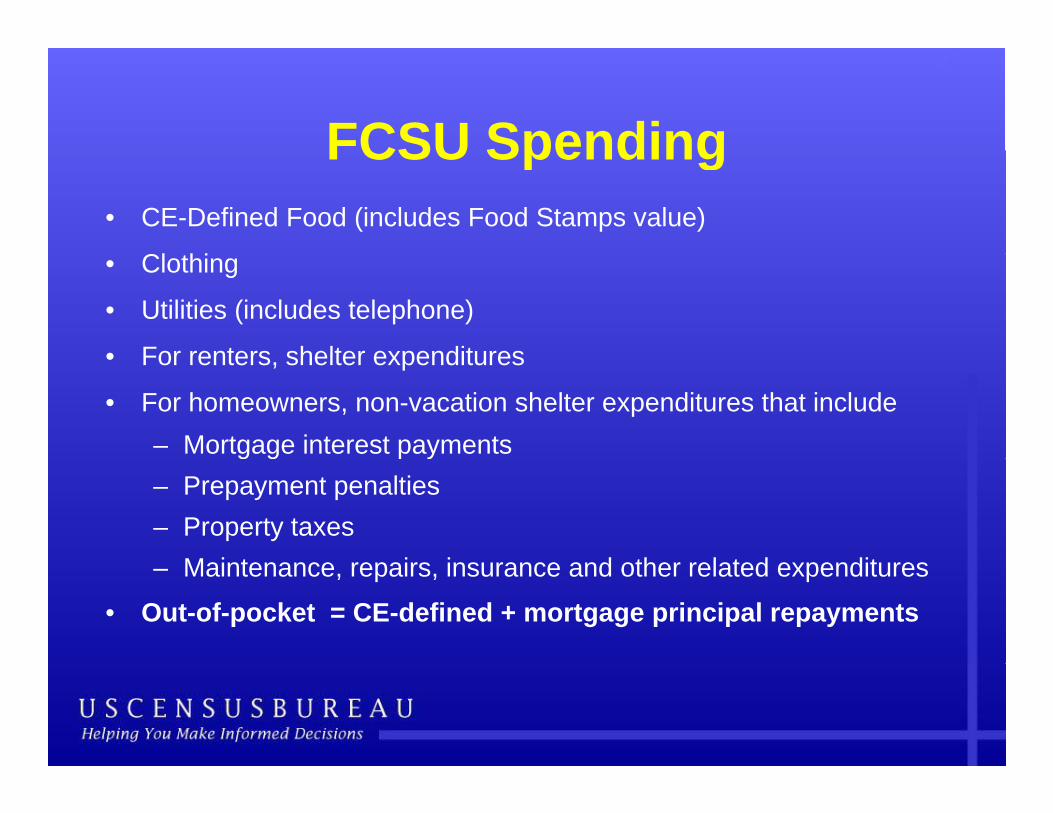
FCSU SpendingFCSU Spending• CE-Defined Food (includes Food Stamps value)
• Clothing
• Utilities (includes telephone)
• For renters shelter expenditures• For renters, shelter expenditures
• For homeowners, non-vacation shelter expenditures that include– Mortgage interest paymentsg g p y– Prepayment penalties– Property taxes
M i t i i d th l t d dit– Maintenance, repairs, insurance and other related expenditures
• Out-of-pocket = CE-defined + mortgage principal repayments
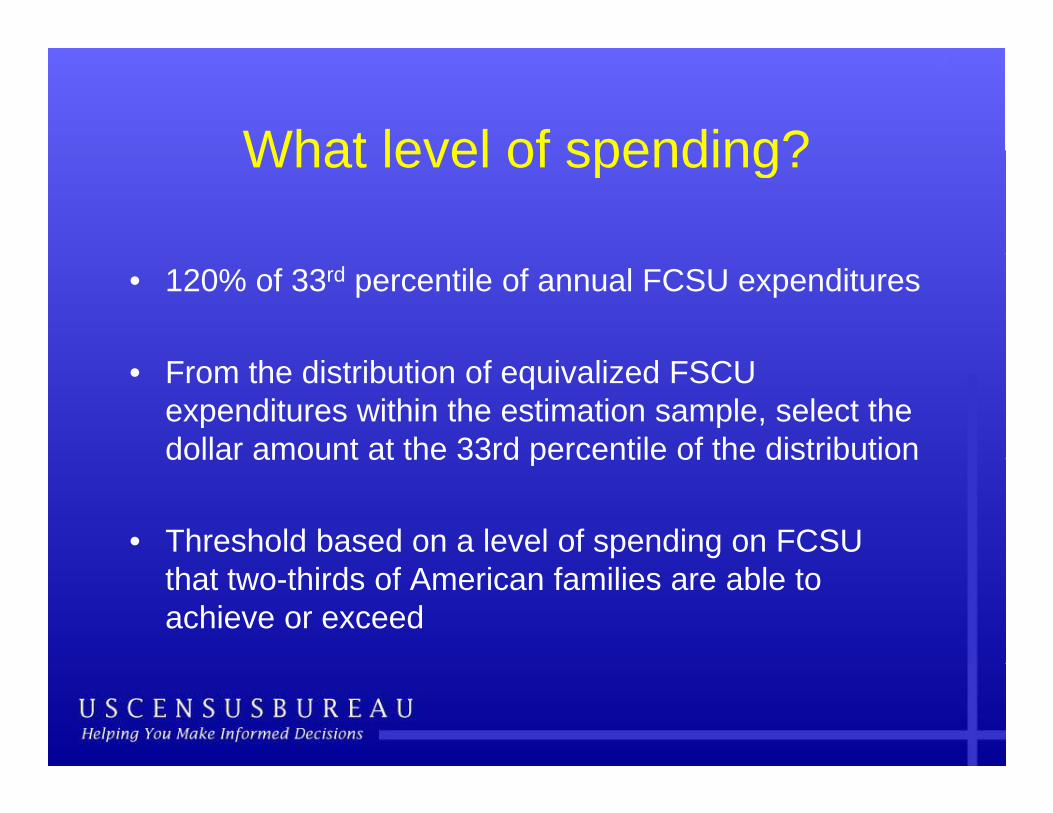
What level of spending?What level of spending?
• 120% of 33rd percentile of annual FCSU expenditures
• From the distribution of equivalized FSCU expenditures within the estimation sample, select the dollar amount at the 33rd percentile of the distributiondollar amount at the 33rd percentile of the distribution
• Threshold based on a level of spending on FCSU that two-thirds of American families are able to achieve or exceed
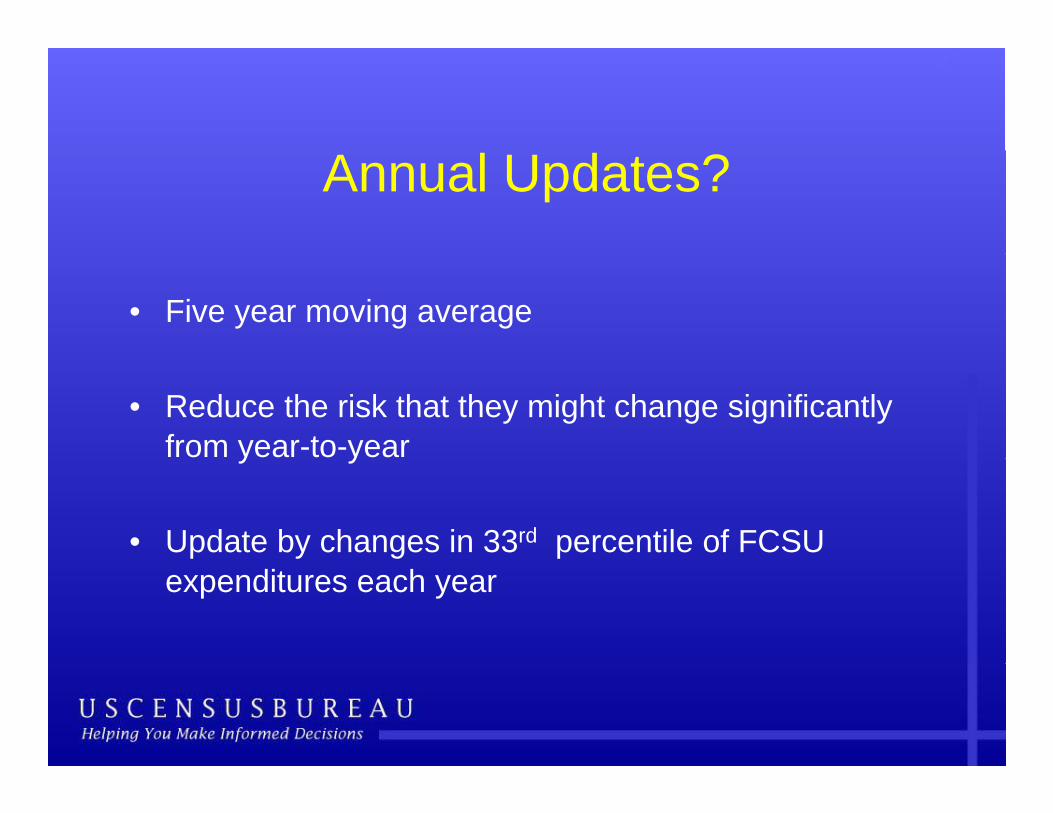
Annual Updates?
• Five year moving average
• Reduce the risk that they might change significantly from year-to-yeary y
• Update by changes in 33rd percentile of FCSU expenditures each year
Main Goals of SPM
• More comprehensive poverty measure than current ffi i lofficial measure
• Evaluate effect of taxes and transfers on poverty statisticsstatistics– Include value of in-kind benefits that are counted on the
resource side for food, shelter, clothing and utilities– Consistency of the threshold and resource definitions
Resource side
• Before tax money annual incomee o e ta o ey a ua co e
• Plus noncash transfers
• Minus necessary expenses
17
For consistency CE needs
• Food expenses do not include subsidies for WIC and free and reduced price school meals
• Shelter expenses do not take account of the value public or subsidized housingpublic or subsidized housing
• Utility expenses do not include payments subsidies y p p ysuch as LIHEAP
Important CE needs
• Expenditures on food, clothing, housing, and utilities must be collected together
C l ti i t t– Correlations are important– Distributions at micro-level
• Resource measure is collected for previous calendarResource measure is collected for previous calendar year– CE quarterly data is annualized – Quarters are assumed to be independent– Longitudinal weights
Special problem: housing
• A significant number of low-income families own a home without a mortgage and therefore have quite low shelter expenditures
S• Separate thresholds– Renters– Owners with a mortgageOwners with a mortgage– Owners without a mortgage
Further research
• Adjust the thresholds for price differences across geographic areas using the best available data and g g p gstatistical methodology
• Estimates of correlations among FCSU and MOOP, child care, work expenses
• Characterize properties of distributions at the micro-level changes over timelevel, changes over time
• Monthly vs. annual measures
References• Citro Constance F and R T Michael eds Measuring Poverty :Citro, Constance F. and R.T. Michael, eds., Measuring Poverty :
A New Approach. Washington, DC: National Academy Press, 1995.
• Federal Register /Vol. 75, No. 101 /Wednesday, May 26, 2010 /Notices
• Poverty Measurement website and working papers Census• Poverty Measurement website and working papers, Census Bureau http://www.census.gov/hhes/www/povmeas/nas.html
• Garner, Thesia I., Stephanie Shipp, Geoffrey Paulin, Kathleen p pp yShort, and Charles Nelson, “Poverty Measurement in the1990s,” Monthly Labor Review, March 1998, pp. 39-61.
22