Embed Size (px)
Citation preview
KBAC: Knowledge-Based Admission ControlDoreid Ammar ∗, Thomas Begin ∗, Isabelle Guerin-Lassous ∗ and Ludovic Noirie†
∗Universite Lyon 1 / LIP (UMR ENS Lyon - INRIA - CNRS - UCBL)Email: {doreid.ammar, thomas.begin, isabelle.guerin-lassous}@ens-lyon.fr
†Alcatel-Lucent Bell Labs, Nozay, FranceEmail: [email protected]
Abstract—Many methods have been proposed in the literatureto perform admission control in order to provide a sufficientlevel of Quality of Service (QoS) to accepted flows. In thispaper, we introduce a novel data-driven method based on a time-varying model that we refer to as Knowledge-Based AdmissionControl solution (KBAC). Our KBAC solution consists of threemain stages: (i) collect measurements on the on-going trafficover the communication link; (ii) maintain an up-to-date broadview of the link behavior, and feed it to a Knowledge Plane;(iii) model the observed link behavior by a mono-server queuewhose parameters are set automatically and which predicts theexpected QoS if a flow requesting admission were to be accepted.Our KBAC solution provides a probabilistic guarantee whoseadmission threshold is either expressed, as a bounded delay oras a bounded loss rate. We run extensive simulations to assess thebehavior of our KBAC solution in the case of a delay threshold.The results show that our KBAC solution leads to a good trade-offbetween flow performance and resource utilization. This abilitystems from the quick and automatic adjustment of its admissionpolicy according to the actual variations on the traffic conditions.
I. INTRODUCTION
Over the last few years, new usages such as streaming orlive video watching are increasingly representing a significantpart of Internet traffic. Network operators face the challengeof satisfying the quality of experience expected by end-userswhile, in the same time, avoiding the over-provisioning oftransmission links. Bandwidth management offers a widespectrum of policies to overcome this issue. Possible op-tions include congestion control, scheduling algorithms, trafficshaping and admission control. In this paper, we focus onadmission control.
Admission control is a mechanism used to prevent someflows from accessing a computer network with regard to thecurrent utilization level of the network resource. By regulatingthe number of on-going flows, admission control aims atpreventing overloading, congestion and performance collapses,so that, accepted flows receive a sufficient level of Qualityof Service (QoS), which is of utmost importance for delay-sensitive applications (e.g., Telephony over IP) and resource-intensive applications (e.g., streaming video).
Admission control has been an active field of research formany years. Despite the number and the variety of proposedsolutions, virtually all of them, if not all, are hampered by thedifficulty to calibrate correctly their tuning parameters so as
This work has been partly supported by the project Semantic Networkingwithin the common laboratory INRIA - Alcatel Lucent-Bell Labs.
to maximize the resource utilization and the QoS expected bythe end-users. This issue has been related in several formerstudies. For instance, [2], [5], [12], [13], [14] compare differ-ent measurement-based admission control (MBAC) solutionsusing various traffic conditions. These studies show that, forsome specific scenarios, some solutions meet the QoS butoften at the cost of a very small utilization level. However, formany other scenarios, in which the traffic condition differs,they violate the QoS target. One can therefore think that thereis still a lack of effectiveness for existing admission controlsolutions. It is the authors point of view that a possible meansto enhance MBAC solutions is to include a Knowledge Planein their measurement algorithms.
This paper introduces a novel admission control solutionbased on a Knowledge Plane. Our Knowledge-Based Admis-sion Control solution (KBAC) consists of three main stages:(i) collect measurements on the on-going traffic over thecommunication link; (ii) maintain an up-to-date broad viewof the link behavior, and feed it to a Knowledge Plane; (iii)model the observed link behavior by a mono-server queuewhose parameters are set automatically and which predictsthe expected QoS if a flow requesting admission were tobe accepted. Our KBAC solution provides a probabilisticguarantee whose admission threshold is either expressed, asa bounded delay or as a bounded loss rate. In this article, wepresent its application to the case of an admission thresholdexpressed as a maximum tolerable (bounded) delay.
Our new KBAC solution avoids the critical step of preciselycalibrating key parameters. The experimental results show thatour KBAC solution leads to a good trade-off between flowperformance and resource utilization. This ability stems fromthe quick and automatic adjustment of its admission policyaccording to the actual variations on the traffic conditions.
The remainder of this paper is organized as follows. Sec-tion II discusses the state of the art on admission controlsolutions. In Section III, we describe our new Knowledge-Based Admission Control (KBAC). Section IV is devotedto our experimental framework. Section V presents severalsimulation results illustrating the performance of our proposedsolution. Finally, Section VI concludes this paper.
II. RELATED WORK
There are different approaches to perform admission con-trol. First, endpoint admission control solutions make use
of probing packets that aim at reproducing the traffic pat-tern that the source is on the verge to transmit throughthe network [6]. This approach is referred to as an activetechnique since artificial traffic is injected into the networkto perform admission control. Second, admission control so-lutions can be based on the use of traffic descriptors. Theunderlying idea primarily consists in theoretically assessingthe current network workload using traffic descriptors. Then,the admission control uses the found value to decide, giventhe incoming flow traffic descriptor, whether or not to let itcome into the network. Clearly, such an approach requires toknow traffic descriptors for every on-going (accepted) flowas well as for any incoming flow [12]. Third, measurement-based admission control (MBAC) solutions rely exclusively onmeasurements to assess the workload of on-going traffic overeach communication link. Unlike the first type of solutions,these solutions are categorized as passive techniques. MBACsolutions differ from the second type of solutions since they donot require any explicit knowledge on the traffic descriptors ofon-going flows. Several MBAC solutions have been proposedin the literature. These solutions are generally thought tooperate on a single communication link, and the admissioncontrol must be repeated for each link along the path of theflow. These solutions are basically made up of two parts.First, they perform measurements on the on-going traffic,and deliver measured metrics (e.g., the residual capacity ofthe link). Second, they rely on an algorithm that includesa test operation, whose outcome decides whether or not tolet a new flow requesting admission come into the network.Existing MBAC solutions mainly differ by their measurementoperations and by the theoretical assumptions made on theon-going traffic.
The remainder of this section is restricted to highlight themeasured metrics required by some of the most known MBACsolutions. Guerin et al. were the first to introduce in [9] theconcept of Equivalent Capacity used in several admission con-trol solutions. The Equivalent Capacity of aggregated trafficover a communication link, C(ε), is defined as being such thatthe probability for the arrival data rate of aggregated traffic toexceed C(ε) is at most ε. Basically, any MBAC solution basedon Equivalent Capacity attempts to ensure that, for any linkon the path between the source and the destination, the rate ofthe flow requesting admission summed to the actual EquivalentCapacity keeps below the nominal link capacity. The formulafor the Equivalent Capacity given in [9] assumes a buffer-lessmodel and an aggregate arrival rate that follows a Normaldistribution. Floyd proposed in [7] an alternative formula forthe measurement of Equivalent Capacity based on Hoeffdingbounds. This formula uses an upper bound of the peak rate foreach admitted connection along with the measured aggregatearrival rate. In [8], Georgoulas et al. present an admissioncontrol solution based on the Equivalent Capacity given in [9].This solution uses measurements of the aggregate bandwidthonly, without keeping the state of any per-flow information. Inaddition, Georgoulas et al. include an Admission Policy Factorin their admission control algorithm that allows the operator to
tune its degree of conservativeness in terms of packet loss rate.These three latter solutions require measurements only on theutilization rate of each communication link to be run. In [11],Jamin et al. were the first to integrate in their admission controlthe queueing delay constraint. To be performed, this solutionrequires, in addition to a measurement on the actual utilizationrate of the link, a measurement on the waiting time being spentin the queue (buffer). Qiu and Knightly improve in [15] theworks of Jamin et al. by proposing an alternative measurementof the utilization rate of the link in order to have a better trafficcharacterization over this link. To do this, the authors introducethe notion of aggregate traffic envelopes.
Overall, existing admission control solutions may be diffi-cult to calibrate (and very often no clue is given to calibratethem), and their performance may be greatly dependent on thetraffic condition.
III. KNOWLEDGE-BASED ADMISSION CONTROL SCHEME
As opposed to MBAC solutions, our KBAC solution in-cludes an additional step, namely the Knowledge Plane, thatcomes in between the measurement algorithm and the decisionalgorithm. We now detail each of these steps.
A. Measurement algorithm
The measurement algorithm continuously monitors the ac-tivity of the communication link so as to collect measurementdata. These data are measured on a short time window WT ,and hence reflect the “instantaneous” behavior of the on-going traffic. For each time window of length 200 ms, wemeasure the actual throughput of the on-going traffic, denotedby X (packets/ms), together with another QoS performanceparameter, say P (i.e., packet delay, packet loss rate). Themeasured values of X and P are gathered together into onepair of measurements. We refer to the pairs of measurements,(X ,P ), as measurement points.
B. Knowledge Plane
Once measurement points have been collected, we aim atcharacterizing the evolution of P as a function of X , denotedby P = fP (X). This second part of our KBAC solutionconsists itself of two phases.
0 1 2 3 4 5 60
5
10
15
20
25
30
35
40
45
Throughput rate (packet/ms)
Packet
dela
y(m
s)
recently collected measurement pointscentroids pointsqueueing model
Fig. 1. Example of a Knowledge Plane, where P is the packet delay
First, we aim to partition n measurement points into k clus-ters in which each measurement point belongs to the cluster
with the nearest mean. To do this, we use K-means clusteringmethod [17]. Elements within a cluster are represented by asingle point, denoted by centroid point. We thus end up withk centroid points.
Second, using Begin et al. method [4], we attempt to auto-matically discover a queueing model that correctly reproducesthe behavior exhibited by centroid points. The parameters ofthe discovered queueing model are automatically determinedaccordingly. In our work, we limit the search for the modelto a single server queue model, namely, the M/G/1 queuewhen we deal with the packet delay, and the M/G/1/K queuewhen we deal with the packet loss rate. The discovered queuesupplies the function fP , which is of utmost importance forour Knowledge Plane. This method requires about 10 pointsto operate. Therefore, in our experiments, we use 10 centroidpoints. Though we do not have a formal proof, in all ourexperiments, the modeling method always succeeds to providean adequate and good fitting queueing model fP .
Figure 1 illustrates the measurement methodology describedabove. It shows an example of how we discover a queueingmodel, fP , whose performance match as closely as possiblethose known from the centroid points. We observe that a singleM/G/1 queue (with a mean rate of service of 5.01 packets/ms,a coefficient of variation equal to 2.02 and an offset equal to0.08, see [4] for more details) adequately reproduces the be-havior exhibited by centroid points. Note that, in this example,P corresponds to the packet delay.
Obviously the centroid points and the discovered queueingmodel, fP , that drives the behavior of the link need to beregularly updated. A significant asset of our method stems inthis update, which guarantees that fP adapts its evolution tothe real traffic condition. In our experiments, we update thecentroid points and fP every period Tkp. We let Tkp be equalto the highest value we found that yields to an up-to-date broadview of the link state, namely Tkp = 20 s
C. Decision algorithm
Finally the decision algorithm, which determines whetherto accept or not a flow, is based on a performance prediction.Thanks to the function fP delivered by the queueing model,it attempts to adequately estimate the expected performanceof the link if the traffic workload was to be increased by thisnew flow.
Let P be the expected value of P if a new flow requestingadmission, with a peak rate r, is accepted. Then we have:
P = fP (X + r) (1)
where fP defines the evolution of P against the throughput X ,and X reflects the adjusted throughput of the on-going traffic.Note that, we use an adjusted value of the throughput to avoidthe erratic behavior of X , since it is measured on a short timewindow WT . We explain later on how X is estimated.
It follows that our decision algorithm can be formalized as:a new flow is accepted if
P + ασp < P ∗ (2)
where P ∗ represents the target performance (recall that, itis typically a maximum tolerable delay or loss rate), σp isthe standard deviation of P , as delivered by the discoveredqueueing model, and α is a conservativeness tuning parameter.
We now detail carefully the parameters listed above. Thevalue of α is set so that on-going flows do not exceed theQoS target, with a probability Q. We define α using the one-sided Chebyshev’s inequality [1]. Typically, we set the valueof α to 1.7, so that Q = 0.75.
In the current form of our KBAC solution, we simply con-sider σp = P (which is true, if we assume an exponentialdistribution with mean P ).
where fP defines the evolution of P against the output rateX , and �X reflects the adjusted output rate of the on-goingtraffic. We will explain later how �X is actually computed.
Then we can simply formalize our decision algorithm as :a new flow is accepted if
�P + α�σp < PT (8)
where PT represents the target performance (typically a maxi-mum tolerable delay or loss rate), �σp is the standard deviationof P , as delivered by the discovered queueing model, and αis a conservativeness tuning parameter.
In our method, the performance target can either be theloss rate or the packet delay. Note that we did not considerthe case where the target loss rate and the target delay areboth specified since, following the queueing theory analysis,meeting a target loss rate implies an unknown but fixed targetqueuing delay, and vice versa. In this paper, we limit our focuson the delay.
We now detail carefully the parameters listed above. Thevalue of α is set so that on-going flows do not exceed theQoS target, with a probability Q. We define α using the one-sided Chebyshev’s inequality.
Fig. 2. Measurement of the adjusted output rate �X
�X is computed over the last M measurement windows oflength, WT , as follows:
�X =1
M
M�
m=1
Xm +
M�
m=1
m
M×
F�
f=1
rfm (9)
where Xm is the value of the output rate computed over themth measurement window, F is the number of accepted flowsover the mth measurement window and rf
m is the estimatedpeak rate of the f th new flow in the mth measurement window.Figure 2 illustrates the computation of �X . By doing so, wecompute an accurate value of �X , since we take into accounta ponderation of the peak rate of the accepted flows added tothe average value of the output rate.
The value of �X is frequently updated. In our case we updateits value at the end of each measurement window WT . We alsoprovide a means to accommodate the potential burstiness oftraffic (i.e., several new flows arrive within a measurementwindow WT ). Whenever a new flow, with a peak rate r, isaccepted, the value of �X is immediately updated to be �X + r.
D. Avoid the flood of information while ensuring centroidsdiversity
As said above, the Knowledge Plane maintains in real timean up-to-date wide view of the link state. This knowledge
is obtained though the measurement points. Given the hugenumber of collected measurement points (e.g., 300 new mea-surement points per minute if the length of the measurementwindow, WT , is set to 200 ms), our SBAC solution will rapidlybe overwhelmed by using all collected measurement points tocompute centroids points. To avoid this flood of information,we limit our focus to a subset made of n of these points.
However limiting the number of measurement points maycause a loss of information. To cope with this problem, thesimplest approach that would consist in limiting our focus tothe last n measurement points. Instead, we split the output rateinterval [0, Xmax] into S intervals of equal length, denotedby ls. Then, each point will necessary belong to one of theseintervals. After each measurement window WT , we replace theoldest measurement point by the latest computed measurementpoint, but with ensuring that there are at least ns measurementpoints within each output rate interval. By doing so, we avoidthe flood of information while ensuring the centroids diversitywhich is required for adequately discovering the queueingmodel. Figure 1 illustrates how we ensure the centroids di-versity. Although we do not have any measurement points atthe lowest level of the output rate, we are able to maintain acentroids point.
In our experiments, we limit the number of measurementpoints to 1000 (n = 1000) and we select ls = 1 packets/msand ns = 20.
E. Temporal coherence and system update
Our solution relies on the assumption of a strong tempo-ral coherence of the behavior of a communication link. Wesuppose that, within a certain time scale of length Tkp, theobserved performance afford a precious information for accu-rately predicting the future performance of the system. Saiddifferently, this temporal coherence can be expressed as:
∀(t1, t2) ∈ [t, t + Tkp]2, if Xt1 = Xt2 ⇒ Pt1 = Pt2 (10)
where Pt1 (resp. Pt2 ) is the performance parameter at time t1(resp. t2), and Xt1 (resp. Xt2 ) represents the output rate ofthe on-going traffic over the communication link at time t1(resp. t2).
In this work, we select Tkp = 20 s.
F. SBAC complexity
todo ...
IV. METHODOLOGY
The performance evaluation of an admission control canbe handled through different aspects. One can consider theoverhead costs for network nodes in terms of CPU time ormemory consumption, the ease of configuration or the qualityof the decision. Many studies comparing admission controlsolutions ([10], [4], [12]) aimed to quantify, for a given exper-imental scenario, the attained trade-off between of utilizationof the link and the packet loss rate or delay.
In our work, we aim at highlighting the ability of our newSBAC solution to achieve the maximum level of utilization
Rmk represents the maximal observed rate in the time scale
k. This time scale is equal to k sampling periods in the mth
measurement window. The rate of the aggregate traffic and itsstandard-deviation are estimated over the last M measurementwindows as follows:
Rk =M�
m=1
Rmk
Mand σ2
k =1
M − 1
M�
m=1
(Rmk − Rk)2. (3)
This measurement-based admission control solution consistsof two parts: a short time scale test that ensures that no packetis too long delayed, and a long time scale test that checksthat the flow requesting admission does not exceed the linkcapacity. Note that envelopes are used only to check the firstcondition. A new flow requesting admission with a peak rater is accepted if and only if:
maxk=1,...,t
{kτ(Rk + r + αEσk − C)} ≤ C × D (4)
andRt + r + αEσt ≤ C (5)
where D is the maximum delay requirement and αE is aconstant specifying the confidence level, Φ(αE), that on-goingflows do not experience any packet loss. Φ(αE) is defined as:
Φ(αE) ≈ 1√2πσk
� Rk+αEσk
−∞exp
�− (r − Rk)2
2σ2k
�dr. (6)
III. SEMANTIC-BASED ADMISSION CONTROL SCHEME
As said previously, our new admission control solution isbased on a semantic approach. In such approach, we acquireknowledge on existing flows via an analysis of the on-goingtraffic, and feed it to the Knowledge Plane. The KnowledgePlane holds a global picture of link status and distributes it tothe admission control, which in charge of deciding for eachnew flow, whether it accepts or rejects it.
As opposed to MBAC solutions, our SBAC solution in-cludes an additional step, namely the Knowledge Plane. Morespecifically, our SBAC solution is made up of three parts: ameasurement algorithm; a Knowledge Plane; and a decisionalgorithm.
A. Measurement algorithm
In our solution, we continuously monitor the activity ofthe communication link so as to collect measurement data.These data measured on a short time scale WT reflect theactual behavior of the on-going traffic. For each time window,WT , we measure the actual output rate of the on-going traffic,denoted by X (packets/ms), and another QoS performanceparameter, say P . P may correspond to the packet delay(including queueing delay in the buffer and transmission time),denoted by R, or to the packet loss rate L. The measuredvalues of X and P are gathered together into one pair ofmeasurements. We refer to the pairs of measurements, (X , P ),as measurement points.
B. Knowledge Plane
Once measurement points have been collected, we aim atcharacterizing the evolution of P as a function of X , denotedby P = fP (X). This second part of our SBAC solutionconsists itself of two phases.
0 1 2 3 4 5 60
10
20
30
40
50
60
Output rate (packet/ms)
Packet
dela
y(m
s)
measurement pointscentroids pointsqueueing model
Fig. 1. Example of a Knowledge Plane, where P is the packet delay
First, we aim to partition n measurement points into k clus-ters in which each measurement point belongs to the clusterwith the nearest mean. To do this, we use K-means clusteringmethod. Elements within a cluster are represented by a singlepoint, denoted by centroid point. We thus end up with kcentroids points.
Second, using Begin et al. method [3], we attempt to auto-matically discover a queueing model that correctly reproducesthe behavior exhibited by centroids points. The parametersof the discovered queueing model are automatically selectedaccordingly. In our work, we limit the search for the modelto one single server queue model, namely, the M/G/1 queuewhen we deal with the packet delay, and the M/G/1/K queuewhen we deal with the packet loss rate. The discovered queuesupplies the function fP , which is of utmost importance forour Knowledge Plane.
Figure 1 illustrates the measurement methodology describedabove. It shows an example of how we discover a queueingmodel, fP , whose performance parameters match as closelyas possible those known from the centroids points. We ob-serve that a single M/G/1 queue (with a mean service time of5.01 packets/ms, a coefficient of variation equal to 2.02 andan offset equal to 0.08, see [3] for its definition) adequatelyreproduces the behavior exhibited by centroids points. Notethat, in this example, P represents the packet delay.
C. Decision algorithm
Our algorithm makes its decision whether to accept or nota flow based on a performance prediction. It attempts to ad-equately estimate the expected performance of the link if thetraffic workload was to be increased by this new flow. To dothis, it relies on of fP as delivered by the queueing model.
Let �P be the expected value of P if a new flow requestingadmission, with a peak rate r, is accepted. Then we have:
�P = fP ( �X + r) (7)
on-goingtraffic
new accepted flows
where fP defines the evolution of P against the output rateX , and �X reflects the adjusted output rate of the on-goingtraffic. We will explain later how �X is actually computed.
Then we can simply formalize our decision algorithm as :a new flow is accepted if
�P + α�σp < PT (8)
where PT represents the target performance (typically a maxi-mum tolerable delay or loss rate), �σp is the standard deviationof P , as delivered by the discovered queueing model, and αis a conservativeness tuning parameter.
In our method, the performance target can either be theloss rate or the packet delay. Note that we did not considerthe case where the target loss rate and the target delay areboth specified since, following the queueing theory analysis,meeting a target loss rate implies an unknown but fixed targetqueuing delay, and vice versa. In this paper, we limit our focuson the delay.
We now detail carefully the parameters listed above. Thevalue of α is set so that on-going flows do not exceed theQoS target, with a probability Q. We define α using the one-sided Chebyshev’s inequality.
Fig. 2. Measurement of the adjusted output rate �X
�X is computed over the last M measurement windows oflength, WT , as follows:
�X =1
M
M�
m=1
Xm +
M�
m=1
m
M×
F�
f=1
rfm (9)
where Xm is the value of the output rate computed over themth measurement window, F is the number of accepted flowsover the mth measurement window and rf
m is the estimatedpeak rate of the f th new flow in the mth measurement window.Figure 2 illustrates the computation of �X . By doing so, wecompute an accurate value of �X , since we take into accounta ponderation of the peak rate of the accepted flows added tothe average value of the output rate.
The value of �X is frequently updated. In our case we updateits value at the end of each measurement window WT . We alsoprovide a means to accommodate the potential burstiness oftraffic (i.e., several new flows arrive within a measurementwindow WT ). Whenever a new flow, with a peak rate r, isaccepted, the value of �X is immediately updated to be �X + r.
D. Avoid the flood of information while ensuring centroidsdiversity
As said above, the Knowledge Plane maintains in real timean up-to-date wide view of the link state. This knowledge
is obtained though the measurement points. Given the hugenumber of collected measurement points (e.g., 300 new mea-surement points per minute if the length of the measurementwindow, WT , is set to 200 ms), our SBAC solution will rapidlybe overwhelmed by using all collected measurement points tocompute centroids points. To avoid this flood of information,we limit our focus to a subset made of n of these points.
However limiting the number of measurement points maycause a loss of information. To cope with this problem, thesimplest approach that would consist in limiting our focus tothe last n measurement points. Instead, we split the output rateinterval [0, Xmax] into S intervals of equal length, denotedby ls. Then, each point will necessary belong to one of theseintervals. After each measurement window WT , we replace theoldest measurement point by the latest computed measurementpoint, but with ensuring that there are at least ns measurementpoints within each output rate interval. By doing so, we avoidthe flood of information while ensuring the centroids diversitywhich is required for adequately discovering the queueingmodel. Figure 1 illustrates how we ensure the centroids di-versity. Although we do not have any measurement points atthe lowest level of the output rate, we are able to maintain acentroids point.
In our experiments, we limit the number of measurementpoints to 1000 (n = 1000) and we select ls = 1 packets/msand ns = 20.
E. Temporal coherence and system update
Our solution relies on the assumption of a strong tempo-ral coherence of the behavior of a communication link. Wesuppose that, within a certain time scale of length Tkp, theobserved performance afford a precious information for accu-rately predicting the future performance of the system. Saiddifferently, this temporal coherence can be expressed as:
∀(t1, t2) ∈ [t, t + Tkp]2, if Xt1 = Xt2 ⇒ Pt1 = Pt2 (10)
where Pt1 (resp. Pt2 ) is the performance parameter at time t1(resp. t2), and Xt1 (resp. Xt2 ) represents the output rate ofthe on-going traffic over the communication link at time t1(resp. t2).
In this work, we select Tkp = 20 s.
F. SBAC complexity
todo ...
IV. METHODOLOGY
The performance evaluation of an admission control canbe handled through different aspects. One can consider theoverhead costs for network nodes in terms of CPU time ormemory consumption, the ease of configuration or the qualityof the decision. Many studies comparing admission controlsolutions ([10], [4], [12]) aimed to quantify, for a given exper-imental scenario, the attained trade-off between of utilizationof the link and the packet loss rate or delay.
In our work, we aim at highlighting the ability of our newSBAC solution to achieve the maximum level of utilization
where fP defines the evolution of P against the output rateX , and �X reflects the adjusted output rate of the on-goingtraffic. We will explain later how �X is actually computed.
Then we can simply formalize our decision algorithm as :a new flow is accepted if
�P + α�σp < PT (8)
where PT represents the target performance (typically a maxi-mum tolerable delay or loss rate), �σp is the standard deviationof P , as delivered by the discovered queueing model, and αis a conservativeness tuning parameter.
In our method, the performance target can either be theloss rate or the packet delay. Note that we did not considerthe case where the target loss rate and the target delay areboth specified since, following the queueing theory analysis,meeting a target loss rate implies an unknown but fixed targetqueuing delay, and vice versa. In this paper, we limit our focuson the delay.
We now detail carefully the parameters listed above. Thevalue of α is set so that on-going flows do not exceed theQoS target, with a probability Q. We define α using the one-sided Chebyshev’s inequality.
Fig. 2. Measurement of the adjusted output rate �X
X1
XM
�X is computed over the last M measurement windows oflength, WT , as follows:
�X =1
M
M�
m=1
Xm +M�
m=1
m
M×
F�
f=1
rfm (9)
where Xm is the value of the output rate computed over themth measurement window, F is the number of accepted flowsover the mth measurement window and rf
m is the estimatedpeak rate of the f th new flow in the mth measurement window.Figure 2 illustrates the computation of �X . By doing so, wecompute an accurate value of �X , since we take into accounta ponderation of the peak rate of the accepted flows added tothe average value of the output rate.
The value of �X is frequently updated. In our case we updateits value at the end of each measurement window WT . We alsoprovide a means to accommodate the potential burstiness oftraffic (i.e., several new flows arrive within a measurementwindow WT ). Whenever a new flow, with a peak rate r, isaccepted, the value of �X is immediately updated to be �X + r.
D. Avoid the flood of information while ensuring centroidsdiversity
As said above, the Knowledge Plane maintains in real timean up-to-date wide view of the link state. This knowledgeis obtained though the measurement points. Given the hugenumber of collected measurement points (e.g., 300 new mea-surement points per minute if the length of the measurementwindow, WT , is set to 200 ms), our SBAC solution will rapidlybe overwhelmed by using all collected measurement points tocompute centroids points. To avoid this flood of information,we limit our focus to a subset made of n of these points.
However limiting the number of measurement points maycause a loss of information. To cope with this problem, thesimplest approach that would consist in limiting our focus tothe last n measurement points. Instead, we split the output rateinterval [0, Xmax] into S intervals of equal length, denotedby ls. Then, each point will necessary belong to one of theseintervals. After each measurement window WT , we replace theoldest measurement point by the latest computed measurementpoint, but with ensuring that there are at least ns measurementpoints within each output rate interval. By doing so, we avoidthe flood of information while ensuring the centroids diversitywhich is required for adequately discovering the queueingmodel. Figure 1 illustrates how we ensure the centroids di-versity. Although we do not have any measurement points atthe lowest level of the output rate, we are able to maintain acentroids point.
In our experiments, we limit the number of measurementpoints to 1000 (n = 1000) and we select ls = 1 packets/msand ns = 20.
E. Temporal coherence and system update
Our solution relies on the assumption of a strong tempo-ral coherence of the behavior of a communication link. Wesuppose that, within a certain time scale of length Tkp, theobserved performance afford a precious information for accu-rately predicting the future performance of the system. Saiddifferently, this temporal coherence can be expressed as:
∀(t1, t2) ∈ [t, t + Tkp]2, if Xt1 = Xt2 ⇒ Pt1 = Pt2 (10)
where Pt1 (resp. Pt2 ) is the performance parameter at time t1(resp. t2), and Xt1 (resp. Xt2 ) represents the output rate ofthe on-going traffic over the communication link at time t1(resp. t2).
In this work, we select Tkp = 20 s.
F. SBAC complexity
todo ...
IV. METHODOLOGY
The performance evaluation of an admission control canbe handled through different aspects. One can consider theoverhead costs for network nodes in terms of CPU time ormemory consumption, the ease of configuration or the qualityof the decision. Many studies comparing admission control
Fig. 2. Estimation of the adjusted throughput X
X is computed over the last M measurement windows oflength WT , as follows:
X =1
M
M∑
m=1
Xm +
M∑
m=1
m
M×
Fm∑
f=1
rfm (3)
where Xm is the value of the throughput computed over themth measurement window, Fm is the number of acceptedflows over the mth measurement window and rfm is the esti-mated peak rate of the f th new flow in the mth measurementwindow. Figure 2 illustrates the computation of X . By doingso, we provide a smooth throughput X , comparable to X,that takes into account a ponderation of the peak rate of theaccepted flows added to the average value of the throughput.Of course the value of X needs to be regularly updated. Inour experiments we update its value at the end of each mea-surement window WT .
We also provide a means to accommodate the potentialburstiness of traffic (i.e., several new flows arrive within ameasurement window WT ). Whenever a new flow, with a peakrate r, is accepted, the value of X is immediately updated tobe X + r.
D. Avoid the flood of information while ensuring centroidsdiversity
As said above, the Knowledge Plane maintains in real timean up-to-date broad view of the link state. This knowledgeis obtained through the measurement points. Given the hugenumber of collected measurement points (e.g., 300 new mea-surement points per minute with WT = 200 ms), our KBACsolution will rapidly be overwhelmed by measurement points
when computing centroid points. To avoid this flood of infor-mation, we limit our focus to a subset made of n of thesepoints.
On the other hand, limiting the number of measurementpoints may cause a loss of information (since the n points mayfall in the same range of throughput). To address this problem,we split the throughput interval [0, Xmax] into S intervalsof equal length. Each measurement point necessary belongsto one of these intervals. After each measurement windowWT , we replace the oldest measurement point by the latestcomputed measurement point, while ensuring that there are atleast ns measurement points within each throughput interval.By doing so, we both avoid the flood of information and ensurethe centroids diversity which is required for adequately discov-ering the queueing model. Figure 1 illustrates the centroidsdiversity. Although recently collected measurement points areconcentrated at the highest level of the throughput, centroidpoints are widely distributed and covers a broader range.
It is also worth noting that KBAC solution requires a warm-up period to ensure a wide enough distribution of the centroidpoints. This warm-up period typically lasts for less than acouple of minutes for an active link.
In our experiments, we limit the number of measurementpoints to 1000 (n = 1000) and we select S = 6 and ns = 20.
E. Temporal coherence
As a matter of fact, our solution relies on the assumptionof a temporal coherence for the behavior of a communicationlink. We suppose that, within a certain period of time T ′
(typically tens of seconds), the observed performance afforda precious information for accurately predicting the futureperformance of the communication link. Said differently,
∀(t1, t2) ∈ [t, t+ T ′]2, Xt1 = Xt2 ⇒ Pt1 ' Pt2 (4)
where Xt1 (resp. Xt2 ) is the throughput of the on-going trafficover the communication link at time t1 (resp. t2), and Pt1(resp. Pt2 ) is the performance parameter at time t1 (resp. t2).
IV. EXPERIMENTAL FRAMEWORK
In this section, we detail the framework we use to assessthe behavior of our admission control.
A. Description of the scenario
We consider a communication link of capacity 10 Mb/s. Thesize of the buffer is set to 60 ms. The queueing discipline isFIFO (First In First Out) and the queue management algorithmis Drop-Tail.
Incoming flowsrequesting admission
Initial source
Aggregation of accepted VBR flowsAggregation of accepted VBR flows
Real traces
Fig. 3. On-going traffic conditions over the communication link
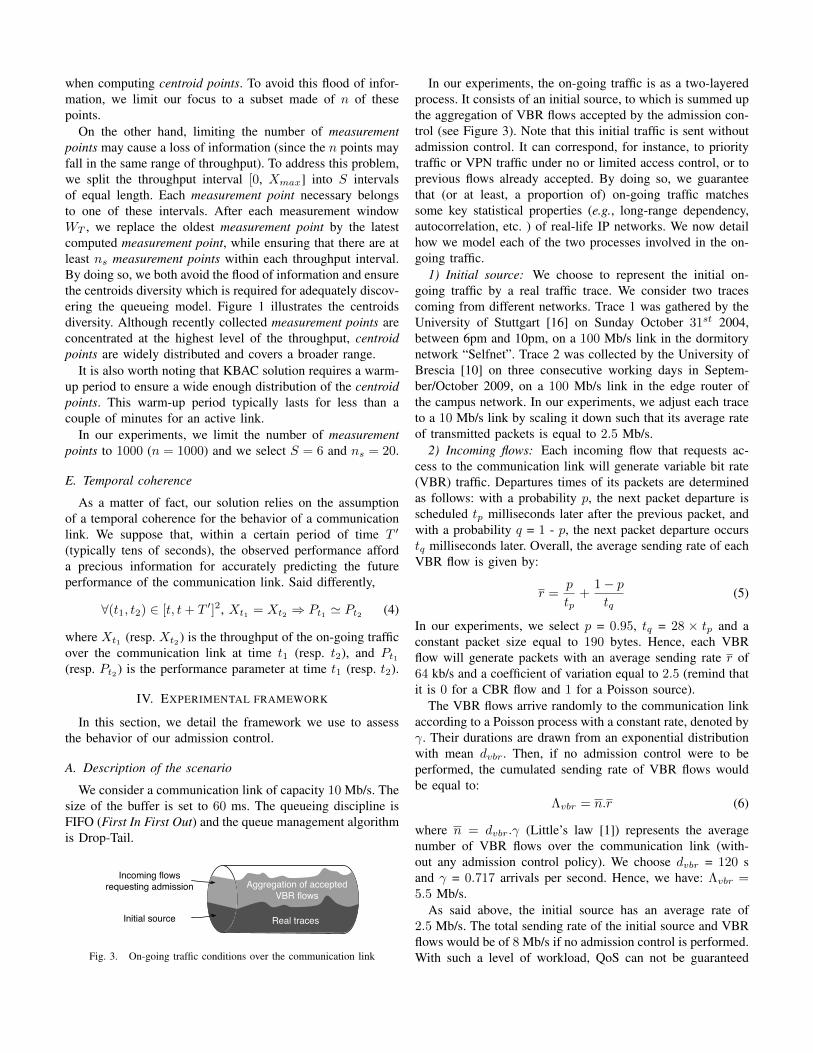
In our experiments, the on-going traffic is as a two-layeredprocess. It consists of an initial source, to which is summed upthe aggregation of VBR flows accepted by the admission con-trol (see Figure 3). Note that this initial traffic is sent withoutadmission control. It can correspond, for instance, to prioritytraffic or VPN traffic under no or limited access control, or toprevious flows already accepted. By doing so, we guaranteethat (or at least, a proportion of) on-going traffic matchessome key statistical properties (e.g., long-range dependency,autocorrelation, etc. ) of real-life IP networks. We now detailhow we model each of the two processes involved in the on-going traffic.
1) Initial source: We choose to represent the initial on-going traffic by a real traffic trace. We consider two tracescoming from different networks. Trace 1 was gathered by theUniversity of Stuttgart [16] on Sunday October 31st 2004,between 6pm and 10pm, on a 100 Mb/s link in the dormitorynetwork “Selfnet”. Trace 2 was collected by the University ofBrescia [10] on three consecutive working days in Septem-ber/October 2009, on a 100 Mb/s link in the edge router ofthe campus network. In our experiments, we adjust each traceto a 10 Mb/s link by scaling it down such that its average rateof transmitted packets is equal to 2.5 Mb/s.
2) Incoming flows: Each incoming flow that requests ac-cess to the communication link will generate variable bit rate(VBR) traffic. Departures times of its packets are determinedas follows: with a probability p, the next packet departure isscheduled tp milliseconds later after the previous packet, andwith a probability q = 1 - p, the next packet departure occurstq milliseconds later. Overall, the average sending rate of eachVBR flow is given by:
r =p
tp+
1− ptq
(5)
In our experiments, we select p = 0.95, tq = 28 × tp and aconstant packet size equal to 190 bytes. Hence, each VBRflow will generate packets with an average sending rate r of64 kb/s and a coefficient of variation equal to 2.5 (remind thatit is 0 for a CBR flow and 1 for a Poisson source).
The VBR flows arrive randomly to the communication linkaccording to a Poisson process with a constant rate, denoted byγ. Their durations are drawn from an exponential distributionwith mean dvbr. Then, if no admission control were to beperformed, the cumulated sending rate of VBR flows wouldbe equal to:
Λvbr = n.r (6)
where n = dvbr.γ (Little’s law [1]) represents the averagenumber of VBR flows over the communication link (with-out any admission control policy). We choose dvbr = 120 sand γ = 0.717 arrivals per second. Hence, we have: Λvbr =5.5 Mb/s.
As said above, the initial source has an average rate of2.5 Mb/s. The total sending rate of the initial source and VBRflows would be of 8 Mb/s if no admission control is performed.With such a level of workload, QoS can not be guaranteed
since accepting all flows requesting admission leads to con-gestions which in turn would yield to excessively high levelsof packet delays.
It is then the goal of admission control to limit the numberof VBR flows so as to keep the total rate of all combinedtraffic at the “right” level, and thus preventing packets fromexperiencing excessive queueing time in the buffer.
B. Estimating the peak rate of incoming flows
In our experiments, we assume no explicit knowledge onincoming flows. In some cases, this knowledge can be obtainedvia signaling and/or the use of a token bucket. However, tokenbuckets are difficult to parameterize and may induce conser-vative results for the admission control (since the decisionalgorithm uses a conservative value for r). In this work, weopt rather for a simple approach that does not need any sig-naling as it is only based on data packets. We detail here theprocedure we implement to let the network estimate the peakrate of a new flow requesting admission.
To estimate the peak rate of a new incoming flow, we trackthe first A packets of this flow1. We use a sliding window oflength equal to a packets. For every possible window on thefirst A packets, we compute the average rate. Finally, the peakrate corresponds to the highest value among the (A − a + 1)windows. In this work, the estimated peak rate of an injectedflow is computed based on the 20 first packets (A = 20) with asliding window of length equal to 5 packets (a = 5). Note thatin our experiments, the VBR flows may achieve a maximalrate of 150 kb/s.
C. Ideal admission control
For sake of comparison, we include in our experiments theresults that should be obtainable by an ideal admission controlso as to benchmark the performance of our new KBAC solu-tion. This ideal admission control should accept the maximumnumber of flows, thus achieving the maximum utilization rate,while successfully meeting the QoS target (i.e., neither falsepositives nor false negatives). Note that this ideal admissioncontrol can be viewed as an “Oracle” since its requires knowl-edge, not only of the past and the present, but also of the futureincoming flows.
Given the huge number of flows coming into the link duringthe numerical experiment (more than 1000), an exhaustiveapproach that will consider every feasible combination of ac-cepted / rejected flows will lead to approximately 21000 '10301 possible sequences, and thus would be intractable. Werather rely on an iterative method to determine the sequenceof flows accepted by the ideal admission control under thepolicy First come, First served (if the flow does not violatethe QoS target). At iteration (i), k flows have been accepted(some of them may still be going on) and j have been refused.As soon as a new flow will arrive, we will accept it, andthen we will keep the simulation running until this flow endsbut, meanwhile, any subsequent VBR flow will be refused.
1This property implies that a flow can be rejected even though its firstpackets were transmitted.
Once the flow is done, we check whether the QoS target waspreserved for this flow as well as for any previously acceptedflow. If this is the case, then we grant this flow as acceptable bythe ideal admission control and the value of k is incremented.Otherwise, the flow will not be part of the sought sequence offlows and j is incremented.D. Investigated MBAC solutions
In this section, we outline the two investigated MBAC so-lutions which we will use to compare to our new admissioncontrol solution. We limit both solutions to the case of delay.
1) Measured Sum (M.S.): This solution rejects an incomingflow requesting admission if admitting this new flow violatesthe following constraint:
D +biC< D, (7)
where D is the delay bound, D is the measured delay and bi isthe burstiness of the flow (see details in [12]). The measureddelay, denoted by D, tracks the maximum queueing delayof every packet computed over a time window of length T .The value of D is updated at the end of each measurementwindow. Whenever an individual delay measurement exceedsthe estimated maximum queueing delay, the value of D is alsoupdated to be λ times this sampled delay. Finally, we updatethe measured delay to the left side of (7), whenever a newflow is admitted. In our experiments, we select T = 4 s.
2) Aggregate Traffic Envelopes (Env.): Qiu and Knightlypresent in [15] a MBAC solution that aims to characterizethe aggregate traffic rate by the maximal rate envelope. To dothis, they consider a time window of length T divided intot sampling periods of equal length. Within a time window,maximal rate measurements are done on different time scales.Rml represents the maximal observed rate in the time scalel. This time scale is equal to l sampling periods in the mth
measurement window. The rate of the aggregate traffic and itsstandard-deviation are estimated over the last M measurementwindows as follows:
Rl =M∑
m=1
RmlM
and σ2l =
1
M − 1
M∑
m=1
(Rml −Rl)2. (8)
This measurement-based admission control ensures that nopacket is too long delayed. A new flow requesting admissionwith a peak rate r is accepted if and only if:
maxl=1,...,t
{lτ(Rl + r + αEσl − C)} ≤ C ×D (9)
where D is the maximum delay requirement and αE is aconstant specifying the confidence level, Φ(αE), that on-goingflows do not experience any packet loss. Φ(αE) is defined as:
Φ(αE) ≈ 1√2πσl
∫ Rl+αEσl
−∞exp
(− (r −Rl)2
2σ2l
)dr. (10)
In our experiments, we consider 20 measurement windows(M = 20) of length 200 ms (T = 200 ms), which is inlinewith the considered measurement window for the MeasuredSum. Note that we also evaluate our KBAC solution underthese conditions.
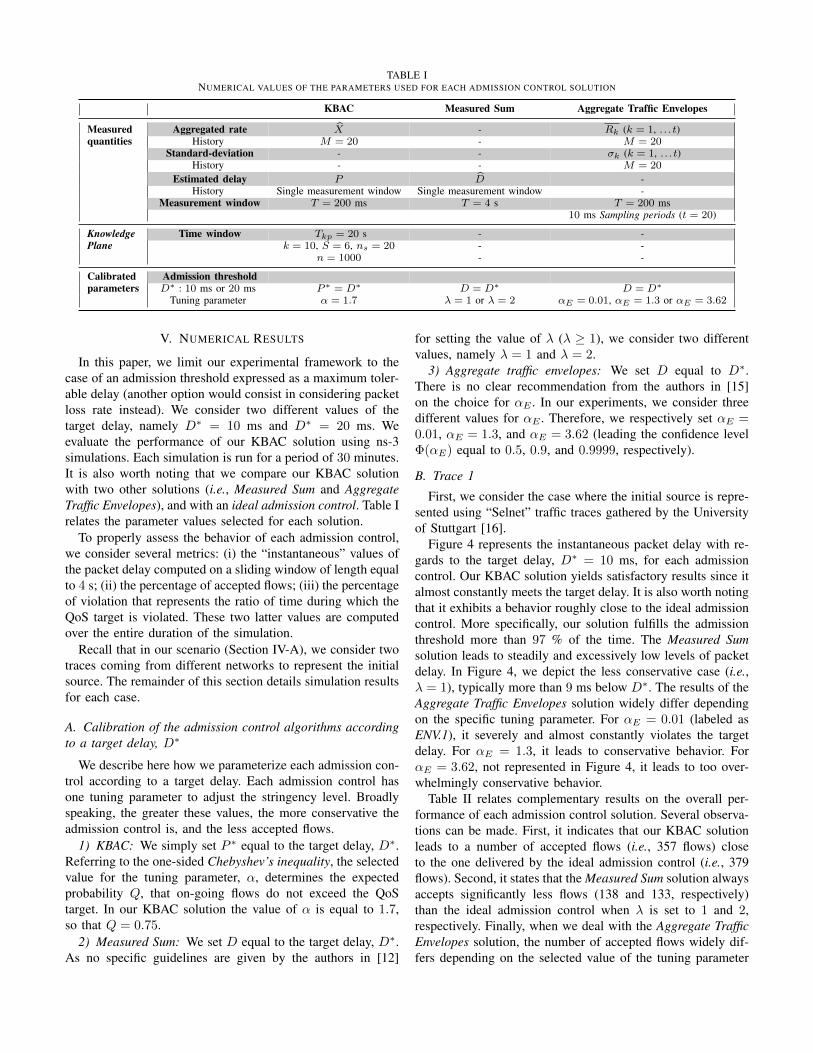
TABLE INUMERICAL VALUES OF THE PARAMETERS USED FOR EACH ADMISSION CONTROL SOLUTION
KBAC Measured Sum Aggregate Traffic Envelopes
Measured Aggregated rate X - Rk (k = 1, . . . t)quantities History M = 20 - M = 20
Standard-deviation - - σk (k = 1, . . . t)History - - M = 20
Estimated delay P D -History Single measurement window Single measurement window -
Measurement window T = 200 ms T = 4 s T = 200 ms10 ms Sampling periods (t = 20)
Knowledge Time window Tkp = 20 s - -Plane k = 10, S = 6, ns = 20 - -
n = 1000 - -
Calibrated Admission thresholdparameters D∗ : 10 ms or 20 ms P ∗ = D∗ D = D∗ D = D∗
Tuning parameter α = 1.7 λ = 1 or λ = 2 αE = 0.01, αE = 1.3 or αE = 3.62
V. NUMERICAL RESULTS
In this paper, we limit our experimental framework to thecase of an admission threshold expressed as a maximum toler-able delay (another option would consist in considering packetloss rate instead). We consider two different values of thetarget delay, namely D∗ = 10 ms and D∗ = 20 ms. Weevaluate the performance of our KBAC solution using ns-3simulations. Each simulation is run for a period of 30 minutes.It is also worth noting that we compare our KBAC solutionwith two other solutions (i.e., Measured Sum and AggregateTraffic Envelopes), and with an ideal admission control. Table Irelates the parameter values selected for each solution.
To properly assess the behavior of each admission control,we consider several metrics: (i) the “instantaneous” values ofthe packet delay computed on a sliding window of length equalto 4 s; (ii) the percentage of accepted flows; (iii) the percentageof violation that represents the ratio of time during which theQoS target is violated. These two latter values are computedover the entire duration of the simulation.
Recall that in our scenario (Section IV-A), we consider twotraces coming from different networks to represent the initialsource. The remainder of this section details simulation resultsfor each case.
A. Calibration of the admission control algorithms accordingto a target delay, D∗
We describe here how we parameterize each admission con-trol according to a target delay. Each admission control hasone tuning parameter to adjust the stringency level. Broadlyspeaking, the greater these values, the more conservative theadmission control is, and the less accepted flows.
1) KBAC: We simply set P ∗ equal to the target delay, D∗.Referring to the one-sided Chebyshev’s inequality, the selectedvalue for the tuning parameter, α, determines the expectedprobability Q, that on-going flows do not exceed the QoStarget. In our KBAC solution the value of α is equal to 1.7,so that Q = 0.75.
2) Measured Sum: We set D equal to the target delay, D∗.As no specific guidelines are given by the authors in [12]
for setting the value of λ (λ ≥ 1), we consider two differentvalues, namely λ = 1 and λ = 2.
3) Aggregate traffic envelopes: We set D equal to D∗.There is no clear recommendation from the authors in [15]on the choice for αE . In our experiments, we consider threedifferent values for αE . Therefore, we respectively set αE =0.01, αE = 1.3, and αE = 3.62 (leading the confidence levelΦ(αE) equal to 0.5, 0.9, and 0.9999, respectively).
B. Trace 1
First, we consider the case where the initial source is repre-sented using “Selnet” traffic traces gathered by the Universityof Stuttgart [16].
Figure 4 represents the instantaneous packet delay with re-gards to the target delay, D∗ = 10 ms, for each admissioncontrol. Our KBAC solution yields satisfactory results since italmost constantly meets the target delay. It is also worth notingthat it exhibits a behavior roughly close to the ideal admissioncontrol. More specifically, our solution fulfills the admissionthreshold more than 97 % of the time. The Measured Sumsolution leads to steadily and excessively low levels of packetdelay. In Figure 4, we depict the less conservative case (i.e.,λ = 1), typically more than 9 ms below D∗. The results of theAggregate Traffic Envelopes solution widely differ dependingon the specific tuning parameter. For αE = 0.01 (labeled asENV.1), it severely and almost constantly violates the targetdelay. For αE = 1.3, it leads to conservative behavior. ForαE = 3.62, not represented in Figure 4, it leads to too over-whelmingly conservative behavior.
Table II relates complementary results on the overall per-formance of each admission control solution. Several observa-tions can be made. First, it indicates that our KBAC solutionleads to a number of accepted flows (i.e., 357 flows) closeto the one delivered by the ideal admission control (i.e., 379flows). Second, it states that the Measured Sum solution alwaysaccepts significantly less flows (138 and 133, respectively)than the ideal admission control when λ is set to 1 and 2,respectively. Finally, when we deal with the Aggregate TrafficEnvelopes solution, the number of accepted flows widely dif-fers depending on the selected value of the tuning parameter

TABLE IIADMISSION CONTROL SOLUTIONS PERFORMANCE OVERALL THE SIMULATION TIME USING TRACE 1
KBAC Measured Sum Aggregate Traffic Envelopes Ideal Admission Controlλ = 1 λ = 2 αE = 0.01 αE = 1.3 αE = 3.62
Number of accepted flows 357 246 241 400 310 156 379Percentage of accepted flows 28.18% 19.42% 19.02% 31.57% 24.47% 12.31% 29.91%Percentage of violation 2.22% 0% 0% 55.11% 0% 0% 0%
Fig. 4. Instantaneous performance of admission control solutions using trace 1
αE . It respectively accepts around 70 and 220 flows less thanthe ideal admission control for αE = 1.3 and 3.62, respec-tively. On the other hand, when αE is set to 0.01, this lattersolution accepts an exceedingly large number of flows whichresults in frequent instantaneous packet delays much above theadmission threshold (up to 55% of time).
C. Trace 2
We now consider the case where the initial source is rep-resented using traffic traces gathered from the University ofBrescia [10]. Figure 5 and Table III relate the results for atarget delay D∗ = 20 ms.
Figure 5 depicts the instantaneous packet delay obtained byeach admission control solution. Our KBAC solution fulfillsthe admission threshold about 75 % of the time (Table III). Onthe other hand, when the QoS target is violated, one shouldnote that it lasts only for relatively short periods of time (typ-ically less than 10 s). Furthermore, the magnitudes of thesedepartures are generally of moderate size (less than 10 ms overD∗). This result highlights the ability of our KBAC solutionto rapidly and automatically adjust its admission policy ac-cording to the actual variations on the traffic conditions. TheMeasured Sum solution leads to a slightly more conservativebehavior which is in line with previous results (Section V-B).Regarding the Aggregate Traffic Envelopes solution, its resultswidely differ depending on the specific tuning parameter. ForαE = 0.01 and αE = 1.3, it severely violates the target delay.For αE = 3.62, not represented in Figure 5, it leads to verylow level of packet delay.
We now turn to Table III. It states that the ideal admissioncontrol can accept up to 406 flows. It also indicates that ourKBAC solution leads to a number of accepted flows (i.e.,400 flows) close to the one delivered by the ideal admissioncontrol. Finally, when we deal with the investigated solutions,
the number of accepted flows widely differs. The MeasuredSum solution accepts around 32 flows less than the ideal ad-mission control. Furthermore, the Aggregate Traffic Envelopesaccepts an exceedingly large number of flows when αE isequal to 0.01 and 1.3 or alternatively less number of flowswhen αE is set to 3.62 than the ideal admission control.
To conclude, it is worth noting that in the case of Aggre-gate Traffic Envelopes a given value of αE can lead to anexceedingly conservative behavior or conversely to a weakcontrol depending on the nature of the traffic. This underlinesthe difficulty of precisely calibrating key parameters so as tofulfill the QoS target. Our solution avoids this critical step.
D. Computing overhead
In this section, we attempt to quantify the computationaloverhead of our KBAC solution. To begin with, we focuson the computational complexity brought by its measurementprocess. Clearly, the number of measurement points collectedmeanwhile is M . Note that it is also M for the Measured Sumsolution whereas it is approximately M2/2 for the AggregateTraffic Envelopes.
Now we turn to the complexity brought by the KnowledgePlane. First, the complexity of the K-means clustering algo-rithm is well-known to be in O(k.n.t), where k is the numberof centroid points, n the number of measurement points to beclassified, and t the number of iterations (typically, t << n).Second, regarding the discovery of the fitting queueing modelfP , the search for parameter values greatly depends on thenumber of parameters and on the number of centroids points.In our case, since we are considering a simple M/G/1 queuewith 3 parameters and 10 centroids points, the appropriatequeue is quickly found. See [3] for more details. Thus, andnot surprisingly, our KBAC solution, which includes an extrastage (i.e., the Knowledge Plane), leads to additional overheads
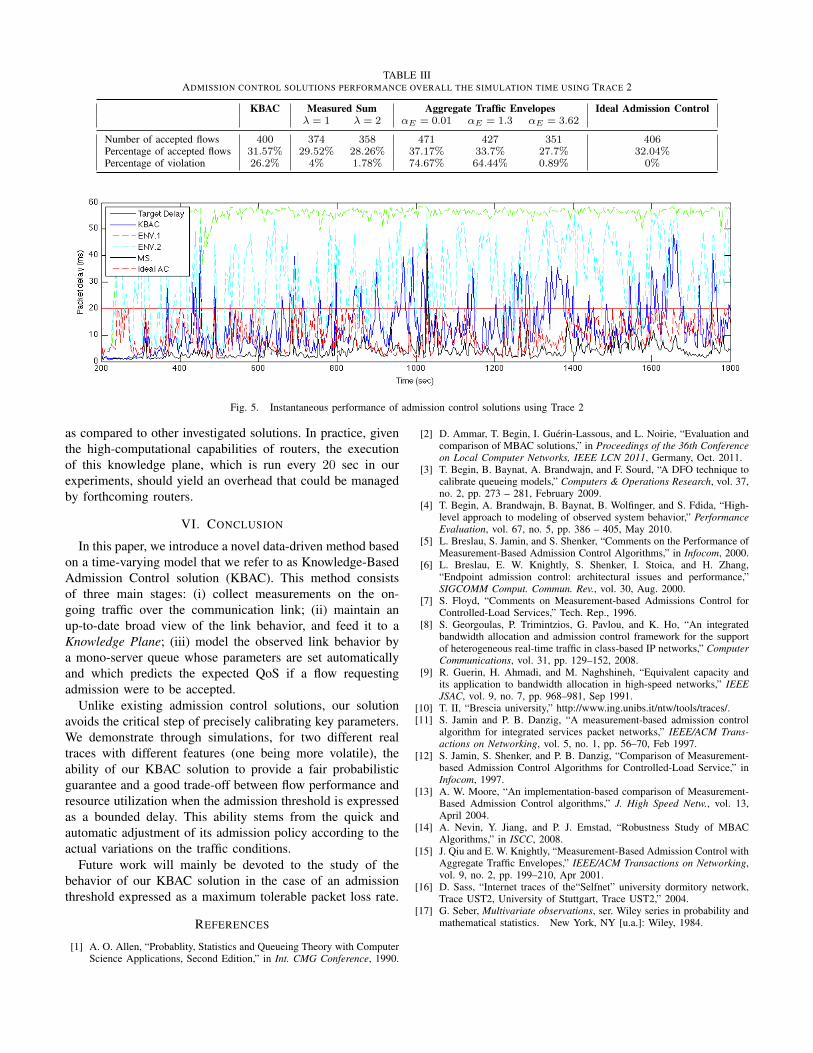
TABLE IIIADMISSION CONTROL SOLUTIONS PERFORMANCE OVERALL THE SIMULATION TIME USING TRACE 2
KBAC Measured Sum Aggregate Traffic Envelopes Ideal Admission Controlλ = 1 λ = 2 αE = 0.01 αE = 1.3 αE = 3.62
Number of accepted flows 400 374 358 471 427 351 406Percentage of accepted flows 31.57% 29.52% 28.26% 37.17% 33.7% 27.7% 32.04%Percentage of violation 26.2% 4% 1.78% 74.67% 64.44% 0.89% 0%
Fig. 5. Instantaneous performance of admission control solutions using Trace 2
as compared to other investigated solutions. In practice, giventhe high-computational capabilities of routers, the executionof this knowledge plane, which is run every 20 sec in ourexperiments, should yield an overhead that could be managedby forthcoming routers.
VI. CONCLUSION
In this paper, we introduce a novel data-driven method basedon a time-varying model that we refer to as Knowledge-BasedAdmission Control solution (KBAC). This method consistsof three main stages: (i) collect measurements on the on-going traffic over the communication link; (ii) maintain anup-to-date broad view of the link behavior, and feed it to aKnowledge Plane; (iii) model the observed link behavior bya mono-server queue whose parameters are set automaticallyand which predicts the expected QoS if a flow requestingadmission were to be accepted.
Unlike existing admission control solutions, our solutionavoids the critical step of precisely calibrating key parameters.We demonstrate through simulations, for two different realtraces with different features (one being more volatile), theability of our KBAC solution to provide a fair probabilisticguarantee and a good trade-off between flow performance andresource utilization when the admission threshold is expressedas a bounded delay. This ability stems from the quick andautomatic adjustment of its admission policy according to theactual variations on the traffic conditions.
Future work will mainly be devoted to the study of thebehavior of our KBAC solution in the case of an admissionthreshold expressed as a maximum tolerable packet loss rate.
REFERENCES
[1] A. O. Allen, “Probablity, Statistics and Queueing Theory with ComputerScience Applications, Second Edition,” in Int. CMG Conference, 1990.
[2] D. Ammar, T. Begin, I. Guerin-Lassous, and L. Noirie, “Evaluation andcomparison of MBAC solutions,” in Proceedings of the 36th Conferenceon Local Computer Networks, IEEE LCN 2011, Germany, Oct. 2011.
[3] T. Begin, B. Baynat, A. Brandwajn, and F. Sourd, “A DFO technique tocalibrate queueing models,” Computers & Operations Research, vol. 37,no. 2, pp. 273 – 281, February 2009.
[4] T. Begin, A. Brandwajn, B. Baynat, B. Wolfinger, and S. Fdida, “High-level approach to modeling of observed system behavior,” PerformanceEvaluation, vol. 67, no. 5, pp. 386 – 405, May 2010.
[5] L. Breslau, S. Jamin, and S. Shenker, “Comments on the Performance ofMeasurement-Based Admission Control Algorithms,” in Infocom, 2000.
[6] L. Breslau, E. W. Knightly, S. Shenker, I. Stoica, and H. Zhang,“Endpoint admission control: architectural issues and performance,”SIGCOMM Comput. Commun. Rev., vol. 30, Aug. 2000.
[7] S. Floyd, “Comments on Measurement-based Admissions Control forControlled-Load Services,” Tech. Rep., 1996.
[8] S. Georgoulas, P. Trimintzios, G. Pavlou, and K. Ho, “An integratedbandwidth allocation and admission control framework for the supportof heterogeneous real-time traffic in class-based IP networks,” ComputerCommunications, vol. 31, pp. 129–152, 2008.
[9] R. Guerin, H. Ahmadi, and M. Naghshineh, “Equivalent capacity andits application to bandwidth allocation in high-speed networks,” IEEEJSAC, vol. 9, no. 7, pp. 968–981, Sep 1991.
[10] T. II, “Brescia university,” http://www.ing.unibs.it/ntw/tools/traces/.[11] S. Jamin and P. B. Danzig, “A measurement-based admission control
algorithm for integrated services packet networks,” IEEE/ACM Trans-actions on Networking, vol. 5, no. 1, pp. 56–70, Feb 1997.
[12] S. Jamin, S. Shenker, and P. B. Danzig, “Comparison of Measurement-based Admission Control Algorithms for Controlled-Load Service,” inInfocom, 1997.
[13] A. W. Moore, “An implementation-based comparison of Measurement-Based Admission Control algorithms,” J. High Speed Netw., vol. 13,April 2004.
[14] A. Nevin, Y. Jiang, and P. J. Emstad, “Robustness Study of MBACAlgorithms,” in ISCC, 2008.
[15] J. Qiu and E. W. Knightly, “Measurement-Based Admission Control withAggregate Traffic Envelopes,” IEEE/ACM Transactions on Networking,vol. 9, no. 2, pp. 199–210, Apr 2001.
[16] D. Sass, “Internet traces of the“Selfnet” university dormitory network,Trace UST2, University of Stuttgart, Trace UST2,” 2004.
[17] G. Seber, Multivariate observations, ser. Wiley series in probability andmathematical statistics. New York, NY [u.a.]: Wiley, 1984.