Embed Size (px)
Citation preview
Reprinting of this proof for distribution or for posting on Web sites is notpermitted. Authors may request permission to reprint or post on theirpersonal or company Web site once the final version of the paper has beenpublished. A reprint permission form may be found at www.ashrae.org.
Future Advanced Windows forZero-Energy Homes
Joshua Apte Dariush Arasteh, P.E. Yu Joe HuangMember ASHRAE Member ASHRAE
KC-03-12-3
ABSTRACT
Over the past 15 years, low-emissivity and other techno-logical improvements have significantly improved the energyefficiency of windows sold in the United States. However, asinterest increases in the concept of zero-energy homes—build-ings that do not consume any nonrenewable or net energy fromthe utility grid—even today’s highest-performance windowproducts will not be sufficient. This simulation study comparestoday’s typical residential windows, today’s most efficient resi-dential windows, and several options for advanced windowtechnologies, including products with improved fixed or staticproperties and products with dynamic solar heat gain proper-ties. Nine representative window products are examined ineight representative U.S. climates. Annual energy and peakdemand impacts are investigated. We conclude that a newgeneration of window products is necessary for zero-energyhomes if windows are not to be an energy drain on these homes.Windows with dynamic solar heat gain properties are found tooffer significant potential in reducing energy use and peakdemands in northern and central climates, while windows withvery low (static) solar heat gain properties offer the mostpotential in southern climates.
INTRODUCTION
During the past 15 years, low-emissivity (low-e) glazingsand other improvements in window technology have signifi-cantly reduced window-related energy use and peak demandin residential buildings. Estimates indicate that more than 40%of windows sold today have low-e coatings (Ducker 2000),and low-e products are expected to dominate the market in thenear future. Despite the energy advantages of low-e coatings,windows still represent a significant energy liability in resi-
dential buildings. Approximately 2.7 quads (2.8 EJ; AppendixA) of the total 9.6 quads (10.1 EJ) of source energy used forresidential heating and cooling is attributable to today’swindow stock. This amounts to nearly three percent of totalU.S. energy consumption, or a cost of more than $25 billion(DOE 2002). If all windows in today’s residential stock werelow-e, the energy use attributable to windows would drop to anestimated 1.6 quads (1.7 EJ; Appendix B).
However, as interest increases in the concept of zero-energy homes—buildings that do not consume any non-renewable or net energy from the utility grid—even today’shighest-performance window products will not be able to meetthe requirements of a zero-energy home. A new generation ofhighly efficient windows will require new technologies. Astoday’s highly efficient (“super”) windows tend to be climate-specific, one way to improve window energy efficiency wouldbe to develop dynamic fenestration systems that can alter theirsolar heat gain properties according to seasonal/temperaturevariations. This paper describes a simulation study thatcompares the performance of currently available windows,future windows with dynamic solar heat gain properties, andfuture windows that represent only improvements in the staticproperties of today’s highly efficient super windows. Perfor-mance was studied for different U.S. climates.
In order to understand the advantages of a dynamicwindow system, it is important to understand the limitationson the performance of current high-performance, low-ewindows. Today’s low-e windows are designed to address theparameters that are typically used to quantify energy perfor-mance: U-factor (a measure of the heat lost because of indoor-outdoor temperature differences) and solar heat gain coeffi-
2003 ASHRAE. THIS PREPRINT MAY NOT BE DISTRIBUTED IN PAPER OR DIGITAL FORM IN WHOLE OR IN PART. IT IS FOR DISCUSSION PURPOSES ONLYAT THE 2003 ASHRAE ANNUAL MEETING. The archival version of this paper along with comments and author responses will be published in ASHRAE Transactions,Volume 109, Part 2. ASHRAE must receive written questions or comments regarding this paper by July 11, 2003, if they are to be included in Transactions.
Josh Apte is a student research assistant and Dariush Arasteh and Joe Huang are staff scientists at Lawrence Berkeley National Laboratory,Berkeley, Calif.

cient (SHGC, which quantifies the fraction of heat from inci-dent solar radiation entering a space).
By reflecting long-wave radiant energy, low-e windowsreduce window U-factors and therefore reduce heat lossthrough windows. Although valuable in all climates, reducedU-factors are most useful in colder climates where heatingenergy requirements, driven by large indoor-outdoor temper-ature differences, are significant.
Many low-e coatings are tuned to reflect the solar infrared(or invisible) portion of the sun’s energy in order to reduce awindow’s SHGC. Such products, known as “low-gain” or“spectrally selective” glazings, are effective in climates wherecooling dominates energy bills, but these products also reducesolar gain through windows during the heating season, thusreducing the windows’ ability to provide free solar heat. LowU-factors combined with solar gains are important in turningwindows from liabilities to assets during the heating season.Some low-e coatings (high-solar-gain, low-e) have beendeveloped to maximize the SHGC; these products are optimalin climates where heating dominates the energy used for spaceconditioning because high solar gains can offset heating loads.
In short, currently available products represent a compro-mise: they perform best in climates where either heating orcooling is the dominant space-conditioning use, but not both.Unfortunately, most U.S. climates require both heating andcooling during some periods of the year. Although it is rela-tively straightforward to say that low-solar-gain windows areappropriate in the southern U.S. where air conditioning domi-nates space-conditioning needs and heating is rarely required,the choice is less clear-cut in the rest of the country. Even inclimates where heating is the dominant space-conditioningneed, air conditioning is typically needed during some part ofthe summer. A window that reduces solar gain will lowersummer cooling energy consumption but also reduce the solargains that can significantly offset wintertime heating costs.Thus, all low-e windows will provide less-than-optimal solargain performance during some portion of the year.
A dynamic window system could optimize a window’ssolar-gain characteristics according to weather conditions,taking advantage of passive solar effects in winter and reject-ing unwanted solar heat gain in summer. The study describedin this paper used the energy simulation program DOE2.1 toevaluate the potential benefits of dynamic fenestrationsystems and compared these hypothetical future systems towhat might be the next generation of energy-efficientwindows based only on improvements in current technolo-gies—that is, more highly efficient (“ultra”) windows with“static” (fixed) rather than dynamic properties. In addition, weconsidered the impact of combining the properties of thedynamic and ultra windows. Although neither the dynamic northe ultra windows simulated in this study are currently avail-able, they represent products that could, realistically, resultfrom research during the next decade.
This study also quantifies the impacts of dynamic andultra static windows in typical residential applications whereshading strategies and improved insulation and heating, venti-
lating, and air-conditioning (HVAC) systems are employed tolower total building energy use. Impacts on peak demand arealso examined.
EMERGING TECHNOLOGIES
Technologies currently in research and development areexpected to lay the groundwork for the next generation of resi-dential window products. These technologies are describedbriefly in the following paragraphs (Carmody et al. 2000;Arasteh 1995).
Several technologies are currently being researched toreduce the heat loss (U-factor) of windows. These includevacuum windows, aerogel windows, and improved multi-layer low-e/gas-filled windows. Vacuum windows utilize low-e coatings and an evacuated air space (which virtually elimi-nates conduction/convection), much like a thermos bottle.Aerogel is a silica-based, open-cell, foam-like materialcomposed of about 4% silica and 96% air; the microscopiccells trap air, maximizing the insulating value, but still allow-ing light to pass. Multi-layer (two or more low-e coatings andgas-filled insulating gaps) highly insulating windows arecurrently available as specialty products; new manufacturingapproaches (rigid polymeric “nonsealing” inserts, convectionbaffles, and thin glass) offer the potentials for more cost-effec-tive products.
Technologies to reduce solar heat gain include improve-ments to existing low-e coatings, light redirecting layers, andself-shading windows. Today’s current spectrally selectivelow-e coatings minimize unwanted solar heat gain by trans-mitting only the visible light and minimal near-infrared;sharper cutoffs will lead to small decreases in solar heat gain.Lower transmittances across the visible spectrum will reducesolar heat gain further but may also make the glass appeardarker. Consideration of frame/glazing shading patterns inwindow design may also help reduce solar heat gains for highsun angles.
Technologies that enable windows to have dynamic prop-erties include electrochromic glazings, operable shadingsystems, and light-redirecting devices. Electrochromics aretypically multilayer coatings that change transparency over abroad range (from as high as 70% down to a few percent);while researched in the past for commercial building applica-tions, modified electrochromics have significant potentials foruse in high-performance residential buildings where seasonalsolar switching is needed. Operable and controlled shadingsystems can be significant energy savers and can be built usingcurrently available technologies. Light-redirecting glazingscan be utilized to transmit winter sun but reflect summer sun;such products can take the form of angle selective films, modi-fied coatings, or refractive/reflective glazing geometries.
SIMULATION DESIGN
For this study, the energy performance of dynamic fenes-tration systems was simulated with RESFEN 5, an interface tothe DOE-2.1E energy model (Mitchell et al. 2002). The simu-lated windows were placed in a single-story, frame-construc-
2 KC-03-12-3

tion residence with 2,000 ft2 (186 m2) of floor area and 75 ft2
(7 m2) of window area on each orientation (north, east, south,west). The homes were simulated in eight U.S. cities thatrepresent a range of climates: Boston, MA; Seattle, WA;Denver, CO; Washington, D.C.; Kansas City, MO; Sacra-mento, CA; Jacksonville, FL; and Phoenix, AZ. Specificlevels of insulation were determined for each location basedon Model Energy Code standards (CABO 1993), and base-ment or slab-on-grade construction was chosen in accordancewith local practice. Homes were heated with a gas furnace(AFUE1 = 0.78) and cooled with a 10.0-SEER2 air-condition-ing unit. This set of simulations is referred to as “typical” andis based on past efforts by the National Fenestration RatingCouncil (Arasteh et. al. 1999). To compare the effects of futurehigh-performance fenestration and the effects of shading strat-egies for reducing energy, homes with large roof overhangsand deciduous trees were also simulated. Finally, to comparethe effects of high-performance windows to the effects ofimproved insulation and HVAC systems, homes weremodeled with approximately doubled insulation levels andimproved HVAC system efficiencies, as well as higher-performing windows. Table 1 lists the details of these simula-tions.
Nine windows were simulated to represent a range ofcurrent and potential future window types. The whole-windowSHGCs and U-factors for the nine simulated products arelisted in Table 2. The first five windows represent a range ofcurrently available fenestration systems: double-glazedwindows with clear glass and a wood/vinyl frame (#1) aremidrange products, argon-filled low-e windows in a wood/vinyl frame typify higher-performance products on the markettoday (#2 and #3), and triple-glazed super windows (#4 and#5) represent the most efficient one to two percent of today’smarket.
The final four windows presented in Table 2 represent arange of next generation products. The dynamic window isassumed to have the heating-season performance of the high-gain super window (#4) and the cooling season performanceof the low-gain super window (#5). In other words, it takes thecharacteristics of today’s most efficient windows and addsdynamic properties. We also defined two future high-perfor-mance static “ultra windows” that represent further improve-ments in the energy-efficient characteristics of today’s mostefficient windows; that is, these future ultra windows havevery low U-factors (0.10 Btu/ft2⋅h⋅°F / 0.57 W/m2⋅°C), and onehas a relatively “high” SHGC of 0.35, while the other a low
SHGC of 0.1. Finally, a window was simulated that combinesthe properties of the dynamic and ultra windows; it has theheating season properties of the high-gain ultra window andthe cooling season performance of the low-gain ultra window.
Products with properties similar to windows #6-#9 are notcurrently commercially available. The development ofwindows with electrochromic coatings and automated shad-ing systems is expected to lead to the development of thedynamic properties that windows #6 and #9 have. Windowswith U-factors in the range of windows #4 to #6 can currentlybe achieved with multiple layers, low-e coatings and gas fills,insulating spacers, and frames. Windows with U-factors in therange of windows #7-#9 will require the development of moreinsulating components and products, as discussed in the“Emerging Technologies” section.
RESFEN was used to calculate several values for theapplication of each window: whole-house heating energy(Mbtu/GJ), whole-house cooling energy (kWh), primaryhome HVAC energy consumption3 (Mbtu/GJ), window heat-ing energy consumption (“energies”) (Mbtu/GJ), windowcooling energies (kWh), and peak cooling demand (kW).Baseline energies were calculated—HVAC energy consump-tion not attributable to windows—by subtracting the totalannual window HVAC energies from total annual whole-house HVAC energies. Because this value varied slightly fromwindow to window within a city, the value presented here is anumerical average.
SIMULATION RESULTS AND DISCUSSION
Although simulations for all nine windows wereperformed in all eight cities, all nine windows are not appro-priate for each climate. For example, it would not be sensibleto install a high-solar-gain window in a Phoenix home. For thisreason, only one low-e window (#2 or #3), one super window(#4 or #5), and one ultra window (#7 or #8) is shown for eachclimate. In heating-dominated climates,4 such as Washington,D.C., and Kansas City, these windows have high solar gain. Incooling climates and Sacramento, these windows have lowsolar gain.
1. AFUE (annualized fuel utilization efficiency) is the amount ofheat delivered by a furnace, divided by the latent heat of the fuelthe furnace consumes. A furnace with AFUE = 1 is perfectly effi-cient.
2. SEER (seasonal energy efficiency ratio, expressed in Btu/W) isthe cooling output of an air conditioner, divided by the energyinput to the air conditioner.
3. We calculated total annual HVAC energy consumption in MBtuby adding heating energy consumption to cooling energyconsumption multiplied by the conversion factor for kWh toMBtu (0.003412) and a site-to-source conversion efficiencyfactor of 3.22. We calculated total annual HVAC energy consump-tion in GJ by adding heating energy consumption to coolingenergy consumption multiplied by the conversion factor for kWhto GJ (0.0036) and a site-to-source conversion efficiency factor of3.22.
4. For the purposes of this paper, heating-dominated climates areclimates in which high-solar-gain super windows use less energyon an annual basis than low-gain super windows. In coolingclimates, low-solar-gain super windows use less energy than high-gain super windows. In mixed climates, there is little difference inenergy performance between the two types of windows.
KC-03-12-3 3

TABLE 1 Construction Schemes (Adapted from Mitchell et al. 2002)
Scheme Characteristics
Typical Insulation and building systems:• 1993 Model Energy Code levels of insulation (described in text)• Gas Furnace AFUE = 0.78; AC SEER = 10.0
Shading• Interior shades (seasonal SHGC multiplier, summer value = 0.80, winter value = 0.90)• 1 ft (0.3 m) overhang• a 67% transmitting same-height obstruction 20 ft (6 m) away, intended to represent adjacent buildings• To account for other sources of solar heat gain reduction (insect screens, trees, dirt, building and window self-
shading), SHGC multiplier further reduced by 0.1, resulting in a final winter SHGC multiplier of 0.8 and a finalsummer SHGC multiplier of 0.7
Typical + Overhangs Same as above, but with 2-ft (0.6 m) overhangs instead of 1-ft (0.3 m) overhangs
Typical + Overhangs+ Trees
Insulation and building systems• Same as “Typical”
Shading• Interior shades (seasonal SHGC multiplier, summer value = 0.80, winter value = 0.90)• 2 ft (0.6 m) overhang• A 10 ft (3 m) diameter obstruction 4 ft (1.2 m) above ground level, located 8 ft (2.4 m) away from the house;
zero-percent solar transmittance, March 15-Oct. 15; 60% solar transmittance, Oct. 15-March 15• To account for other sources of solar heat gain reduction (insect screens, trees, dirt, building and window self-
shading), SHGC multiplier further reduced by 0.1, resulting in a final winter SHGC multiplier of 0.8 and a finalsummer SHGC multiplier of 0.7
Double Insulation Insulation and Building Systems• Insulation levels approximately double those of 1993 Model Energy Code standards; locally specific
Shading• Same as “Typical”
Double Insulation with Efficient HVAC
Insulation and Shading• Same as “Double Insulation”
Building Systems• Simulated ultra efficient systems furnace AFUE = 0.95*; AC SEER = 16.0†
* The annual energy consumption for AFUE = 0.95 for a furnace was calculated from the energy consumption for the simulated AFUE = 0.78 by multiplying this value bythe ratio of the two furnace efficiencies (0.821).† Estimates of energy savings from higher-rated air-conditioning systems were conservative. SEER measurements are misleading in that air conditioners with a higher ratedSEER do not necessarily increase efficiency proportional to the increase in SEER; thus, efficiency improvements for a 16 SEER unit over a 10 SEER unit would be less than60% (Kavanaugh 2002). The annual energy consumption of a 16 SEER AC unit was calculated by reducing the annual energy consumption of the simulated 10 SEER AC unitby 20%. Peak energy demand for the 16 SEER unit was calculated by multiplying the demand of the simulated 10 SEER unit by 0.943 based on a 6% increase in peak EERfound by Kavanaugh (2002).
TABLE 2 Window Types
Window
U-Factor (Btu/ft2⋅h⋅F)/ (W/m2 ⋅°C) SHGC
1 Double Clear (static) 0.49 / (2.78) 0.56
2 Low-e, high solar (static) 0.36 / (2.05) 0.53
3 Low-e, low solar (static) 0.34 / (1.93) 0.30
4 Super, high solar (static) 0.18 / (1.02) 0.40
5 Super, low solar (static) 0.18 / (1.02) 0.26
6 Dynamic 0.18 / (1.02) 0.26 or 0.40
7 Ultra, high solar (static) 0.10 / (0.57) 0.35
8 Ultra, low solar (static) 0.10 / (0.57) 0.10
9 Dynamic + Ultra 0.10 / (0.57) 0.10 or 0.35
Glazing systems 2-5 have 90 percent argon gas fill. For all windows, U-factor and SHGC are whole-window values for a 60 x 150-cm generic wood-vinyl frame.
4 KC-03-12-3

Annual Energy Performance Comparisons
As the simulation results in Figure 1 show, homes withlow-e windows in most climates used 5 to 10 Mbtu (5-10 GJ)less energy (8% to 15% less total house energy use) for heatingand cooling than homes equipped with standard double-glazed windows. As a comparison, baseline energy consump-tion—the energy consumption that would exist even if thehome had no windows—was around 12 to 25 Mbtu (13-26 GJ;20% to 40% of total house HVAC energy use) lower thanenergy consumption for homes with double-glazed windows.
Thus, low-e windows typically saved about 40% of the energyuse attributable to windows. Simulated homes incorporatingthe dynamic and the ultra-window technologies studied herecan use as little as or less energy than a home with no windowswhatsoever; in other words, these future technology advancescan convert windows from energy liabilities to energy assets,which will be key in zero-energy construction.
In heating-dominated and mixed climates, homes withsuper windows (#4 or #5) used 10% to 11% less total houseenergy than homes equipped with low-e (#2 or #3) windows[see Figure 2]. In cooling-dominated climates, the energy use
Figure 1 Total annual HVAC energy use.
Figure 2 Percent of savings in annual whole house energy use over low-e windows.
KC-03-12-3 5

of today’s super windows was 6% to 7% (of total houseenergy) lower than low-e windows. In all climates, energysavings from super windows result primarily from thewindows’ very low U-factor; because cooling climates have asmaller indoor-outdoor temperature differential, the savingsfrom super windows are smaller in these climates.
As Figure 1 shows, energy savings from dynamicwindows (#6) were greater than from superwindows, but notalways significantly. In climates like those of Phoenix, Seat-tle, and Boston, which are all heavily dominated by oneseason, dynamic windows used only 1% to 2% less total houseenergy on an annual basis than super windows. However, inmixed climates like that in Sacramento, dynamic windowsincrease whole house energy savings over low-e windows byanother 9%.
Dynamic and static ultra windows were compared inorder to assess which technology might be most promising topursue as the basis for the next generation of highly efficientwindows. It was found that in climates with one dominantseason, the static ultra windows outperformed dynamicwindows. As Figure 2 shows, in heating-dominated climates,homes with ultra windows consumed 14% to 17% less totalhouse energy than homes with today’s low-e windows. Bycontrast, dynamic windows saved 12% to 16%. In cooling-dominated climates, energy savings from ultra windows weresignificantly greater than those from dynamic windows.However, in Washington, D.C., which is typical of mixedclimates, homes with the high-solar-gain ultra window (#4)and the dynamic window consumed roughly similar amountsof energy. In another mixed climate studied—Sacramento—the low-solar-gain ultra window (#6) saved significantly lessenergy than the dynamic window (12% vs. 14%, respectively).When the sole concern is to minimize annual energy consump-tion, static ultra windows deliver performance roughly on parwith the dynamic window (#6) in mixed climates, slightlysuperior performance in heating climates, and more signifi-cantly superior performance in cooling climates.
Window 9, the “dynamic + ultra” window, represents anouter bound in product design and performance, combiningthe low U-factors of ultra static windows with the solar-heat-gain properties of the dynamic window. Energy savings fromthis combined window were 18% to 30% of total house energyuse, greater (depending on climate) than the savings fromtoday’s low-e windows. As with all the dynamic windows wesimulated, the dynamic + ultra window’s energy savings weregreatest in mixed climates (see Figures 1 and 2). Notably, inheating and mixed climates, homes with dynamic + ultrawindows consumed less energy than the baseline “nowindow” case, turning windows into a net energy benefit forthe home.
Peak Demand Performance Comparisons
Figures 3 and 4 show peak cooling energy consumptionand demonstrate that windows with low annual energyconsumption do not necessarily draw less power duringimportant peak cooling periods. As discussed previously, inheating-dominated and mixed climates, high-solar superwindows (#4 in Table 2) performed nearly as well as dynamicwindows on an annual energy basis. However, in theseclimates, with the exception of Sacramento, peak demandsavings for the dynamic window (#6) were almost twice aslarge as savings for a super window (#4). This correspondedto peak power demand in homes with dynamic windows (#6)that was 0.25-0.4 kW lower than the peak power demand forhomes with super windows (#4).
In cooling-dominated climates and Sacramento, the trendwas different. Since the dynamic window (#6) had the sameSHGC as the climate-appropriate super window (#5), thedynamic window offered no additional savings in peak cool-ing power demand in these climates.
On an annual basis, the high-solar-gain ultra window (#7in Table 2) consumed less energy than the dynamic window(#6) in heating-dominated and mixed climates. However, thehome with the dynamic window had lower peak cooling powerdemand because of the low summer SHGC for this window.Homes with the ultra window (#7) had cooling powerconsumption 0.15 to 0.25 kW higher than similar homes withthe dynamic window (#6).
In cooling climates, the trend was again different. Thelow-solar-gain ultra window (#8) used in these climates has alower SHGC than the dynamic window (#6). Homes in cool-ing climates with the low-solar-gain ultra window (#8) hadpeak cooling power demand about 0.3 kW lower than incomparable homes with the dynamic window (#6).
The dynamic + ultra window (#9 in Table 2) offered thedeepest reduction in peak cooling power demand in heating-dominated and mixed climates (except Sacramento). Savingswere greatest in the most extreme climates and ranged from a35% to 65% reduction in peak HVAC power demand fromhomes equipped with the high-gain low-e window (#2). Incooling climates, peak power consumption for window 9 wasno lower than that for the low-solar-gain ultra window appro-priate for these cities (#8). In all cases, the dynamic + ultrawindow had very low peak cooling power demand. Thisdemand was only slightly greater (11% to 25%) than that of ahome with no windows whatsoever.
Effects of Shading Strategies
Increased shading of windows through the use of largeoverhangs and trees was found to decrease summer coolingenergy consumption and increase winter heating energy
6 KC-03-12-3

KC-03-12-3 7
Figure 3 Peak cooling energy use.
Figure 4 Percent of savings in peak cooling load over low-e.

consumption. Figure 5 shows total annual energy consump-
tion for windows in a heating climate (Boston), a mixed
climate (Washington, D.C.), and a cooling climate (Phoenix).
Shading strategies increased annual energy consumptionin all heating-dominated cities (not shown) because the result-ing increased winter energy use outweighed the summer cool-ing energy savings. In mixed climates, shading strategies didnot significantly affect the performance of static windows,although shading slightly increased the annual energyconsumption of dynamic windows.
Shading strategies significantly improved the perfor-mance of all windows in cooling-dominated climates. AsFigure 5 shows, intelligent use of deciduous trees coupled witha conventional low-solar-gain low-e window (#3) in a climatesuch as Phoenix can yield savings comparable to those fromfuture window technologies when not shaded. A combinationof advanced window technologies and shading led to the great-est possible energy savings.
As Figure 6 shows, deciduous trees were effective inreducing peak cooling demand in all climates. In several heat-ing and mixed climates, tree-surrounded homes with high-
Figure 5 Annual energy: shading schemes compared.
Figure 6 Peak cooling loads: shading schemes compared.
8 KC-03-12-3

solar-gain low-e windows had lower peak cooling than homeswith “typical” shading and dynamic windows. In coolingclimates, savings were more modest.
In general, in cooling-dominated climates, where shad-ing/overhangs are most effective, advanced window technol-ogies are still required to bring window energy consumptionto “zero” levels, although the absolute savings are less. In allclimates, shading/overhangs contribute more toward peakreductions than energy reductions.
Effects of Improved Insulationand Building Systems
Doubled home insulation levels were found to dramati-cally reduce annual home energy consumption, especially
when combined with more efficient building systems (Figure7). Doubling insulation and improving mechanical equipmentin a typical home can reduce annual energy consumption up to37%, depending on climate. In these cases, the impacts ofadvanced windows are slightly lower in absolute terms but areapproximately equal in relative terms. Advanced windows arealso a necessity if the energy impacts of windows are to bebrought to “zero” levels.
Peak demand savings for the double insulation and doubleinsulation with efficient HVAC cases were not as great as theannual energy savings, as Figure 8 shows. In all climates,doubled insulation and doubled insulation with efficientHVAC helped reduce peak loads, but advanced windows are
Figure 7 Total annual HVAC energy use: insulation schemes compared.
Figure 8 Peak cooling load: insulation schemes compared.
KC-03-12-3 9
the main driver in reducing peak loads. Absolute kW reduc-tions from window strategies are roughly the same in all threecases (base case, doubled insulation, double insulation withefficient HVAC).
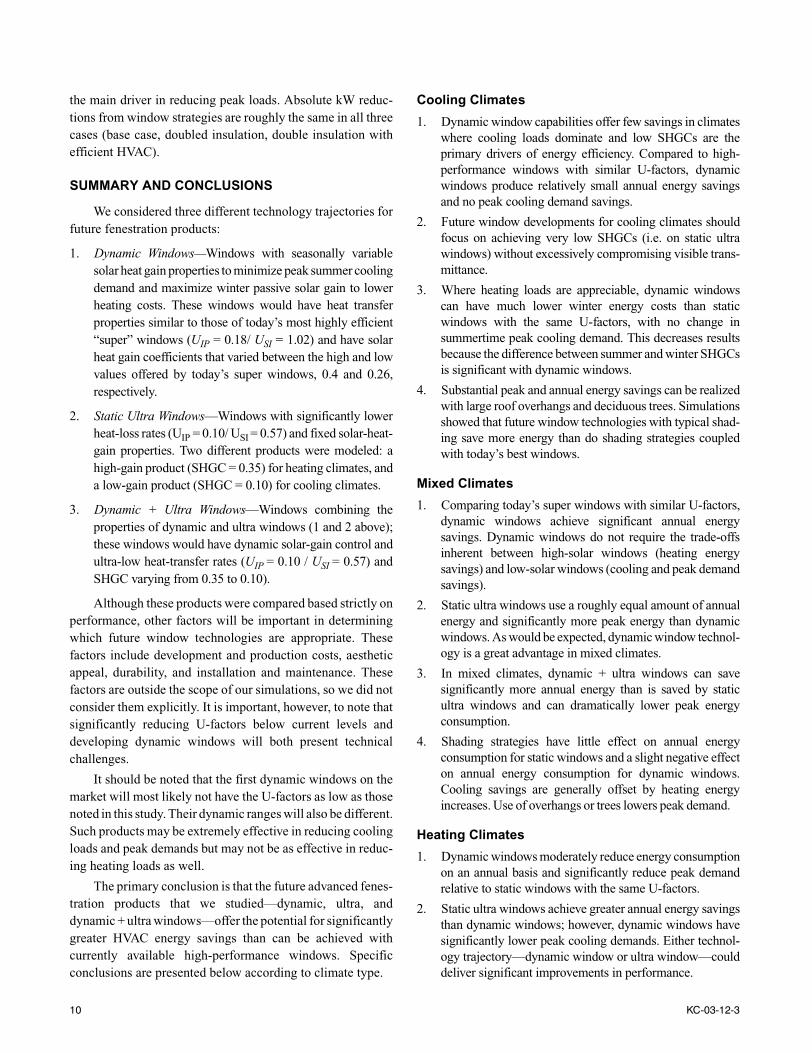
SUMMARY AND CONCLUSIONS
We considered three different technology trajectories forfuture fenestration products:
1. Dynamic Windows—Windows with seasonally variablesolar heat gain properties to minimize peak summer coolingdemand and maximize winter passive solar gain to lowerheating costs. These windows would have heat transferproperties similar to those of today’s most highly efficient“super” windows (UIP = 0.18/ USI = 1.02) and have solarheat gain coefficients that varied between the high and lowvalues offered by today’s super windows, 0.4 and 0.26,respectively.
2. Static Ultra Windows—Windows with significantly lowerheat-loss rates (UIP = 0.10/ USI = 0.57) and fixed solar-heat-gain properties. Two different products were modeled: ahigh-gain product (SHGC = 0.35) for heating climates, anda low-gain product (SHGC = 0.10) for cooling climates.
3. Dynamic + Ultra Windows—Windows combining theproperties of dynamic and ultra windows (1 and 2 above);these windows would have dynamic solar-gain control andultra-low heat-transfer rates (UIP = 0.10 / USI = 0.57) andSHGC varying from 0.35 to 0.10).
Although these products were compared based strictly onperformance, other factors will be important in determiningwhich future window technologies are appropriate. Thesefactors include development and production costs, aestheticappeal, durability, and installation and maintenance. Thesefactors are outside the scope of our simulations, so we did notconsider them explicitly. It is important, however, to note thatsignificantly reducing U-factors below current levels anddeveloping dynamic windows will both present technicalchallenges.
It should be noted that the first dynamic windows on themarket will most likely not have the U-factors as low as thosenoted in this study. Their dynamic ranges will also be different.Such products may be extremely effective in reducing coolingloads and peak demands but may not be as effective in reduc-ing heating loads as well.
The primary conclusion is that the future advanced fenes-tration products that we studied—dynamic, ultra, anddynamic + ultra windows—offer the potential for significantlygreater HVAC energy savings than can be achieved withcurrently available high-performance windows. Specificconclusions are presented below according to climate type.
Cooling Climates
1. Dynamic window capabilities offer few savings in climateswhere cooling loads dominate and low SHGCs are theprimary drivers of energy efficiency. Compared to high-performance windows with similar U-factors, dynamicwindows produce relatively small annual energy savingsand no peak cooling demand savings.
2. Future window developments for cooling climates shouldfocus on achieving very low SHGCs (i.e. on static ultrawindows) without excessively compromising visible trans-mittance.
3. Where heating loads are appreciable, dynamic windowscan have much lower winter energy costs than staticwindows with the same U-factors, with no change insummertime peak cooling demand. This decreases resultsbecause the difference between summer and winter SHGCsis significant with dynamic windows.
4. Substantial peak and annual energy savings can be realizedwith large roof overhangs and deciduous trees. Simulationsshowed that future window technologies with typical shad-ing save more energy than do shading strategies coupledwith today’s best windows.
Mixed Climates
1. Comparing today’s super windows with similar U-factors,dynamic windows achieve significant annual energysavings. Dynamic windows do not require the trade-offsinherent between high-solar windows (heating energysavings) and low-solar windows (cooling and peak demandsavings).
2. Static ultra windows use a roughly equal amount of annualenergy and significantly more peak energy than dynamicwindows. As would be expected, dynamic window technol-ogy is a great advantage in mixed climates.
3. In mixed climates, dynamic + ultra windows can savesignificantly more annual energy than is saved by staticultra windows and can dramatically lower peak energyconsumption.
4. Shading strategies have little effect on annual energyconsumption for static windows and a slight negative effecton annual energy consumption for dynamic windows.Cooling savings are generally offset by heating energyincreases. Use of overhangs or trees lowers peak demand.
Heating Climates
1. Dynamic windows moderately reduce energy consumptionon an annual basis and significantly reduce peak demandrelative to static windows with the same U-factors.
2. Static ultra windows achieve greater annual energy savingsthan dynamic windows; however, dynamic windows havesignificantly lower peak cooling demands. Either technol-ogy trajectory—dynamic window or ultra window—coulddeliver significant improvements in performance.
10 KC-03-12-3

3. Dynamic + ultra windows significantly reduce annual andpeak energy consumption.
4. Tree shading strategies significantly increase annual energyuse; however, peak summertime demands are only moder-ately decreased.
Future Research Paths
Current low-e window technology has led to significantenergy savings in typical homes. However, such products arenot efficient enough for energy-efficient homes of the future.Higher performing window products need to be developed ifwindows are not to be an energy drain on the house.
This paper shows there are significant savings to beachieved from both static and dynamic higher performingwindows throughout the United States. Dynamic windows(products that modulate solar heat gain on a seasonal basis) aremost promising in central and northern climates. Such prod-ucts provide the best of all worlds: heating energy savingsfrom high-solar windows and cooling and peak demandsavings from low-solar windows.
Shading strategies and high-performance HVAC equip-ment also contribute to decreasing the energy impacts ofwindows in homes. However, even with shading strategies andhigh-performance HVAC, there are still significant energybenefits from the higher performing window products studiedin this paper. Note that future studies should examine thepotential for increased savings from higher levels of shading(i.e., 4 ft (1.2 m) overhangs) and more efficient HVAC equip-ment (SEER>16), as currently being researched in BuildingAmerica houses.
REFERENCES
Arasteh D., J. Huang, R. Mitchell, B. Clear, and C. Kohler.1999. A database of window annual energy use in typi-cal North American single family houses. ASHRAETransactions 106(1).
Arasteh, D. 1995. Advances in window technologies 1973-1993. Chapter in Advances in solar energy, An annualreview of research and development, Karl W. Böer, ed.,Vol. 9, pp. 339-382. American Solar Energy Society,Inc., Boulder, Colo. Also published as Lawrence Berke-ley National Laboratory Report LBL-36891, Berkeley,Calif.
CABO (Council of American Building Officials). 1993.Model Energy Code. Falls Church, Va.: CABO.
Carmody J., S.E. Selkowitz, D. Arasteh, and L. Heschong.2000. Residential Windows. 2d ed. New York: W.W.Norton and Co.
Ducker Research Company, Inc. 2000. Study of the U.S. andCanadian Market for Windows and Doors.
DOE (U.S. Department of Energy). 2002. Office of EnergyEfficiency and Renewable Energy. 2002 BTS CoreDatabook, http://btscoredatabook.eren.doe.gov/docs/cdb2002.pdf.
Frost, K., J. Eto, D. Arasteh, and M. Yazdanian. 1996. Thenational energy requirements of residential windows inthe U.S.: Today and tomorrow. ACEEE 1996 SummerStudy on Energy Efficiency in Buildings: Profiting fromEnergy Efficiency, August 25-31. 1996, Asilomar, PacificGrove, CA. Also published as Lawrence BerkeleyNational Laboratory Report LBL-39692, Berkeley,Calif.
Frost, K., D. Arasteh, and J. Eto. 1993. Savings from energyefficient windows: Current and future savings from newfenestration technologies in the residential market.Lawrence Berkeley National Laboratory Report LBL-33956, Berkeley, Calif.
Kanavaugh, S.P. 2002. Limitations of SEER for measuringefficiency. ASHRAE Journal 4(7): 27-30.
Mitchell, R.D., Y.J. Huang, D. Arasteh, and S. Glendenning.2002. RESFEN 5.0 Beta 1: Program description. Win-dows and Daylighting Group, Building TechnologiesProgram, Lawrence Berkeley National Laboratory, Ber-keley, Calif.
ACKNOWLEDGMENTS
This work was supported by the Assistant Secretary forEnergy Efficiency and Renewable Energy, Office of BuildingTechnology, Building Technologies Program of the U.S.Department of Energy, under Contract No. DE-AC03-76SF00098.
The authors would like to acknowledge Nan Wishner,Robin Mitchell, and Christian Köhler for their invaluableinsights and encouragement, as well as Steve Glendenning andRobin Mitchell’s efforts in the development of the RESFEN5.0 interface to the DOE-2 simulation software used in thispaper.
APPENDIX A
How much annual energy use is caused by windowperformance?
Answer: 3.8 Q (4 EJ) of direct use, about $40B/year; anadditional 1 Q (1.05 EJ) of lighting energy could be replacedby daylighting
Background:
From Table 1.1 DOE BTS Core Data Book:Residential buildings are 20% of U.S. total of 96.2quads (101 EJ) or 19.2Q (20.3 EJ)Commercial buildings are 16% of U.S. total or 15.4Q(16.2 EJ)
Windows energy use by end use and building type: Residential heating: 2.01Q (2.12 EJ)Residential cooling: 0.71Q (0.75 EJ)Commercial heating: 0.54Q (0.57 EJ)Commercial cooling 0.56Q (0.59 EJ)TOTAL = 3.82Q (4.03 EJ) or 4% of US energy use
KC-03-12-3 11

Note: Lighting accounts for 3.83Q (4.04 EJ) in commer-cial buildings, so if we assume daylighting has the potential tooffset 25% (perimeter and skylights), there is another 0.96Q(1.01 EJ; 1% of total U.S.) windows related energy use.
Assumptions:
• For residential, the percentages of component heating orcooling loads from Table 1.2.10 (i.e., windows are 37%of cooling loads) can be applied to total space heatingand total space cooling primary energy from Table 1.2.3.For infiltration, we assume one-fourth of all heating andcooling loads from infiltration are due to windows. (Heating: conduction-solar gains is 23%, infiltration is9%, total = 32%) (Cooling: solar gains are 32%, conduction is 1%, infil-tration is 4%; total = 37)
• For commercial, the percentages of component heatingor cooling loads from Table 1.3.9 can be applied to totalspace heating and total space cooling primary energyfrom Table 1.3.3. For infiltration, we assume 15% of allheating and cooling loads from infiltration are due towindows. (Heating: conduction-solar gains is 17%, infiltration is5%; total = 22%)
(Cooling: solar gains-”free conductive cooling and infil-tration” = 31%)
APPENDIX B
Question: What will total energy use attributable to resi-dential windows in the U.S. be if the stock is replaced with low-e windows everywhere?
Frost et al. (1996) estimates that national energy use ofresidential windows could be reduced by up to 25% if allwindows sold between 1994 and 2010 were low-e. This wouldput much, but not all, of the stock toward low-e.
Frost et al. (1993) estimates that national energy use ofresidential windows could be reduced by 60% if all windowsin the U.S. were replaced (technical potential) with superwindows in the north and spectrally selective in the south.Super windows are much better insulators than today’s low-ewindows.
If all the windows in the U.S. were replaced with low-e,we would estimate energy savings as a percentage of thenational total to be between these two bounds. We estimate itto be 40%. Thus, the 2.7 Q (2.85 EJ) drops to 1.6 Q (1.69 EJ).
12 KC-03-12-3