Embed Size (px)
Citation preview
KC Conway, CCIM, CRE, MAICCIM Institute Chief Economist
Principal & Co-Founder of Red Shoe Economics
Follow us on LinkedIn @ Red Shoe Economics
2021 Commercial Real Estate Market ForecastOctober 7, 2021 – An Economist & 4 Smart CRE Experts
Where’s the PORT & Warehouse? They are the MOST imPORTant
Association for Corporate Growth
RedShoeEconomics.com 2
This presentation consists of materials prepared exclusively by K.C. Conway, CCIM, CRE, MAI and isprovided during this event solely for informational purposes of attendees. This presentation is not intended toconstitute legal, investment or financial advice or the rendering of legal, consulting, or other professionalservices of any kind.
2021 Commercial Real Estate Forecast October 7, 2021 – Charleston SC (In-person, YEAH)
This presentation reflects the analysis and opinions of the author, K. C. Conway, CCIM, CRE, MAI but notnecessarily those of EventBrite, Charleston SC Commercial Realtors, CCIM Institute, Monmouth MREICor Red Shoe Economics.
Neither Charleston SC Commercial Realtors, Event Sponsors, CCIM Institute, Monmouth MREIC, norRed Shoe Economics make any representations or warranties about the accuracy or suitability of anyinformation in this presentation. The aforementioned do NOT guarantee, warrant, or endorse the adviceor services of K.C. Conway, CCIM, CRE, MAI.
Disclaimer: Not in the fine print…

3
Opening Perspective: There is a new BUG out there!
• It’s 2X as annoying as a Cicada;
• It really occurs only every 17 or 47 years;
• It’s called INFLATION !
4
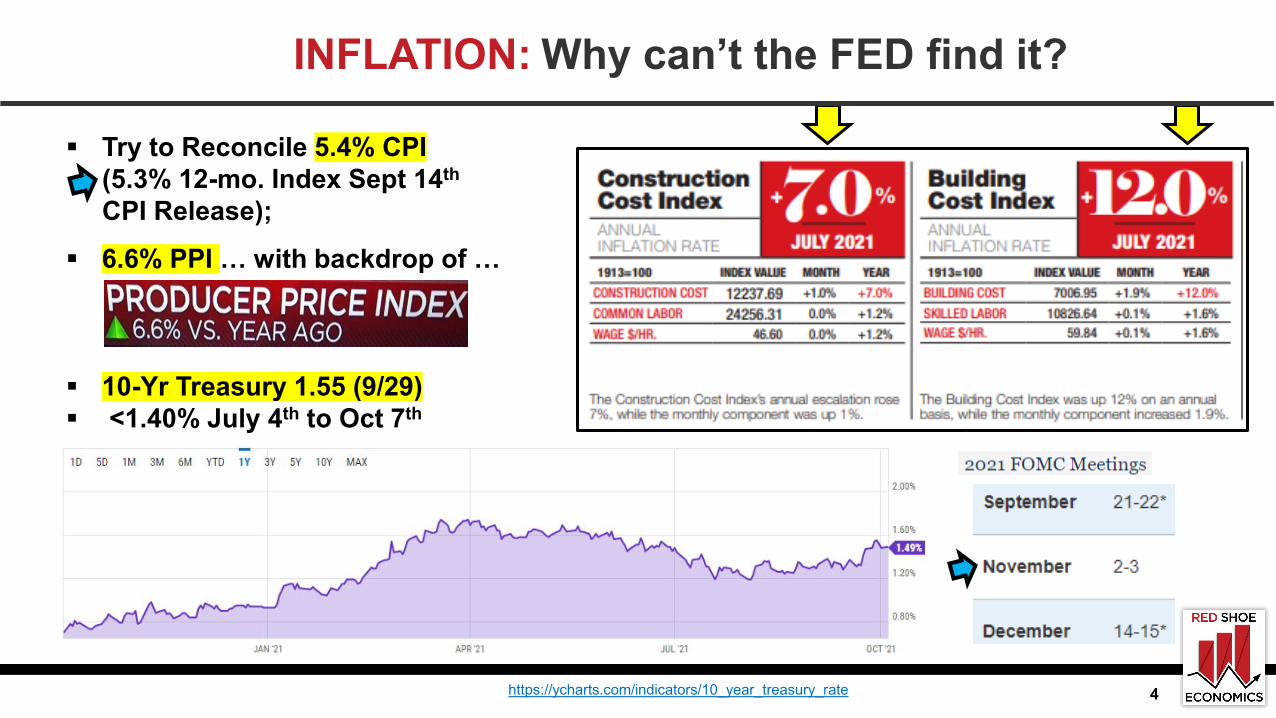
INFLATION: Why can’t the FED find it?
https://ycharts.com/indicators/10_year_treasury_rate
Try to Reconcile 5.4% CPI(5.3% 12-mo. Index Sept 14th
CPI Release);
6.6% PPI … with backdrop of …
10-Yr Treasury 1.55 (9/29) <1.40% July 4th to Oct 7th
5
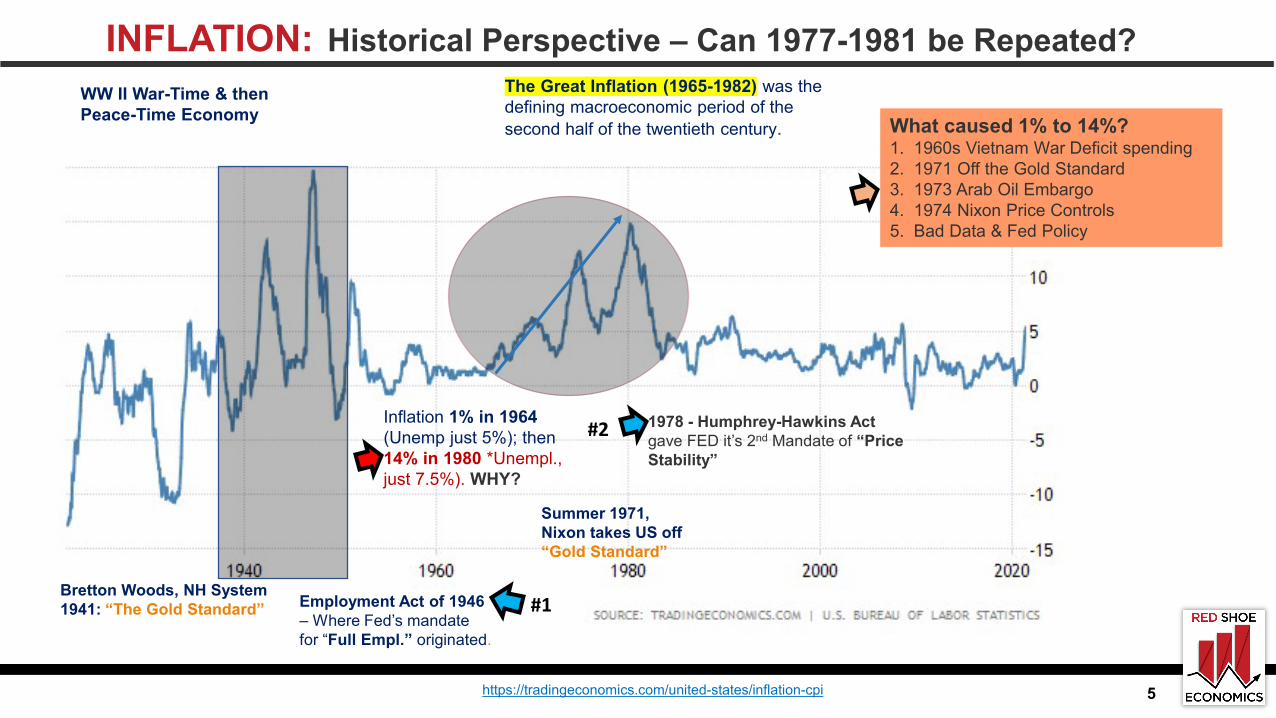
INFLATION: Historical Perspective – Can 1977-1981 be Repeated?
https://tradingeconomics.com/united-states/inflation-cpi
The Great Inflation (1965-1982) was the defining macroeconomic period of the second half of the twentieth century.
WW II War-Time & then Peace-Time Economy
Inflation 1% in 1964 (Unemp just 5%); then 14% in 1980 *Unempl., just 7.5%). WHY?
Employment Act of 1946 – Where Fed’s mandate for “Full Empl.” originated.
Bretton Woods, NH System 1941: “The Gold Standard”
Summer 1971, Nixon takes US off “Gold Standard”
What caused 1% to 14%?1. 1960s Vietnam War Deficit spending2. 1971 Off the Gold Standard3. 1973 Arab Oil Embargo4. 1974 Nixon Price Controls5. Bad Data & Fed Policy
1978 - Humphrey-Hawkins Act gave FED it’s 2nd Mandate of “Price Stability”
#1
#2
6
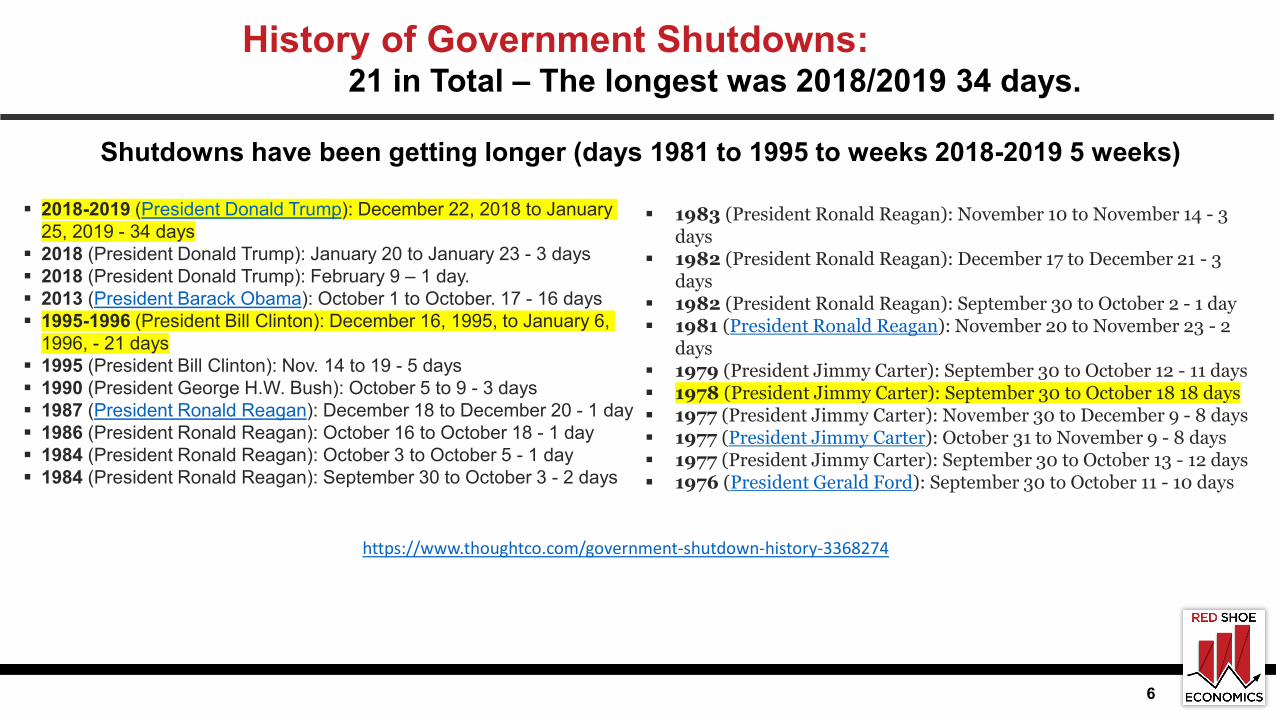
History of Government Shutdowns: 21 in Total – The longest was 2018/2019 34 days.
2018-2019 (President Donald Trump): December 22, 2018 to January 25, 2019 - 34 days
2018 (President Donald Trump): January 20 to January 23 - 3 days 2018 (President Donald Trump): February 9 – 1 day. 2013 (President Barack Obama): October 1 to October. 17 - 16 days 1995-1996 (President Bill Clinton): December 16, 1995, to January 6,
1996, - 21 days 1995 (President Bill Clinton): Nov. 14 to 19 - 5 days 1990 (President George H.W. Bush): October 5 to 9 - 3 days 1987 (President Ronald Reagan): December 18 to December 20 - 1 day 1986 (President Ronald Reagan): October 16 to October 18 - 1 day 1984 (President Ronald Reagan): October 3 to October 5 - 1 day 1984 (President Ronald Reagan): September 30 to October 3 - 2 days
1983 (President Ronald Reagan): November 10 to November 14 - 3 days
1982 (President Ronald Reagan): December 17 to December 21 - 3 days
1982 (President Ronald Reagan): September 30 to October 2 - 1 day 1981 (President Ronald Reagan): November 20 to November 23 - 2
days 1979 (President Jimmy Carter): September 30 to October 12 - 11 days 1978 (President Jimmy Carter): September 30 to October 18 18 days 1977 (President Jimmy Carter): November 30 to December 9 - 8 days 1977 (President Jimmy Carter): October 31 to November 9 - 8 days 1977 (President Jimmy Carter): September 30 to October 13 - 12 days 1976 (President Gerald Ford): September 30 to October 11 - 10 days
Shutdowns have been getting longer (days 1981 to 1995 to weeks 2018-2019 5 weeks)
https://www.thoughtco.com/government-shutdown-history-3368274
7
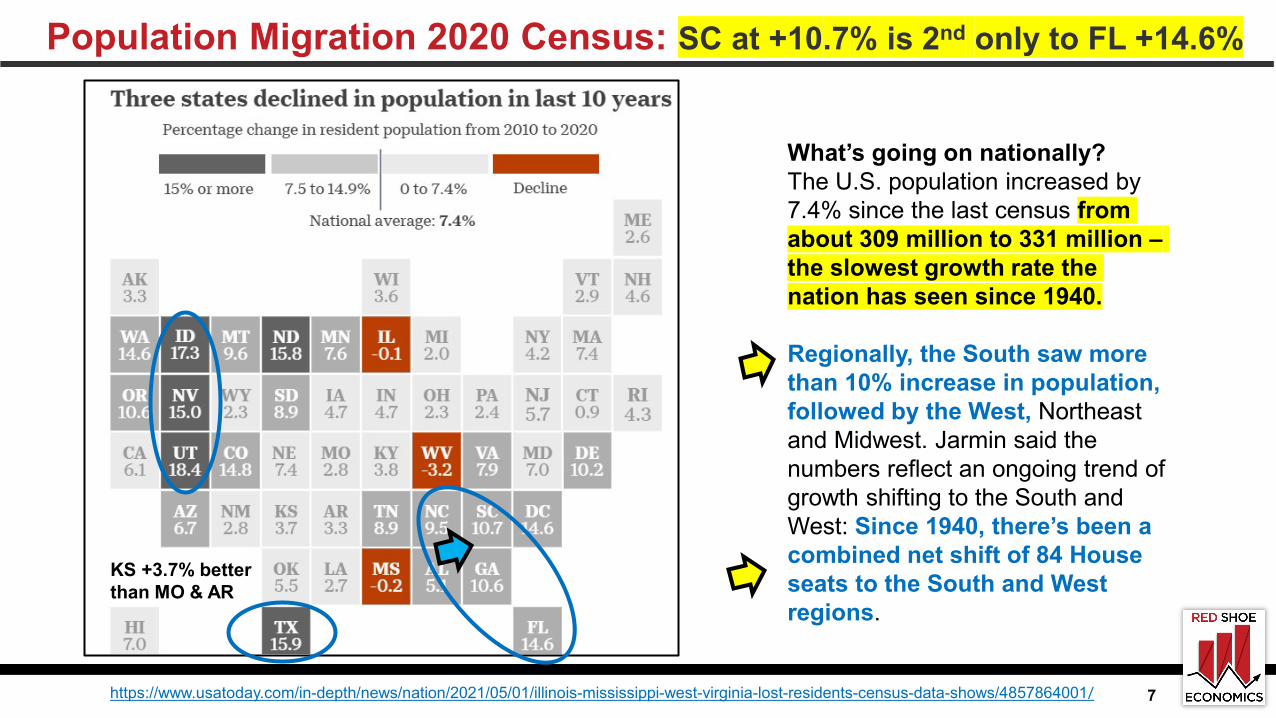
Population Migration 2020 Census: SC at +10.7% is 2nd only to FL +14.6%
What’s going on nationally?The U.S. population increased by 7.4% since the last census from about 309 million to 331 million –the slowest growth rate the nation has seen since 1940.
Regionally, the South saw more than 10% increase in population, followed by the West, Northeast and Midwest. Jarmin said the numbers reflect an ongoing trend of growth shifting to the South and West: Since 1940, there’s been a combined net shift of 84 House seats to the South and West regions.
https://www.usatoday.com/in-depth/news/nation/2021/05/01/illinois-mississippi-west-virginia-lost-residents-census-data-shows/4857864001/
KS +3.7% better than MO & AR
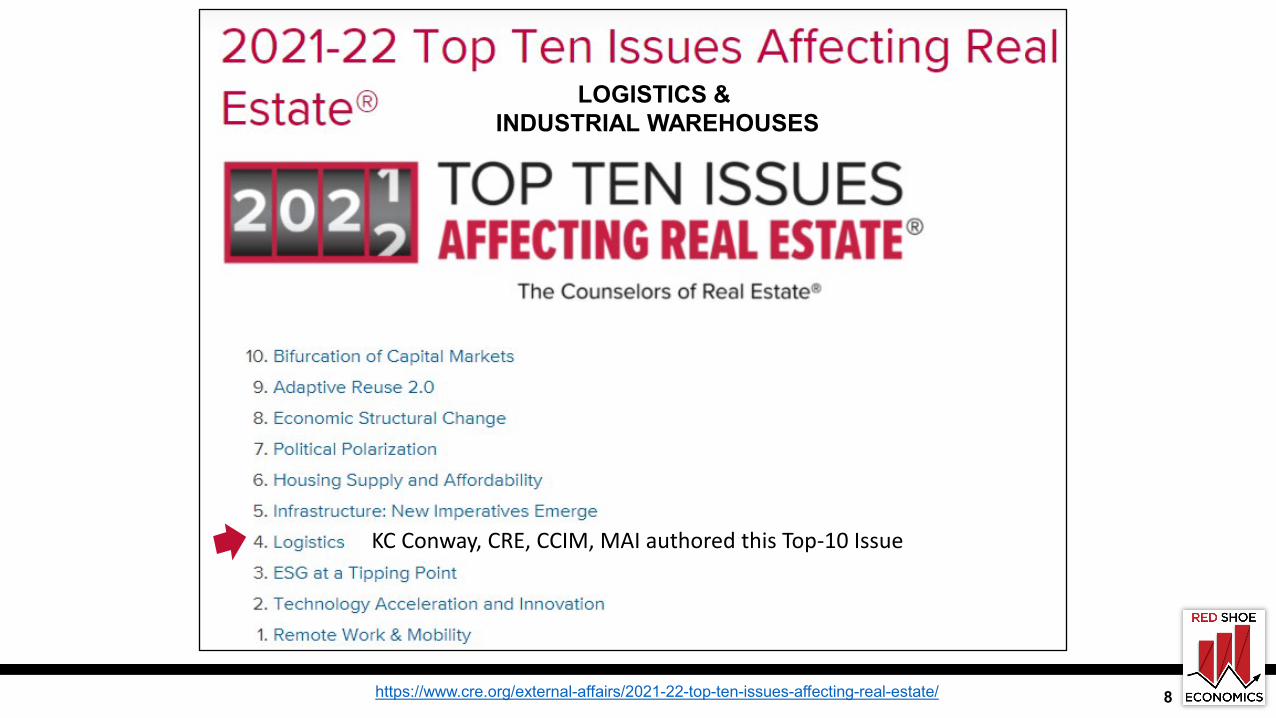
https://www.cre.org/external-affairs/2021-22-top-ten-issues-affecting-real-estate/
LOGISTICS &INDUSTRIAL WAREHOUSES
8
KC Conway, CRE, CCIM, MAI authored this Top-10 Issue
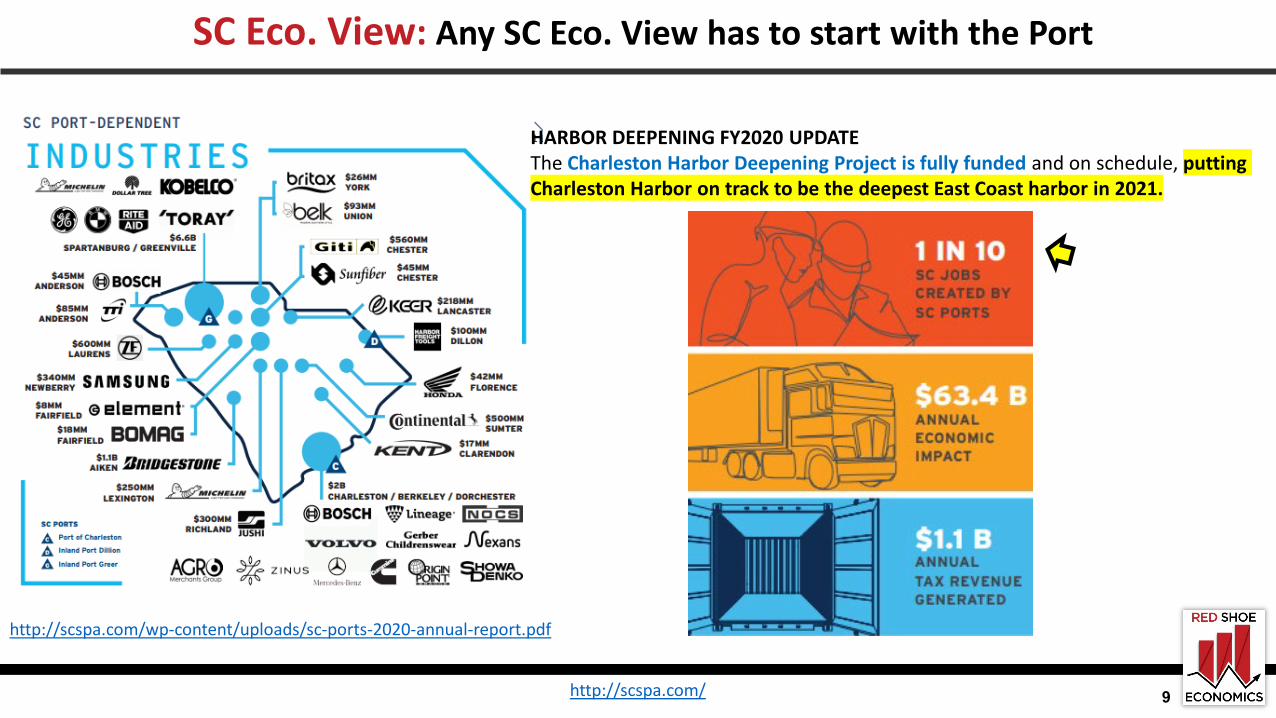
SC Eco. View: Any SC Eco. View has to start with the Port
http://scspa.com/ 9
http://scspa.com/wp-content/uploads/sc-ports-2020-annual-report.pdf
HARBOR DEEPENING FY2020 UPDATEThe Charleston Harbor Deepening Project is fully funded and on schedule, putting Charleston Harbor on track to be the deepest East Coast harbor in 2021.
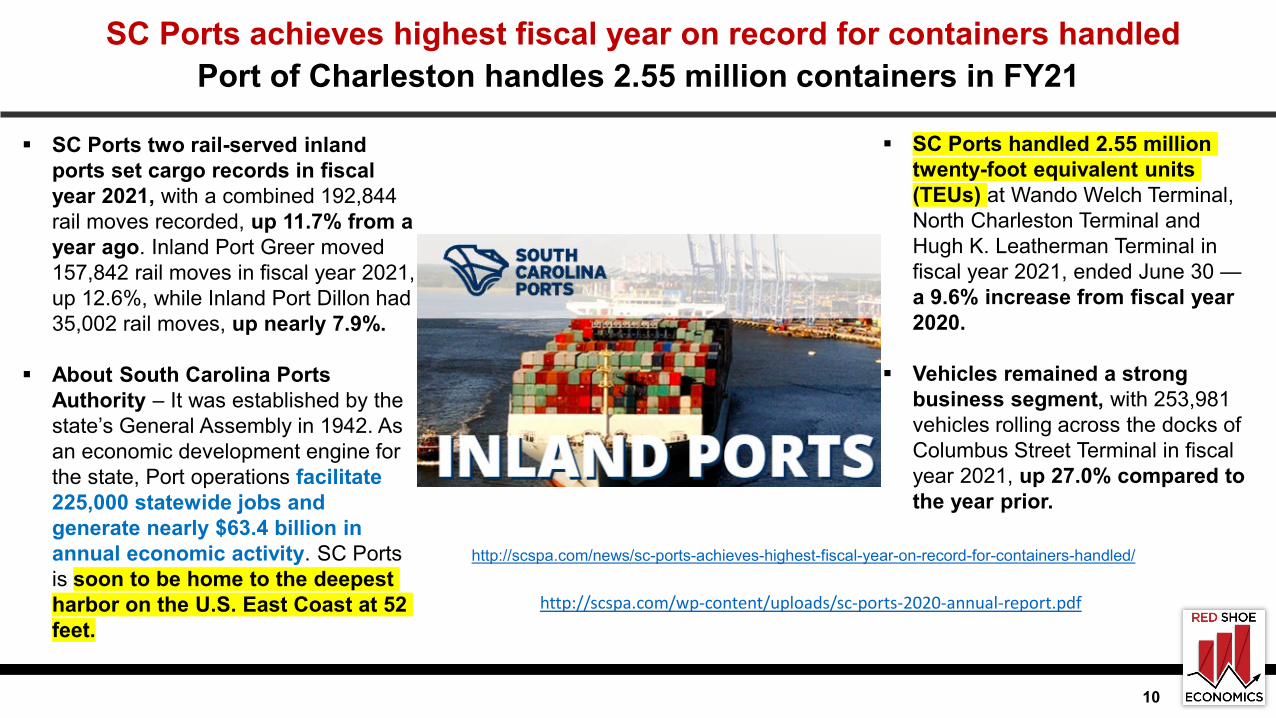
SC Ports achieves highest fiscal year on record for containers handledPort of Charleston handles 2.55 million containers in FY21
10
http://scspa.com/wp-content/uploads/sc-ports-2020-annual-report.pdf
SC Ports handled 2.55 million twenty-foot equivalent units (TEUs) at Wando Welch Terminal, North Charleston Terminal and Hugh K. Leatherman Terminal in fiscal year 2021, ended June 30 —a 9.6% increase from fiscal year 2020.
Vehicles remained a strong business segment, with 253,981 vehicles rolling across the docks of Columbus Street Terminal in fiscal year 2021, up 27.0% compared to the year prior.
SC Ports two rail-served inland ports set cargo records in fiscal year 2021, with a combined 192,844 rail moves recorded, up 11.7% from a year ago. Inland Port Greer moved 157,842 rail moves in fiscal year 2021, up 12.6%, while Inland Port Dillon had 35,002 rail moves, up nearly 7.9%.
About South Carolina Ports Authority – It was established by the state’s General Assembly in 1942. As an economic development engine for the state, Port operations facilitate 225,000 statewide jobs and generate nearly $63.4 billion in annual economic activity. SC Ports is soon to be home to the deepest harbor on the U.S. East Coast at 52 feet.
http://scspa.com/news/sc-ports-achieves-highest-fiscal-year-on-record-for-containers-handled/
https://siteselection.com/issues/2021/jan/state-of-the-states-2021-cover.cfm 11
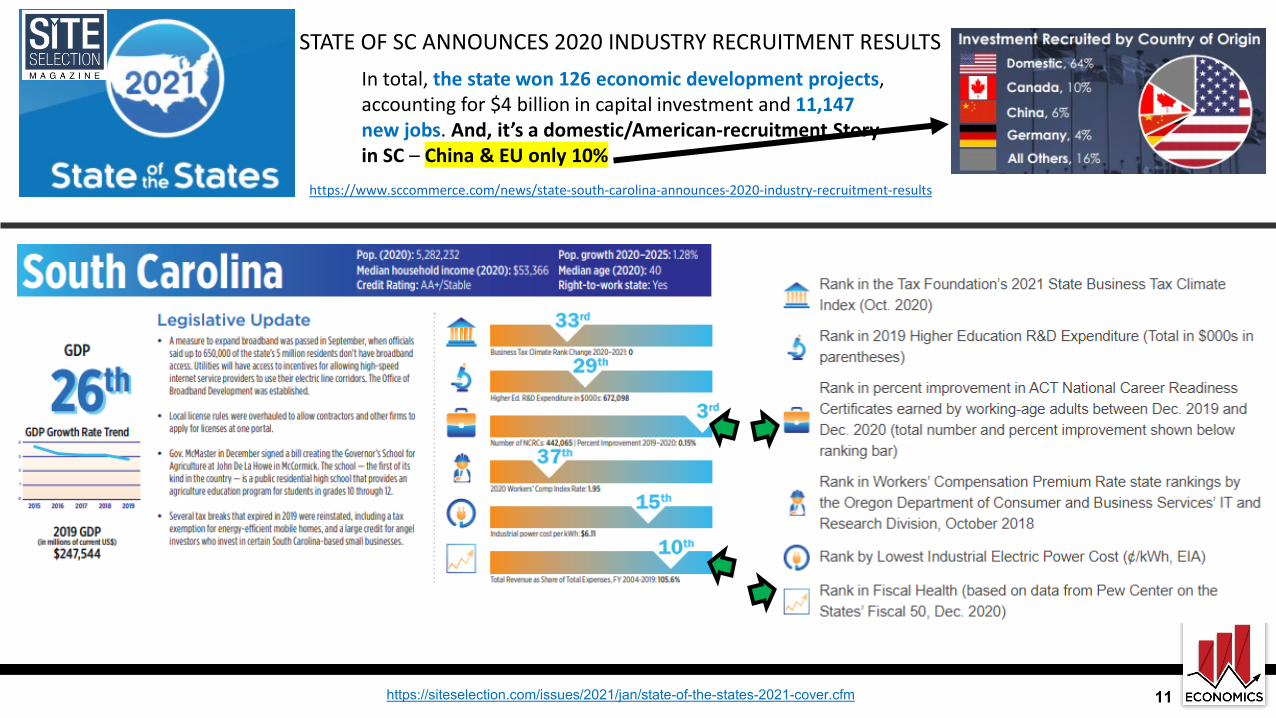
STATE OF SC ANNOUNCES 2020 INDUSTRY RECRUITMENT RESULTSIn total, the state won 126 economic development projects, accounting for $4 billion in capital investment and 11,147 new jobs. And, it’s a domestic/American-recruitment Story in SC – China & EU only 10%
https://www.sccommerce.com/news/state-south-carolina-announces-2020-industry-recruitment-results
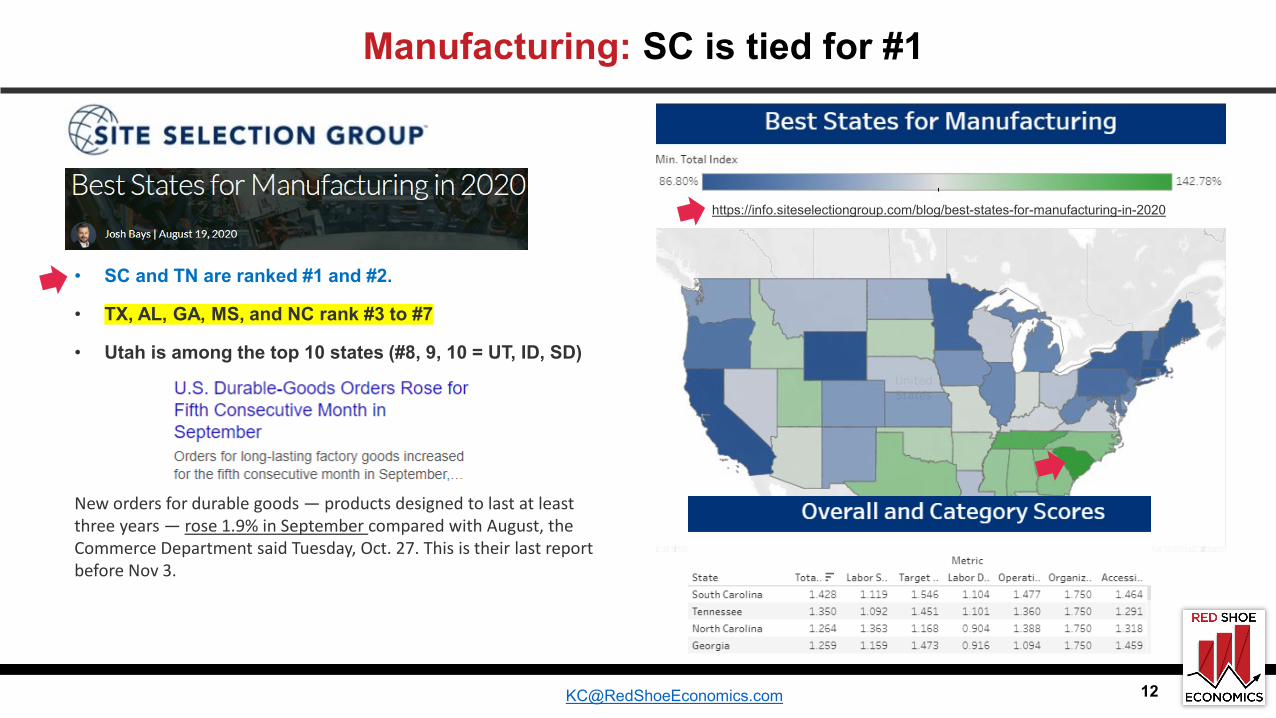
• SC and TN are ranked #1 and #2.
• TX, AL, GA, MS, and NC rank #3 to #7
• Utah is among the top 10 states (#8, 9, 10 = UT, ID, SD)
Manufacturing: SC is tied for #1
New orders for durable goods — products designed to last at least three years — rose 1.9% in September compared with August, the Commerce Department said Tuesday, Oct. 27. This is their last report before Nov 3.
https://info.siteselectiongroup.com/blog/best-states-for-manufacturing-in-2020
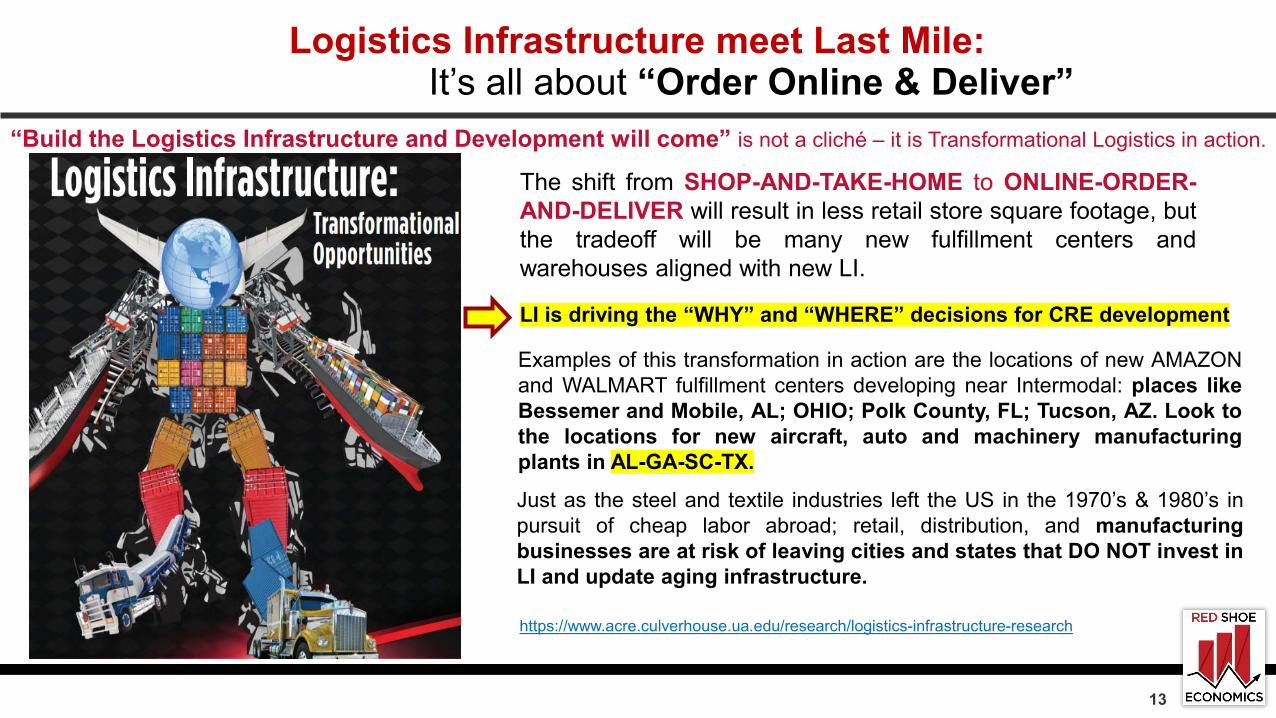
Logistics Infrastructure meet Last Mile: It’s all about “Order Online & Deliver”
https://www.acre.culverhouse.ua.edu/research/logistics-infrastructure-research
The shift from SHOP-AND-TAKE-HOME to ONLINE-ORDER-AND-DELIVER will result in less retail store square footage, butthe tradeoff will be many new fulfillment centers andwarehouses aligned with new LI.
Examples of this transformation in action are the locations of new AMAZONand WALMART fulfillment centers developing near Intermodal: places likeBessemer and Mobile, AL; OHIO; Polk County, FL; Tucson, AZ. Look tothe locations for new aircraft, auto and machinery manufacturingplants in AL-GA-SC-TX.
“Build the Logistics Infrastructure and Development will come” is not a cliché – it is Transformational Logistics in action.
Just as the steel and textile industries left the US in the 1970’s & 1980’s inpursuit of cheap labor abroad; retail, distribution, and manufacturingbusinesses are at risk of leaving cities and states that DO NOT invest inLI and update aging infrastructure.
LI is driving the “WHY” and “WHERE” decisions for CRE development
13
14https://www.ccim.com/newscenter/commercial-real-estate-insights-report/last-mile-logistics--commercial-real-estate-s-growth-engine/
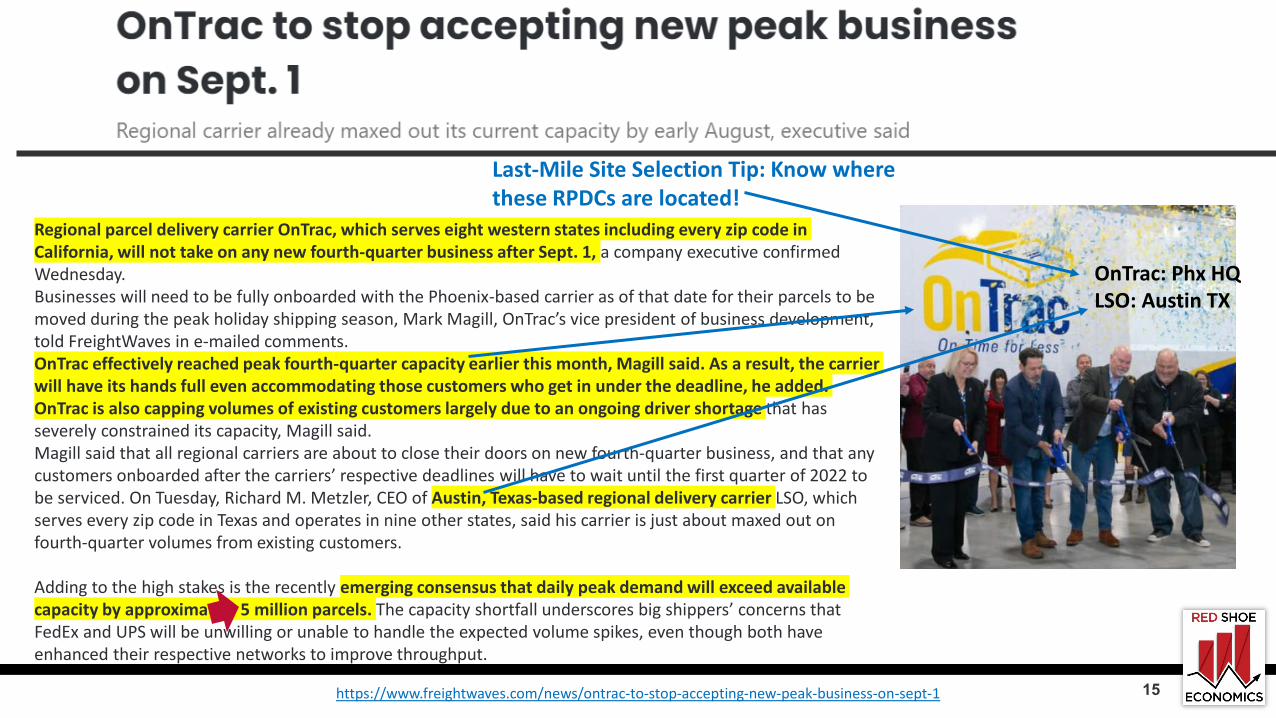
Regional parcel delivery carrier OnTrac, which serves eight western states including every zip code in California, will not take on any new fourth-quarter business after Sept. 1, a company executive confirmed Wednesday.Businesses will need to be fully onboarded with the Phoenix-based carrier as of that date for their parcels to be moved during the peak holiday shipping season, Mark Magill, OnTrac’s vice president of business development, told FreightWaves in e-mailed comments.OnTrac effectively reached peak fourth-quarter capacity earlier this month, Magill said. As a result, the carrier will have its hands full even accommodating those customers who get in under the deadline, he added. OnTrac is also capping volumes of existing customers largely due to an ongoing driver shortage that has severely constrained its capacity, Magill said.Magill said that all regional carriers are about to close their doors on new fourth-quarter business, and that any customers onboarded after the carriers’ respective deadlines will have to wait until the first quarter of 2022 to be serviced. On Tuesday, Richard M. Metzler, CEO of Austin, Texas-based regional delivery carrier LSO, which serves every zip code in Texas and operates in nine other states, said his carrier is just about maxed out on fourth-quarter volumes from existing customers.
Adding to the high stakes is the recently emerging consensus that daily peak demand will exceed available capacity by approximately 5 million parcels. The capacity shortfall underscores big shippers’ concerns that FedEx and UPS will be unwilling or unable to handle the expected volume spikes, even though both have enhanced their respective networks to improve throughput.
https://www.freightwaves.com/news/ontrac-to-stop-accepting-new-peak-business-on-sept-1 15
Last-Mile Site Selection Tip: Know where these RPDCs are located!
OnTrac: Phx HQLSO: Austin TX
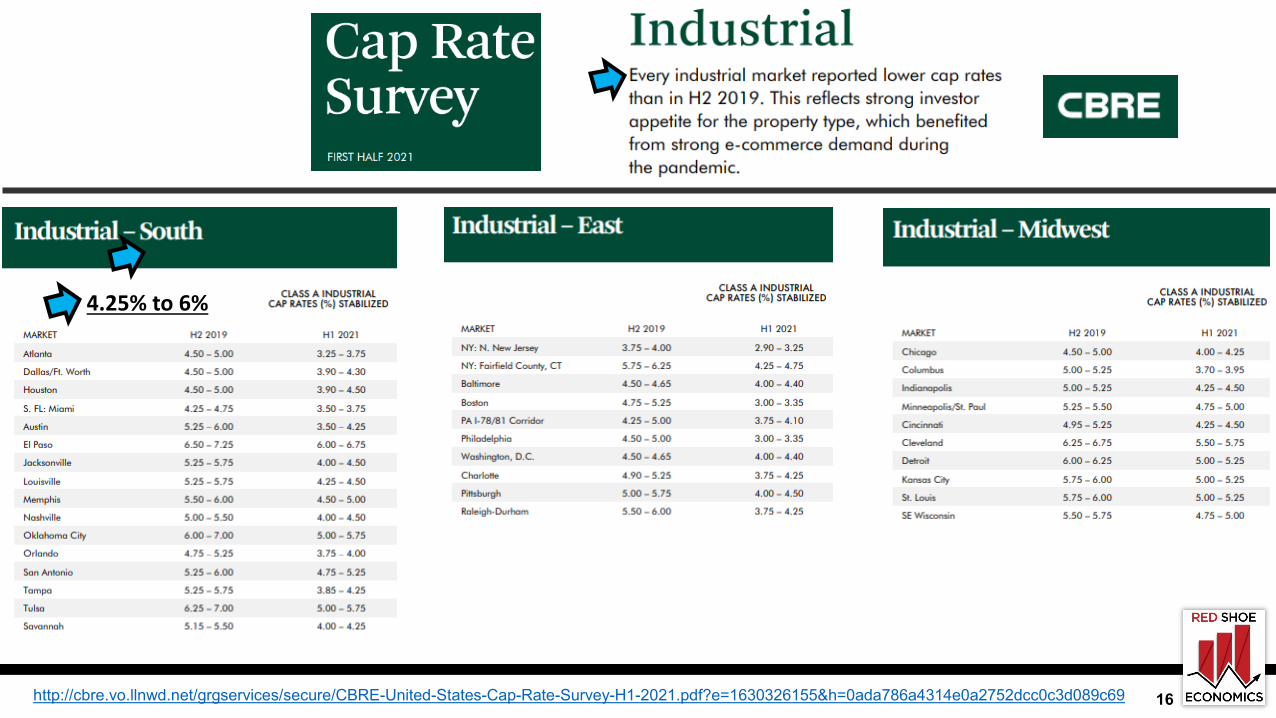
16http://cbre.vo.llnwd.net/grgservices/secure/CBRE-United-States-Cap-Rate-Survey-H1-2021.pdf?e=1630326155&h=0ada786a4314e0a2752dcc0c3d089c69
4.25% to 6%
17
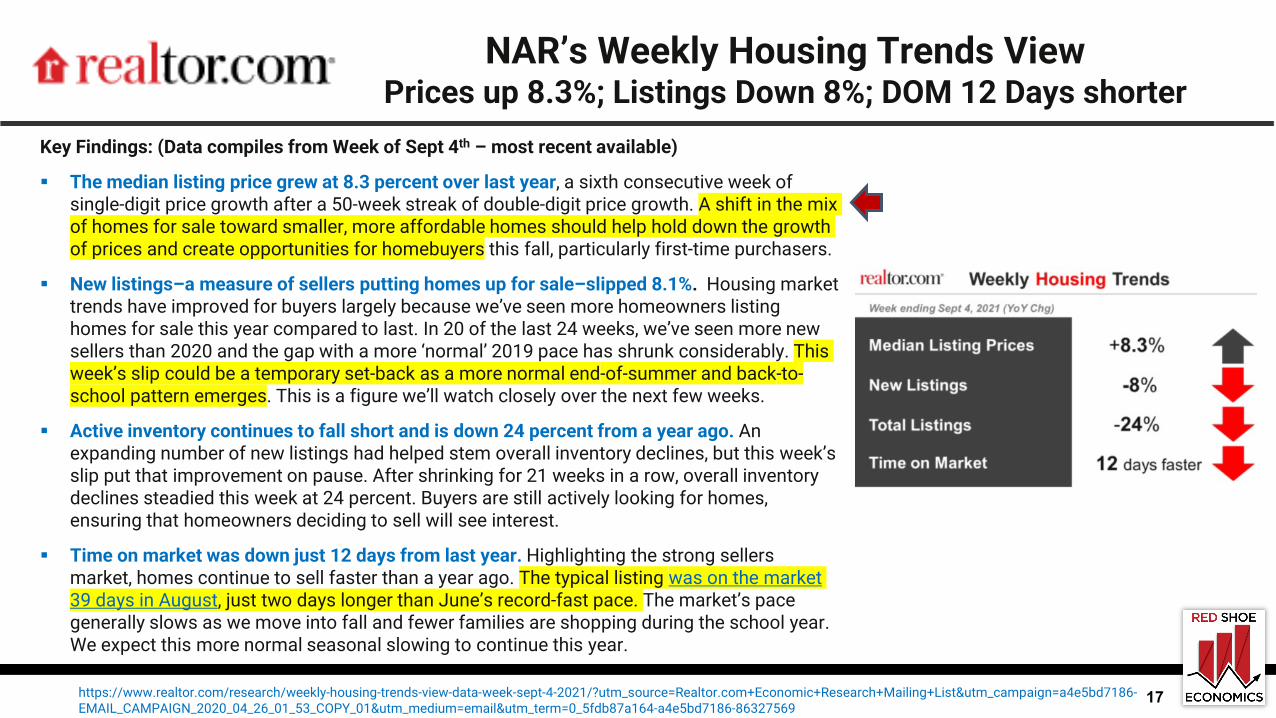
NAR’s Weekly Housing Trends ViewPrices up 8.3%; Listings Down 8%; DOM 12 Days shorter
Key Findings: (Data compiles from Week of Sept 4th – most recent available)
The median listing price grew at 8.3 percent over last year, a sixth consecutive week of single-digit price growth after a 50-week streak of double-digit price growth. A shift in the mix of homes for sale toward smaller, more affordable homes should help hold down the growth of prices and create opportunities for homebuyers this fall, particularly first-time purchasers.
New listings–a measure of sellers putting homes up for sale–slipped 8.1%. Housing market trends have improved for buyers largely because we’ve seen more homeowners listing homes for sale this year compared to last. In 20 of the last 24 weeks, we’ve seen more new sellers than 2020 and the gap with a more ‘normal’ 2019 pace has shrunk considerably. This week’s slip could be a temporary set-back as a more normal end-of-summer and back-to-school pattern emerges. This is a figure we’ll watch closely over the next few weeks.
Active inventory continues to fall short and is down 24 percent from a year ago. An expanding number of new listings had helped stem overall inventory declines, but this week’s slip put that improvement on pause. After shrinking for 21 weeks in a row, overall inventory declines steadied this week at 24 percent. Buyers are still actively looking for homes, ensuring that homeowners deciding to sell will see interest.
Time on market was down just 12 days from last year. Highlighting the strong sellers market, homes continue to sell faster than a year ago. The typical listing was on the market 39 days in August, just two days longer than June’s record-fast pace. The market’s pace generally slows as we move into fall and fewer families are shopping during the school year. We expect this more normal seasonal slowing to continue this year.
https://www.realtor.com/research/weekly-housing-trends-view-data-week-sept-4-2021/?utm_source=Realtor.com+Economic+Research+Mailing+List&utm_campaign=a4e5bd7186-EMAIL_CAMPAIGN_2020_04_26_01_53_COPY_01&utm_medium=email&utm_term=0_5fdb87a164-a4e5bd7186-86327569
18
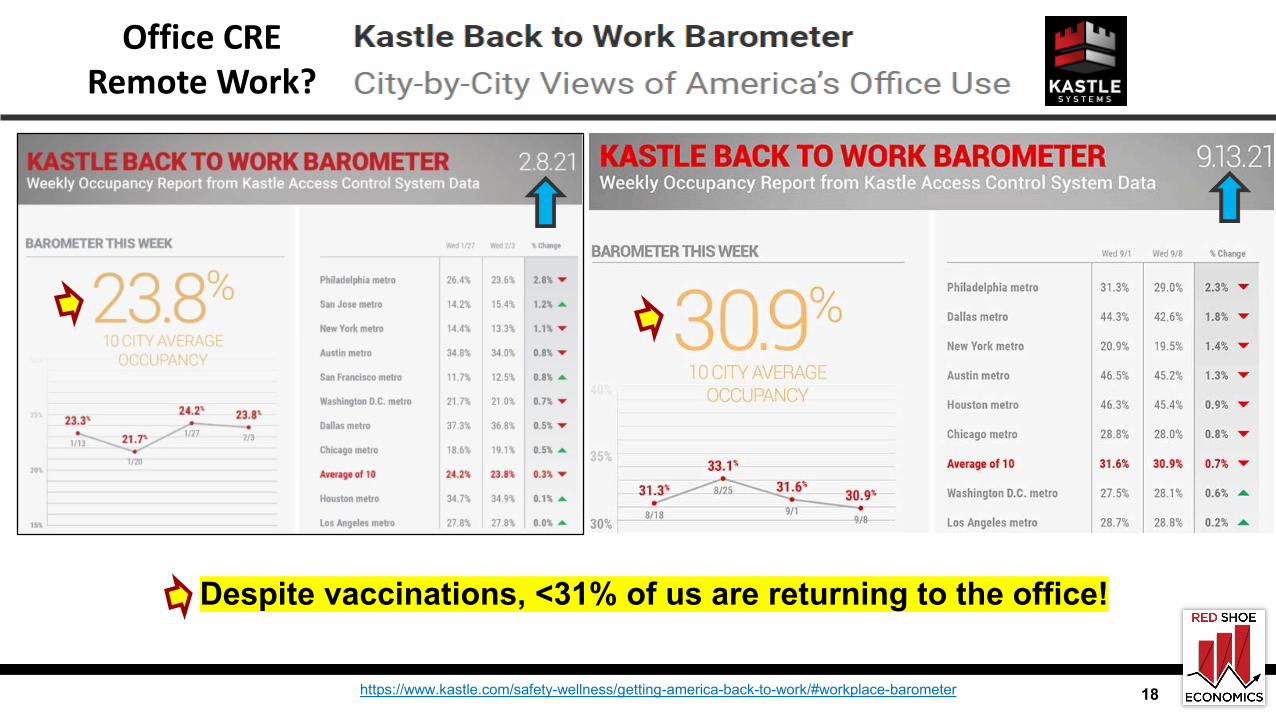
Despite vaccinations, <31% of us are returning to the office!
https://www.kastle.com/safety-wellness/getting-america-back-to-work/#workplace-barometer
Office CRERemote Work?
19
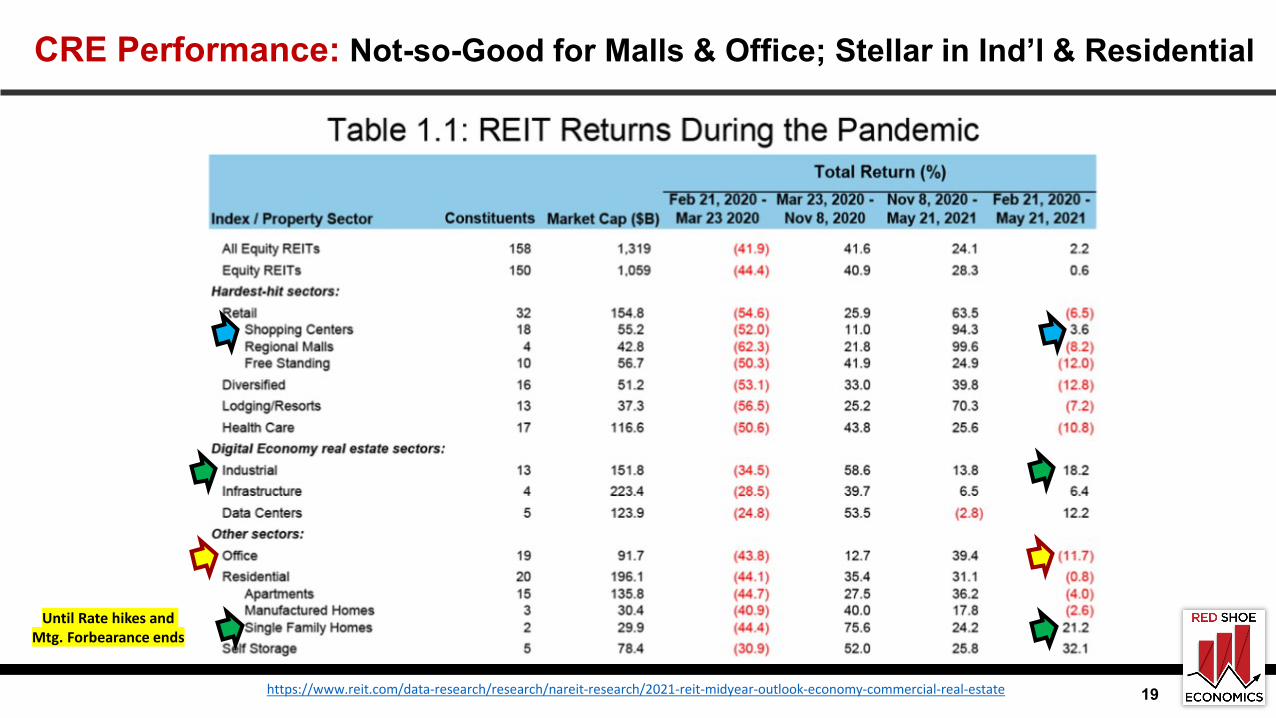
CRE Performance: Not-so-Good for Malls & Office; Stellar in Ind’l & Residential
https://www.reit.com/data-research/research/nareit-research/2021-reit-midyear-outlook-economy-commercial-real-estate
Until Rate hikes and Mtg. Forbearance ends

20
CONCLUSION: It’s early Fall – Take Luke’s & Charlie’s Advice!
Enjoy a Cold Root Beer; Or one more Day at Palmetto BluffsThere will be PLENTY to worry about come this Winter!
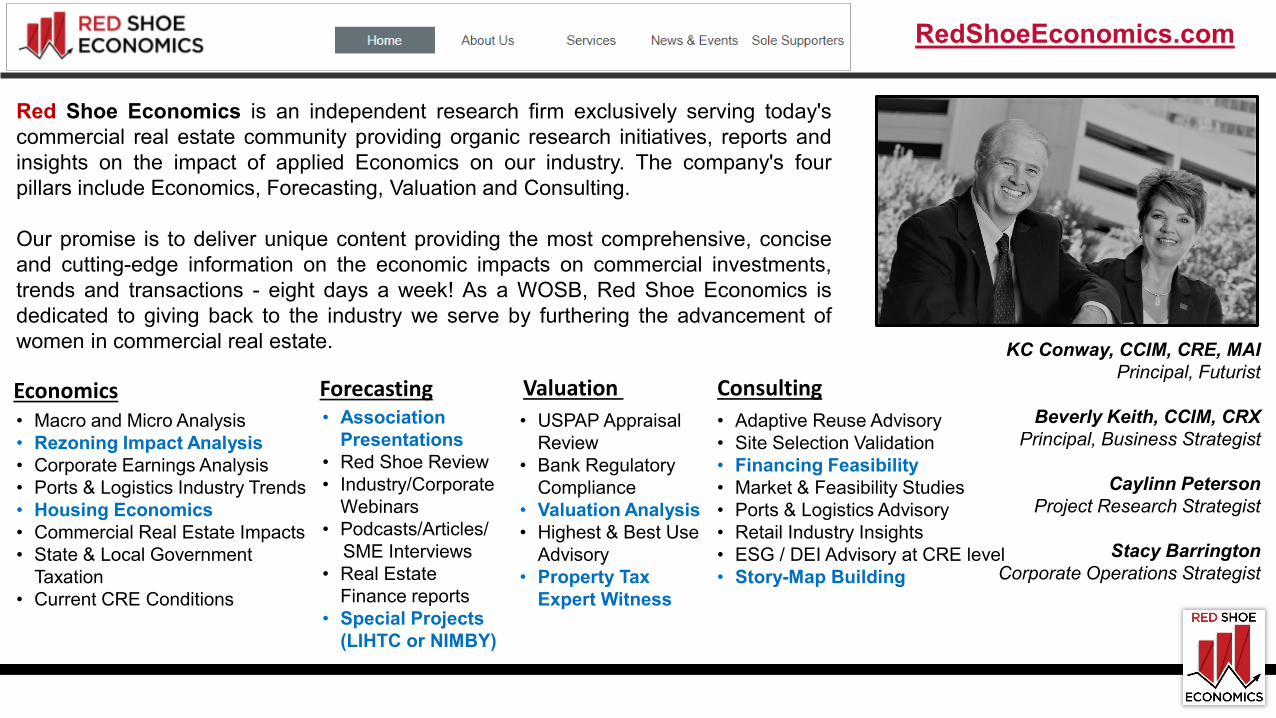
Red Shoe Economics is an independent research firm exclusively serving today'scommercial real estate community providing organic research initiatives, reports andinsights on the impact of applied Economics on our industry. The company's fourpillars include Economics, Forecasting, Valuation and Consulting.
Our promise is to deliver unique content providing the most comprehensive, conciseand cutting-edge information on the economic impacts on commercial investments,trends and transactions - eight days a week! As a WOSB, Red Shoe Economics isdedicated to giving back to the industry we serve by furthering the advancement ofwomen in commercial real estate. KC Conway, CCIM, CRE, MAI
Principal, Futurist
Beverly Keith, CCIM, CRXPrincipal, Business Strategist
Caylinn PetersonProject Research Strategist
Stacy BarringtonCorporate Operations Strategist
Economics Forecasting• Macro and Micro Analysis• Rezoning Impact Analysis• Corporate Earnings Analysis• Ports & Logistics Industry Trends• Housing Economics• Commercial Real Estate Impacts• State & Local Government
Taxation• Current CRE Conditions
• Association Presentations
• Red Shoe Review • Industry/Corporate
Webinars • Podcasts/Articles/
SME Interviews • Real Estate
Finance reports• Special Projects
(LIHTC or NIMBY)
Valuation Consulting• USPAP Appraisal
Review• Bank Regulatory
Compliance• Valuation Analysis• Highest & Best Use
Advisory • Property Tax
Expert Witness
• Adaptive Reuse Advisory • Site Selection Validation • Financing Feasibility • Market & Feasibility Studies• Ports & Logistics Advisory• Retail Industry Insights• ESG / DEI Advisory at CRE level• Story-Map Building
RedShoeEconomics.com