Embed Size (px)
Citation preview
ORI GIN AL PA PER
KCl-Induced Corrosion of the FeCrAl Alloy Kanthal�
AF at 600 �C and the Effect of H2O
N. Israelsson • K. Hellstrom • J.-E. Svensson •
L.-G. Johansson
Received: 30 May 2013 / Revised: 17 October 2014 / Published online: 29 October 2014
� The Author(s) 2014. This article is published with open access at Springerlink.com
Abstract The present study investigates the influence of H2O and KCl on the
high-temperature corrosion of the FeCrAl alloy Kanthal� AF. Polished samples,
with and without applied KCl, were exposed isothermally to O2 or O2 ? H2O at
600 �C. The samples were investigated using TGA, XRD, SEM/EDX, AES and IC.
It was found that KCl accelerates corrosion and that a rapidly growing iron, chro-
mium-rich oxide forms in both environments. Chromate formation and alloy
chlorination are shown to initiate the formation of non-protective oxide scales. In
addition, aluminium nitrides form in the alloy substrate in both environments.
Keywords FeCrAl � High temperature corrosion � Water vapour � KCl
Introduction
It is well known that the high-temperature corrosion of chromia-forming steels in an
oxidising environment is accelerated by alkali chlorides and by high concentrations
of water vapour [1–14]. The accelerated effect of water vapour has been shown to
be connected to chromia evaporation in the form of CrO2(OH)2 [1, 2]. The resulting
chromium-depleted (Fe,Cr)2O3 mixture has poor protective properties in compar-
ison to the chromium-rich mixed oxide. This corrosion mechanism of stainless steel
is significant at temperatures as low as 600 �C.
The high corrosivity of alkali chlorides on stainless steel at elevated temperatures
has been attributed to an ‘‘active corrosion’’ (chlorine cycle) mechanism [3–5, 9–12],
N. Israelsson (&) � K. Hellstrom � J.-E. Svensson � L.-G. Johansson
The Swedish Competence Centre for High Temperature Corrosion, Department of Environmental
Inorganic Chemistry, Chalmers University of Technology, SE-412 96 Goteborg, Sweden
e-mail: [email protected]
123
Oxid Met (2015) 83:1–27
DOI 10.1007/s11085-014-9506-3
where alkali chlorides primarily are regarded as sources for molecular chlorine.
However, recent reports show that the alkali cation also plays an important role in
the corrosion attack [6, 7, 15]. Initially, alkali reacts with chromia in the protective
oxide to form a solid alkali chromate (VI). The reactions are rapid at 600 �C and
also result in the conversion of the protective oxide into a poorly protective iron-rich
scale. Subsequently, chlorine or chloride ions can penetrate the scale, forming
transition metal chlorides at the scale metal interface. The formation of sub-scale
chlorides further accelerates corrosion due, for example, to decreased scale
adhesion.
In contrast to chromia (and the solid-solution (CrxFe1-x)2O3), alumina (Al2O3) is
not expected to form compounds with alkali chlorides at intermediate temperature.
Consequently, it appears worthwhile to investigate the usefulness of alumina-
forming alloys (e.g., FeCrAl) in environments where chromia-forming stainless
steels suffer from rapid corrosion. The literature on the corrosion properties of
FeCrAl alloys at temperatures lower than 700 �C is quite scarce, however some
studies have been performed [13, 16, 17]. The common view is that the temperature
is too low to obtain a protective oxide scale on FeCrAl alloys. This work addresses
the corrosion behaviour of an FeCrAl alloy (Kanthal� AF) in the presence of KCl in
dry and wet environments.
Experimental Methods
Material and Preparation
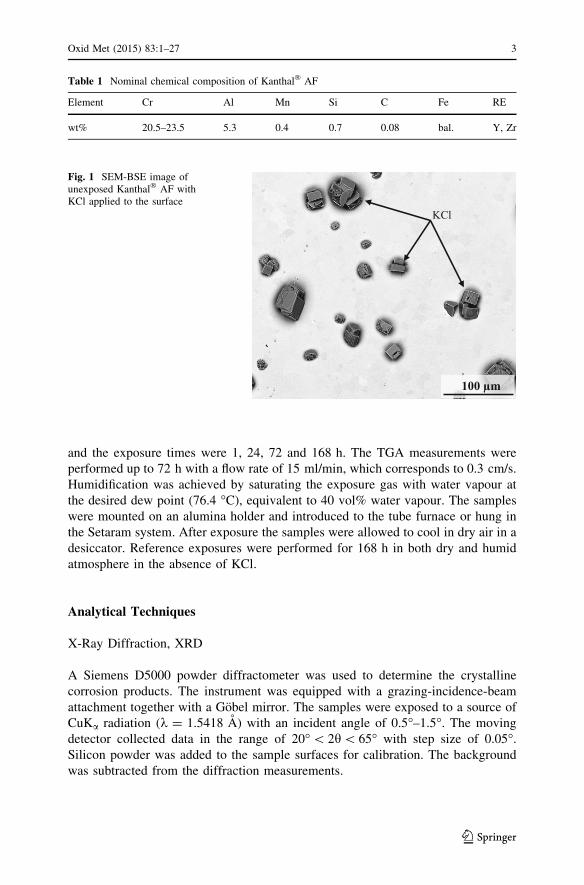
A commercial FeCrAl alloy, Kanthal� AF containing nominally 21 wt% Cr, 5 wt%
Al balanced with Fe (for nominal composition, see Table 1) was used in this study.
In addition to the main alloying elements, very small amounts of trace elements (Si,
Mn and Mg) and reactive elements (Y, Zr) were present in the alloy. A detailed
description of the oxidation behaviour of the reactive elements can be found in Ref.
[18]. The samples were ground and polished down to 1 lm finish, thereafter they
were ultrasonically cleaned in water, acetone and ethanol. A saturated solution of
KCl in water/ethanol was used for applying KCl to the surfaces. The specimen was
alternately sprayed and dried with warm air (*35 �C) in order to avoid the
formation of droplets on the surface. Each sample was applied with 0.05 mg KCl/
cm2. The samples were then placed in a desiccator to cool, and their weight was
recorded using an analytical balance. The size of the salt crystals was in the range of
10–50 lm, see Fig. 1. The corrosion exposure was started immediately after
recording the sample mass.
Exposures
The exposures were performed in a horizontal tube furnace and a Setaram
instrument with 5 % O2 þ 95 % N2 or 5 % O2 þ 40 % H2O þ 55 % N2 at 600 �C.
The flow rate in the tube furnace was 1,000 ml/min, which corresponds to 3.2 cm/s,
2 Oxid Met (2015) 83:1–27
123
and the exposure times were 1, 24, 72 and 168 h. The TGA measurements were
performed up to 72 h with a flow rate of 15 ml/min, which corresponds to 0.3 cm/s.
Humidification was achieved by saturating the exposure gas with water vapour at
the desired dew point (76.4 �C), equivalent to 40 vol% water vapour. The samples
were mounted on an alumina holder and introduced to the tube furnace or hung in
the Setaram system. After exposure the samples were allowed to cool in dry air in a
desiccator. Reference exposures were performed for 168 h in both dry and humid
atmosphere in the absence of KCl.
Analytical Techniques
X-Ray Diffraction, XRD
A Siemens D5000 powder diffractometer was used to determine the crystalline
corrosion products. The instrument was equipped with a grazing-incidence-beam
attachment together with a Gobel mirror. The samples were exposed to a source of
CuKa radiation (k = 1.5418 A) with an incident angle of 0.5�–1.5�. The moving
detector collected data in the range of 20� \ 2h\ 65� with step size of 0.05�.
Silicon powder was added to the sample surfaces for calibration. The background
was subtracted from the diffraction measurements.
Table 1 Nominal chemical composition of Kanthal� AF
Element Cr Al Mn Si C Fe RE
wt% 20.5–23.5 5.3 0.4 0.7 0.08 bal. Y, Zr
KCl
100 µm
Fig. 1 SEM-BSE image ofunexposed Kanthal� AF withKCl applied to the surface
Oxid Met (2015) 83:1–27 3
123
Thermo Gravimetric Analysis, TGA
A Setaram TAG thermobalance was used to study the oxidation kinetics at 600 �C
for up to 72 h. An alumina reference sample with the same geometry as the exposed
sample was used to diminish the buoyancy effect. In addition, the ex situ weight
gains were recorded using an analytical balance. The data were plotted from the
time when the isothermal exposure temperature was reached. The time to reach
600 �C was about 6 min.
Ion Chromatography, IC
A Dionex ICS-90 system was used to establish the amount of water-soluble anions
(CrO42-, Cl-) on the surface after exposure. The anions were analysed with an
IonPac AS4A-SC analytic column and with 1.8 mM Na2CO3/1.7 mM NaHCO3 as
elution. A Dionex OnGuard II H was used to prevent metal ions from entering the
column. The samples were leached in 5 ml Milli-Q water using ultrasonic agitation
for 10 ? 10 min. The elution was 20 mM sulfonic acid and the flow rate was 2 ml/
min. The detection limits for the different species were: Cl- = 0.03 and
CrO42- = 0.01 lmol.
Scanning Electron Microscopy with Energy Dispersive X-ray Spectroscopy,
SEM/EDX
The microscopy analysis was done using an FEI Quanta 200 FEG ESEM operated
in high vacuum mode. The instrument was equipped with an Oxford Inca EDX
system, which was used for chemical quantification and elemental mapping. The
ESEM was operated at 8–10 kV for imaging and EDX analysis.
A Gatan Ilion? broad ion beam system was used to prepare cross sections by
sputtering argon ions. The ion gun was operated at 6 kV and the sputter time was
2–3 h.
Auger Electron Spectroscopy, AES
Auger electron spectroscopy was used to estimate oxide thickness and to determine
elemental depth distribution. The AES analyses were performed with a PHI 660
scanning auger microprobe (SAM) using an accelerating voltage of 10 kV and a
beam current of 200 nA. AES depth profiling was performed using ion sputtering
with 3.5 keV Ar?. Two areas were analysed; one smaller 10 9 10 lm2 and one
larger 90 9 120 lm2. They exhibited almost the same oxide thickness and
elemental depth distribution.
Quantitative analyses were performed using the peak-to-peak height of the Auger
transitions of a specific element together with sensitivity factors provided by PHI,
except for the Al and O, which were calibrated against pure Al2O3. Since the
sensitivity factors for oxygen in Cr2O3 and Fe2O3 are different from that for Al2O3
the oxygen signal will be slightly off when mixtures of the oxides are present [19].
4 Oxid Met (2015) 83:1–27
123
The computer software PHI-Matlab and linear least square (LLS) routines were
used to separate the oxide and metal components in the depth profiles.
Results
Oxidation in Dry O2 and O2 ? H2O
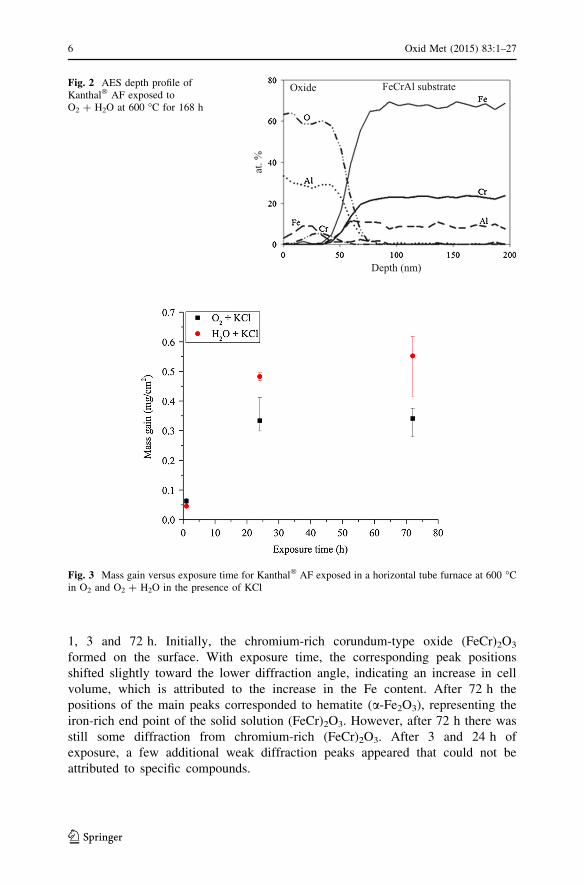
Exposure of Kanthal� AF for 168 h in O2 and O2 ? H2O at 600 �C in the absence
of KCl resulted in very low mass gains, about 7 lg/cm2 in dry O2 and 9 lg/cm2 in
O2 ? H2O. After exposure, the surface was almost featureless, being covered by a
thin and smooth oxide film. In addition, RE-rich oxide particles (1–3 lm in
diameter) were scattered over the surface. After 168 h exposure the oxide film was
analysed using AES, showing a thickness of the base oxide of about 45 nm in O2
(not shown) and 55 nm in O2 ? H2O (Fig. 2), in good agreement with the recorded
mass gains. The analyses showed essentially the same oxide composition in the two
environments. The oxide film was dominated by aluminium but significant amounts
of iron and chromium were also present. Chromia was enriched in a band in the
middle of the oxide film while iron oxide was consistently found outside the
chromia band. The bottom part of the film consisted of relatively pure aluminium
oxide. Thus the oxide film was dominated by aluminium (30–40 at.% Al) and also
contained 0–10 at.% of Fe and Cr. XRD showed clear evidence of chromium-rich
corundum-type Me2O3 while no aluminium-containing crystalline product was
identified. The film formed after 24 h (not shown) was similar to the one formed
after 168 h, except that it was slightly thinner and less aluminium-rich.
Oxidation in Dry O2 in the Presence of KCl
Gravimetry
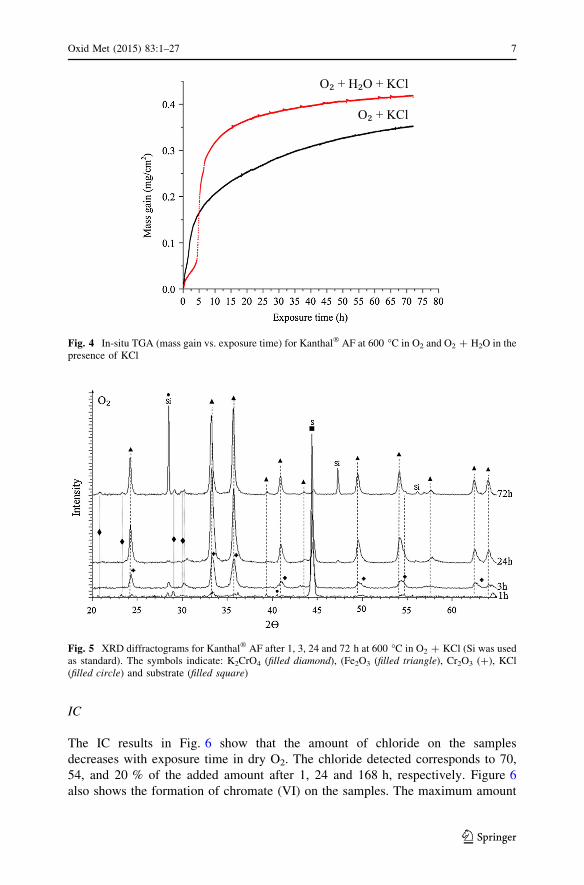
Figure 3 shows mass gain in O2 at 600 �C in the presence of KCl. After 72 h, the
mass gain was about 40 times higher than the samples exposed in the absence of
KCl (not shown). The mass gains were large compared to the amount of KCl added
before exposure (0.05 mg/cm2). The mass gain was relatively rapid during the first
24 h and then continued at a slower rate. The samples subjected to 168 h of
exposure in the tube furnace exhibited breakaway corrosion and scale spallation
during cooling. The in situ TG curves in Fig. 4 provide much more detail on the
reaction kinetics than Fig. 3. They are described in the O2 ? H2O ? KCl section
below.
XRD
Figure 5 shows XRD patterns acquired in dry O2 ? KCl. It may be noted that
KCl was only detected after one and three hours, indicating that, with time, KCl is
completely consumed by reaction and/or vaporization. K2CrO4 was detected after
Oxid Met (2015) 83:1–27 5
123
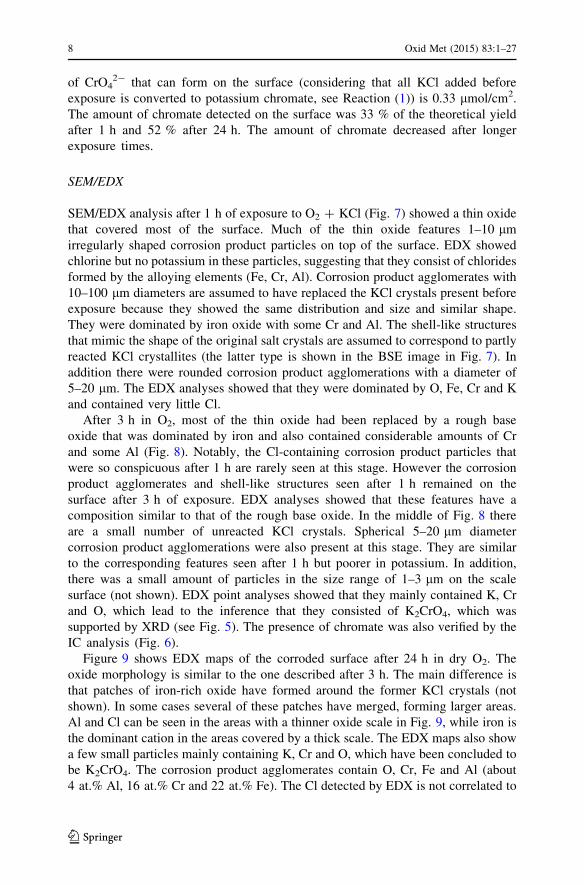
1, 3 and 72 h. Initially, the chromium-rich corundum-type oxide (FeCr)2O3
formed on the surface. With exposure time, the corresponding peak positions
shifted slightly toward the lower diffraction angle, indicating an increase in cell
volume, which is attributed to the increase in the Fe content. After 72 h the
positions of the main peaks corresponded to hematite (a-Fe2O3), representing the
iron-rich end point of the solid solution (FeCr)2O3. However, after 72 h there was
still some diffraction from chromium-rich (FeCr)2O3. After 3 and 24 h of
exposure, a few additional weak diffraction peaks appeared that could not be
attributed to specific compounds.
Oxide FeCrAl substrate
Depth (nm) at
. %
Fig. 2 AES depth profile ofKanthal� AF exposed toO2 ? H2O at 600 �C for 168 h
Fig. 3 Mass gain versus exposure time for Kanthal� AF exposed in a horizontal tube furnace at 600 �Cin O2 and O2 ? H2O in the presence of KCl
6 Oxid Met (2015) 83:1–27
123
IC
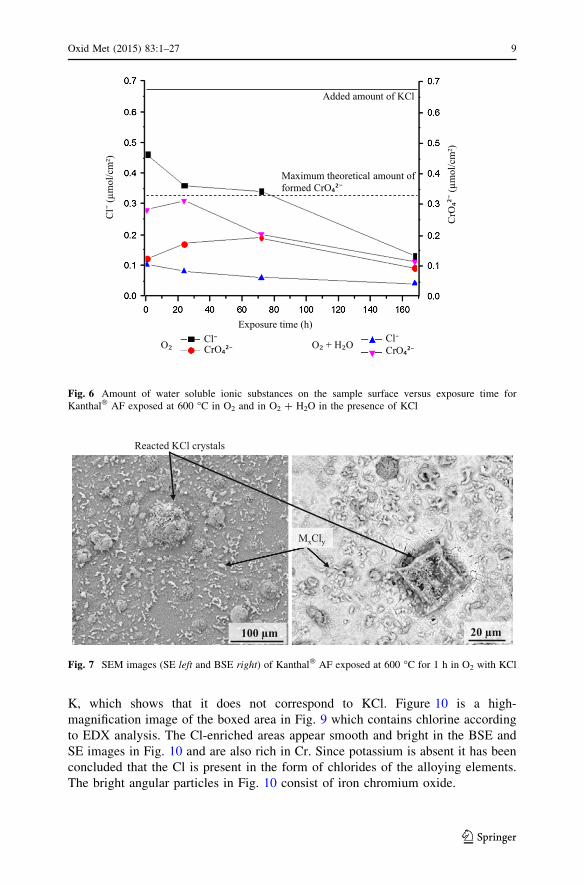
The IC results in Fig. 6 show that the amount of chloride on the samples
decreases with exposure time in dry O2. The chloride detected corresponds to 70,
54, and 20 % of the added amount after 1, 24 and 168 h, respectively. Figure 6
also shows the formation of chromate (VI) on the samples. The maximum amount
O₂ + H₂O + KCl
O₂ + KCl
Fig. 4 In-situ TGA (mass gain vs. exposure time) for Kanthal� AF at 600 �C in O2 and O2 ? H2O in thepresence of KCl
Fig. 5 XRD diffractograms for Kanthal� AF after 1, 3, 24 and 72 h at 600 �C in O2 ? KCl (Si was usedas standard). The symbols indicate: K2CrO4 (filled diamond), (Fe2O3 (filled triangle), Cr2O3 (?), KCl(filled circle) and substrate (filled square)
Oxid Met (2015) 83:1–27 7
123
of CrO42- that can form on the surface (considering that all KCl added before
exposure is converted to potassium chromate, see Reaction (1)) is 0.33 lmol/cm2.
The amount of chromate detected on the surface was 33 % of the theoretical yield
after 1 h and 52 % after 24 h. The amount of chromate decreased after longer
exposure times.
SEM/EDX
SEM/EDX analysis after 1 h of exposure to O2 ? KCl (Fig. 7) showed a thin oxide
that covered most of the surface. Much of the thin oxide features 1–10 lm
irregularly shaped corrosion product particles on top of the surface. EDX showed
chlorine but no potassium in these particles, suggesting that they consist of chlorides
formed by the alloying elements (Fe, Cr, Al). Corrosion product agglomerates with
10–100 lm diameters are assumed to have replaced the KCl crystals present before
exposure because they showed the same distribution and size and similar shape.
They were dominated by iron oxide with some Cr and Al. The shell-like structures
that mimic the shape of the original salt crystals are assumed to correspond to partly
reacted KCl crystallites (the latter type is shown in the BSE image in Fig. 7). In
addition there were rounded corrosion product agglomerations with a diameter of
5–20 lm. The EDX analyses showed that they were dominated by O, Fe, Cr and K
and contained very little Cl.
After 3 h in O2, most of the thin oxide had been replaced by a rough base
oxide that was dominated by iron and also contained considerable amounts of Cr
and some Al (Fig. 8). Notably, the Cl-containing corrosion product particles that
were so conspicuous after 1 h are rarely seen at this stage. However the corrosion
product agglomerates and shell-like structures seen after 1 h remained on the
surface after 3 h of exposure. EDX analyses showed that these features have a
composition similar to that of the rough base oxide. In the middle of Fig. 8 there
are a small number of unreacted KCl crystals. Spherical 5–20 lm diameter
corrosion product agglomerations were also present at this stage. They are similar
to the corresponding features seen after 1 h but poorer in potassium. In addition,
there was a small amount of particles in the size range of 1–3 lm on the scale
surface (not shown). EDX point analyses showed that they mainly contained K, Cr
and O, which lead to the inference that they consisted of K2CrO4, which was
supported by XRD (see Fig. 5). The presence of chromate was also verified by the
IC analysis (Fig. 6).
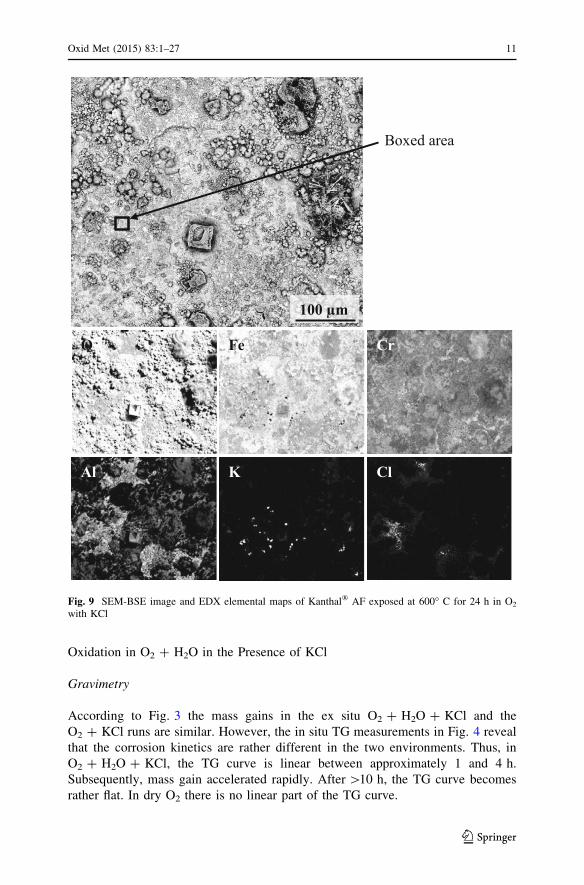
Figure 9 shows EDX maps of the corroded surface after 24 h in dry O2. The
oxide morphology is similar to the one described after 3 h. The main difference is
that patches of iron-rich oxide have formed around the former KCl crystals (not
shown). In some cases several of these patches have merged, forming larger areas.
Al and Cl can be seen in the areas with a thinner oxide scale in Fig. 9, while iron is
the dominant cation in the areas covered by a thick scale. The EDX maps also show
a few small particles mainly containing K, Cr and O, which have been concluded to
be K2CrO4. The corrosion product agglomerates contain O, Cr, Fe and Al (about
4 at.% Al, 16 at.% Cr and 22 at.% Fe). The Cl detected by EDX is not correlated to
8 Oxid Met (2015) 83:1–27
123
K, which shows that it does not correspond to KCl. Figure 10 is a high-
magnification image of the boxed area in Fig. 9 which contains chlorine according
to EDX analysis. The Cl-enriched areas appear smooth and bright in the BSE and
SE images in Fig. 10 and are also rich in Cr. Since potassium is absent it has been
concluded that the Cl is present in the form of chlorides of the alloying elements.
The bright angular particles in Fig. 10 consist of iron chromium oxide.
O₂ O₂ + H₂O Cl⁻CrO₄²⁻
Cl⁻CrO₄²⁻
Exposure time (h)
Cl⁻
(μm
ol/c
m²)
CrO
₄²⁻
(μm
ol/c
m²)
Added amount of KCl
Maximum theoretical amount of formed CrO₄²⁻
Fig. 6 Amount of water soluble ionic substances on the sample surface versus exposure time forKanthal� AF exposed at 600 �C in O2 and in O2 ? H2O in the presence of KCl
Reacted KCl crystals
MxCly
100 µm 20 µm
Fig. 7 SEM images (SE left and BSE right) of Kanthal� AF exposed at 600 �C for 1 h in O2 with KCl
Oxid Met (2015) 83:1–27 9
123
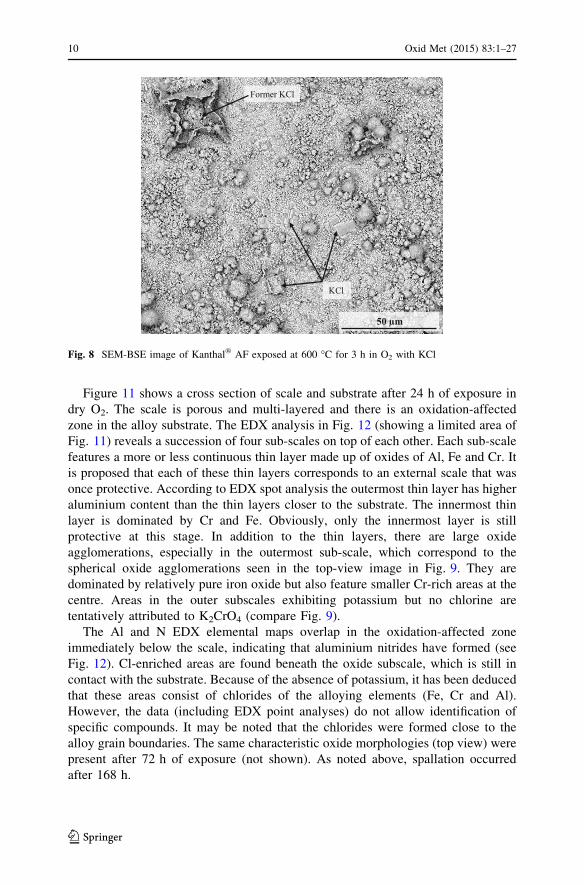
Figure 11 shows a cross section of scale and substrate after 24 h of exposure in
dry O2. The scale is porous and multi-layered and there is an oxidation-affected
zone in the alloy substrate. The EDX analysis in Fig. 12 (showing a limited area of
Fig. 11) reveals a succession of four sub-scales on top of each other. Each sub-scale
features a more or less continuous thin layer made up of oxides of Al, Fe and Cr. It
is proposed that each of these thin layers corresponds to an external scale that was
once protective. According to EDX spot analysis the outermost thin layer has higher
aluminium content than the thin layers closer to the substrate. The innermost thin
layer is dominated by Cr and Fe. Obviously, only the innermost layer is still
protective at this stage. In addition to the thin layers, there are large oxide
agglomerations, especially in the outermost sub-scale, which correspond to the
spherical oxide agglomerations seen in the top-view image in Fig. 9. They are
dominated by relatively pure iron oxide but also feature smaller Cr-rich areas at the
centre. Areas in the outer subscales exhibiting potassium but no chlorine are
tentatively attributed to K2CrO4 (compare Fig. 9).
The Al and N EDX elemental maps overlap in the oxidation-affected zone
immediately below the scale, indicating that aluminium nitrides have formed (see
Fig. 12). Cl-enriched areas are found beneath the oxide subscale, which is still in
contact with the substrate. Because of the absence of potassium, it has been deduced
that these areas consist of chlorides of the alloying elements (Fe, Cr and Al).
However, the data (including EDX point analyses) do not allow identification of
specific compounds. It may be noted that the chlorides were formed close to the
alloy grain boundaries. The same characteristic oxide morphologies (top view) were
present after 72 h of exposure (not shown). As noted above, spallation occurred
after 168 h.
KCl
50 µm
Former KCl
Fig. 8 SEM-BSE image of Kanthal� AF exposed at 600 �C for 3 h in O2 with KCl
10 Oxid Met (2015) 83:1–27
123
Oxidation in O2 ? H2O in the Presence of KCl
Gravimetry
According to Fig. 3 the mass gains in the ex situ O2 ? H2O ? KCl and the
O2 ? KCl runs are similar. However, the in situ TG measurements in Fig. 4 reveal
that the corrosion kinetics are rather different in the two environments. Thus, in
O2 ? H2O ? KCl, the TG curve is linear between approximately 1 and 4 h.
Subsequently, mass gain accelerated rapidly. After [10 h, the TG curve becomes
rather flat. In dry O2 there is no linear part of the TG curve.
Boxed area
100 µm
O CrFe
Al ClK
Fig. 9 SEM-BSE image and EDX elemental maps of Kanthal� AF exposed at 600� C for 24 h in O2
with KCl
Oxid Met (2015) 83:1–27 11
123
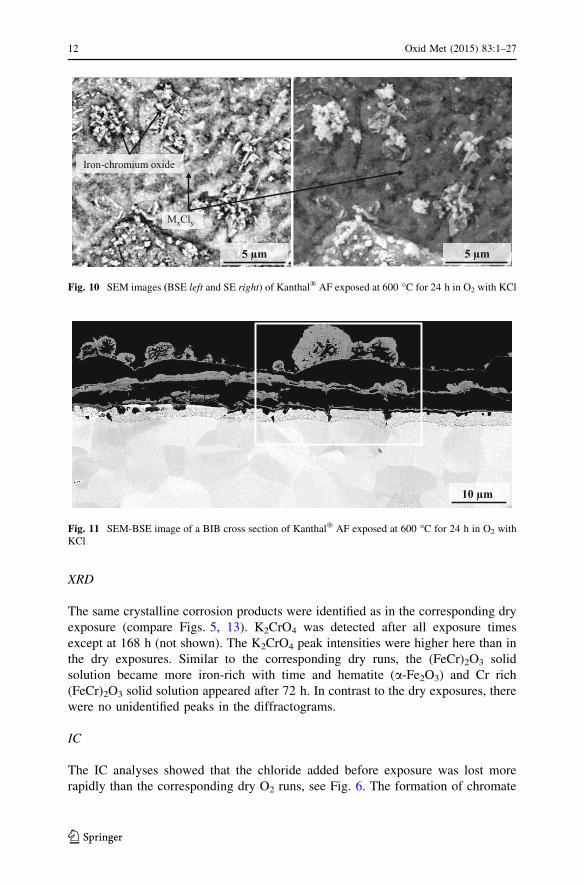
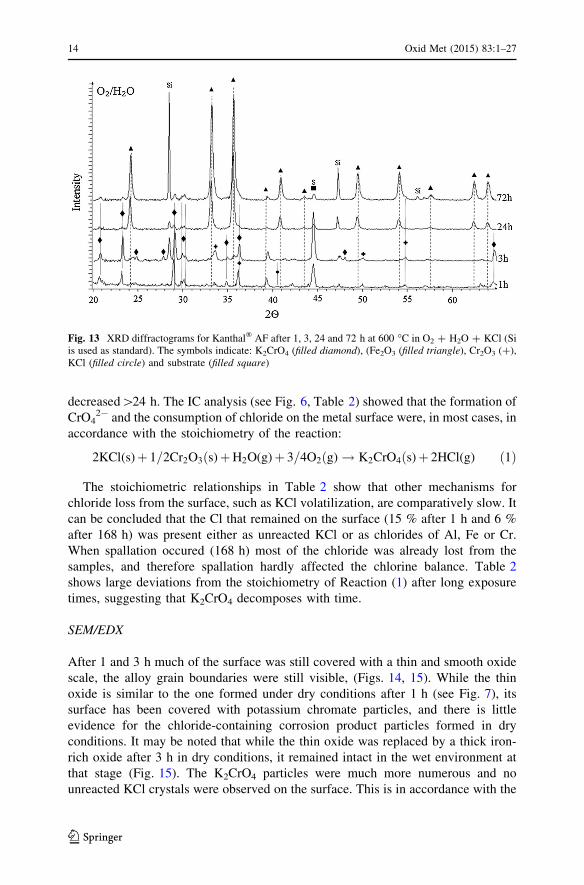
XRD
The same crystalline corrosion products were identified as in the corresponding dry
exposure (compare Figs. 5, 13). K2CrO4 was detected after all exposure times
except at 168 h (not shown). The K2CrO4 peak intensities were higher here than in
the dry exposures. Similar to the corresponding dry runs, the (FeCr)2O3 solid
solution became more iron-rich with time and hematite (a-Fe2O3) and Cr rich
(FeCr)2O3 solid solution appeared after 72 h. In contrast to the dry exposures, there
were no unidentified peaks in the diffractograms.
IC
The IC analyses showed that the chloride added before exposure was lost more
rapidly than the corresponding dry O2 runs, see Fig. 6. The formation of chromate
MxCly
5 µm 5 µm
Iron-chromium oxide
Fig. 10 SEM images (BSE left and SE right) of Kanthal� AF exposed at 600 �C for 24 h in O2 with KCl
10 µm
Fig. 11 SEM-BSE image of a BIB cross section of Kanthal� AF exposed at 600 �C for 24 h in O2 withKCl
12 Oxid Met (2015) 83:1–27
123
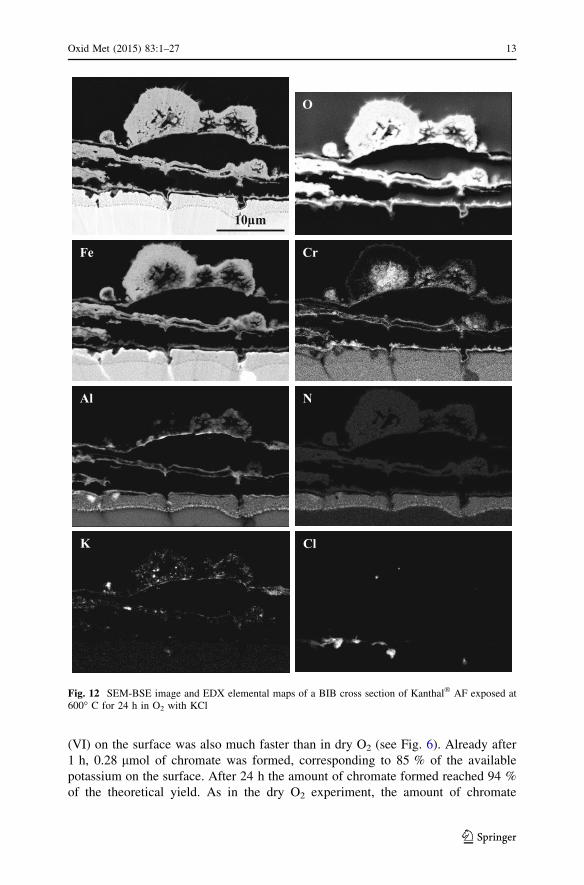
(VI) on the surface was also much faster than in dry O2 (see Fig. 6). Already after
1 h, 0.28 lmol of chromate was formed, corresponding to 85 % of the available
potassium on the surface. After 24 h the amount of chromate formed reached 94 %
of the theoretical yield. As in the dry O2 experiment, the amount of chromate
10µm
O
CrFe
Al N
ClK
Fig. 12 SEM-BSE image and EDX elemental maps of a BIB cross section of Kanthal� AF exposed at600� C for 24 h in O2 with KCl
Oxid Met (2015) 83:1–27 13
123
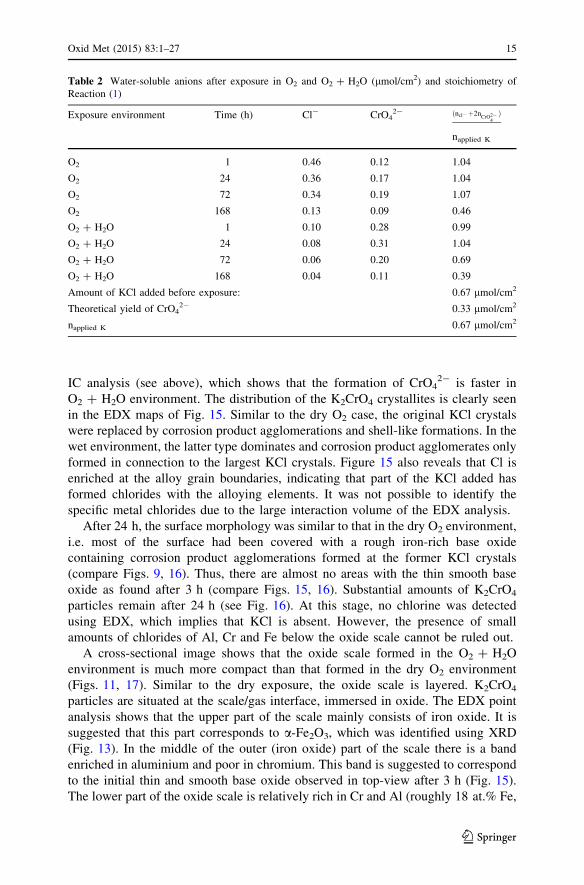
decreased[24 h. The IC analysis (see Fig. 6, Table 2) showed that the formation of
CrO42- and the consumption of chloride on the metal surface were, in most cases, in
accordance with the stoichiometry of the reaction:
2KCl(s)þ 1=2Cr2O3ðs)þH2O(g)þ 3=4O2ðg)! K2CrO4ðs)þ 2HCl(g) ð1Þ
The stoichiometric relationships in Table 2 show that other mechanisms for
chloride loss from the surface, such as KCl volatilization, are comparatively slow. It
can be concluded that the Cl that remained on the surface (15 % after 1 h and 6 %
after 168 h) was present either as unreacted KCl or as chlorides of Al, Fe or Cr.
When spallation occured (168 h) most of the chloride was already lost from the
samples, and therefore spallation hardly affected the chlorine balance. Table 2
shows large deviations from the stoichiometry of Reaction (1) after long exposure
times, suggesting that K2CrO4 decomposes with time.
SEM/EDX
After 1 and 3 h much of the surface was still covered with a thin and smooth oxide
scale, the alloy grain boundaries were still visible, (Figs. 14, 15). While the thin
oxide is similar to the one formed under dry conditions after 1 h (see Fig. 7), its
surface has been covered with potassium chromate particles, and there is little
evidence for the chloride-containing corrosion product particles formed in dry
conditions. It may be noted that while the thin oxide was replaced by a thick iron-
rich oxide after 3 h in dry conditions, it remained intact in the wet environment at
that stage (Fig. 15). The K2CrO4 particles were much more numerous and no
unreacted KCl crystals were observed on the surface. This is in accordance with the
Fig. 13 XRD diffractograms for Kanthal� AF after 1, 3, 24 and 72 h at 600 �C in O2 ? H2O ? KCl (Siis used as standard). The symbols indicate: K2CrO4 (filled diamond), (Fe2O3 (filled triangle), Cr2O3 (?),KCl (filled circle) and substrate (filled square)
14 Oxid Met (2015) 83:1–27
123
IC analysis (see above), which shows that the formation of CrO42- is faster in
O2 ? H2O environment. The distribution of the K2CrO4 crystallites is clearly seen
in the EDX maps of Fig. 15. Similar to the dry O2 case, the original KCl crystals
were replaced by corrosion product agglomerations and shell-like formations. In the
wet environment, the latter type dominates and corrosion product agglomerates only
formed in connection to the largest KCl crystals. Figure 15 also reveals that Cl is
enriched at the alloy grain boundaries, indicating that part of the KCl added has
formed chlorides with the alloying elements. It was not possible to identify the
specific metal chlorides due to the large interaction volume of the EDX analysis.
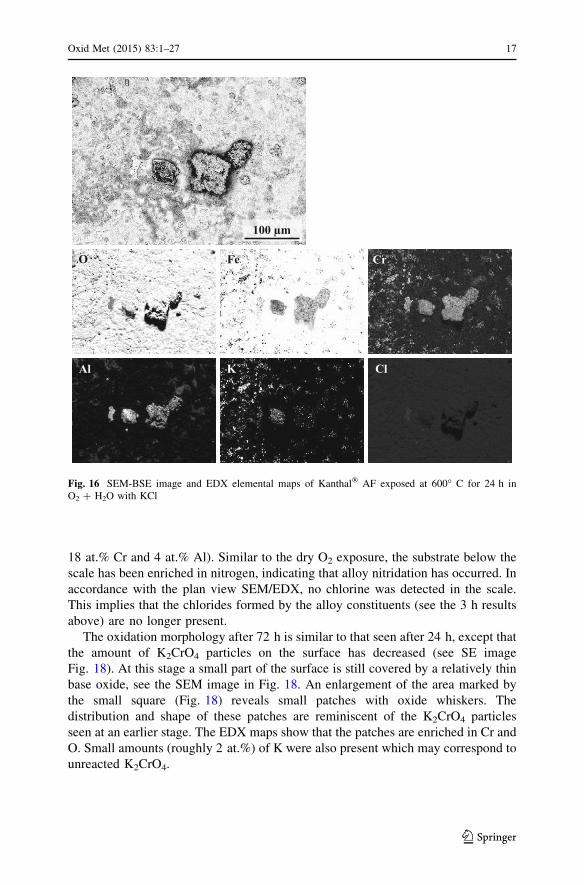
After 24 h, the surface morphology was similar to that in the dry O2 environment,
i.e. most of the surface had been covered with a rough iron-rich base oxide
containing corrosion product agglomerations formed at the former KCl crystals
(compare Figs. 9, 16). Thus, there are almost no areas with the thin smooth base
oxide as found after 3 h (compare Figs. 15, 16). Substantial amounts of K2CrO4
particles remain after 24 h (see Fig. 16). At this stage, no chlorine was detected
using EDX, which implies that KCl is absent. However, the presence of small
amounts of chlorides of Al, Cr and Fe below the oxide scale cannot be ruled out.
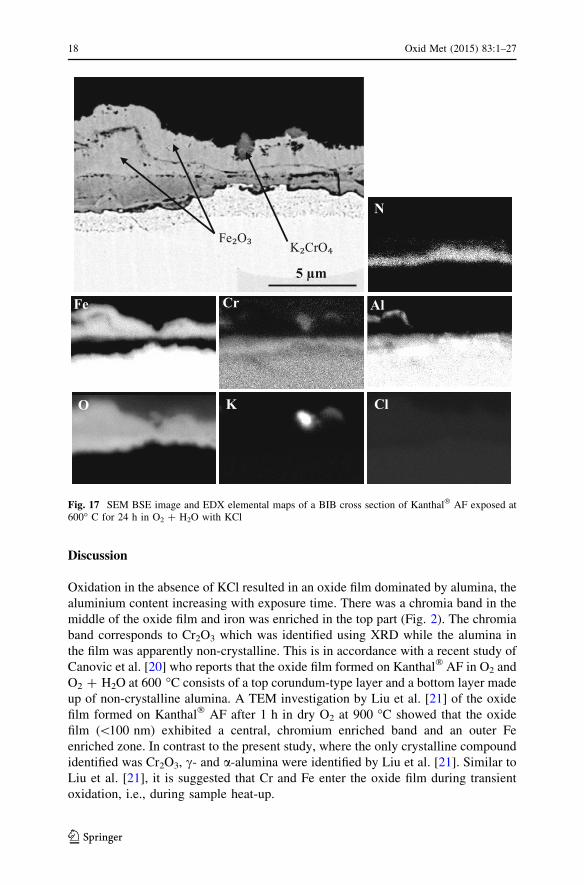
A cross-sectional image shows that the oxide scale formed in the O2 ? H2O
environment is much more compact than that formed in the dry O2 environment
(Figs. 11, 17). Similar to the dry exposure, the oxide scale is layered. K2CrO4
particles are situated at the scale/gas interface, immersed in oxide. The EDX point
analysis shows that the upper part of the scale mainly consists of iron oxide. It is
suggested that this part corresponds to a-Fe2O3, which was identified using XRD
(Fig. 13). In the middle of the outer (iron oxide) part of the scale there is a band
enriched in aluminium and poor in chromium. This band is suggested to correspond
to the initial thin and smooth base oxide observed in top-view after 3 h (Fig. 15).
The lower part of the oxide scale is relatively rich in Cr and Al (roughly 18 at.% Fe,
Table 2 Water-soluble anions after exposure in O2 and O2 ? H2O (lmol/cm2) and stoichiometry of
Reaction (1)
Exposure environment Time (h) Cl- CrO42- ðncl�þ2n
CrO2�4Þ
napplied K
O2 1 0.46 0.12 1.04
O2 24 0.36 0.17 1.04
O2 72 0.34 0.19 1.07
O2 168 0.13 0.09 0.46
O2 ? H2O 1 0.10 0.28 0.99
O2 ? H2O 24 0.08 0.31 1.04
O2 ? H2O 72 0.06 0.20 0.69
O2 ? H2O 168 0.04 0.11 0.39
Amount of KCl added before exposure: 0.67 lmol/cm2
Theoretical yield of CrO42- 0.33 lmol/cm2
napplied K 0.67 lmol/cm2
Oxid Met (2015) 83:1–27 15
123
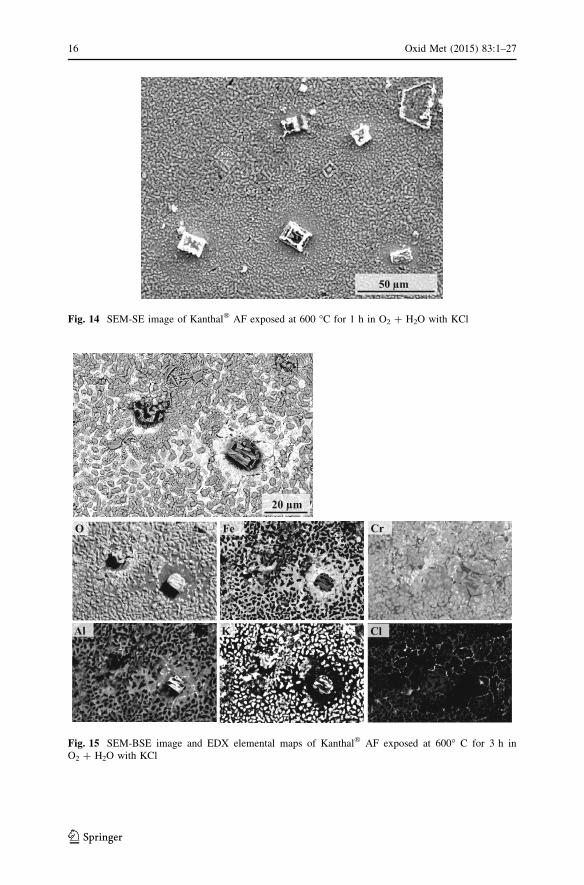
50 µm
Fig. 14 SEM-SE image of Kanthal� AF exposed at 600 �C for 1 h in O2 ? H2O with KCl
FeO Cr
Al K Cl
20 µm
Fig. 15 SEM-BSE image and EDX elemental maps of Kanthal� AF exposed at 600� C for 3 h inO2 ? H2O with KCl
16 Oxid Met (2015) 83:1–27
123
18 at.% Cr and 4 at.% Al). Similar to the dry O2 exposure, the substrate below the
scale has been enriched in nitrogen, indicating that alloy nitridation has occurred. In
accordance with the plan view SEM/EDX, no chlorine was detected in the scale.
This implies that the chlorides formed by the alloy constituents (see the 3 h results
above) are no longer present.
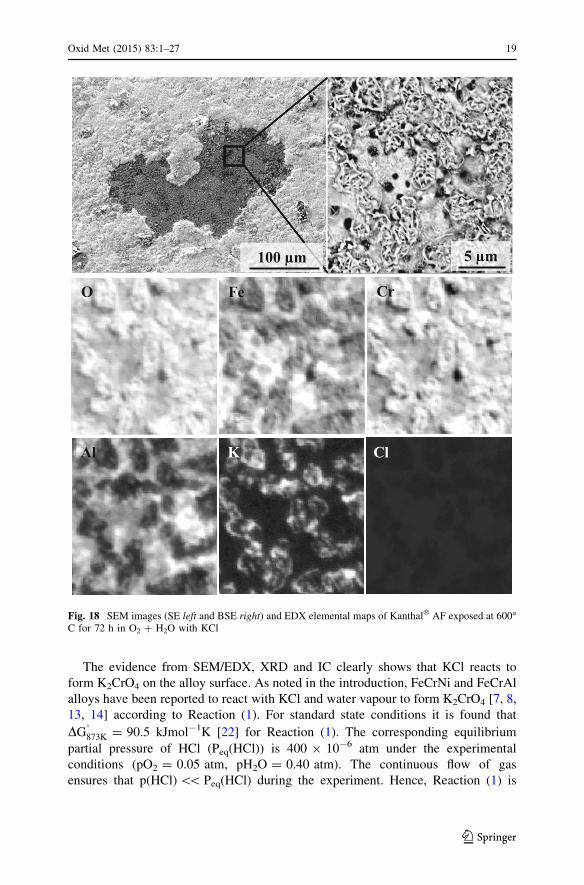
The oxidation morphology after 72 h is similar to that seen after 24 h, except that
the amount of K2CrO4 particles on the surface has decreased (see SE image
Fig. 18). At this stage a small part of the surface is still covered by a relatively thin
base oxide, see the SEM image in Fig. 18. An enlargement of the area marked by
the small square (Fig. 18) reveals small patches with oxide whiskers. The
distribution and shape of these patches are reminiscent of the K2CrO4 particles
seen at an earlier stage. The EDX maps show that the patches are enriched in Cr and
O. Small amounts (roughly 2 at.%) of K were also present which may correspond to
unreacted K2CrO4.
100 µm
O CrFe
Al ClK
Fig. 16 SEM-BSE image and EDX elemental maps of Kanthal� AF exposed at 600� C for 24 h inO2 ? H2O with KCl
Oxid Met (2015) 83:1–27 17
123
Discussion
Oxidation in the absence of KCl resulted in an oxide film dominated by alumina, the
aluminium content increasing with exposure time. There was a chromia band in the
middle of the oxide film and iron was enriched in the top part (Fig. 2). The chromia
band corresponds to Cr2O3 which was identified using XRD while the alumina in
the film was apparently non-crystalline. This is in accordance with a recent study of
Canovic et al. [20] who reports that the oxide film formed on Kanthal� AF in O2 and
O2 ? H2O at 600 �C consists of a top corundum-type layer and a bottom layer made
up of non-crystalline alumina. A TEM investigation by Liu et al. [21] of the oxide
film formed on Kanthal� AF after 1 h in dry O2 at 900 �C showed that the oxide
film (\100 nm) exhibited a central, chromium enriched band and an outer Fe
enriched zone. In contrast to the present study, where the only crystalline compound
identified was Cr2O3, c- and a-alumina were identified by Liu et al. [21]. Similar to
Liu et al. [21], it is suggested that Cr and Fe enter the oxide film during transient
oxidation, i.e., during sample heat-up.
Fe₂O₃K₂CrO₄
5 µm
AlFe
O K
N
Cr
Cl
Fig. 17 SEM BSE image and EDX elemental maps of a BIB cross section of Kanthal� AF exposed at600� C for 24 h in O2 ? H2O with KCl
18 Oxid Met (2015) 83:1–27
123
The evidence from SEM/EDX, XRD and IC clearly shows that KCl reacts to
form K2CrO4 on the alloy surface. As noted in the introduction, FeCrNi and FeCrAl
alloys have been reported to react with KCl and water vapour to form K2CrO4 [7, 8,
13, 14] according to Reaction (1). For standard state conditions it is found that
DG�
873K = 90.5 kJmol-1K [22] for Reaction (1). The corresponding equilibrium
partial pressure of HCl (Peq(HCl)) is 400 9 10-6 atm under the experimental
conditions (pO2 = 0.05 atm, pH2O = 0.40 atm). The continuous flow of gas
ensures that p(HCl) \\ Peq(HCl) during the experiment. Hence, Reaction (1) is
5 µm
Al
O
K Cl
CrFe
100 µm
Fig. 18 SEM images (SE left and BSE right) and EDX elemental maps of Kanthal� AF exposed at 600�C for 72 h in O2 ? H2O with KCl
Oxid Met (2015) 83:1–27 19
123
expected to proceed from left to right. The formation of K2CrO4 in a dry O2
environment is less favoured:
1=2Cr2O3ðs)þ 2KCl(s)þ 5=4O2ðg)! K2CrO4ðs)þCl2ðg) ð2Þ
for which DG�
873K = 90.8 kJmol-1K [22], corresponding to PeqCl2 = 0.09 9 10-6
atm (in 5 % O2). It may be noted that the ‘‘dry’’ O2 environment contained on the
order of 10 ppm water vapour, corresponding to a Peq(HCl) of 1.5 9 10-6 atm by
Reaction (1). This implies that K2CrO4 formation is dominated by Reaction (1) even
in the dry exposures and that Reaction (2) is of secondary importance.
When the material is exposed in the presence of KCl, the salt is initially separated
from the alloy by an air-formed film, only a few nanometres thick, consisting of
oxides and hydroxides. During heat-up, this film increases in thickness and the
hydroxides form oxides. It has been reported by Pettersson et al. that the formation
of K2CrO4 in Reaction (1) proceeds at a measurable rate from 400 �C [23]. Thus,
chromate is expected to form as early as during sample heat-up. At this stage, the
oxide is expected to be quite thin (between 3 and 30 nm), and relatively poor in Al.
It is suggested that the protective properties of this film are compromised because of
the consumption of chromia through Reaction (1) and that this leads to an increase
in the oxidation rate of the alloy. The corrosion-accelerating effect of KCl is
illustrated by the fact that the number of moles of CrO42- detected after 1 h in
O2 ? H2O was about 20 times greater than the number of moles of Cr present in the
oxide film formed in the absence of KCl, after the same exposure time. Thus,
chromium was oxidised more rapidly in the presence of KCl.
The observation that CrO42- formation was much faster in O2 ? H2O compared
to dry O2 (see Fig. 6) is in accordance with the K2CrO4 formation being dominated
by Reaction (1). According to the IC analysis (Table 2), the ratio between formation
of chromate (VI) and the amount of chloride lost from the surface satisfies the
stoichiometry of Reaction (1) in both dry and wet environments after short exposure
times. Consequently, the formation of chromate was accompanied by the loss of
chlorine in the form of HCl(g). In addition, it can be concluded that the loss of Cl
from the surface by other mechanisms such as evaporation of KCl and transition
metal chlorides (see below), is initially of secondary importance.
Under dry conditions, chlorides of the main alloy constituents were observed
after 1, 3 and 24 h. In the presence of water vapour, metal chlorination was
observed after 1 and 3 h, but not after 24 and 72 h. In other words, the amount of
solid chlorides formed was much less than in the dry O2 environment, e.g. the
chloride-containing corrosion product formed on top of the thin oxide in dry O2 was
absent in the presence of O2 ? H2O. Thus, metal chlorination is much more
prominent in a dry environment than in a wet one. It is argued that this is mainly
because of Reaction (1), which causes Cl to be lost from the surface in the form of
HCl under humid conditions. As observed, chromate formation was slow in ‘‘dry’’
condition, allowing KCl longer time to interact with the alloy. This argument is
fully supported by the IC analyses (see Table 2 and Fig. 6).
The TG curves in Fig. 4 further illustrate the different corrosion kinetics in dry
and wet environments. It may be noted that the overall mass change is the result of
20 Oxid Met (2015) 83:1–27
123
several processes, including oxide growth, the potassium chromate formation by
Reaction (1), alloy chlorination, and volatilization of KCl and metal chlorides. The
initially relatively slow mass gain in wet condition was attributed partly to the rapid
loss of HCl(g) in Reaction (1), and partly by the slower corrosion attack.
Considering the small amount of KCl added (corresponding to 24 lg/cm2 of Cl-)
most of the difference should be due to the faster oxidation in dry condition
(compare the situation after 3 h in Fig. 8 (dry) and Fig. 15 (wet)). In wet condition
mass gain was relatively slow between approximately 1 and 4 h. At this stage
chromate formation (Reaction (1)) occurred on the surface which was still protected
by a Cr-rich scale. The accelerated mass gain that sets in after about 5 h and then
lasts a few hours was attributed to the formation of a rapidly growing iron oxide
scale, i.e. breakaway oxidation. The TG curve in dry condition provided little
indication of protective behaviour.
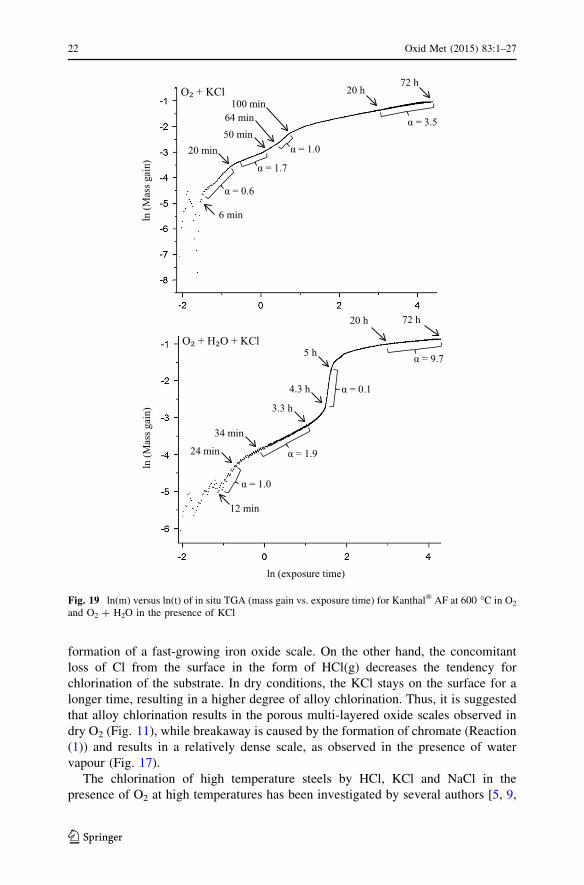
The kinetics of the corrosion process can be further elucidated by displaying the
mass gain data on a ln(m) versus ln(t) plot (Fig. 19). Assuming that mass gain is
proportional to exposure time, the slope in such a plot will correspond to 1/a, where
a is the exponent in the kinetic Eq. (3), a constant mass gain corresponding to
a = 1, and parabolic oxidation, giving a = 2.
ma / t
a lnðmÞ / lnðtÞ
lnðmÞ / ð1=aÞ lnðtÞ ð3Þ
The two ln(m) versus ln(t) plots in Fig. 19 display several similarities. The large
scatter during the first few minutes after reaching the exposure temperature is
attributed to the buoyancy effect. After this stage, there follows a short period
during which a was 0.6 in dry and 1.0 in the wet environment, corresponding to
accelerated and linear mass gain, respectively. Then comes a stage where a was
about 2.0 corresponding to a period with relatively slow mass gain in the O2 ? H2O
TG curve (Fig. 4). It may be noted that while Fig. 19 gives clear evidence of such a
stage also in the dry O2 environment, it was difficult to trace in the corresponding
TG curve in Fig. 4. The subsequent breakaway behaviour in O2 ? H2O (Fig. 4)
corresponds to a sudden decrease in the value of a to 0.1. Again, Fig. 19 reveals that
there occurred a similar; although less marked transition in dry O2. During the last
stage of the exposure, the value of a was greater in O2 ? H2O than in dry condition,
indicating that a more protective scale has evolved in the former case. This is
supported by the cross-sectional micrographs, which showed a dense oxide scale in
O2 ? H2O while a more porous layered scale formed in dry O2 (see Figs. 11, 17).
The results suggest that we are dealing with two main corrosion modes, namely
(I), breakaway oxidation triggered by chromate formation which is dominant in the
O2 ? H2O environment and (II), chlorination of the alloy by KCl accompanied by
rapid oxidation, which is predominant in dry O2. In the O2 ? H2O environment,
chromate formation in Reaction (1) depletes the protective scale in Cr, triggering the
Oxid Met (2015) 83:1–27 21
123
formation of a fast-growing iron oxide scale. On the other hand, the concomitant
loss of Cl from the surface in the form of HCl(g) decreases the tendency for
chlorination of the substrate. In dry conditions, the KCl stays on the surface for a
longer time, resulting in a higher degree of alloy chlorination. Thus, it is suggested
that alloy chlorination results in the porous multi-layered oxide scales observed in
dry O2 (Fig. 11), while breakaway is caused by the formation of chromate (Reaction
(1)) and results in a relatively dense scale, as observed in the presence of water
vapour (Fig. 17).
The chlorination of high temperature steels by HCl, KCl and NaCl in the
presence of O2 at high temperatures has been investigated by several authors [5, 9,
6 min
α = 0.6
α = 1.7
α = 3.5
α = 1.0 20 min 50 min
O₂ + KCl
64 min 100 min
72 h 20 h
12 min
α = 1.9
α = 0.1
20 h 72 h
α = 9.7
α = 1.0
O₂ + H₂O + KCl
34 min
3.3 h
4.3 h
5 h
24 min
ln (exposure time)
ln (M
assg
ain)
ln
(Mas
sgai
n)
Fig. 19 ln(m) versus ln(t) of in situ TGA (mass gain vs. exposure time) for Kanthal� AF at 600 �C in O2
and O2 ? H2O in the presence of KCl
22 Oxid Met (2015) 83:1–27
123
13, 24]. Grabke et al. [9] proposed that alkali chlorides ‘‘catalyse’’ corrosion in the
following way: First, the chlorine-containing species react to form Cl2 at the scale/
gas interface. Gaseous Cl2 then penetrates the scale and reacts with the alloy
substrate, forming chlorides. The (transition metal) chlorides are then transported
(as gas molecules) to the scale surface via cracks and pores in the scale. At the scale
surface they react with O2 to form metal oxide and Cl2. In this way, Cl2 is
regenerated, closing the so called ‘‘chlorine cycle’’.
The ‘‘chlorine cycle’’ scenario has some problems. First, the reactions proposed
by Grabke et al. [9] and Li et al. [13] for generating Cl2 at the scale surface appear
unable to generate the necessary Cl2. Thus, of the reactions proposed by Li et al.
[13], the most favoured one is Reaction (2) (see above) which generates an
equilibrium partial pressure of only 0.09 9 10-6 atm Cl2 (at 5 % O2). In the present
case, where the alloy may form an alumina scale, we must examine whether or not
the reaction of KCl, O2 and Al2O3 can generate appreciable Cl2 concentrations. The
following reaction is considered:
2KCl(s)þ Al2O3ðs)þ 1=2O2ðg)! 2KAlO2ðs)þ Cl2ðg) ð4Þ
DG�
873K = 197.091 kJmol-1K [22], Peq Cl2(g) = 3.6 9 10-13 atm.
As the equilibrium concentrations of Cl2 generated in (4) is quite low it is
concluded that there is no viable route for generating Cl2 for the chlorine cycle
mechanism.
Another problem with the ‘‘chlorine cycle’’ is the inward transport of Cl2 to the
metal/scale interface where low oxygen activity is postulated to prevail. It is argued
that the low oxygen activity at the metal/scale interface would be very difficult to
maintain, considering that the cracks and pores open to Cl2 diffusion must also be
open to O2 diffusion. Moreover, it is considered improbable that the highly reactive
chlorine molecule would be able to reach the metal/scale interface without being
reduced by the oxide en route (e.g. by Fe2? ions in the scale). Further, because the
chlorine cycle mechanism predicts that the metal chloride will form below the scale,
it cannot account for the observation in the present paper that metal chlorides also
form at the scale/gas interface. Similar observations have been made in the HCl-
induced corrosion of FeCrNi steel at 500 �C in 5 % O2 by Folkesson et al. [25].
It is argued that the problems inherent in the chlorine cycle mechanism can be
resolved by applying an electrochemical mechanism for metal chlorination. Since
Wagner [26, 27], the formation of external oxide scales on metals at high
temperature is usually described in terms of an electrochemical mechanism where
the oxidant (e.g. O2) is reduced at the scale/gas interface while the metal is oxidized
at the scale/metal interface, the two electrodes being connected by electronic and
ionic currents:
1=2O2 þ 2e� ! O2� ð5Þ
Me! Me2þ þ 2e�
.
Oxid Met (2015) 83:1–27 23
123
In the case of the electrochemical chlorination of an alumina-forming alloy by
KCl in the presence of O2, the cathodic process on the scale surface should generate
‘‘free’’ chloride ions at the surface as well as incorporating potassium in a stable
form. The analytical results show that as KCl is consumed, potassium becomes
associated to Cr. The association of K and Cr is attributed to K2CrO4 which is
mainly considered to be formed in Reaction (1). However, it is proposed that
K2CrO4, also may form as part of the following electrochemical reaction:
Scale surface:
2KCl + 5=4O2 þ 1=2Cr2O3 sð Þ þ 2e� ! K2CrO4 sð Þ þ 2Cl�
.
Scale/alloy interface:
Fe(s)! Fe2þðoxide)þ 2e�
Cr(s)! Cr2þðoxide)þ 2e�
Al(s)! Al3þðoxide)þ 3e�
The sum reaction becomes (for the case of Fe oxidation):
2KCl(s)þ 5=4O2ðg)þ 1=2Cr2O3ðs)þ Fe(alloy)! K2CrO4ðs)þ 2FeCl2ðs) ð6Þ
For Reaction (6), DG�
873K = -141.458 kJmol-1K [22] which corresponds to a
standard cell potential Eo of ?0.73 V, thus showing that the reaction is strongly
favoured by thermodynamics. The corresponding anodic reactions with Cr and Al
provide even higher thermodynamic driving forces.
The electrochemical mechanism for metal chlorination by alkali chloride
requires that the scale can conduct both ions and electrons. Cationic conduction
through the scale is known to be dominated by the grain boundary transport at the
experimental temperature [28]. Chloride ions do not dissolve in the bulk oxides of
interest here. However, similar to hydroxide ions, chloride ions can exist in the
adsorbed form, both on the scale surface and in the oxide grain boundaries. Thus,
the ionic transport in the electrochemical cell is suggested to occur in the grain
boundaries. In this scenario, the relative transport rates of chloride ions and metal
ions would determine whether the solid chloride forms on top of the scale or at
the scale/alloy interface.
The presence of metal chloride on the metal surface (see Figs. 7, 10) implies that
non-equilibrium conditions prevail. This is not unexpected, considering the rapid
corrosion process. Because of the high equilibrium vapour pressures at 600 �C (Peq
FeCl2(g) = 1 9 10-3 atm, Peq CrCl2(g) = 0.5 9 10-6 atm) these compounds are
expected to vaporize [22]. Accordingly, the transition metal chlorides on the surface
are only seen after short exposure times. The observed metal chlorides on the
surface (e.g. Figure 10) after 24 h might have a thin oxide layer closest to the
24 Oxid Met (2015) 83:1–27
123
oxidising atmosphere. This has been observed by Jonsson et al. at 500 �C on a
FeCrNi steel in the presence of HCl(g) [29].
The scale morphology after breakaway in the O2 ? H2O ? KCl environment
(see Fig. 17) is similar to the one observed on chromia-forming stainless steels
exposed to KCl in the presence of water vapour [14]. Jonsson et al. [14] showed that
the scale consisted of an outward growing hematite and an inward growing FeCr
spinel oxide. However, further investigation is needed to determine the structure and
composition of the oxide scale formed on Kanthal� AF. Breakaway oxidation
triggered by alkali chromate formation has been described for chromia-forming
steels [7, 8, 14]. It was concluded that K2CrO4 acts as a sink for chromia in the
oxide, thereby transforming the protective Cr-rich oxide to rapidly growing iron
oxide. The present work indicates that KCl has a similar, corrosion accelerating
effect on FeCrAl alloys at 600 �C. The sub-scale formation of aluminium nitrides
also shows that the scale formed after breakaway is permeable to N2. The formation
of AlN may obstruct the ability of the alloy to form a protective alumina scale since
the reservoir of aluminium close to the metal/scale interface decreases. Aluminum
nitride precipitates have been reported to form in FeCrAl alloys at 1,100–1,200 �C
when the alumina scale failed during oxidising conditions [30].
Table 2 shows that the amount of chromate on the surface decreases [24 h and
that the stoichiometry of Reaction (1) is only satisfied up to 24 h. As spallation is
not an issue, this must be due to the decomposition of K2CrO4. The thermal
decomposition of K2CrO4 according to:
K2CrO4ðs)þH2O(g) ! 1=2Cr2O3ðs)þ 2KOH(g)þ 3=4O2ðg) ð7Þ
is considered insignificant at the relevant temperature (DG�
873K = 357.7 kJmol-1K
[22], corresponding to Peq KOH = 1.5 9 10-21 atm (5 % O2, 40 % H2O)). In
addition, no decomposition was observed when a small amount of K2CrO4 was
placed on gold foil and exposed for 168 h under the experimental conditions.
Instead it is proposed that K2CrO4 is cathodically reduced on the scale surface, the
electrons being supplied by alloy oxidation:
K2CrO4ðs) + H2O(g) + 3e� ! 1=2Cr2O3ðs) + 2KOH(l) + 3/2O2�
Cr(alloy)! Cr3þ þ 3e�
X: K2CrO4ðs)þH2O(g)þCr(alloy) ! Cr2O3ðs)þ 2KOH(l) ð8Þ
DG�
873K = -231.4 kJmol-1K [22], corresponding to a standard cell potential Eo of
?0.80 V. Here, the reduction of K2CrO4 on the scale surface is coupled to the
oxidation of metallic chromium. The latter reaction can of course be replaced by the
oxidation of iron or aluminium. Because O2 is a stronger oxidant than K2CrO4
(thermodynamically speaking), chromate reduction on the scale surface through
Reaction (8) is only possible if the oxygen electrode (5) is far from equilibrium.
Oxid Met (2015) 83:1–27 25
123
It may be noted that the reduction of K2CrO4 at cathodically active sites at the
surface causes alkaline conditions that allow chromate formation to occur through
chemical oxidation (9) elsewhere in the scale. In this way, K2CrO4 catalyses alloy
oxidation.
2KOH(l)þ 3=4O2ðg)þ 1=2Cr2O3ðs)! K2CrO4ðs)þ H2O(g) ð9Þ
DG�
873K = - 217.9 kJmol-1K [22].
Conclusions
• KCl strongly accelerated the corrosion of Kanthal� AF in O2 and O2 ? H2O
environments at 600 �C. The protective alumina-rich oxide formed in the
absence of KCl was replaced with a rapidly growing oxide scale dominated by
iron and chromium when KCl was present.
• In an O2 ? H2O environment, chromia in the scale rapidly reacted with KCl,
oxygen and H2O forming K2CrO4 and gaseous HCl. Chromate formation
depleted the protective scale in Cr, triggering the formation of a fast-growing
iron-rich scale.
• Chromate formation also occurred in a dry O2 environment but was slower.
• Parallel to chromate formation, the main alloying elements formed chlorides,
both on top of and below the oxide scale.
• Alloy chlorination was more pronounced in a dry O2 than in an O2 ? H2O
environment. This is because chromate formation rapidly converts KCl to
HCl(g) in the latter environment. Thus, KCl stays on the surface for a longer
time in a dry O2 environment, resulting in a higher degree of alloy chlorination.
• It is proposed that the chlorination reaction is electrochemical, involving the
migration of chloride ions in the grain boundaries of the scale.
• KCl-induced corrosion in a dry O2 environment resulted in the formation of a
porous multi layered oxide scale. In contrast, KCl-induced corrosion in an
O2 ? H2O environment resulted in a relatively dense oxide scale. The
difference in behaviour was attributed to metal chlorination being more
prominent under dry conditions.
• KCl-induced corrosion was accompanied by the formation of aluminium nitride
precipitates in the alloy substrate.
Acknowledgments The work was performed within the Swedish High Temperature Corrosion Centre
(HTC). The authors wish to acknowledge Helena Gotlind and the support from Sandvik Heating
Technology.
Open Access This article is distributed under the terms of the Creative Commons Attribution License
which permits any use, distribution, and reproduction in any medium, provided the original author(s) and
the source are credited.
26 Oxid Met (2015) 83:1–27
123
References
1. H. Asteman, J. E. Svensson and L. G. Johansson, Oxidation of Metals 57, 193 (2002).
2. I. Panas, J.-E. Svensson, H. Asteman, T. J. R. Johnson and L.-G. Johansson, Chemical Physics Letters
383, 549 (2004).
3. Y. Shu, F. Wang and W. Wu, Oxidation of Metals 51, 97 (1999).
4. H. P. Michelsen, F. Frandsen, K. Dam-Johansen and O. H. Larsen, Fuel Processing Technology 54,
95 (1998).
5. M. J. McNallan, W. W. Liang, S. H. Kim and C. T. Kang, International Corrosion Conference Series
NACE-6, 316 (1983).
6. J. Pettersson, C. Petersson, H. Asteman, J. E. Svensson and L. G. Johansson, Materials Science
Forum 461–464, 965 (2004).
7. C. Pettersson, J. Pettersson, H. Asteman, J.-E. Svensson and L.-G. Johansson, Corrosion Science 48,
1368 (2006).
8. C. Pettersson, J. Pettersson, H. Asteman, J. E. Svensson and L. G. Johansson, Oxidation of Metals 64,
23 (2006).
9. H. J. Grabke, E. Reese and M. Spiegel, Corrosion Science 37, 1023 (1995).
10. M. Montgomery and A. Karlsson, Materials and Corrosion 50, 579 (1999).
11. H. P. Nielsen, F. J. Frandsen and K. Dam-Johansen, Energy & Fuels 13, 1114 (1999).
12. Y. Shinata, Oxidation of Metals 27, 315 (1987).
13. Y. S. Li, Y. Niu and M. Spiegel, Corrosion Science 49, 1799 (2007).
14. T. Jonsson, J. Froitzheim, J. Pettersson, J.-E. Svensson, L.-G. Johansson and M. Halvarsson, Oxi-
dation of Metals 72, 213 (2009).
15. C. Pettersson, L.-G. Johansson and J.-E. Svensson, Oxidation of Metals 70, 241 (2008).
16. H. Asteman and M. Spiegel, Corrosion Science 50, 1734 (2008).
17. H. Josefsson, F. Liu, J.-E. Svensson, M. Halvarsson and L.-G. Johansson, Materials and Corrosion
56, 801 (2005).
18. F. Liu, H. Gotlind, J. E. Svensson, L. G. Johansson and M. Halvarsson, Oxidation of Metals 74, 11
(2010).
19. H. Asteman, R. Norling, J. E. Svensson, A. Nylund and L. Nyborg, Surface and Interface Analysis
34, 234 (2002).
20. S. Canovic, J. Engkvist, F. Liu, H. Lai, H. Gotlind, K. Hellstrom, J.-E. Svensson, L.-G. Johansso, M.
Olsson and H. Halvarsson, Journal of the Electrochemical Society 157, C223 (2010).
21. F. Liu, H. Gotlind, J.-E. Svensson, L.-G. Johansson and M. Halvarsson, Corrosion Science 50, 2272
(2008).
22. FactSage 6.2 (Databases: Fact53, ELEM, BINS).
23. J. Pettersson, J. E. Svensson and L. G. Johansson, Oxidation of Metals 72, 159 (2009).
24. N. Folkeson, T. Jonsson, M. Halvarsson, L. G. Johansson and J. E. Svensson, Materials and Cor-
rosion 62, 606 (2011).
25. N. Folkeson, L.-G. Johansson and J.-E. Svensson, Journal of the Electrochemical Society 154, C515
(2007).
26. C. Wagner, Zeitschrift fur Physikalische Chemie B21, 25 (1933).
27. P. Kofstad, High Temperature Corrosion, (Elsevier Applied Science Publishers Ltd, London, 1988).
28. D. J. Young, High Temperature Oxidation and Corrosion of Metals, (Elsevier, Amsterdam, 2008).
29. T. Jonsson, N. Folkeson, M. Halvarsson, J.-E. Svensson and L.-G. Johansso, Oxidation of Metals 81,
575 (2014).
30. I. Gurrappa, S. Weinbruch, D. Naumenko and W. J. Quadakkers, Materials and Corrosion 51, 224
(2000).
Oxid Met (2015) 83:1–27 27
123