Embed Size (px)
Citation preview

KADUNA PERFORMANCE TESTING PROCESS OFFGRID PV SOLAR SYSTEMS FOR PRIMARY HEALTHCARE CENTERS IN KADUNA STATE
Prepared for:
Crown Agents Limited Prepared by:
KADUNA CLINICS – SOLAR SYSTEMS PERFORMANCE TESTING
Oct 24, 2015

1
TABLE OF CONTENTS 1 ISSUE AND REVISION RECORD ....................................................................................... 2 2 INTRODUCTION .................................................................................................................. 3 2.1 Requirements and Assumptions ..................................................................................................... 3
3 TOOLS AND MEASUREMENT EQUIPMENT ..................................................................... 4 4 PERFORMANCE TESTS ..................................................................................................... 5 4.1 Array IV curve test ........................................................................................................................... 5 4.2 Discharge test at rated power ......................................................................................................... 7 4.3 Surge power discharge test ........................................................................................................... 10 4.4 Charging at peak power test ......................................................................................................... 11 4.5 System capacity benchmark: discharge-‐recharge-‐discharge cycle .............................................. 13
5 ANNEX ............................................................................................................................... 16 5.1 Annex 1: Main References ............................................................................................................ 16 5.2 Annex 2: Interpreting IV curve shapes (IEC 62446) ....................................................................... 17
LIST OF TABLES Table 1: PV Systems to be tested in the performance testing procedures .................................. 3 Table 2: Discharge test - rates ..................................................................................................... 7 Table 3: Example of charge at peak power test comparison of different arrays ........................ 13 Table 4: System benchmark test – 1st discharge cycle rates and times .................................... 14 Table 5: System benchmark test – example of results table ...................................................... 16
LIST OF FIGURES Figure 1: IV curve shapes .......................................................................................................... 18

2
1 ISSUE AND REVISION RECORD
Revision Date Originator Checker Approver Narrative
1.0 09/10/15 CB/UI/AA/MU CK MSI

3
2 INTRODUCTION This document is for the performance testing process of the Solar PV systems with battery energy storage systems implemented for 40 Public Health Centres (‘PHC’) of Kaduna State, Nigeria. All systems are providing electricity to PHC systems.
The PV systems being tested as part of the project are detailed below, with summary descriptions.
Table 1: PV Systems to be tested in the performance testing procedures
System # System 1
System 2
System 3
System 4
System 5
System 6
System 7
PV nominal DC power (kWp)
14.040 21.060 28.080 56.160 28.080 84.240 112.320
Inverter nominal AC power (kW)
1.500 2.650 3.600 7.200 3.600 11.500 14.500
Usable Energy Storage Needed (kWh)
75 150 175 350 75 150 300
Expected daily Energy capacity (kWh/day load) @5kWh/m2/day
26 48 64 128 64 204 336
The systems are concisely described within the single line diagrams (SLD) which may be updated from time to time. Although covering a significant range of PV plant sizes from 13.260 kWp to 112.320 kWp, the systems are similarly configured. The SLD will be used as the reference document for the testing of the systems.
2.1 Requirements and Assumptions • The tests are intended to be done by a qualified electrical engineer or solar PV engineer,
trained and with the relevant tools to carry out testing and commissioning of low voltage electrical systems
• Operational status of each system: o Has been switched on and charging battery without load? o Has been in full use?
• The commissioning and inspection process has been completed and accepted.

4
3 TOOLS AND MEASUREMENT EQUIPMENT The following are the minimum tools and equipment required for the tests.
Equipment
Test and Measurement
Process Reference
Performance Tests
• Multi-meters (at least 2 of each) each capable of true RMS: similar to SEAWARD Solar Power ClampTM
o AC voltage (240Vac), DC voltage (1,000Vdc multi-ranging), resistivity, temperature
3.2;; 3.3;; 3.4;; 3.5
• Current clamp-meters: similar to SEAWARD Solar Power ClampTM
o AC current (200Aac multi-ranging range) 3.2;; 3.3;; 3.4
o DC current arrays (multi-ranging 100Adc) 3.5
o DC current inverters (multi-ranging 400Adc) 3.2;; 3.3;; 3.4
o Busbar measurements (1,000- 4,000Adc) Optional for 3.4
• Power meter single phase – similar to SEAWARD Solar Power ClampTM or Fluke 485 ScopeMeterTM
o AC and DC ripple currents and clipping (50Hz range)
o True power meter, harmonic distortion, power factor measurement
• Meter /scope probes with clips seal sets
Optional only for
3.2;; 3.3;; 3.4;; 3.5
• PV tester kit similar to SEAWARD Solar PV150 kit TM with IV curve tester
o With MC adaptors, memory cards, chargers 3.1
• Integrating solarimeter / multifunction irradiance meters - similar to SEAWARD SolarSurvey 100/200RTM or Kipp&ZonenTM CC20 with logger
o – should have better than 5% accuracy
3.5
• Temperature sensor 3.1.1, 3.2.1, 3.2.3, 3.3.1,
• Tools o Insulated safety tools o Torque measurement

5
4 PERFORMANCE TESTS The performance tests complement the functional tests, and confirm that the system can perform at full capacity (as much as practically possible within a short commissioning period). These performance tests are most efficiently executed in the sequence as below – i.e. it is useful to do the initial tests to ensure that the system is broadly in good operating condition, before embarking on the longer benchmark tests. It is not essential to do long benchmark tests on all systems, but it is recommended to do them on all system types.
• Array IV curve tests (duration 2-3hr) • Discharge test at rated power (1hr) • Surge power test (20 minutes) • Charging at peak power test (30 minutes on day with good, steady levels of solar
irradiance) • System benchmark test (24 hr normally, 72hr for PHC systems)
4.1 Array IV curve test The IV curve test on an array benchmarks the overall performance against nameplate, of the array comprising of:
• module performance under measured temperature and insolation regime • correct module interconnection • array junction box and combiner box performance • array cabling losses up to the MPPT input
IV curves can provide detailed information on:
• measurements of string open circuit voltage (Voc) and short circuit current (Isc) • measurements of max power voltage (Vmpp), current (Impp), and max power (Pmax) • measurement of array performance • Identification of module / array defects or shading issues
IV curve testing should be conducted for all arrays at each site and the acceptable performance of those arrays should be confirmed.
4.1.1 IV Curve test procedure The suppliers of the specific IV curve test equipment such as SEALINKTM or TriKATM provide detailed test procedures to follow and may differ slightly from product to product. The procedures that follow are therefore for completeness only.
The procedure for undertaking the IV curve test shall be as follows:
• PV string and array performance measurements shall be performed on an occasion when stable irradiance conditions of at least 400W/m2 are anticipated at the location of the system, as measured in the plane of the array.
• The validity of the IV Curve Tester’s calibration should be checked to ensure it is not yet due for calibration servicing.
• The IV Curve Tester should be programmed with the characteristics, type and quantity of modules under test. And with details of the cabling lengths and type from the modules to the IV Curve Tester.

6
• Ensure PV system is shut down and that no current is flowing. • The string(s) / array under test should be isolated and connected to the IV Curve Tester.
The location of this connection could be at the combiner box for strings, or at MPPT input for a complete array.
• The irradiance meter paired with the IV Curve Tester should be mounted in the plane of the array and not subject to any localised shade or reflected light (albedo). Where the IV Curve Tester’s irradiance sensor is a reference cell device, this shall be checked to ensure it is of the same cell technology as the array under test, or suitably corrected for the difference in technologies.
• The IV Curve Tester’s irradiance sensor should be cleaned in accordance with the manufacturer’s guidelines, using only the manufacturer’s recommended materials.
• Where the IV Curve Tester utilises a cell temperature probe, this shall be in firm contact with the rear of the module and in the centre of a cell towards the centre of a module. Where temperature corrections are calculated by the IV Curve Tester, a check shall be undertaken to ensure that the device has been configured with the temperature response characteristics of the modules as defined in the manufacturer’s specifications.
• Prior to commencing the test, the irradiance levels shall be checked to ensure they are greater than 400 W /m² in the plane of the array.
• IV values shall then be recorded by the IV Curve Tester.
4.1.2 Evaluation of IV test curve shape An IV Curve Tester, like all measurement devices, is subject to uncertainty in the measurements it makes. The higher the quality of the testing device, the lower the uncertainty expected in its measurements. The IV Curve Tester’s manufacturer should specify the uncertainty in the measurements of the device and this uncertainty should be incorporated into the evaluation of the recorded test results as a tolerance.
On recording an IV curve, the shape shall be studied for any deviation from the predicted curve. Deviations to IV curves demand particular attention as they can signal otherwise undetected and significant faults within the PV array. Guidelines from IEC 62446 are detailed in Appendix 2 which should be used in the evaluation of the recorded data and the identification of potential faults.
For the recorded open circuit voltage (‘Voc’) of the string to be acceptable its value should be within the range defined by the manufacturer’s specifications in proportion to the number of modules expected to be connected in the string. A Voc value outside of this range could indicate the incorrect wiring of the modules.
For the recorded maximum power value of the string to be acceptable its value should be at least the module manufacturer’s rated (nameplate) value at the recorded irradiance level, multiplied by the number of modules under test and corrected for cable losses as applicable.
When the irradiance conditions are stable throughout the test data recording period then for systems with multiple strings of equivalent module configuration, IV curves from individual strings shall be compared by a process of graphically overlaying them. The values at any given point on the recorded power curves should be within 5% of each other.

7
4.2 Discharge test at rated power The DC discharge tests are used to measure performance of the load-supporting components, namely the battery, load cabling and inverters and should be conducted to verify the design conformity of:
• Battery cell configuration • Battery inter-connections • Cabling integrity • Inverter performance
The tests consist of a series of measurements taken after a steady state condition is reached in the system following 15 minutes of discharging under normal design load conditions. The tests shall verify the following functionality:
• Battery verifications o Load sharing between battery banks o Cell voltages integrity o Interconnector deficiencies
• Cabling verifications o DC voltage drop between the battery terminals and battery fuse o DC voltage drop between the battery fuse and inverter terminals (including the DC
bus bar and DC breakers) o Battery cable temperatures o Inverter cable temperatures o Connector / Termination temperatures
• Inverter verifications o Load-sharing between inverters o Inverter voltage stability and range o Inverter efficiency o Inverter Temperature at rated power
4.2.1 Discharge test procedure Plan the test in advance to ensure a minimum of five sets of readings over 1 hour.
The test is conducted using a load device or devices which are cumulatively rated at the nominal AC power rating of the inverter/s.
Table 2: Discharge test - rates
System # System 1
System 2
System 3
System 4
System 5
System 6
System 7
AC output power under test (kW)
1.500 2.650 3.600 7.200 3.600 11.500 14.500

8
Discharge Test procedure:
• Ensure the batteries have been fully charged in accordance with the battery manufacturer’s instructions.
• Ensure all DC circuit breakers for the PV array are off / open. • Test that the battery is receiving no incoming power from any possible source including
the arrays, generator or grid. Any MPPT devices may be left on if necessary due to their low quiescent power draw.
• Switch on the AC load/s. • Verify that the inverter/s are operating and delivering their expected power output. • The battery voltage will initially drop significantly as the battery chemistry begins to
activate. After about 10 minutes it should rise and stabilise to a more linear discharge rate. • Take the first reading when the system has been discharging for 20 minutes. The
Discharge Test should last for 1 hour in total with measurements taken at 10 minute intervals
• Using a multi-meter as specified in Section 2, measure the DC voltage at the bus bar. • Using a current clamp-meter as specified in Section 2, measure the DC current output at
each battery bank terminal and the total at the bus bar. • Measure and record the temperature of the connectors / terminations and at various points
along the battery cables. • Battery bank tests (sealed batteries)
o Measure and record the individual cell / module voltages and the battery terminal voltage.
o For systems consisting of more than one parallel battery bank, measure and record the DC current for each battery bank.
o Measure and record the battery DC voltage drops from each battery to the bus bar. Verify that they comply with expected values.
• Inverter tests o Measure and record the DC voltage drops from battery terminals to the inverter
terminals o Measure and record each inverter’s DC current and DC voltage at the input
terminals. o Measure the total AC voltage, AC current and AC load power. o Calculate the inverter’s efficiency in relation to the manufacturer’s specified
efficiency curves. o Measure and record the inverter/s heat sink temperature and ambient temperature. o Measure and record the temperature of the inverter terminals and cables.
At the end of test proceed immediately to the Inverter Surge power discharge test without allowing the inverter/s to cool down.
4.2.2 Battery discharge test – interpretation and analysis during test • Verify the integrity of each battery cell:
o Compare the voltages of all cells in the same battery bank during discharge to identify faulty cells. Voltage readings which identify an outlying cell soon after

9
installation may be caused by a faulty battery cell that requires replacement and reinstallation.
• Verify that the combined battery bank has been delivering a stabilised rate of DC voltage drop at the bus bar.
• For systems consisting of more than one parallel battery bank, verify that each battery bank was equally sharing the DC current load.
• Identify any battery banks delivering lower values of DC current than the other banks. A higher resistance in the bank is likely to be causing the lower DC current yield and could be a symptom of any of the following causes:
o an interconnector termination deficiency o an insufficiently torqued interconnector termination o a cable fault o a poorly fitted battery fuse (measure the Voltage drops between the fuse metal
and the next termination in either direction) o one or more faulty cells
• Verify that each battery bank has been delivering the same discharge current and that the total discharge current remained constant to within 5%. The discharge current should be expected to rise at a rate proportional to the voltage drop rate as the test progressed. Verify that the range of connector / termination temperatures are within 5°C of the cable temperatures and not over 50°C. Cable temperatures that are high suggest possible loose connections or inadequate cable dimensioning. Recheck connections, and recheck the cable voltage drop analysis (section 6.3) to confirm that the actual connection configuration is as per design.
4.2.3 Inverter discharge test - interpretation • Verify that the inverter/s are equally sharing the DC energy supplied from the batteries. • For systems consisting of more than one parallel inverter, verify that the inverters are
equally sharing the AC power load between them. Unless the inverters are configured in master/slave arrangement, they should be load sharing equally. An inverter with lower current draw than the others would suggest a higher resistance caused by any of the following, which can best be identified during the test itself:
o A connection deficiency or loose connection o voltage drops in cables
• If an inverter has cut-out during the test, this could be due to a variety of problems ranging from:
o An incorrectly configured load-shed set-point o High voltage drops in one of the cables o A thermal cut-out event within an inverter due to excess temperature o A battery issue.
• Verify that the range of connector / termination temperatures for the inverter are within 5°C of the cable temperatures and not over 50°C. Cable temperatures that are high suggest possible loose connections or inadequate cable dimensioning. Recheck connections, and recheck the cable voltage drop analysis (section 6.3) to confirm that the actual connection configuration is as per design. Check connection quality.

10
• Verify inverter temperature performance. The inverter heat sink temperature should be less than 50 degrees – perhaps inverter also has temperature reading to confirm this. If inverter has cut-out during the test this could be due to overheating
Verify inverter efficiency - this not necessarily a very accurate measurement, and does not take into account power factor (unless a specific AC power meter is used). Efficiency = power out / power in. With reference to the capacity factor (% of full rated power of the inverter) this efficiency should correspond with the published curves on the data sheet.
4.3 Surge power discharge test The objective is to confirm that inverters and the supporting cabling and switchgear are sufficiently protected under high discharge conditions, and that nuisance tripping or fusing shall not occur when supplying peak loads or starting peak loads.
The ideal test conditions for the inverters in this system would be 5 minute rating of about 1.7 x the rated power of the system. Higher currents will make the test period very short and difficult to take measurements – but if motors or loads requiring very high starting power are present, then 5s tests can also be done.
For a 5 minute to 1 minute surge test, the test checks
• Load sharing between inverters • Inverter surge capacity • AC DB peak power capacity for surges
4.3.1 Surge power test procedure The ideal is to commence the surge tests directly after the DC discharge tests, assuming there have not been any deficiencies in the discharge test:
• Follow on from the DC Discharge tests without allowing inverter to cool down. • Adjust the AC load power upwards to 1.7 x each inverter’s combined rated power capacity.
Confirm the inverters can reach this power, and have not been programmed to a much lower power limit.
o Check that inverters are load-sharing the discharge energy from the batteries o Start the timer o Over the course of the period at short minute intervals
§ Check Battery voltage drops are within the anticipated range for the measured current draw, and extrapolate for maximum current draw in relation to minimum operating voltage of inverter.
§ Check and measure inverter cable temperatures under load. § Note voltage drops from battery terminals to inverter input. § Check and record each inverter’s AC power, AC voltage, DC current, DC
voltage. § Measure inverter heat sink temperature, ambient temperature.
o Record the time till cut-off

11
4.3.2 Surge power test - interpretation The test will reach a natural cut-off and terminate on its own if the continuous power is greater than the inverter rated power, and the inverter will cut-out. Identify the reason for eventual cut-off:
• Inverter thermal overload triggered • Battery fuse blown due to under-dimensioning • Inverter input DC CB tripped • Inverter output CB tripped • AC DB tripped • Load-shedding
If the cause is inverter thermal overload, compare this time with the specification at the surge power. It should exceed the specification. Derate the time/power for higher ambient temperature as per inverter manuals.
If the cause is load-shedding, then it is possible that this is faulty load-shedding caused by high voltage drops in the DC supply cables, as a result of very high currents. This problem could possibly be overcome by installation of remote voltage sense leads, or larger cable dimensioning.
• Check for cable and voltage drop faults in the supply cables from the battery. • Check the remote battery voltage sensing cable in the inverter and confirm that the voltage
is accurate and that send cables are used for these decisions.
Identify the limiting components and ensure that these will not trip critical loads. Confirm compliance with the SLD. Recommend adjustments where the SLD appears deficient.
If it is a possible solution that will not limit the overall system usage from the design, adjust and reprogram inverter power output settings to ensure tripping is not fuse or inverter DC input related. Notify the designers.
4.4 Charging at peak power test The objective is to confirm that charging components, namely the array, MPPTs and the supporting cabling and switchgear are sufficiently protected under high charge current conditions (battery not fully charged, high irradiance conditions), and that nuisance tripping or fusing shall not occur. The test also confirms charging component rating and matching to ensure full and optimal use of the incident solar energy, ideally without throttling, and to identify the limiting components, and to ensure they are protected. The test needs runs for 15-20 minutes.
This test is especially relevant where arrays have been oversized compared to other components. Arrays in African conditions will perform at higher temperatures, but with substantially higher irradiance of 1.3kW/m2 it is not uncommon to see array currents of 125% x Isc. Components not rated for this will trip or limit power output.
The test will confirm issues with • DC busbar
o Current limit checks and sizing on charge o Temperature checks o Cable currents to busbar
• MPPT o efficiency checks
12
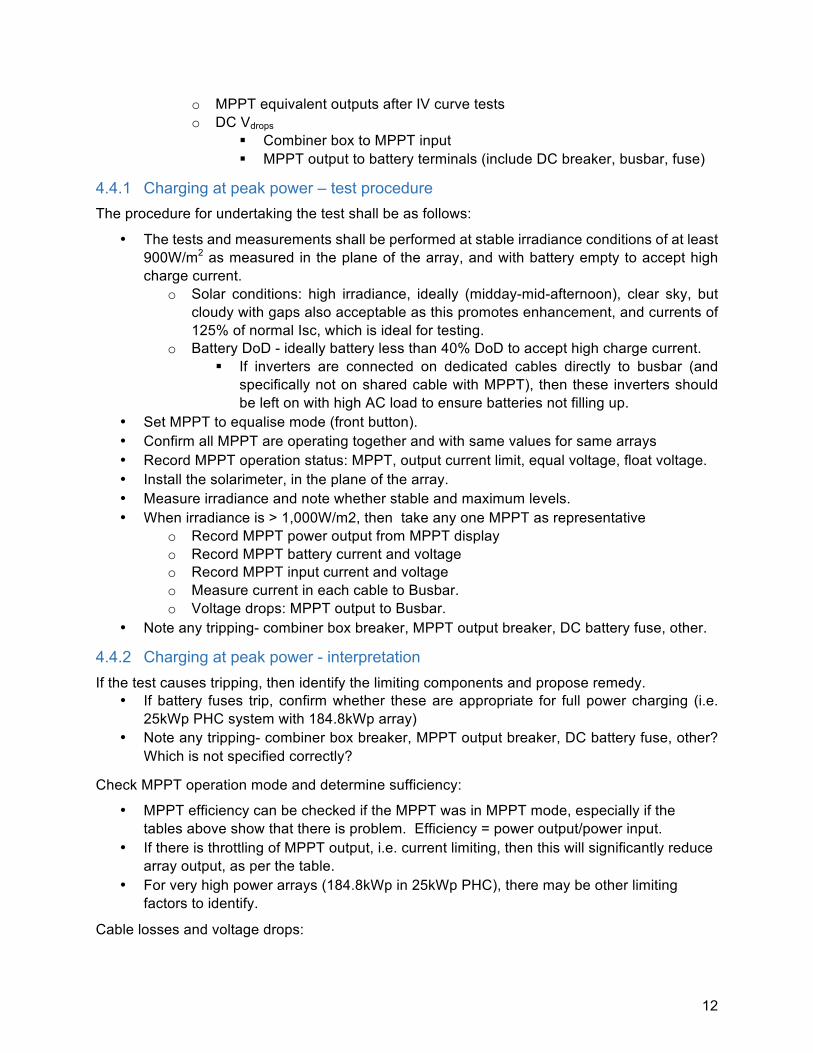
o MPPT equivalent outputs after IV curve tests o DC Vdrops
§ Combiner box to MPPT input § MPPT output to battery terminals (include DC breaker, busbar, fuse)
4.4.1 Charging at peak power – test procedure The procedure for undertaking the test shall be as follows:
• The tests and measurements shall be performed at stable irradiance conditions of at least 900W/m2 as measured in the plane of the array, and with battery empty to accept high charge current.
o Solar conditions: high irradiance, ideally (midday-mid-afternoon), clear sky, but cloudy with gaps also acceptable as this promotes enhancement, and currents of 125% of normal Isc, which is ideal for testing.
o Battery DoD - ideally battery less than 40% DoD to accept high charge current. § If inverters are connected on dedicated cables directly to busbar (and
specifically not on shared cable with MPPT), then these inverters should be left on with high AC load to ensure batteries not filling up.
• Set MPPT to equalise mode (front button). • Confirm all MPPT are operating together and with same values for same arrays • Record MPPT operation status: MPPT, output current limit, equal voltage, float voltage. • Install the solarimeter, in the plane of the array. • Measure irradiance and note whether stable and maximum levels. • When irradiance is > 1,000W/m2, then take any one MPPT as representative
o Record MPPT power output from MPPT display o Record MPPT battery current and voltage o Record MPPT input current and voltage o Measure current in each cable to Busbar. o Voltage drops: MPPT output to Busbar.
• Note any tripping- combiner box breaker, MPPT output breaker, DC battery fuse, other.
4.4.2 Charging at peak power - interpretation If the test causes tripping, then identify the limiting components and propose remedy.
• If battery fuses trip, confirm whether these are appropriate for full power charging (i.e. 25kWp PHC system with 184.8kWp array)
• Note any tripping- combiner box breaker, MPPT output breaker, DC battery fuse, other? Which is not specified correctly?
Check MPPT operation mode and determine sufficiency:
• MPPT efficiency can be checked if the MPPT was in MPPT mode, especially if the tables above show that there is problem. Efficiency = power output/power input.
• If there is throttling of MPPT output, i.e. current limiting, then this will significantly reduce array output, as per the table.
• For very high power arrays (184.8kWp in 25kWp PHC), there may be other limiting factors to identify.
Cable losses and voltage drops:

13
• Check cable Vdrop for max current. Is this cable specified correctly? • Check busbar ratings for sufficiency at maximum currents
Check system output, and array/MPPT matching. Plot actual array output power (kW) vs irradiance (kW/m2) vs expected array output (kW). Is array output being limited by MPPT when battery is empty? Why? Will this affect system performance?
Expected array power kW = Array kWp x irradiance x Eff NOCT x Eff MPPT x Eff losses
Where:
Irradiance = measured instantaneous solar energy kW/m2
Eff NOCT = 95%, the array power output derating for NOCT
Eff MPPT = 95%, MPPT tracking and energy conversion efficiency
Eff losses = 95%, to account for cabling and other losses, max 5% on charge side
Table 3: Example of charge at peak power test comparison of different arrays
System # System 1
System 2
System 3
System 4
System 5
System 6
System 7
PV nominal DC power (kWp)
14.040 21.060 28.080 56.160 28.080 84.240 112.320
Irradiance (kW/m²)
Expected power from MPPT
Measured power from MPPT
4.5 System capacity benchmark: discharge-recharge-discharge cycle A key question is whether each system type can deliver the design load. The objective is to determine the maximum sustainable load each system type can support under normal solar charging conditions.
The reason for doing the test is to confirm the design assumptions used. A poorly configured system will deliver a lot less energy than assumed from design calculations. Further, a benchmark will be established for determining whether systems are performing as anticipated in future years.
Fully functional systems of the same design will yield similar results – so the test is intended to be done on each type of system, once, rather than on every system. It is a long duration test requiring two discharge cycles and one day of charging cycle. The test is in done three stages:
1. 1st Discharge: The battery is discharged until load-shed, with the PV array electrically disconnected.

14
2. Recharge: PV array is electrically reconnected - the PV array recharges the battery over a full day where the accumulated irradiation is measured to be at least 4kWh/m2 in the plane of the array.
3. 2nd Discharge: The 2nd discharge test to load-shed determines the amount of energy the system can accumulate in a 4kWh/m2/day solar day.
4.5.1 System capacity benchmark – test procedure Planning is paramount. The test must be planned to time the recharge cycle for a day when good solar conditions are expected, of at least 4kWh/m2/day.
The operational time to complete the 1stdischarge cycle to load-shed depends on the autonomous run time of the system type. The planning for 1st discharge test must ensure that the 1st discharge tests ends before daybreak on the planned recharge cycle day.
Table 4: System benchmark test – 1st discharge cycle rates and times
System # System 1
System 2
System 3
System 4
System 5
System 6
System 7
PV nominal DC power (kWp)
14.040 21.060 28.080 56.160 28.080 84.240 112.320
Inverter nominal AC power (kW)
1.500 2.650 3.600 7.200 3.600 11.500 14.500
Expected operational duration at modelled % DoD (hours)
72 72 72 72 72 72 72
The procedure for undertaking the System Benchmark Capacity test shall be as follows:
1st Discharge cycle • The array breakers are turned OFF. MPPT may be left on optionally, due to their low
quiescent power draw. • Switch on AC loads equivalent to the rated power of the system. The inverter(s) shall
ensure a constant power draw from the batteries. Confirm that all inverters are operating under load.
• Measure the total AC power using inverter meters. Measure battery voltage. Note inverter kWh output, note time. Repeat at regular intervals.
• Allow the system to discharge to inverter load-shed. Do not turn off loads though. o This is necessary to create enough battery capacity for a complete recharge
without charge voltage limiting – no shortcuts possible by reprograming load shed voltages in short term.
• Record battery capacity (kWh) till load shed – this is the useful battery capacity at rated load.
15
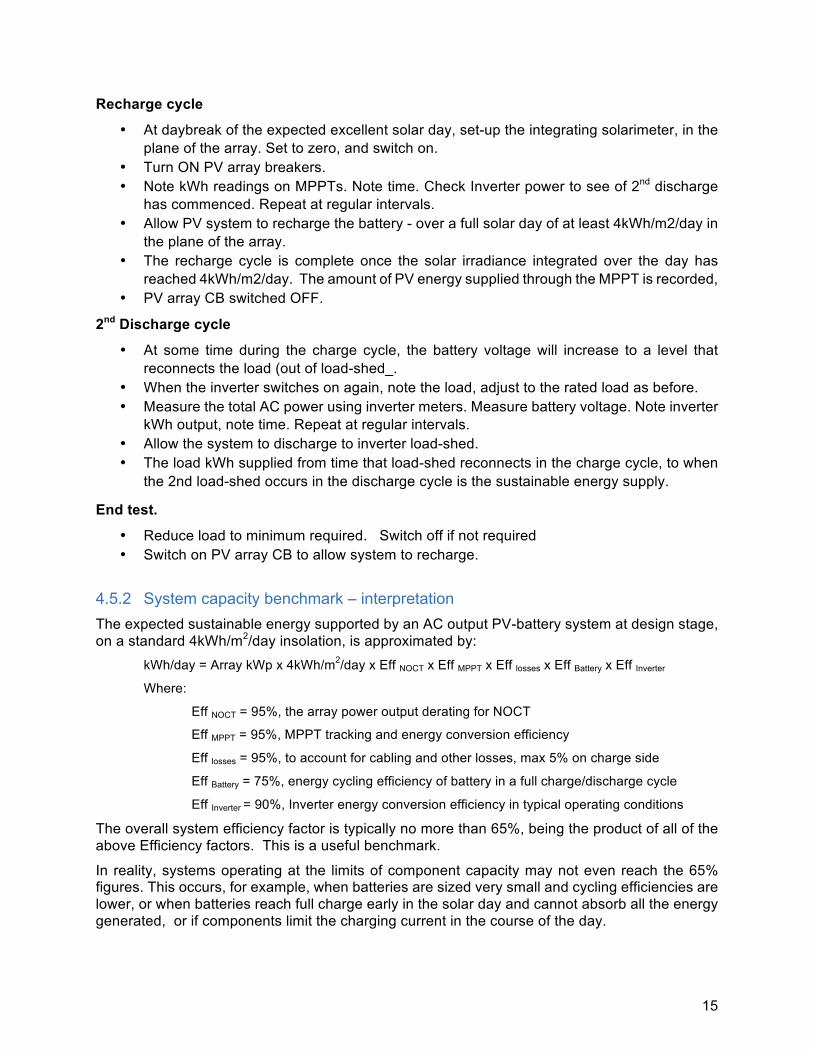
Recharge cycle
• At daybreak of the expected excellent solar day, set-up the integrating solarimeter, in the plane of the array. Set to zero, and switch on.
• Turn ON PV array breakers. • Note kWh readings on MPPTs. Note time. Check Inverter power to see of 2nd discharge
has commenced. Repeat at regular intervals. • Allow PV system to recharge the battery - over a full solar day of at least 4kWh/m2/day in
the plane of the array. • The recharge cycle is complete once the solar irradiance integrated over the day has
reached 4kWh/m2/day. The amount of PV energy supplied through the MPPT is recorded, • PV array CB switched OFF.
2nd Discharge cycle
• At some time during the charge cycle, the battery voltage will increase to a level that reconnects the load (out of load-shed_.
• When the inverter switches on again, note the load, adjust to the rated load as before. • Measure the total AC power using inverter meters. Measure battery voltage. Note inverter
kWh output, note time. Repeat at regular intervals. • Allow the system to discharge to inverter load-shed. • The load kWh supplied from time that load-shed reconnects in the charge cycle, to when
the 2nd load-shed occurs in the discharge cycle is the sustainable energy supply.
End test.
• Reduce load to minimum required. Switch off if not required • Switch on PV array CB to allow system to recharge.
4.5.2 System capacity benchmark – interpretation The expected sustainable energy supported by an AC output PV-battery system at design stage, on a standard 4kWh/m2/day insolation, is approximated by:
kWh/day = Array kWp x 4kWh/m2/day x Eff NOCT x Eff MPPT x Eff losses x Eff Battery x Eff Inverter
Where:
Eff NOCT = 95%, the array power output derating for NOCT
Eff MPPT = 95%, MPPT tracking and energy conversion efficiency
Eff losses = 95%, to account for cabling and other losses, max 5% on charge side
Eff Battery = 75%, energy cycling efficiency of battery in a full charge/discharge cycle
Eff Inverter = 90%, Inverter energy conversion efficiency in typical operating conditions
The overall system efficiency factor is typically no more than 65%, being the product of all of the above Efficiency factors. This is a useful benchmark.
In reality, systems operating at the limits of component capacity may not even reach the 65% figures. This occurs, for example, when batteries are sized very small and cycling efficiencies are lower, or when batteries reach full charge early in the solar day and cannot absorb all the energy generated, or if components limit the charging current in the course of the day.

16
The expected energy from the systems is tabulated below, based on the theoretical output. Actual output from the tests being significantly less then these would indicate system sizing and possible design problems.
The useful energy from the batteries in the 1st Discharge test is also compared with theoretical storage capacity to the modelled % DoD.
Table 5: System benchmark test – example of results table
System # System 1
System 2
System 3
System 4
System 5
System 6
System 7
PV nominal DC power (kWp)
14.040 21.060 28.080 56.160 28.080 84.240 112.320
Inverter nominal AC power (kW)
1.500 2.650 3.600 7.200 3.600 11.500 14.500
Storage capacity to modelled % DoD (kWh)
188 375 438 875 188 375 750
Measured useful battery capacity (kWh)
Expected daily Energy capacity (kWh/day load)
26 48 64 128 64 204 336
Actual energy delivered
Actual Eff
Actual Eff = 65% x actual energy delivered in test / expected energy
5 ANNEX
5.1 Annex 1: Main References AC side of the facility installation (LV and MV): visual inspections, tests and standards:
• Nigerian standards: Electrical Installation Standards • IEC 60364
DC side of PV installation: visual inspections and standards:
17
• IEC 62548 Ed.1: Installation and safety requirements for photovoltaic (PV) generators • IEC 60364-7-712 Electrical installations of buildings – Part 7-712: Requirements for
special installations or locations – Solar photovoltaic (PV) power supply systems • IEC 60364-9-1: Low-voltage electrical installations - Part 9-1: installation, design and
safety requirements for photovoltaic systems (PV). o Once published IEC 60364-9-1 Ed.1.0 will replace IEC 60364-7-712 Ed.1.0. and
IEC 62548 Ed.1.0). o IEC 60364-9-1 is a combination of IEC TS 62548, and IEC 60364-7-712. 60364-
7-7xx series of documents give the requirements which supplement, modify or replaced certain of the general requirements contained in parts 1-6 of IEC 60364 whereas this document makes specific references to certain general requirements contained in parts 1-6 of IEC 60364. While this document assumes a good knowledge of the IEC 60364 series of documents, it is designed to be readable without constant cross referencing to clauses within the IEC 60364 series. The area of photovoltaic systems is rapidly developing and with that there will be a need to keep this document under constant review hence a short maintenance cycle enabling it to keep pace with developments in the industry and to maintain the highest level of safety of these systems.
System commissioning: documentation, insulation tests, array string performance tests:
• IEC 62446: Grid connected PV systems - Minimum requirements for system documentation, commissioning tests and inspection
Rating of the PV system facility: • IEC 61724 Ed 1: PV System Performance Monitoring Guidelines for measurement, data
exchange and analysis (to be superseded by Ed 2). This is a modified performance ratio test.
5.2 Annex 2: Interpreting IV curve shapes (IEC 62446) 5.2.1 General A normal IV curve has a smooth shape with three distinct parts:
• A “horizontal leg” (slightly sloping down) • A “downward leg” (approaching vertical) • A bend or “knee” in the curve between these two regions
In a normal curve, these three parts are smooth and continuous. The slopes and the shape of the knee depend on cell technology and manufacturer. Crystalline silicon cells have sharper knees;; thin film modules usually have rounder gradual knees.
A number of factors can influence the shape of an IV curve. The following diagram illustrates the main types of deviation that may be present. These shape variations may be present individually or in combination.

18
Figure 1: IV curve shapes
Small deviations between the measured and predicted I-V curves are to be expected, given the normal uncertainties associated with the measurement of irradiance, temperature and voltage. Small variations between PV modules, even of a given manufacturer and model, will also have an effect. Shading and soiling, will also impact the shape of the curve.
When deviations are seen, a check should first be made to ensure that difference in shape between the measured curve and that predicted is not due to measurement errors, instrument set-up problems or due to an incorrectly entered module / string data.
5.2.2 Variation 1 – Steps or notches in curve Steps or notches in the IV curve are indications of mismatch between different areas of the array or module under test. The deviation in the curve indicates that bypass diodes are activating and some current is being bypassed around the internal cell string protected by the diode (e.g. a string which does not pass the same current of other strings). This can be due to a number of factors including:
• A partially shaded array or module • A partially soiled or otherwise obscured array or module (e.g. by snow fall) • A damaged PV cell / module • A short circuited bypass diode
Partial shading of even just one cell in a module can cause the associated bypass diode to turn on and cause a notch in the curve.
5.2.3 Variation 2 – Low current A number of factors can be responsible for a variation between the expected current and the measured current. These are summarised below:

19
Array causes • Uniform soiling • Strip shade (modules in portrait orientation) • Dirt dam (modules in portrait orientation) • Degraded PV modules are
Strip shade and dirt dam effects have an effect similar to uniform soiling, because they reduce the current of all cell groups by approximately the same amount.
Modelling causes • PV module data incorrectly entered • Number of parallel strings incorrectly entered
Measurement causes • Irradiance sensor calibration or incorrect measurement • Irradiance sensor not mounted in the plane of the array • Irradiance changed between irradiance and I-V curve measurements • Albedo effects causing the irradiance sensor to record overly high irradiance • Irradiance is too low or the sun is too close to the horizon
5.2.4 Variation 3 – Low voltage Potential causes for a variation in voltage include:
Array causes • Conducting or shorted bypass diodes • Wrong number of modules in PV string • Potential Induced Degradation (PID) • Significant and uniform shading to whole cell / module / string
Modelling causes • PV module data incorrectly entered • Number of modules in string incorrectly entered
Measurement causes • PV cell temperature different to measured value
As cell temperature affects the voltage from the PV module, a disparity between the actual cell temperature and that measured (or assumed) by the IV curve tracer will cause this shape defect. In such cases a check of the cell temperature measurement method should be instigated before proceeding (eg checking a temperature sensor is still attached to the module).
A group of strings measured in close succession will often exhibit slightly different amounts of deviation compared with the predictions of the PV model. This is to be expected given that the temperature is usually sensed at a single module and the temperature profile of the array is non-uniform and varying with time. However, if a single string shows substantially more deviation than the others, this is an issue, particularly if the deviation corresponds to module Voc/N where the modules have N bypass diodes
NOTE: While the variation shown on the diagram above is a voltage lower than expected, it is also possible to find that measured value is above that predicted by the model IV curve.

20
5.2.5 Variation 4 – Rounder knee Rounding of the knee of the IV curve can be a manifestation of the aging process. Before concluding that this is the case, check the slopes of the horizontal and vertical legs of the IV curve. If they have changed, it can produce a visually similar effect in the shape of the knee.
5.2.6 Variation 5 – Shallower slope in vertical leg The slope of the latter portion of the IV curve between the maximum power point (Vmpp) and Voc is influenced by the series resistance to the circuit under test. An increased resistance will reduce the steepness of the slope in this portion of the curve.
Potential causes of increased series resistance include:
• PV wiring damage or faults (or cables insufficiently sized) • Faults at module or array interconnects (poor connections) • Increased module series resistance
When testing arrays with long cable runs, the resistance of these cables will influence the curve shape and can have an impact on the curve as described here. If this is suspected, either the model can be adjusted to allow for these cables;; or the test can be repeated closer the array (bypassing the long cables)
Where this error is noticed on a curve, special attention should be taken of the quality of the wiring and interconnections within the solar circuit. This error can indicate a significant wiring fault or subsequent damage or corrosion affecting the array circuit.
Increased module series resistance can be due to high resistance faults within cell interconnects or within the module junction box – due to degradation, corrosion or manufacturing error.
An IR scan, as described in the Category 2 test sequence, can be a useful tool to identify high resistance faults.
5.2.7 Variation 6 – Steeper slope in horizontal leg A variation in slope in the upper portion of the IV curve is likely due to:
• Shunt paths in PV cells • Module Isc mismatch • Tapered shade or soiling (eg dirt dams)
Shunt current is any current that bypasses the solar cell – usually due to localised defects in either cell or cell interconnects. Shunt currents can lead to localised hot spots which may also be identified through IR testing.
Differences in Isc between modules in a string can be due to manufacturing discrepancies. If the mismatch is small and randomly distributed across the string, steps or notches may not be present.
While more significant shading will cause steps or notches in the IV curve, minor shade on some modules in a string or some tapered shade patterns can cause this effect.