Embed Size (px)
Citation preview
KDFWR Wild Turkey Spring Season Update
Prepared by Zak Danks, Wild Turkey Program Coordinator, 5/18/17
Introduction
This report provides an update on Kentucky’s 2017 Spring Wild Turkey Hunting Season. Kentucky’s wild turkey population and its management have undergone drastic changes over the last 60 years. From an estimated 850 birds statewide in 1954, through the release of over 6,700 birds from 1978-1997, turkey flocks and hunting opportunites are present in all 120 counties. Spring 2017 proved another great year for Kentucky hunters. Spring Harvest 2017
Hunters telechecked 33,061 birds during the 2017 spring season, including the 2-day
youth and 23-day general seasons.
This year’s harvest was the third highest ever (only 6 fewer than 2012 [33,067], the
second-highest harvest), and was 6.5% higher than the spring 2016 harvest.
Despite the Sunday of opening weekend falling on Easter Sunday, the opening
weekend harvest was the third highest ever (10,389).
Spring harvest for wild turkeys in Kentucky, 2016 and 2017.
Year
Period 2016 2017 % change
Youth Season (2 Days) 1,856 1,693 -8.8%
Statewide Opening Weekend 9,205 10,388 +12.9%
Remaining 21 Days of season 19,986 20,975 +4.9%
Total 31,047 33,061 +6.5%
Weather has an impact on spring turkey harvest through its impact on hunter effort.
o Youth season was marked by low temperatures with little wind or rain.
o Statewide opening weekend had warm weather (avg. ~70), some rain on Easter
Sunday (0.2-2 in.), and relatively high winds (10-12 mph) in some areas.
o The first and third weekends were warm (60s-70s), while the second and fourth
weekends were cooler (40s-50s).
o All but the fourth/final weekend had rain, and average wind speeds were at least 8-
12 mph over much of the state all weekends.
o Harvest was up from last year despite variable, mediocre weather.
2
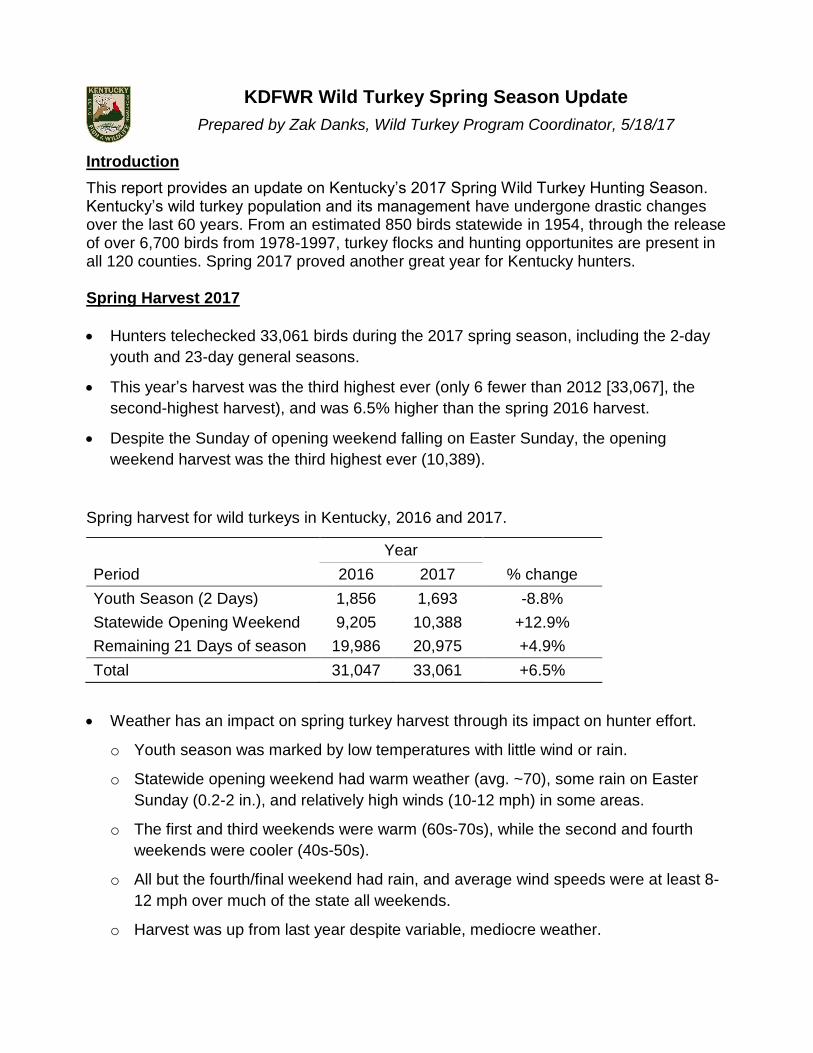
Youth season harvest (1,693) was 9% less than last season but within 2% of the 5-
year average (1,728).
Opening weekend harvest for the general statewide season (10,389) was the third
highest ever behind 2010 (12,211) and 2012 (10,847).
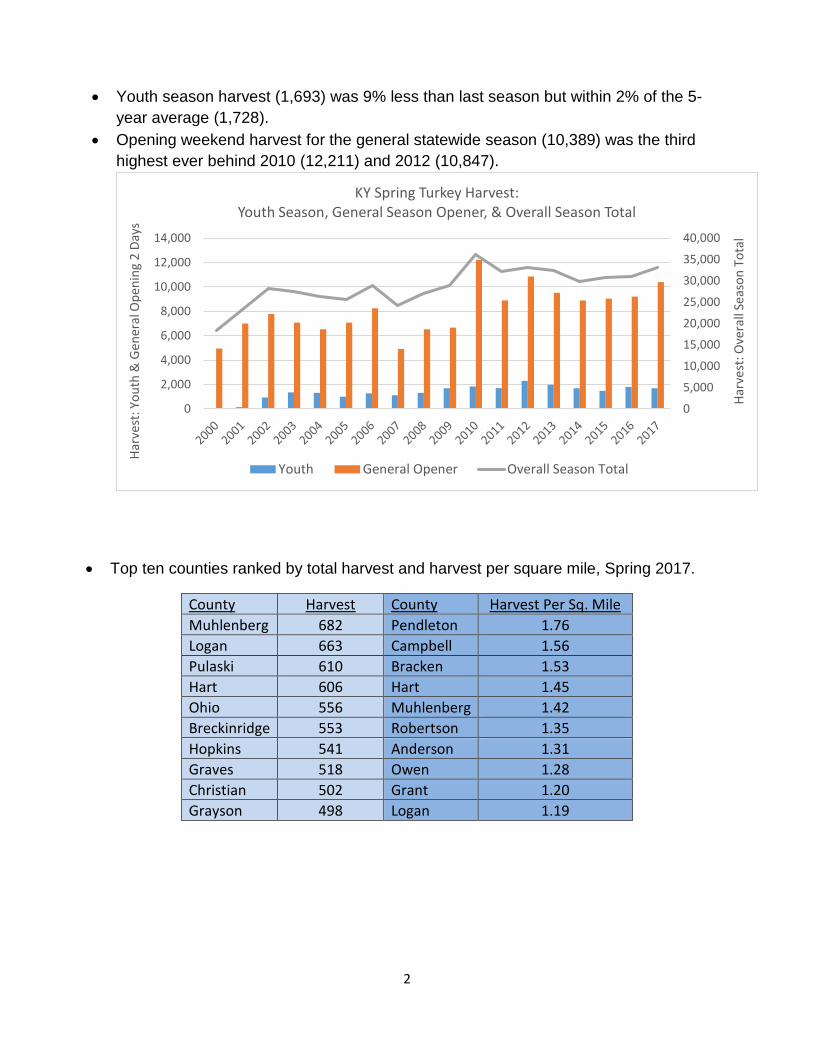
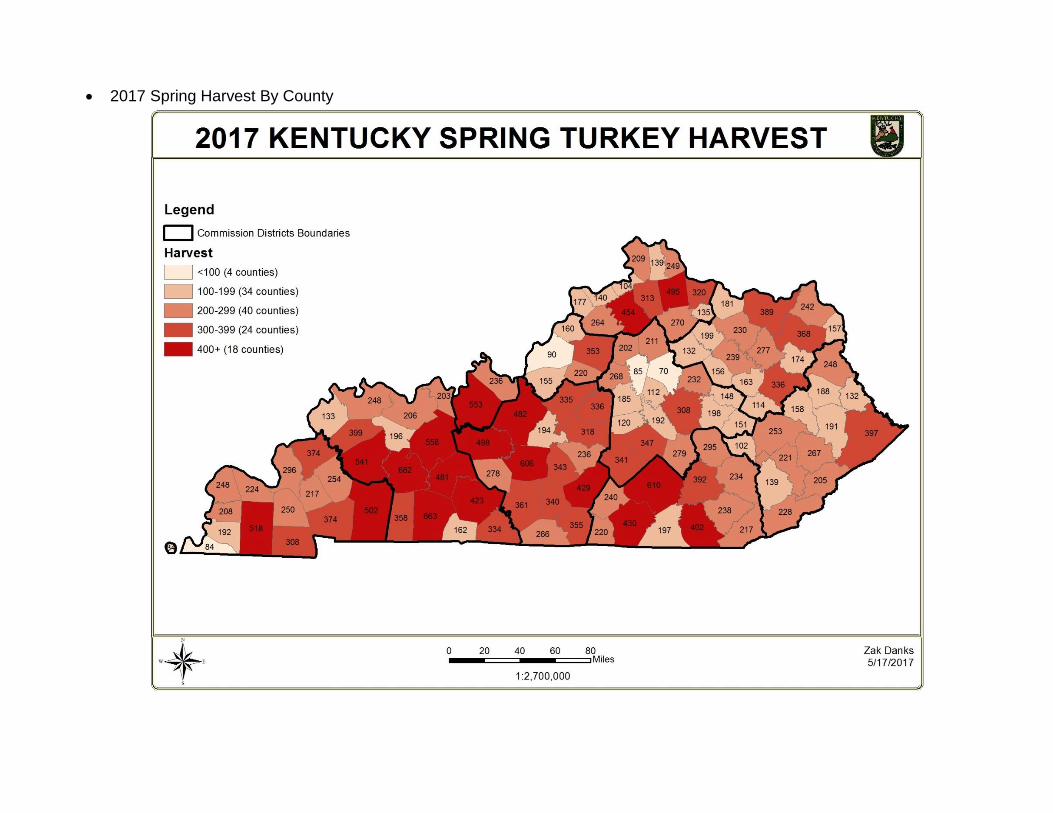
Top ten counties ranked by total harvest and harvest per square mile, Spring 2017.
County Harvest County Harvest Per Sq. Mile
Muhlenberg 682 Pendleton 1.76
Logan 663 Campbell 1.56
Pulaski 610 Bracken 1.53
Hart 606 Hart 1.45
Ohio 556 Muhlenberg 1.42
Breckinridge 553 Robertson 1.35
Hopkins 541 Anderson 1.31
Graves 518 Owen 1.28
Christian 502 Grant 1.20
Grayson 498 Logan 1.19
0
5,000
10,000
15,000
20,000
25,000
30,000
35,000
40,000
0
2,000
4,000
6,000
8,000
10,000
12,000
14,000
Har
vest
: Ove
rall
Seas
on
To
tal
Har
vest
: Yo
uth
& G
ener
al O
pen
ing
2 D
ays
KY Spring Turkey Harvest:Youth Season, General Season Opener, & Overall Season Total
Youth General Opener Overall Season Total
2017 Spring Harvest By County
4
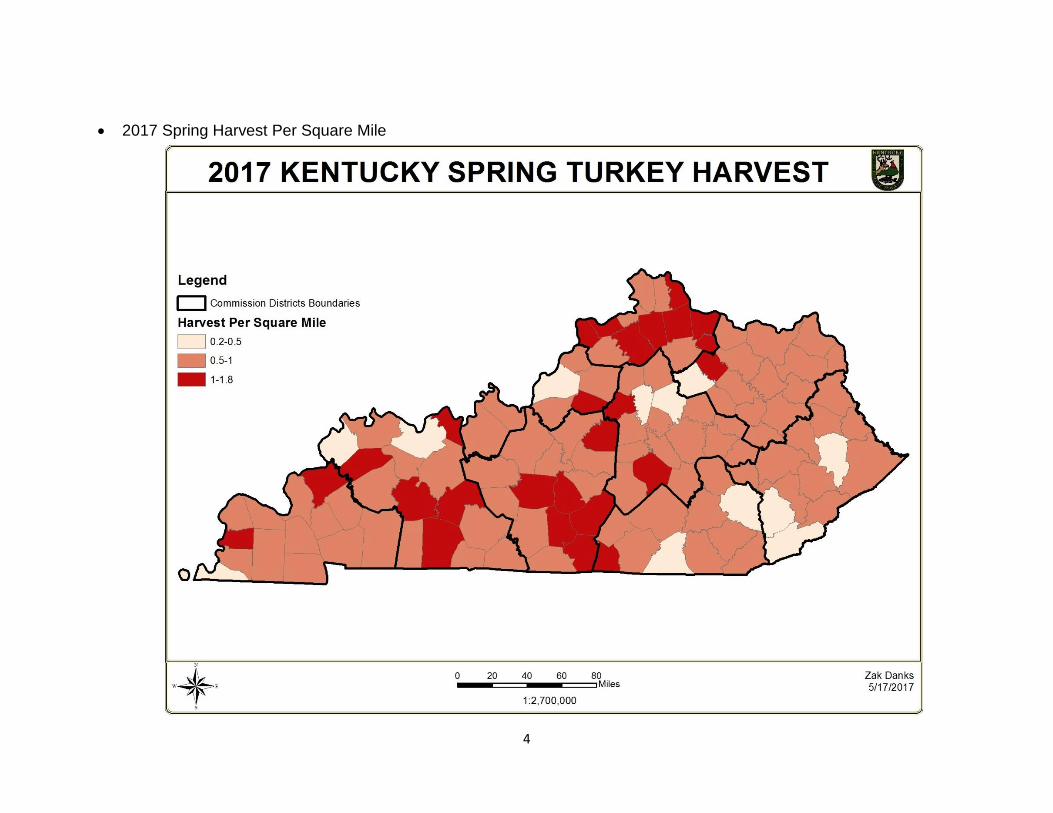
2017 Spring Harvest Per Square Mile
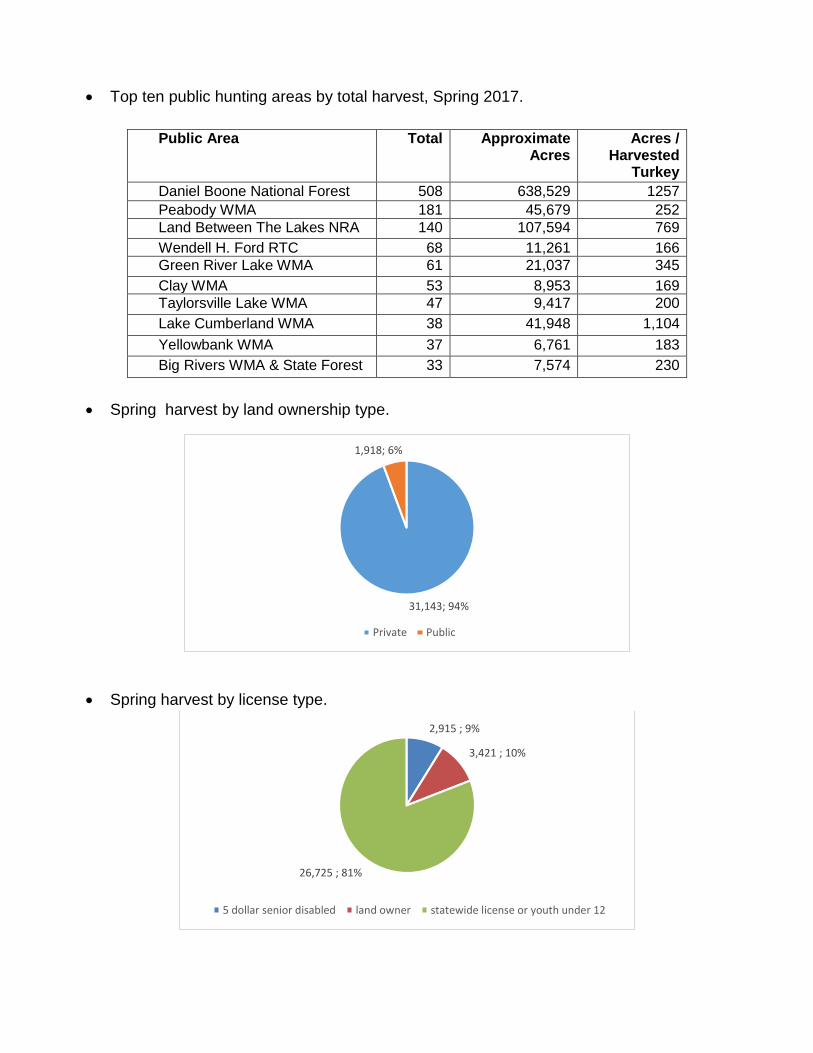
Top ten public hunting areas by total harvest, Spring 2017.
Public Area Total Approximate Acres
Acres / Harvested
Turkey
Daniel Boone National Forest 508 638,529 1257
Peabody WMA 181 45,679 252
Land Between The Lakes NRA 140 107,594 769
Wendell H. Ford RTC 68 11,261 166
Green River Lake WMA 61 21,037 345
Clay WMA 53 8,953 169
Taylorsville Lake WMA 47 9,417 200
Lake Cumberland WMA 38 41,948 1,104
Yellowbank WMA 37 6,761 183
Big Rivers WMA & State Forest 33 7,574 230
Spring harvest by land ownership type.
Spring harvest by license type.
31,143; 94%
1,918; 6%
Private Public
2,915 ; 9%
3,421 ; 10%
26,725 ; 81%
5 dollar senior disabled land owner statewide license or youth under 12
6
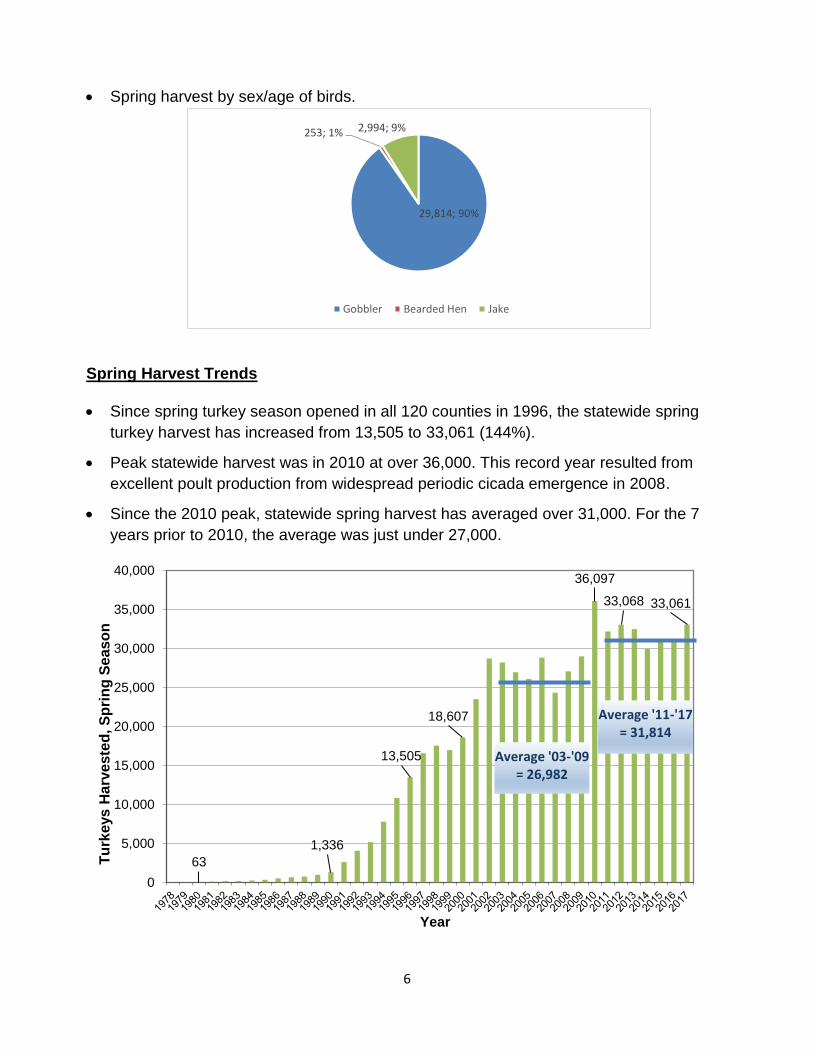
Spring harvest by sex/age of birds.
Spring Harvest Trends
Since spring turkey season opened in all 120 counties in 1996, the statewide spring
turkey harvest has increased from 13,505 to 33,061 (144%).
Peak statewide harvest was in 2010 at over 36,000. This record year resulted from
excellent poult production from widespread periodic cicada emergence in 2008.
Since the 2010 peak, statewide spring harvest has averaged over 31,000. For the 7
years prior to 2010, the average was just under 27,000.
29,814; 90%
253; 1% 2,994; 9%
Gobbler Bearded Hen Jake
63
1,336
13,505
18,607
36,097
33,068 33,061
0
5,000
10,000
15,000
20,000
25,000
30,000
35,000
40,000
Tu
rkeys
Ha
rve
ste
d, S
pri
ng
Se
as
on
Year
Average '03-'09= 26,982
Average '11-'17= 31,814
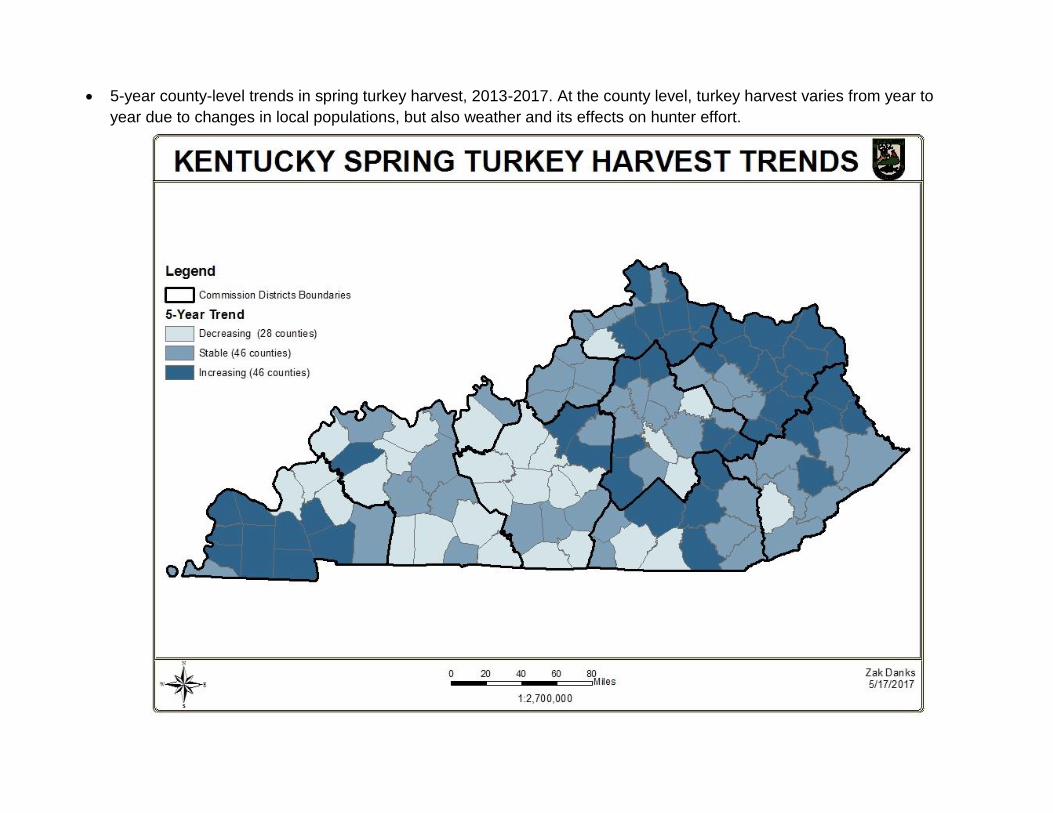
5-year county-level trends in spring turkey harvest, 2013-2017. At the county level, turkey harvest varies from year to
year due to changes in local populations, but also weather and its effects on hunter effort.
8
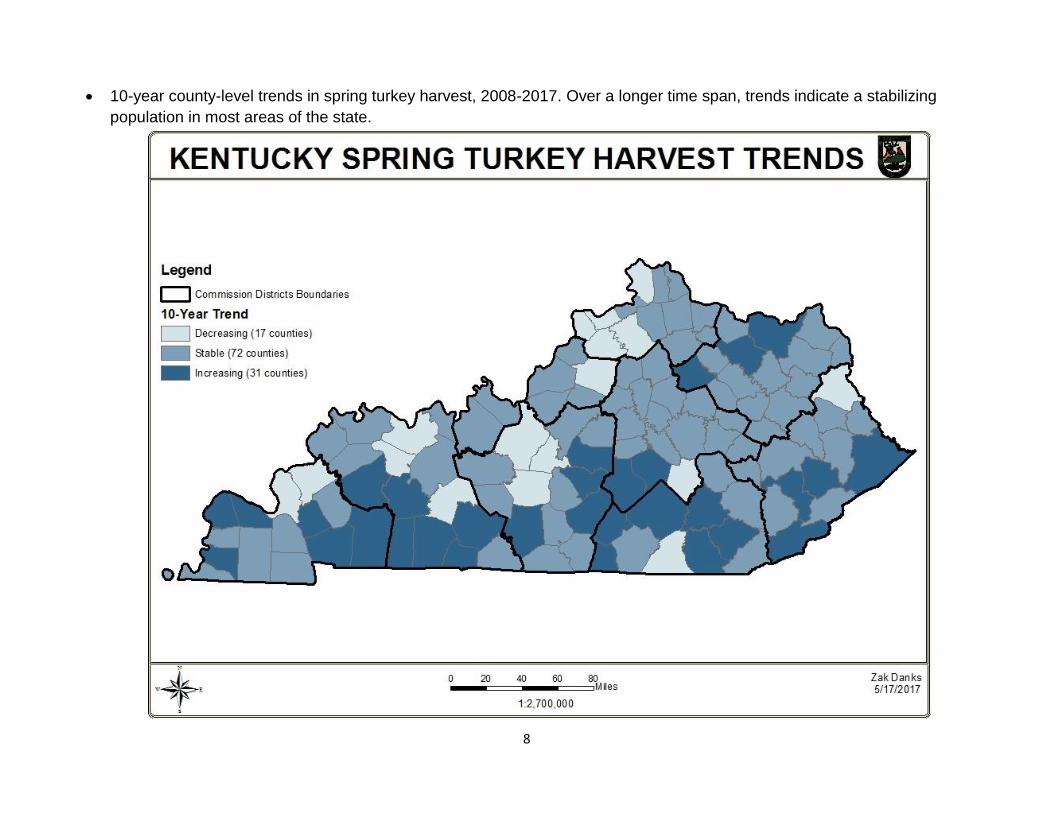
10-year county-level trends in spring turkey harvest, 2008-2017. Over a longer time span, trends indicate a stabilizing
population in most areas of the state.
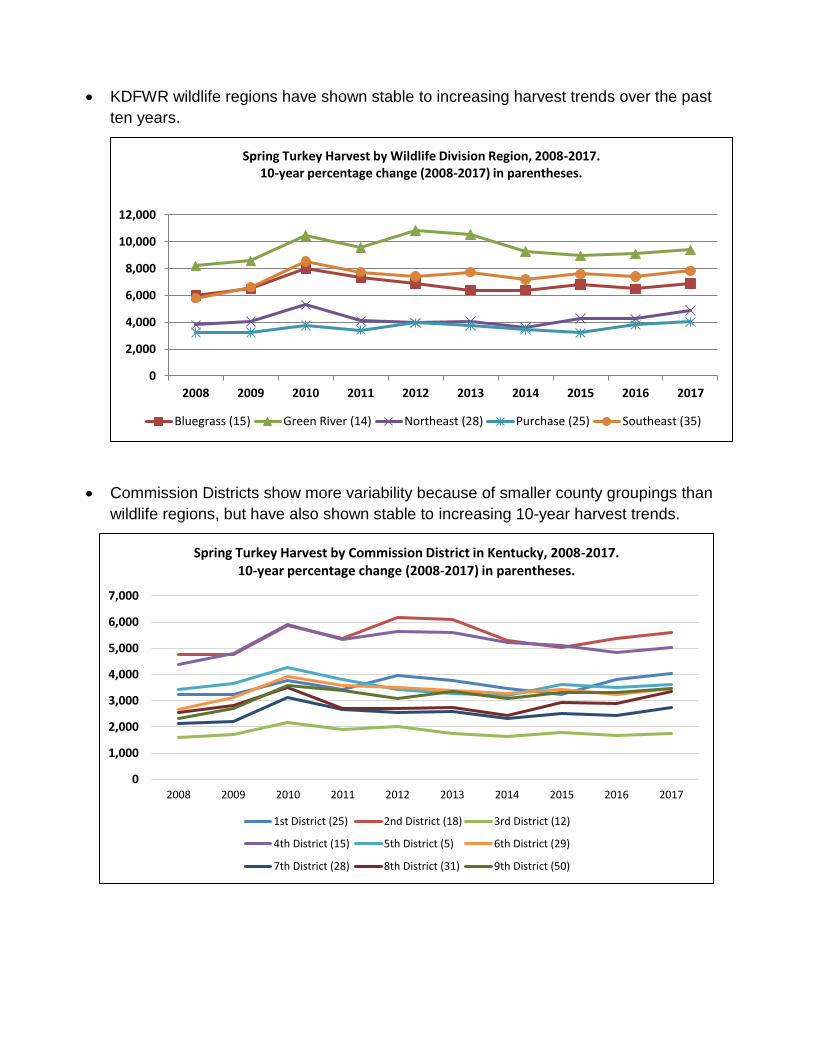
KDFWR wildlife regions have shown stable to increasing harvest trends over the past
ten years.
Commission Districts show more variability because of smaller county groupings than
wildlife regions, but have also shown stable to increasing 10-year harvest trends.
0
2,000
4,000
6,000
8,000
10,000
12,000
2008 2009 2010 2011 2012 2013 2014 2015 2016 2017
Spring Turkey Harvest by Wildlife Division Region, 2008-2017. 10-year percentage change (2008-2017) in parentheses.
Bluegrass (15) Green River (14) Northeast (28) Purchase (25) Southeast (35)
0
1,000
2,000
3,000
4,000
5,000
6,000
7,000
2008 2009 2010 2011 2012 2013 2014 2015 2016 2017
Spring Turkey Harvest by Commission District in Kentucky, 2008-2017.10-year percentage change (2008-2017) in parentheses.
1st District (25) 2nd District (18) 3rd District (12)
4th District (15) 5th District (5) 6th District (29)
7th District (28) 8th District (31) 9th District (50)
10
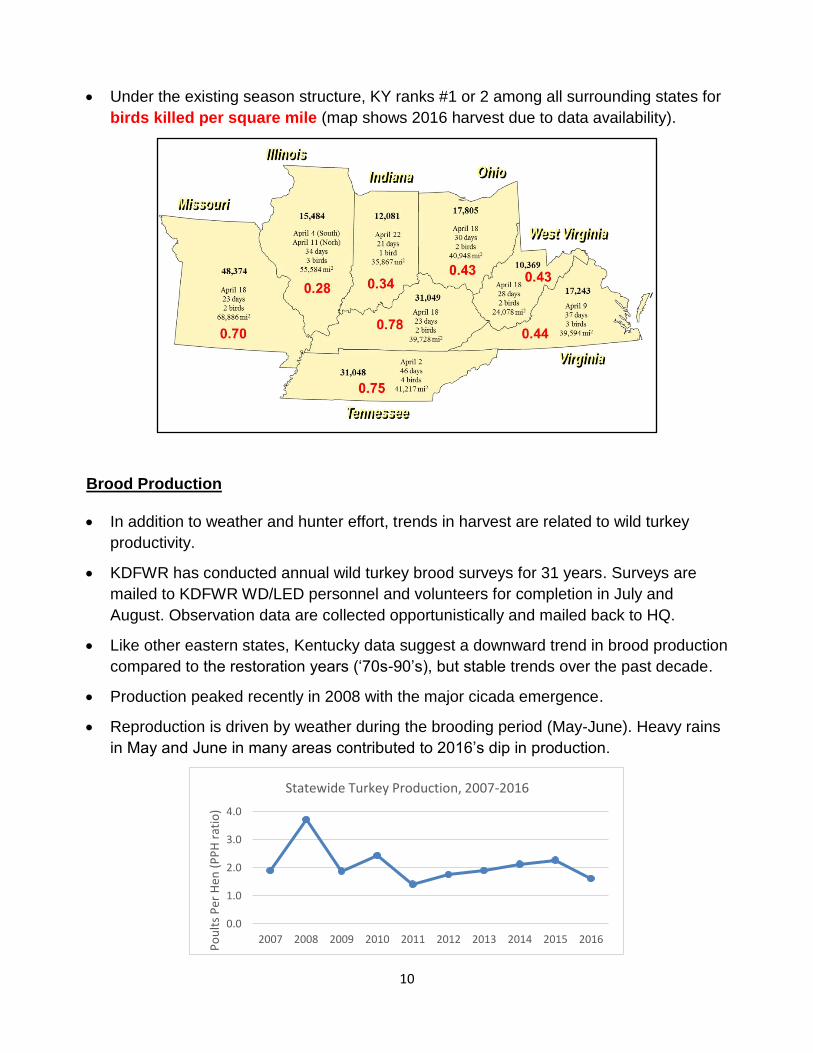
Under the existing season structure, KY ranks #1 or 2 among all surrounding states for
birds killed per square mile (map shows 2016 harvest due to data availability).
Brood Production
In addition to weather and hunter effort, trends in harvest are related to wild turkey
productivity.
KDFWR has conducted annual wild turkey brood surveys for 31 years. Surveys are
mailed to KDFWR WD/LED personnel and volunteers for completion in July and
August. Observation data are collected opportunistically and mailed back to HQ.
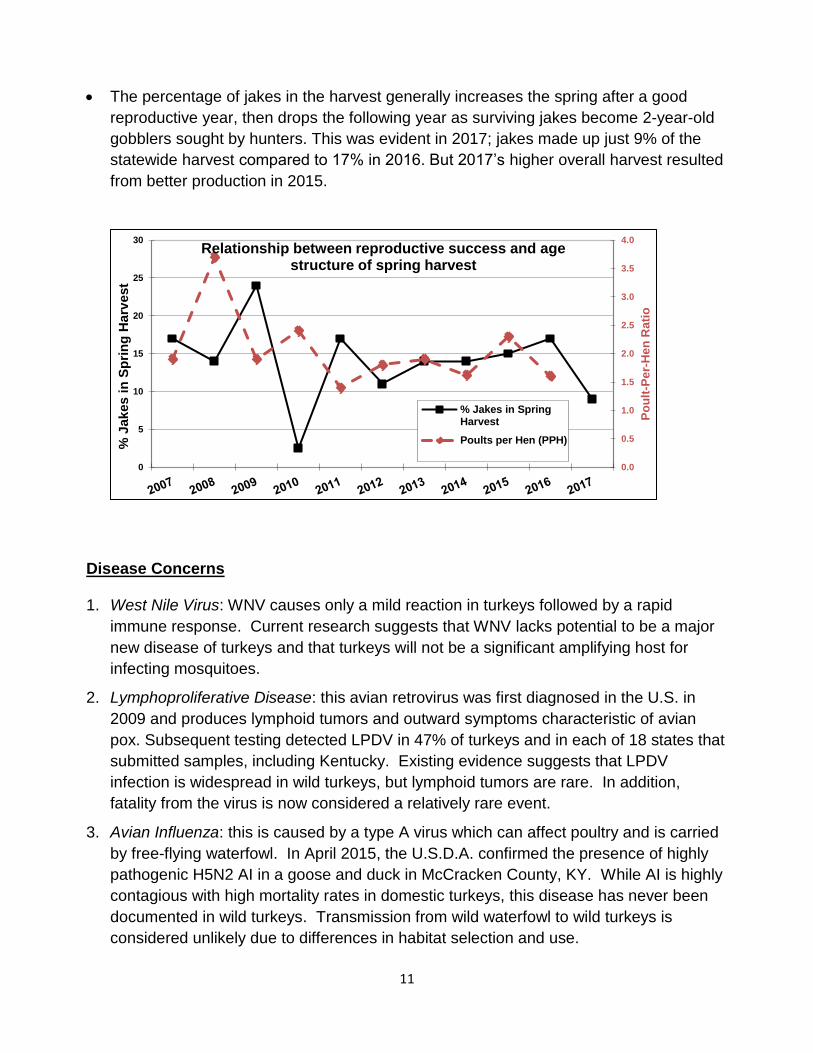
Like other eastern states, Kentucky data suggest a downward trend in brood production
compared to the restoration years (‘70s-90’s), but stable trends over the past decade.
Production peaked recently in 2008 with the major cicada emergence.
Reproduction is driven by weather during the brooding period (May-June). Heavy rains
in May and June in many areas contributed to 2016’s dip in production.
0.0
1.0
2.0
3.0
4.0
2007 2008 2009 2010 2011 2012 2013 2014 2015 2016
Po
ult
s P
er H
en (
PP
H r
atio
)
Statewide Turkey Production, 2007-2016
0.
0. 0.0. 0.
0.
0.
0.
11
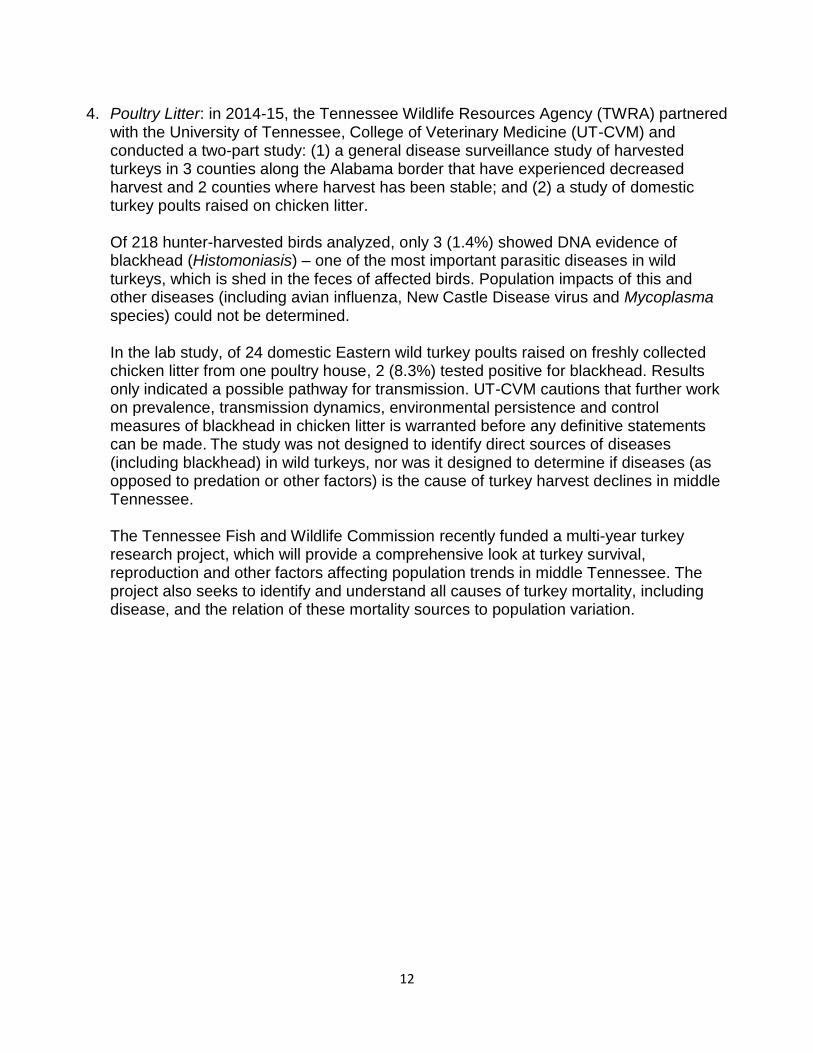
The percentage of jakes in the harvest generally increases the spring after a good
reproductive year, then drops the following year as surviving jakes become 2-year-old
gobblers sought by hunters. This was evident in 2017; jakes made up just 9% of the
statewide harvest compared to 17% in 2016. But 2017’s higher overall harvest resulted
from better production in 2015.
Disease Concerns 1. West Nile Virus: WNV causes only a mild reaction in turkeys followed by a rapid
immune response. Current research suggests that WNV lacks potential to be a major
new disease of turkeys and that turkeys will not be a significant amplifying host for
infecting mosquitoes.
2. Lymphoproliferative Disease: this avian retrovirus was first diagnosed in the U.S. in
2009 and produces lymphoid tumors and outward symptoms characteristic of avian
pox. Subsequent testing detected LPDV in 47% of turkeys and in each of 18 states that
submitted samples, including Kentucky. Existing evidence suggests that LPDV
infection is widespread in wild turkeys, but lymphoid tumors are rare. In addition,
fatality from the virus is now considered a relatively rare event.
3. Avian Influenza: this is caused by a type A virus which can affect poultry and is carried
by free-flying waterfowl. In April 2015, the U.S.D.A. confirmed the presence of highly
pathogenic H5N2 AI in a goose and duck in McCracken County, KY. While AI is highly
contagious with high mortality rates in domestic turkeys, this disease has never been
documented in wild turkeys. Transmission from wild waterfowl to wild turkeys is
considered unlikely due to differences in habitat selection and use.
0.0
0.5
1.0
1.5
2.0
2.5
3.0
3.5
4.0
0
5
10
15
20
25
30
Po
ult
-Pe
r-H
en
Ra
tio
% J
akes i
n S
pri
ng
Harv
est
Relationship between reproductive success and age structure of spring harvest
% Jakes in SpringHarvest
Poults per Hen (PPH)
12
4. Poultry Litter: in 2014-15, the Tennessee Wildlife Resources Agency (TWRA) partnered
with the University of Tennessee, College of Veterinary Medicine (UT-CVM) and conducted a two-part study: (1) a general disease surveillance study of harvested turkeys in 3 counties along the Alabama border that have experienced decreased harvest and 2 counties where harvest has been stable; and (2) a study of domestic turkey poults raised on chicken litter. Of 218 hunter-harvested birds analyzed, only 3 (1.4%) showed DNA evidence of blackhead (Histomoniasis) – one of the most important parasitic diseases in wild turkeys, which is shed in the feces of affected birds. Population impacts of this and other diseases (including avian influenza, New Castle Disease virus and Mycoplasma species) could not be determined. In the lab study, of 24 domestic Eastern wild turkey poults raised on freshly collected chicken litter from one poultry house, 2 (8.3%) tested positive for blackhead. Results only indicated a possible pathway for transmission. UT-CVM cautions that further work on prevalence, transmission dynamics, environmental persistence and control measures of blackhead in chicken litter is warranted before any definitive statements can be made. The study was not designed to identify direct sources of diseases (including blackhead) in wild turkeys, nor was it designed to determine if diseases (as opposed to predation or other factors) is the cause of turkey harvest declines in middle Tennessee. The Tennessee Fish and Wildlife Commission recently funded a multi-year turkey research project, which will provide a comprehensive look at turkey survival, reproduction and other factors affecting population trends in middle Tennessee. The project also seeks to identify and understand all causes of turkey mortality, including disease, and the relation of these mortality sources to population variation.
13
Summary
2017 spring harvest was up 6.5% over 2016 and was the 3rd highest spring harvest
ever.
Spring harvest has been stable to increasing in most counties, and stable in most
wildlife regions and commission districts. However, a few counties show a decline over
the past 5-year period. Some of this is due to a downward rebound following high
population years resulting from excellent poult production.
Brood production has been relatively stable over the past decade, likely indicating a
population that is stabilizing with the habitat’s carrying capacity.
We have no data to suggest that disease is a widespread concern to Kentucky’s wild
turkey flock.
Goals: 1) Continue monitoring of Telecheck reported turkey harvest.
2) Gather information on hunter effort to better inform changes in harvest.
3) Increase participation among brood survey respondents to strengthen
survey results.
4) Work to recruit hunters for observation data via mobile apps and online
reporting.
5) Continue surveillance efforts for potential disease concerns.
6) Maintain current spring season structure for wild turkeys, which offers a
good compromise between hunter opportunity and the biological needs of
the turkey flock.