Embed Size (px)
Citation preview
Version 1.0
1.5°C2.0°C3.0°C
Keeping 1.5°C Alive: Closing the Gap in the 2020sSeptember 2021
Our Commissioners come from a range of organisations – energy producers, energy-intensive industries, technology providers, finance players and environmental NGOs – which operate across developed and developing countries and play different roles in the energy transition. This diversity of viewpoints informs our work: our analyses are developed with a systems perspective through extensive exchanges with experts and practitioners. The ETC is chaired by Lord Adair Turner who works with the ETC team, led by Faustine Delasalle. Our Commissioners are listed on the next page.
Keeping 1.5°C Alive: Closing the Gap in the 2020s was developed by the Commissioners with the support of the ETC Secretariat, provided by SYSTEMIQ. This briefing paper has also been developed in close consultation with experts from companies, industry initiatives, international organisations, non-governmental organisations and academia. The publication was developed with input from the UK COP26 team to enhance the available analysis in the lead up to COP26. This briefing paper draws heavily on work developed by Climate Action Tracker (CAT) and the International Energy Agency (IEA), and ETC knowledge partners BloombergNEF. We warmly thank our knowledge partners and contributors for their inputs.
This report constitutes a collective view of the Energy Transitions Commission. Members of the ETC endorse the general thrust of the arguments made in this publication but should not be taken as agreeing with every finding or recommendation. The institutions with which the Commissioners are affiliated have not been asked to formally endorse this briefing paper.
The ETC Commissioners not only agree on the importance of reaching net-zero carbon emissions from the energy and industrial systems by mid-century, but also share a broad vision of how the transition can be achieved. The fact that this agreement is possible between leaders from companies and organisations with different perspectives on and interests in the energy system should give decision makers across the world confidence that it is possible simultaneously to grow the global economy and to limit global warming to well below 2˚C. Many of the key actions to achieve these goals are clear and can be pursued without delay.
Learn more at: www.energy-transitions.org www.linkedin.com/company/energy-transitions-commissionwww.twitter.com/ETC_energy
Closing the Gap in the 2020sKeeping 1.5°C Alive
The Energy Transitions Commission (ETC) is a global coalition of leaders from across the energy landscape committed to achieving net-zero emissions by mid-century, in line with the Paris climate objective of limiting global warming to well below 2°C and ideally to 1.5°C.
Keeping 1.5°C Alive – Closing the Gap in the 2020s2
Our Commissioners
Mr. Marco Alvera, Chief Executive Officer – SNAM
Mr. Thomas Thune Anderson,Chairman of the Board – Ørsted
Mr. Jeremy Bentham,Vice President Global Business Environment and Head of Shell Scenarios – Shell
Mr. Spencer Dale, Group Chief Economist – BP
Mr. Ani Dasgupta, Interim CEO & President – WRI
Mr. Bradley Davey, Chief Commercial Officer – ArcelorMittal
Mr. Pierre-André de Chalendar, Chairman and Chief Executive Officer – Saint Gobain
Dr. Vibha Dhawan,Director-General, The Energy and Resources Institute
Mr. Agustin Delgado, Chief Innovation and Sustainability Officer – Iberdrola
Ms. Marisa Drew, Chief Sustainability Officer & Global Head Sustainability Strategy, Advisory and Finance – Credit Suisse
Mr. Reagan Farr, President and Chief Executive Officer – Silicon Ranch
Mr. Will Gardiner, Chief Executive Officer – DRAX
Mr. John Haley, Chief Executive Officer – Willis Towers Watson
Mr. Philipp Hildebrand, Vice Chairman – Blackrock
Mr. John Holland-Kaye, Chief Executive Officer - Heathrow Airport
Mr. Fred Hu, Founder and Chairman – Primavera Capital
Dr. Timothy Jarratt, Chief of Staff - National Grid
Mr. Hubert Keller, Managing Partner – Lombard Odier
Ms. Zoe Knight, Managing Director and Group Head of the HSBC Centre of Sustainable Finance – HSBC
Mr. Jules Kortenhorst, Chief Executive Officer – Rocky Mountain Institute
Mr. Mark Laabs, Managing Director – Modern Energy
Mr. Richard Lancaster, Chief Executive Officer – CLP
Mr. Li Zheng, Executive Vice President – Institute of Climate Change and Sustainable Development, Tsinghua University
Mr. Li Zhenguo, President – LONGi Solar
Mr. Martin Lindqvist, Chief Executive Officer and President – SSAB
Mr. Johan Lundén, SVP Head of Project and Product Strategy Office – Volvo Group
Dr. María Mendiluce,Chief Executive Officer – We Mean Business
Mr. Jon Moore, Chief Executive Officer – BloombergNEF
Mr. Julian Mylchreest, Managing Director, Global Co-Head of Natural Resources (Energy, Power & Mining) – Bank of America
Ms. Damilola Ogunbiyi, Chief Executive Officer – Sustainable Energy For All
Mr. Paddy Padmanathan, President and CEO – ACWA Power
Mr. Vinayak Pai, Group President EMEA & APAC – Worley
Ms. Nandita Parshad, Managing Director, Sustainable Infrastructure Group – EBRD
Mr. Sanjiv Paul, Vice President Safety Health and Sustainability – Tata Steel
Mr. Alistair Phillips-Davies, CEO – SSE
Mr. Andreas Regnell, Senior Vice President Strategic Development – Vattenfall
Mr. Mattia Romani, Head of Sustainability – Autonomy Capital
Mr. Siddharth Sharma, Group Chief Sustainability Officer – Tata Sons Private Limited
Mr. Mahendra Singhi, Managing Director and CEO – Dalmia Cement (Bharat) Limited
Mr. Sumant Sinha, Chairman and Managing Director – Renew Power
Mr. Ian Simm, Founder and Chief Executive Officer – Impax
Lord Nicholas Stern, IG Patel Professor of Economics and Government - Grantham Institute - LSE
Dr. Günther Thallinger,Member of the Board of Management – Allianz
Mr. Simon Thompson, Chairman – Rio Tinto
Dr. Robert Trezona, Head of Cleantech – IP Group
Mr. Jean-Pascal Tricoire, Chairman and Chief Executive Officer – Schneider Electric
Ms. Laurence Tubiana, Chief Executive Officer - European Climate Foundation
Lord Adair Turner, Co-Chair – Energy Transitions Commission
Senator Timothy E. Wirth, President Emeritus – United Nations Foundation
Mr. Zhang Lei, Chief Executive Officer – Envision Group
Dr. Zhao Changwen, Director General Industrial Economy – Development Research Center of the State Council
Ms. Cathy Zoi, President – EVgo
Keeping 1.5°C Alive – Closing the Gap in the 2020s 3
Major ETC reports and working papers
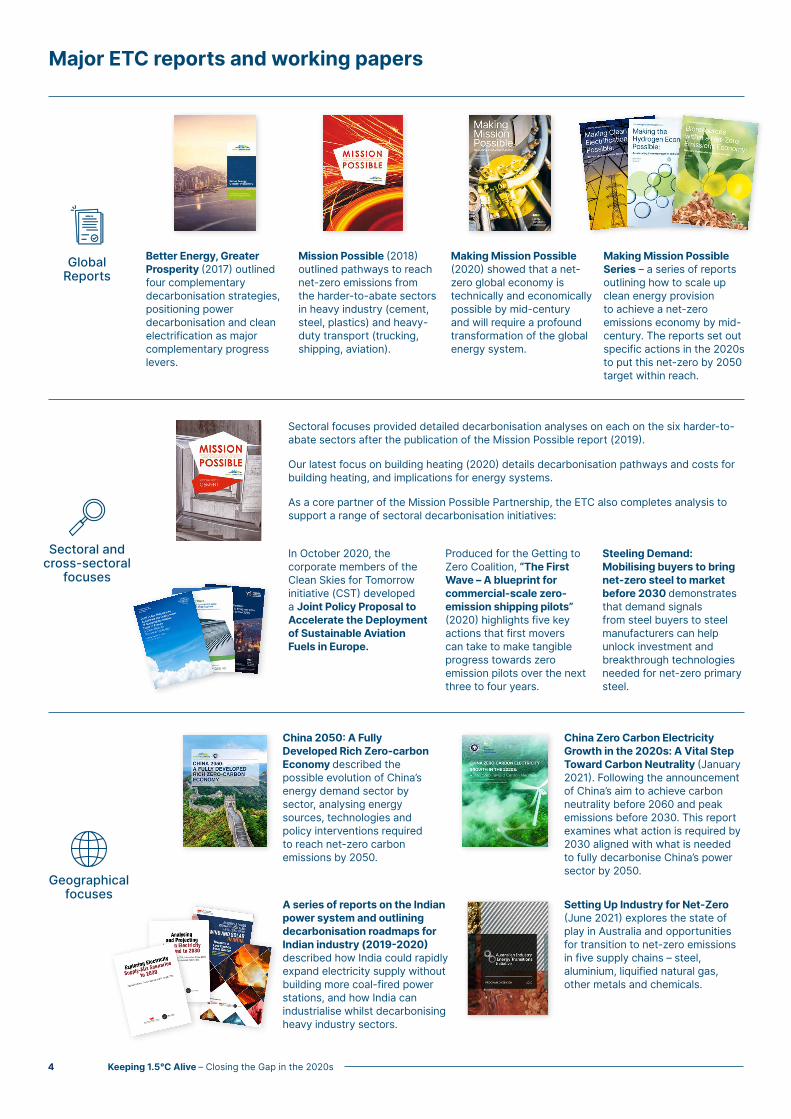
Better Energy, Greater Prosperity (2017) outlined four complementary decarbonisation strategies, positioning power decarbonisation and clean electrification as major complementary progress levers.
Mission Possible (2018) outlined pathways to reach net-zero emissions from the harder-to-abate sectors in heavy industry (cement, steel, plastics) and heavy-duty transport (trucking, shipping, aviation).
Making Mission Possible (2020) showed that a net-zero global economy is technically and economically possible by mid-century and will require a profound transformation of the global energy system.
Making Mission Possible Series – a series of reports outlining how to scale up clean energy provision to achieve a net-zero emissions economy by mid-century. The reports set out specific actions in the 2020s to put this net-zero by 2050 target within reach.
In October 2020, the corporate members of the Clean Skies for Tomorrow initiative (CST) developed a Joint Policy Proposal to Accelerate the Deployment of Sustainable Aviation Fuels in Europe.
Produced for the Getting to Zero Coalition, “The First Wave – A blueprint for commercial-scale zero-emission shipping pilots” (2020) highlights five key actions that first movers can take to make tangible progress towards zero emission pilots over the next three to four years.
Steeling Demand: Mobilising buyers to bring net-zero steel to market before 2030 demonstrates that demand signals from steel buyers to steel manufacturers can help unlock investment and breakthrough technologies needed for net-zero primary steel.
China 2050: A Fully Developed Rich Zero-carbon Economy described the possible evolution of China’s energy demand sector by sector, analysing energy sources, technologies and policy interventions required to reach net-zero carbon emissions by 2050.
A series of reports on the Indian power system and outlining decarbonisation roadmaps for Indian industry (2019-2020) described how India could rapidly expand electricity supply without building more coal-fired power stations, and how India can industrialise whilst decarbonising heavy industry sectors.
Sectoral focuses provided detailed decarbonisation analyses on each on the six harder-to-abate sectors after the publication of the Mission Possible report (2019).
Our latest focus on building heating (2020) details decarbonisation pathways and costs for building heating, and implications for energy systems.
As a core partner of the Mission Possible Partnership, the ETC also completes analysis to support a range of sectoral decarbonisation initiatives:
Global Reports
Sectoral and cross-sectoral focuses
Geographical focuses
China Zero Carbon Electricity Growth in the 2020s: A Vital Step Toward Carbon Neutrality (January 2021). Following the announcement of China’s aim to achieve carbon neutrality before 2060 and peak emissions before 2030. This report examines what action is required by 2030 aligned with what is needed to fully decarbonise China’s power sector by 2050.
Setting Up Industry for Net-Zero (June 2021) explores the state of play in Australia and opportunities for transition to net-zero emissions in five supply chains – steel, aluminium, liquified natural gas, other metals and chemicals.
Keeping 1.5°C Alive – Closing the Gap in the 2020s4

Keeping 1.5°C Alive – Closing the Gap in the 2020s 5

The Energy Transitions Commission 2Our Commissioners 3Glossary 7Introduction 8
Chapter 1 16The need for faster progress in the 2020s
Chapter 2 22What has changed since Paris? Technologies, costs, and scientific understanding
Chapter 3 26Assessing the potential to go beyond NDCs: Methodology and approach
Chapter 4 30Feasible actions to accelerate emissions reductions – 6 key categories for priority action 4.1 Significant and rapid reductions in methane emissions 314.2 Halting deforestation, beginning reforestation and other carbon sequestration opportunities 384.3 Decarbonising the power sector – accelerating coal phase out 404.4 Accelerating road transport electrification 434.5 Accelerating supply decarbonisation in buildings, heavy industry and heavy transport 454.6 Energy and resource efficiency improvements 47
Chapter 5 54Adding it up – Can we close the gap?
Chapter 6 58Actions at and after COP26
Acknowledgements 62
Contents
Keeping 1.5°C Alive – Closing the Gap in the 2020s6

Glossary
Abatement cost: The cost of reducing CO2 emissions, usually expressed in US$ per tonne of CO2.
Afforestation and reforestation: “The planting of new forests on land not currently under forest cover. The forests remove carbon from the atmosphere as they grow.”1
BECCS: A technology that combines bioenergy with carbon capture and storage to produce energy and net negative greenhouse gas emissions (i.e., removal of carbon dioxide from the atmosphere). See ‘BiCRS’.
BEV: Battery-electric vehicle.
BiCRS: Biomass carbon removal and storage. This term includes BECCS and other forms of carbon dioxide removal (e.g., biochar).2
Biochar: “The thermal decomposition of biomass in the absence of oxygen forms a charcoal known as biochar. This can be added to soils to improve soil fertility and to act as a stable long-term store of carbon.”3
Bioenergy: Renewable energy derived from biological sources in the form of solid biomass, biogas, or biofuels.
Biofuels: “Liquid fuels derived from biomass, used primarily for transport, including ethanol, biodiesel and other liquids.”4
Biomass or bio-feedstock: Organic matter, i.e., biogenic material, available on a renewable basis from living or recently living organisms. Includes feedstock derived from plants or animals, such as agricultural and energy crops, wood and forestry residues, organic waste from municipal and industrial sources (including manure), and algae.
Carbon capture and storage or use (CCS/U): We use the term ‘carbon capture’ to refer to the process of capturing CO2 on the back of energy and industrial processes. Unless specified otherwise, we do not include direct air carbon capture (DACC) when using this term. The term ‘carbon capture and storage’ (CCS) refers to the combination of carbon capture with underground carbon storage; while ‘carbon capture and use’ (CCU) refers to the use of carbon in carbon-based products in which CO2 is sequestered over the long term (e.g., in concrete, aggregates, carbon fibre). Carbon-based products that only delay emissions in the short term (e.g., synfuels) are excluded when using this terminology.
Carbon dioxide removals (CDR): sometimes shortened to ‘carbon removals’ refers to actions such as NCS or DACCS that can result in a net removal of CO2 from the atmosphere.
Carbon emissions / CO2 emissions: We use these terms interchangeably to describe anthropogenic emissions of carbon dioxide in the atmosphere.
1 UK Committee on Climate Change (2018), Biomass in a low-carbon economy.2 Sandalow et al. (2021), Biomass carbon removal and storage (BiCRS) roadmap.3 UK Committee on Climate Change (2018), Biomass in a low-carbon economy.4 BP (2014), Biomass in the Energy Industry – an introduction.5 BP (2014), Biomass in the Energy Industry – an introduction.6 BP (2014), Biomass in the Energy Industry – an introduction.7 Griscom et al. (2017), Natural Climate Solutions.
Carbon offsets: Reductions in emissions of carbon dioxide (CO2) or greenhouse gases made by a company, sector, or economy to compensate for emissions made elsewhere in the economy.
Carbon price: A government-imposed pricing mechanism, the two main types being either a tax on products and services based on their carbon intensity, or a quota system setting a cap on permissible emissions in the country or region and allowing companies to trade the right to emit carbon (i.e., as allowances). This should be distinguished from some companies’ use of what are sometimes called ‘internal’ or ‘shadow’ carbon prices, which are not prices or levies, but individual project screening values.
Circular economy models: Economic models that ensure the recirculation of resources and materials in the economy, by recycling a larger share of materials, reducing waste in production, light-weighting products and structures, extending the lifetimes of products, and deploying new business models based around sharing of cars, buildings, and more.
Direct air carbon capture (DACC): The extraction of carbon dioxide from atmospheric air. This is also commonly abbreviated as ‘DAC’.
Direct air carbon capture and storage (DACCS): DACC combined with carbon storage.
EBIT sectors: Energy, building, industry, and transport sectors.
Ecosystem services: Services from nature including nutrient cycling, flood and disease control, and recreational and cultural benefits.5
Embedded carbon emissions: Lifecycle carbon emissions from a product, including carbon emissions from the materials input production and manufacturing process.
Greenhouse gases (GHGs): Gases that trap heat in the atmosphere. Global GHG emission contributions by gas – CO2 (76%), methane (16%), nitrous oxide (6%) and fluorinated gases (2%).
Heavy Goods Vehicles (HGV) or Heavy Duty Vehicle (HDV): Both terms are used interchangeably and refer to trucks ranging from 3.5 tonnes to over 50 tonnes.
Internal combustion engine (ICE): A traditional engine, powered by gasoline, diesel, biofuels, or natural gas. It is also possible to burn ammonia or hydrogen in an ICE.
Levelised cost of electricity (LCOE): A measure of the average net present cost of electricity generation for a generating plant over its lifetime. The LCOE is calculated as the ratio between all the discounted costs over the lifetime of an electricity-generating plant divided by a discounted sum of the actual energy amounts delivered.
Lifecycle emissions: Emissions from the energy, material, and waste flows of a product and their impact on the environment.6 Life cycle assessments (LCAs) should take into account the greenhouse gas impacts across land use change (if applicable), growth, harvesting, transportation, conversion, and use of bioresources.
Natural carbon sinks: Natural reservoirs storing more CO2 than they emit. Forests, plants, soils, and oceans are natural carbon sinks.
Natural Climate Solutions (NCS): Actions considered to be a subset of nature-based solutions (NBS) with a specific focus on addressing climate change. NCS has been defined as “conservation, restoration, and/or improved land management actions to increase carbon storage and/or avoid greenhouse gas emissions across global forests, wetlands, grasslands, agricultural lands, and oceans”.7 NCS can be coupled with technology to secure long-term or permanent storage of GHGs, examples include CCS, the use of technologies such as torrefaction to process biomass or monitoring to improve forest management techniques for increased density.
Negative emissions (or ‘net negative’ emissions): is used for the case where the combination of all sector CO2 emissions plus carbon removals results in an absolute negative (and thus a reduction in the stock of atmospheric CO2).
Net-zero-carbon-emissions / Net-zero-carbon / Net-zero: We use these terms interchangeably to describe the situation in which the energy and industrial system as a whole or a specific economic sector releases no CO2 emissions – either because it doesn’t produce any or because it captures the CO2 it produces to use or store. In this situation, the use of offsets from other sectors (‘real net-zero’) should be extremely limited and used only to compensate for residual emissions from imperfect levels of carbon capture, unavoidable end-of-life emissions, or remaining emissions from the agriculture sector.
Peatlands: Peatlands contain layers of partially decomposed organic material preserved in waterlogged environments. They contain a large fraction of the world’s terrestrial carbon stock and when damaged or destroyed can become large sources of GHG emissions.
Zero-carbon energy sources: Term used to refer to renewables (including solar, wind, hydro, geothermal energy), sustainable biomass, nuclear and fossil fuels if and when their use can be decarbonised through carbon capture.
Keeping 1.5°C Alive – Closing the Gap in the 2020s 7

Introduction
In November the world will hold the landmark 26th Conference of the Parties (COP26) in Glasgow, aiming to accelerate global action to avert potentially catastrophic climate change. Ahead of that meeting, many countries, cities, and companies have made commitments to reach net-zero emissions (whether for carbon dioxide or all greenhouse gas emissions (GHGs) by 2050 or 2060). In addition, over 100 countries have submitted new “nationally determined contributions” (NDCs) within the Paris agreement framework, updating their previous targets for reductions to be achieved by 2030. But, the sum of these pledges still falls far short of what is required to deliver a more than 50% chance of limiting global warming to 1.5°C.1
This report describes 6 sets of action which if agreed at COP 26 and implemented during the 2020s would make it possible to achieve the 1.5°C target. It focuses on actions which are clearly technically feasible and which could initially be progressed by leading groups of governments and/or companies without the need for comprehensive internationally negotiated agreements. Many of these actions would also deliver significant co-benefits, for example through improved local air quality.
Four of the action categories would entail either nil or even negative costs, or costs which could very easily be absorbed by the global economy:
• These include low cost actions to reduce methane emissions, which has not previously received the attention it deserves, given methane’s crucial role in global warming and the big potential for short term reductions and favourable climate impact;
• They also include action to accelerate road transport electrification, energy efficiency improvement, and the decarbonisation of sectors such as steel, cement, shipping and aviation, which until recently were seen as “harder to abate”. In some of these sectors indeed technological progress, cost reductions and corporate commitments make it likely that emission reductions will run ahead of current NDC commitments even if no new agreements were made at COP26. But additional commitments and agreements would reinforce the powerful “ambition loop” between national policy, corporate action and technological progress, enabling still faster emissions reduction, while supporting economic growth.
Two categories of action would however entail material economic cost. Committing to no new coal investments is close to costless, but reducing emissions from existing coal plants before end of life would impose some cost, particularly in some lower income developing countries. So too would action to halt deforestation, which has long been identified as a high priority, but with limited progress. Commitments of climate finance support from developing countries will therefore be required to seize the potential in these two specific categories.
The starting point - how big is the gap?
Box A shows the starting point from which emissions reductions must be achieved and explains the complexities involved in assessing the relative importance of carbon dioxide and methane emissions. According to the period considered over which the warming impacts of methane are felt, current CH4 emissions of around 375 MtCH4/year could be considered as equivalent to anywhere between 11 GtCO2/year (100-year view) and 31 GtCO2/year (20-year view), and the measure of impact of any given methane emissions reduction varies by the same proportion. There is no clear “correct” way to measure the equivalence of methane emissions, but given the vital importance of reducing global warming soon – and the risk of tipping points and feedback loops from continued warming - there is a strong argument for placing as much emphasis on the 20-year period (which implies a 84 times multiplier vs CO2) as on the 100-year (28 multiplier) approach. Latest analysis by the IPCC suggests that about 40% of global warming so far has been caused by methane rather than carbon dioxide emissions. In this report, we therefore place very strong emphasis on the importance of reducing methane emissions and show the impact of methane reductions on both the 20-year and 100-year bases.2
1 The Paris agreement committed the world to limiting global warming to “Well below 2°C, while pursuing efforts to limit the temperature rise to 1.5°C”. The IPCC Special report on Global Warming of 1.5°C, published in Autumn 2019 argued that a limit of 1.5°C should be the objective given the increasing harm which would result as temperature rises to and beyond that point. It is already close to impossible to ensure a high probability that warming will be limited to 1.5°C. This report focuses on the actions required to give a 50:50 chance of limiting warming to 1.5°C and a 90% chance of keeping it below 2°C.
2 Emissions from other greenhouse gases are also important - particularly nitrous oxide, much of which results from use of fertilisers in the agricultural sector, and fluorinated gases, typically used as refrigerants – however the actions identified in this report focus solely on reducing emissions from carbon dioxide and methane.
Keeping 1.5°C Alive – Closing the Gap in the 2020s8
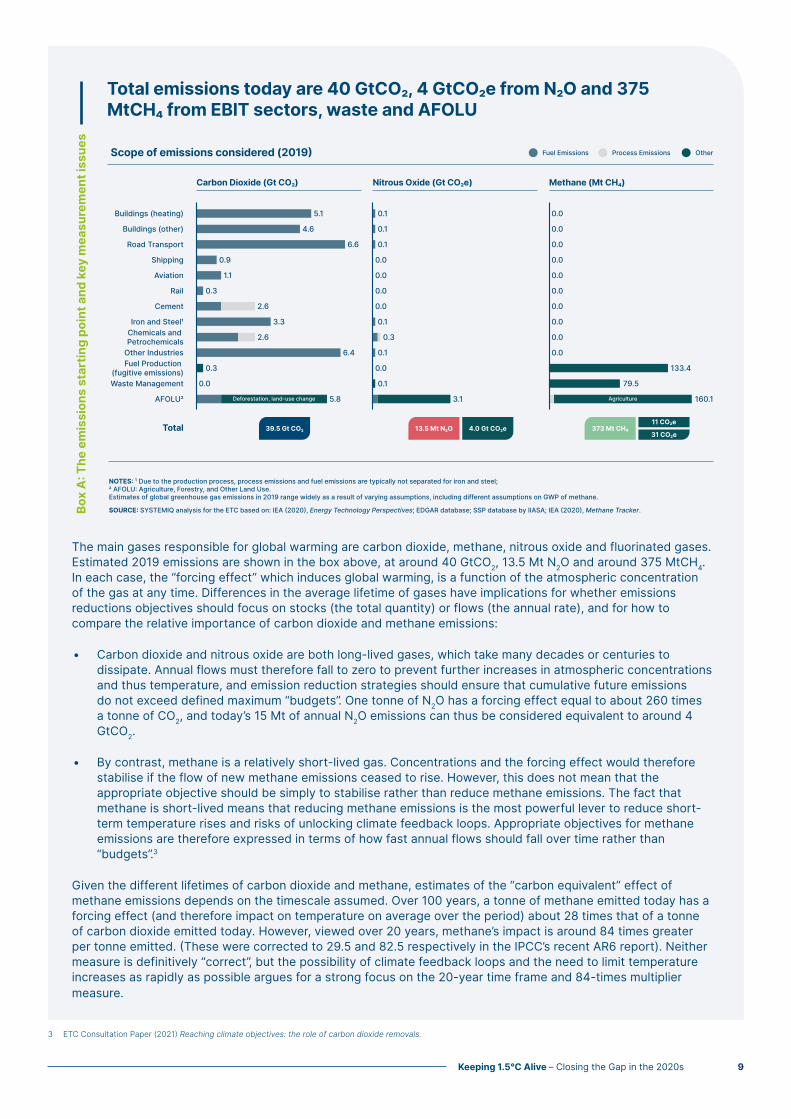
The main gases responsible for global warming are carbon dioxide, methane, nitrous oxide and fluorinated gases. Estimated 2019 emissions are shown in the box above, at around 40 GtCO2, 13.5 Mt N2O and around 375 MtCH4. In each case, the “forcing effect” which induces global warming, is a function of the atmospheric concentration of the gas at any time. Differences in the average lifetime of gases have implications for whether emissions reductions objectives should focus on stocks (the total quantity) or flows (the annual rate), and for how to compare the relative importance of carbon dioxide and methane emissions:
• Carbon dioxide and nitrous oxide are both long-lived gases, which take many decades or centuries to dissipate. Annual flows must therefore fall to zero to prevent further increases in atmospheric concentrations and thus temperature, and emission reduction strategies should ensure that cumulative future emissions do not exceed defined maximum “budgets”. One tonne of N2O has a forcing effect equal to about 260 times a tonne of CO2, and today’s 15 Mt of annual N2O emissions can thus be considered equivalent to around 4 GtCO2.
• By contrast, methane is a relatively short-lived gas. Concentrations and the forcing effect would therefore stabilise if the flow of new methane emissions ceased to rise. However, this does not mean that the appropriate objective should be simply to stabilise rather than reduce methane emissions. The fact that methane is short-lived means that reducing methane emissions is the most powerful lever to reduce short-term temperature rises and risks of unlocking climate feedback loops. Appropriate objectives for methane emissions are therefore expressed in terms of how fast annual flows should fall over time rather than “budgets”.3
Given the different lifetimes of carbon dioxide and methane, estimates of the “carbon equivalent” effect of methane emissions depends on the timescale assumed. Over 100 years, a tonne of methane emitted today has a forcing effect (and therefore impact on temperature on average over the period) about 28 times that of a tonne of carbon dioxide emitted today. However, viewed over 20 years, methane’s impact is around 84 times greater per tonne emitted. (These were corrected to 29.5 and 82.5 respectively in the IPCC’s recent AR6 report). Neither measure is definitively “correct”, but the possibility of climate feedback loops and the need to limit temperature increases as rapidly as possible argues for a strong focus on the 20-year time frame and 84-times multiplier measure.
3 ETC Consultation Paper (2021) Reaching climate objectives: the role of carbon dioxide removals.
Box A: The emissions starting point and key measurement issues
Total emissions today are 40 GtCO, 4 GtCOe from NO and 375 MtCH from EBIT sectors, waste and AFOLU
Scope of emissions considered (2019)
Carbon Dioxide (Gt CO)
Process Emissions OtherFuel Emissions
Nitrous Oxide (Gt COe) Methane (Mt CH)
5.1
4.6
6.6
0.9
1.1
0.3 0.0
0.0
0.0
0.0
0.1
0.0
0.0
0.0
0.0
0.0
0.0
133.4
79.5
160.1
0.0
0.0
0.0
0.0
0.0
0.1
0.1
0.1
0.3
0.1
0.1
2.6
3.3
2.6
6.4
0.3
5.8 3.1
0.0
Buildings (heating)
Buildings (other)
Road Transport
Shipping
Aviation
Rail
Cement
Iron and SteelChemicals and PetrochemicalsOther IndustriesFuel Production
(fugitive emissions)
AFOLU
Total
Waste Management
39.5 Gt CO 13.5 Mt NO 4.0 Gt COe
NOTES: ¹ Due to the production process, process emissions and fuel emissions are typically not separated for iron and steel; AFOLU: Agriculture, Forestry, and Other Land Use. Estimates of global greenhouse gas emissions in 2019 range widely as a result of varying assumptions, including different assumptions on GWP of methane.
SOURCE: SYSTEMIQ analysis for the ETC based on: IEA (2020), Energy Technology Perspectives; EDGAR database; SSP database by IIASA; IEA (2020), Methane Tracker.
Deforestation, land-use change Agriculture
373 Mt CH31 COe
11 COe
Keeping 1.5°C Alive – Closing the Gap in the 2020s 9

Using the 100-year approach referenced in many external sources, current total GHG emissions amount to about 55 GtCO2 equivalent (“CO2e”, see exhibit in Box A) and that figure would continue to rise under a business-as-usual scenario. Analysis suggests that policies already in place could deliver a reduction to as low as 51 GtCO2e by 2030. New NDC commitments could bring emissions down by another 2-5 GtCO2e, to a level around 46-49 GtCO2e in 2030. However, reductions in total emissions to somewhere around 25-30 GtCO2e by 2030 would be needed to put the world on a pathway which would limit global warming to 1.5°C.4 The world, therefore, faces an “emissions gap” of around 20-23 GtCO2e between what needs to be achieved and what is likely to be committed to in NDCs agreed by COP26.5
Six sets of actions to close the gap
Almost all of this gap could be closed via the feasible actions identified in this report. Methane emissions could be cut by 40%, delivering about 130 MtCH4 of reduction not already included in current NDCs. This would be equivalent to a CO2e reduction of around 3.5 Gt on the 100-year (28 multiplier) basis, and around 11 Gt on the 20-year basis (84 multiplier) (Exhibit 1). Feasible actions could reduce carbon dioxide emissions by an additional 17 GtCO2 beyond NDC commitments, with 6.6 Gt CO2 of reductions delivered by “Nature-Based Solutions” and over 10 GtCO2 via accelerated reduction of emissions from the energy, building, industry and transport (EBIT) sectors (Exhibit 2).
In order to achieve this, we propose a programme of action involving six action areas:
1. Significant and rapid reductions in methane emissions, delivering an additional reduction of 3.5 GtCO2e (100-year view) to 11 GtCO2e (20-year view) beyond current NDCs, depending on the time period assumed. This could be achieved via two distinct categories of action:
• Emissions arising from fuel production, transport, and use, which currently amount to around 135 Mt CH4, could and should be reduced by 60% or more by 2030, led by reduction of 75% in US, Russia, Canada and China. Coal-related emissions will automatically fall if coal use is phased out in the power sector, while emissions arising from leaks in the oil and gas production and distribution system could be radically reduced through an array of technically feasible actions. Many of the actions required to achieve this will entail negative, zero, or minimal cost, but rapid progress will only be achieved through strong action by key governments, companies, and the financial sector supported by strong regulation, independent monitoring, and certification.
• Reducing emissions in the waste and agricultural sectors will be more challenging. Low-cost opportunities clearly exist, but progress will require actions by very large numbers of companies and individual producers across the world or entail consumer behaviour shifts towards more plant-based and less meat-based diets. However, a strong international focus on achieving the potential reductions, supported by multiple forms of national, corporate, city, and consumer action, could deliver reductions of 30% by 2030.
Given the vital importance of reducing methane emissions fast, COP26 should therefore be used as an opportunity to launch an initiative to reduce annual methane emissions by at least 40% by 2030, or 150 MtCH4 per year, building on (but strengthening) the Global Methane Pledge.
2. Halting deforestation, beginning reforestation and other carbon sequestration opportunities. The potential and need to reduce carbon dioxide emissions by ending deforestation has long been recognised. By 2030, 3.6 GtCO2 of annual emissions could be eliminated if deforestation ceased, and almost 3 GtCO2 per annum could be removed from the atmosphere via reforestation and other nature-based actions to sequester carbon in soils and restored ecosystems. Development of new technology is not necessary to achieve this (though it can be an enabler), and in principle the costs of abatement are low, but success will require a combination of:
• Flows of finance from developed to developing countries to cover the short-term opportunity cost of preserving tropical forests rather than exploiting them for alternative activities such as feedstock crops or cattle rearing, and to support reforestation of around 300 million hectares of land by 2030. Estimates suggest that the cost of such action would be low compared with other mitigation options – for instance nearly 2 GtCO2 could potentially be avoided at a cost of less than $10 per tonne of CO2, with a further 1 GtCO2 available at less than $100 per tonne of CO2.6 Estimates for reforestation and afforestation are consistently in the range of around $5-50/tCO2.7 Large-scale financial flows will be required to achieve the potential reductions – for example $200 billion per annum would be required to achieve 5 GtCO2 of reductions at an average cost of $40 per tonne.
• Jurisdictional approaches to land management at a regional or national level, that ensure emissions are genuinely reduced, rather than simply displaced.
• Widespread changes in consumer behaviour to begin a shift from meat-based to more plant-based diets.
4 The GHG emissions level baselines and pathways in this report are based on analysis from Climate Action Tracker. Further details on this analysis and comparison with other methodologies are included in the Annex. CAT’s estimates for NDCs are consistent with the September 2021 update of the UNFCCC NDC Synthesis Report.
5 The emissions gap would be larger if using a 20-year multiplier for methane, however this report consistently uses the 100 year multiplier when referring to the 2030 emissions gap in CO2e.
6 Based on estimates in Griscom et al. (2017) Natural Climate Solutions.7 Royal Society (2018) Greenhouse Gas Removal. Fuss et al. (2018) Negative emissions—Part 2: Costs, potentials and side effects.
Keeping 1.5°C Alive – Closing the Gap in the 2020s10

In addition to nature-based forms of carbon sequestration it is possible to achieve 0.1 GtCO2 carbon removal by 2030 via carbon capture technologies combined with geological storage of CO2, whether via BiCRS (biomass carbon removal and storage) or DACCS (direct air capture of CO2 plus storage). Early projects in the 2020s can ensure these technologies are available to deploy at scale beyond 2030.
Exhibit 1
Exhibit 2
Global CH emissions
Mt CH, Global, annual GtCOe, Global, annualBased on 20-year GWP = 84
0
100
200
300
400
2019
~380 1871
62
0 ~235
NDCs Fossil Ag, Waste Gap 2030-1.5°Ccompatible
Highly feasible actions to reduce methane can deliver an additional ~130 MtCH₄ (3.5-11 GtCO₂e) beyond current NDCs in 2030
Key actions~ 130 MtCH
Sector potential scaled down based on likely overlap to avoid double
counting with NDCs
0
10
20
30
40
2019 NDCs Fossil Ag, Waste Gap 2030-1.5°Ccompatible
Sector potential scaled down based on likely overlap to avoid double
counting with NDCs33 1.5 6
5
0 20
Key actions~ 11 GtCOe
Based on 100-year GWP = 28
0
10
20
2019 NDCs Fossil Ag, Waste Gap 2030-1.5°Ccompatible
10 0.5 1.91.7
0 6.6
Key actions~ 3.5 GtCOe
NOTE: NDC emissions reductions are based on average of CAT “pledges and targets” pathway adjusted for CH₄. 1.5C compatible levels in 2030 are based on IPCC 1.5C no/low overshoot scenario median.
SOURCE: IPCC (2018), Global warming of 1.5°C. An IPCC Special Report, Climate Action Tracker (CAT), SYSTEMIQ analysis for the Energy Transitions Commission (2021).
Highly feasible actions to reduce carbon dioxide can deliver an additional ~17 GtCO₂ reductions beyond current NDCs in 2030Global CO₂ emissions
Gt CO₂, Global, annual
50
40
30
20
10
02030-BAU
> 40
Achievedby NDCs
Nature-based solutions (including carbon removals)
Power Road Supply sidedecarbonisationin other sectors
Energy andresourceefficiency
Gap 2030 - 1.5°Ccompatible
(CAT average)
NOTE: 2030 BAU CO₂ emissions are estimated based on CAT CO₂e 2030 BAU average (53GtCO₂e) minus current methane levels in GWP=25 terms (9.3 GtCO₂e). NDC emissions reductions are estimated based on average of CAT “pledges and targets” pathway adjusted for CO₂. 1.5°C and 2°C compatible levels in 2030 are based on IPCC 1.5°C no/low overshoot scenario ranges.
SOURCE: IPCC (2018), Global warming of 1.5°C. An IPCC Special Report, Climate Action Tracker (CAT), SYSTEMIQ analysis for the Energy Transitions Commission (2021).
2019
> 252°C
~19-241.5°C
3
6.6
3.52.3
2.12.5
~2Key actions~ 17 GtCO₂
Sector potential scaled down based on likely overlap to avoid double counting with NDCs
EBIT = Energy, Buildings, Transport and Industry
Key EBIT actions~ 10 GtCO₂
Keeping 1.5°C Alive – Closing the Gap in the 2020s 11

A crucial priority for COP26 should be to gain as strong an agreement as possible on ending deforestation, supported by appropriate flows of international climate finance. An end to deforestation, the beginning of reforestation and other nature-based solutions should indeed (along with action to eliminate emissions from existing coal plants – see below) be the highest priority for use of the funds which rich developed countries have committed to international climate finance.
3. Decarbonising the power sector – accelerating coal phase-out. Power sector CO2 emissions were over 13 Gt in 2019, with 9.5 Gt of this arising from coal-fired power. In addition, coal-related CH4 emissions of an estimated 40 MtCH4 produce an equivalent impact of 1 GtCO2e (100-year view) to 3 GtCO2e (20-year view). Accelerating the move beyond coal power generation is therefore one of the highest potential actions to reduce emissions in the short term. An additional 3.5 GtCO2 reductions, beyond current NDC commitments, together with proportional cuts in coal-related methane, could be achieved via a combination of three actions:
• Clear international agreement to build no new coal plants, scrapping the vast majority of the 300 GW of proposed new coal capacity still in the pipeline. This is a close to costless commitment since renewables are now cheap enough to deliver increases in power production and consumption at total system costs fully competitive with new coal.8
• Commitments by all OECD countries to completely phase out any unabated coal generation by 2030 – either through closing coal plants entirely or by adding CCS. The costs of this will be very small relative to the GDP of rich countries.9
• Action to phase out ~760 GW older existing coal plants (e.g. plants greater than 20 years old) in middle-income and developing economies. This may entail a significant net cost and should be a high priority for the use of climate finance funds by which the rich developed world supports accelerated decarbonisation in lower-income developing countries.
A strong agreement between major countries to move beyond coal in the 2020s is therefore a vital COP26 priority. This should align and expand on existing initiatives such as the Powering Past Coal Alliance and entail financial support from developed countries to middle-income and developing countries.10
4. Accelerating road transport electrification: Technological progress and cost reduction in batteries and electric vehicles (EVs) now make it possible to drive road transport electrification far more rapidly than seemed feasible five years ago. Within the next decade, shifting to passenger EVs will be a negative cost transition, delivering savings to consumers rather than additional costs. National strategies for vehicle electrification included in the NDCs have begun to reflect this potential, but in most cases still do not reflect the size of the potential zero-cost prize. Agreement at COP26 to ban all sales of ICE light-duty vehicles by 2035, combined with city-based action to restrict the use of existing ICE vehicles beyond defined future dates, could lead to around 20% of cars on the road being electric by 2030 and deliver around 2 GtCO2/year of reductions, with an additional 0.6 GtCO2/year of savings possible from low or negative cost action to improve heavy-duty truck efficiency.
A strong agreement to commit to ending sales of light-duty ICE vehicles by 2035 at the latest is therefore a crucial COP26 priority, supported by clear targets from countries and car manufacturers.
5. Accelerating supply decarbonisation in buildings, heavy transport, and heavy industry. As the Energy Transitions Commission (ETC) showed in its Mission Possible report in November 2018, it is technically and economically feasible for even the so-called “harder to abate” sectors of the economy – such as steel, cement and chemicals, long-distance aviation and shipping – to reach net zero emissions by mid-century at a trivial cost to global economic growth and living standards. Many leading companies in these sectors have now made net zero by 2050 commitments. Until recently however, most published pathways for emission reductions in these sectors assumed a strongly convex shape, with very limited progress to 2030, followed by gradual acceleration in the 2030s. Most current NDCs therefore reflect this minimal near term ambition. The Mission Possible Partnership (MPP) is now working to define and agree sectoral pathways to 2030 and on to 2050. In some sectors these will still suggest only moderate reduction potential in the 2020s given the inherent challenges created by long lasting capital assets. But action to maximise progress could still deliver an additional reduction of around 1 GtCO2 per annum by 2030, and enable full decarbonisation of these industries between 2030-2050. The concentrated and inherently global nature of these industries makes them natural targets for internationally agreed action at COP26. Actions focused on key enabling technologies – in particular hydrogen and CCS – could support sectoral focused initiatives.
8 ETC (2021) Making Clean Electrification Possible.9 ETC (2021) Making Clean Electrification Possible.10 The PPCA encourages countries and corporates to commit to phase out coal by 2030 in the OECD and EU, and by no later than 2050 in the rest of the world.
Keeping 1.5°C Alive – Closing the Gap in the 2020s12

International agreements to accelerate electrification of parts of industry and buildings – e.g. via the deployment of heat pump and other technologies relevant to residential heating and of light industry - could also help deliver an additional 1 GtCO2/year of emissions reductions.
COP26 should aim to achieve agreements between leading coalitions of countries, companies and sectoral organisations to drive accelerated decarbonisation of the steel, cement, aviation and shipping sectors. Leading countries could also commit to accelerated electrification (e.g. via heat pumps), and scaling up clean hydrogen.
6. Energy and resource efficiency: Many past analyses have identified a major opportunity to reduce emissions by improving the energy efficiency of buildings, equipment and materials use, and through wider changes to increase overall “energy productivity” (energy use per unit of GDP) through, for instance, better-designed cities, digital technologies, and more circular production systems. However, progress has been disappointly slow and has declined in recent years, in part because it requires action by many millions of economic actors across the world. Moreover, many aspects of required policy are inherently local in nature, limiting the potential role for international agreements. But an international agreement for specific standards and regulations focused on improving the energy efficiency of new buildings could deliver 1.4 GtCO2 per year reduction by 2030, with another 1.5 GtCO2 potentially from a series of other actions (e.g. retrofits to existing buildings and improved longevity and recycling of consumer goods). Early action to encourage less carbon-intensive city design is essential in the 2020s to deliver faster progress in the 2030-40s.
Government commitments to adopt best-in-class building standards and product efficiencies should therefore be a priority at COP26.
The infographics on the following pages set out a selection of specific actions which could be taken to seize the opportunities identified and highlights potential discrete international agreements that could be used to increase ambition at COP26. A comprehensive list of actions is found at the end of this report.
Almost inevitably, agreements made at COP26 will not be sufficient in themselves to make it certain that a 1.5°C pathway can be achieved. But if COP26 can gain agreement that these are the areas for highest potential short-term action, achieve some progress on each, and put in place processes for future reinforcement of commitments over the next two years – leading to a stocktake in 2023 - it could still play a crucial role in keeping alive the potential to limit global warming to 1.5°C.
The rest of this report sets out this argument in detail, covering in turn:
• The need for faster progress in the 2020s.
• What has changed since Paris? Technologies, costs, and scientific understanding.
• Assessing the potential to go beyond NDCs: methodology and approach.
• Feasible actions to accelerate emissions reductions – 6 key categories for priority action.
• Adding it up – can we close the gap?
• Actions at and after COP26.
Keeping 1.5°C Alive – Closing the Gap in the 2020s 13


Chapter 1
The need for faster progress in the 2020s
Keeping 1.5°C Alive – Closing the Gap in the 2020s16
To date, the world has seen man-made warming of around 1.1°C above preindustrial levels and, as the recent IPCC report warns, is already seeing the impact of climate change.11 To avoid severe harm to human welfare, global warming should ideally be limited to 1.5°C and the probability of exceeding 2°C kept very small (e.g. less than 10%). This will require not only reducing carbon dioxide emissions to around zero by mid-century, but reducing them by 40-50% by 2030, while also cutting methane emissions by about 40%. National commitments already made, or likely to be made by COP26, fall well short of this requirement. Estimates suggest that current submitted NDCs, together with legally binding net zero commitments, put the world on a trajectory to 2.4°C of warming by the end of the century.12
The carbon budget and methane emission reductions
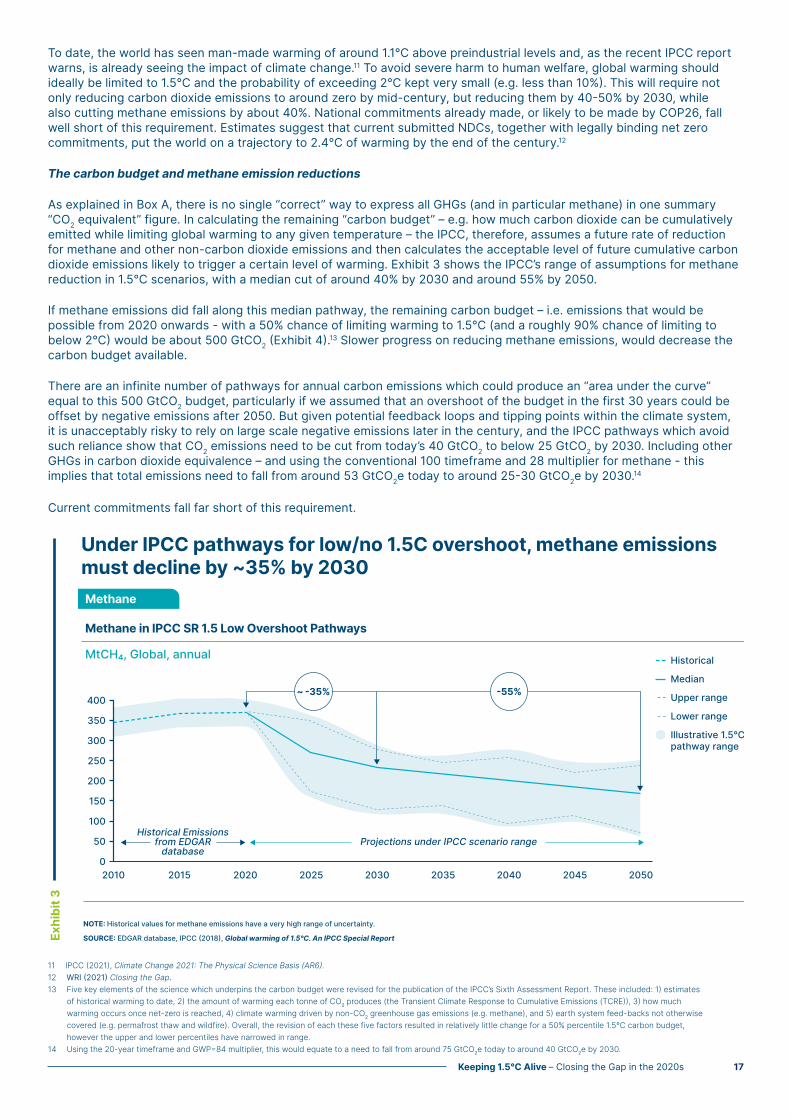
As explained in Box A, there is no single “correct” way to express all GHGs (and in particular methane) in one summary “CO2 equivalent” figure. In calculating the remaining “carbon budget” – e.g. how much carbon dioxide can be cumulatively emitted while limiting global warming to any given temperature – the IPCC, therefore, assumes a future rate of reduction for methane and other non-carbon dioxide emissions and then calculates the acceptable level of future cumulative carbon dioxide emissions likely to trigger a certain level of warming. Exhibit 3 shows the IPCC’s range of assumptions for methane reduction in 1.5°C scenarios, with a median cut of around 40% by 2030 and around 55% by 2050.
If methane emissions did fall along this median pathway, the remaining carbon budget – i.e. emissions that would be possible from 2020 onwards - with a 50% chance of limiting warming to 1.5°C (and a roughly 90% chance of limiting to below 2°C) would be about 500 GtCO2 (Exhibit 4).13 Slower progress on reducing methane emissions, would decrease the carbon budget available.
There are an infinite number of pathways for annual carbon emissions which could produce an “area under the curve” equal to this 500 GtCO2 budget, particularly if we assumed that an overshoot of the budget in the first 30 years could be offset by negative emissions after 2050. But given potential feedback loops and tipping points within the climate system, it is unacceptably risky to rely on large scale negative emissions later in the century, and the IPCC pathways which avoid such reliance show that CO2 emissions need to be cut from today’s 40 GtCO2 to below 25 GtCO2 by 2030. Including other GHGs in carbon dioxide equivalence – and using the conventional 100 timeframe and 28 multiplier for methane - this implies that total emissions need to fall from around 53 GtCO2e today to around 25-30 GtCO2e by 2030.14
Current commitments fall far short of this requirement.
11 IPCC (2021), Climate Change 2021: The Physical Science Basis (AR6).12 WRI (2021) Closing the Gap. 13 Five key elements of the science which underpins the carbon budget were revised for the publication of the IPCC’s Sixth Assessment Report. These included: 1) estimates
of historical warming to date, 2) the amount of warming each tonne of CO2 produces (the Transient Climate Response to Cumulative Emissions (TCRE)), 3) how much warming occurs once net-zero is reached, 4) climate warming driven by non-CO2 greenhouse gas emissions (e.g. methane), and 5) earth system feed-backs not otherwise covered (e.g. permafrost thaw and wildfire). Overall, the revision of each these five factors resulted in relatively little change for a 50% percentile 1.5°C carbon budget, however the upper and lower percentiles have narrowed in range.
14 Using the 20-year timeframe and GWP=84 multiplier, this would equate to a need to fall from around 75 GtCO2e today to around 40 GtCO2e by 2030.
Exhibit 3
Methane in IPCC SR 1.5 Low Overshoot Pathways
Methane
MtCH₄, Global, annual
Under IPCC pathways for low/no 1.5C overshoot, methane emissions must decline by ~35% by 2030
0
50
100
150
200
250
2010 2015 2020 2025 2030 2035 2040 2045 2050
300
400
350
Median
Projections under IPCC scenario rangeHistorical Emissions
from EDGARdatabase
Upper range
Historical
Lower range
Illustrative 1.5°Cpathway range
NOTE: Historical values for methane emissions have a very high range of uncertainty.
SOURCE: EDGAR database, IPCC (2018), Global warming of 1.5°C. An IPCC Special Report
~ -35% -55%
Keeping 1.5°C Alive – Closing the Gap in the 2020s 17

Current pledges relative to need.
An increasing number of countries have set targets to achieve zero emissions at, or close to mid-century. As of September 2021, 55 countries covering 70% of global CO2 emissions (and 70% of global GDP) have made net-zero commitments, including China, the United States, and the European Union (Exhibit 5).15 Momentum has also grown across the industry, with over 3000 businesses and 173 largest investors committing to achieve zero emissions by 2050.16
Short-term ambitions out to 2030 are reflected in the NDCs which are submitted under the Paris agreement. These NDCs typically set targets for emissions reduction (or reductions in carbon intensity) and describe measures and policies which national governments will take to meet them. Under the Paris agreement framework, NDCs should be updated every five years, with the objective being to establish a “ratchet mechanism” in which targets can only be tightened.
This ratchet mechanism has led to some increase in ambition, with further tightening of emission reduction targets compared with those submitted immediately after Paris (Table 1). Since September 2020, new NDCs have been submitted by over 115 countries while 48 countries have stated their intention to enhance ambition or action in a new or updated NDC. Estimates from Climate Action Tracker suggest that the aggregate impact of these new commitments could reduce 2030 emissions by an additional 2-5 Gt of CO2e equivalent below the trajectory implied by current policies (Exhibit 6).17
However, this still leaves a gap of about 20 GtCO2e compared with the pathway required to deliver a 50% probability of limiting global warming to 1.5°C.
Further GHG reductions – in particular for carbon dioxide and methane – must therefore be achieved if we are to close the gap.
15 ECIU (2021) Net Zero Tracker; IEA (2021) Net Zero by 2050: A Roadmap for the Global Energy Sector.16 3067 businesses and 173 of the biggest investors have signed up to the Climate Ambition Alliance committed to achieving net zero by 2050 at the latest. See UNFCCC
(2021) Race to Net Zero.17 Climate Action Tracker (2021) CAT Emissions Gap.
Exhibit 4
To have a 50% chance to remain <1.5°C warming, IPCC estimates the remaining carbon budget to be ~500 Gt CO from 2020
Global emissions pathway characteristics in the IPCC 1.5ºC reportGt CO/year
0
10
20
30
40
50
2010 20 30 40 50 60 70 80 90 2100
-10
-20
The IPCC generated a large number of 1.5ºC scenarios, out of which they selected four illustrative pathways (larger lines on the graph);
In pathways limiting global warming to 1.5ºC with no or limited overshoot ●, as well as pathways with a high overshoot ●, CO emissions are reduced to net-zero globally by around 2050.
500 Gt CO from 2020
50%chance
850 Gt CO from 2020
1350 Gt CO from 2020
~90%chance
67%chance
CH and NO reductions correspondingto chosen carbon budget
400 Gt CO from 2020
700 Gt CO from 2020
1150 Gt CO from 2020
CH reductionby 2050
~50% (42%-76% range)
NO reductionby 2050
~30% (-25% - 48% range)
N/A
N/A
500 Gt CO from 2020
<1.5ºC
<1.7ºC
<2ºC
Chosen carbon budget in this report
SOURCE: IPCC (2021), Climate Change 2021: The Physical Science Basis (AR6).
SOURCE: IPCC (2018), Global Warming of 1.5°C
Keeping 1.5°C Alive – Closing the Gap in the 2020s18

Exhibit 5
In 2021, more than 70% of all global emissions were covered by aform of net-zero target
20
30
40
50
60
2015 2016 2017 2018 2019 2020 2021
10
0
20%
30%
40%
50%
80%
70%
60%
10%
0%
Countries with pledges
Year
Acceleration in net-zero commitments
Net-zero targets account for around 70% of global GDP
15 countries have made their net-zero target a legal obligation
•
•
•
In law Proposed Global CO covered (right axis)In policy documents
SOURCE: IEA (2021), Net Zero by 2050, Energy & Climate Intelligence Unit (2021), Net-Zero Emissions Race 2021 Scorecard.
Keeping 1.5°C Alive – Closing the Gap in the 2020s 19

Table 1: NDC commitments for key countries
Country (and % of current global GHG emissions)
2016 NDC Updated NDC 2020/21 NDC coverage Detail on sectoral coverage
EU (7.5%) At least 40% domestic reduction in GHG by 2030 compared to 1990.
NDC: Commits to the net domestic reduction of at least 55% in GHG emissions by 2030 compared to 1990.
Domestic policy: Net Zero target for 2050.
Sector coverage is economy-wide including LULUCF. GHG target covers all emissions, including methane.
Targets set for certain sectors (e.g. renewable energy, energy efficiency). International Methane Emissions Observatory (IMEO) set up to monitor CH4 emissions using company data, satellite tech and scientific studies.
USA (12.7%) A 26-28% GHG emissions reductions below 2005 by 2025 (incl. LULUCF).
NDC: 50-52% GHG emissions reductions below 2005 by 2030 (incl. LULUCF).
Domestic policy: Net Zero target for 2050.
Target includes LULUCF and covers emissions from all sectors and GHGs, including methane.
Climate plan covers full decarbonisation of power sector by 2035. US President Biden has reinstated methane regulations, and established a cooperative forum with Canada, Norway, Qatar and Saudi Arabia to create methane strategies.
China (26.1%)
Aim to have carbon emissions peak before 203 and to lower carbon dioxide emissions per unit of GDP by 60-65% from the 2005 level.
NDC: No formal updated NDC has been submitted.
Domestic policy: China has proposed to lower carbon dioxide emissions per unit of GDP by over 65% from the 2005 level.
Separate target announced in 2020 for net-zero GHG by 2060 (excl. LULUCF).
Target includes LULUCF forest stock but no emissions target, and no emissions target for methane.
Specific targets on carbon dioxide emissions by GDP, share of non-fossil fuels in primary energy consumption, forest stock and installed capacity of wind and solar power all increased in updated NDC.
India (7.1%) 2030 unconditional target of 33-35% below 2005 emissions intensity of GDP by 2030, and non-fossil share of cumulative power generation capacity 40%. All excluding LULUCF. LULUCF specific target additional carbon sink of 2.5-3 GtCO2e by 2030.
NDC: No formal updated NDC has been submitted.
Domestic policy: Target of 450 GW of renewable electricity by 2030. National hydrogen strategy.
Did not specify the coverage of GHG gases and sectoral coverage in metrics of the emissions intensity target in 2015 NDC.
Targets set for full electrification for households and coal power development.
Japan (2.5%)
2030 unconditional target of 26% below 2013 by 2030 for GHG emissions reductions. Long-term goal of 80% GHG emission reduction by 2050 (baseline not specified).
NDC: resubmitted without change in 2020.
Domestic policy: A new 2030 GHG emissions reduction target was announced revising 26% below 2013 levels to a 46% reduction by 2030, working towards a 50% reduction.
Net Zero target for 2050.
Economy-wide coverage including LULUCF. GHG emissions target include methane.
Specific coverage of road transport sector in targets. Some sectoral roadmaps.
Sources: Climate Action Tracker (2021) Countries; WRI (2021) Climate Watch: Historical GHG Emissions.
Keeping 1.5°C Alive – Closing the Gap in the 2020s20

Exhibit 6
Currently pledged NDCs are insufficient to stay on 1.5°C path – remaining “emissions gap” of ~20-23 GtCOe by 2030 (Climate Action Tracker)
Global GHG Emissions: emissions based on pledged and current policies
Gt CO2e , Global, annual
0
10
20
30
40
50
2000 2005 2010 2015 2020 2025 2030 2035 2040 2045 2050 2055 2060
60
70
Current Policy Projections (BAU)
100-year, 28 multiplier for methane emissions
Pledges and Targets (NDC) - May 2021 - HighPledges and Targets (NDC) - May 2021 - Low1.5°C Compatible
Note: CAT estimates of the emissions gap are slightly lower than estimates cited by the UNEP Emissions Gap report, due to differing assumptions taken across baselines (e.g. factors such as COVID-19 adjustments in baseline emissions trajectories, range of uncertainty of NDCs, and range of IPCC’s 1.5°C compatible scenarios. See Technical Annex for further detail.
NDC contribution ~2-5 GtCO2e
2030 Emissions gap ~20-23
GtCO2e
NOTES: ¹ Current Policies Scenario is based on implemented policies and country baseline trajectories from government and international sources. The Pledges and Targets Scenariosrepresents a quantification of country-by-country NDC commitments. The “1.5°C compatible“ Scenario is defined as the median of pathways that limit global warming to 1.5°C, or below,throughout the 21st century with no or limited (<0.1°C) overshoot.
SOURCE: Climate Action Tracker, 2021.
Keeping 1.5°C Alive – Closing the Gap in the 2020s 21

Chapter 2
What has changed since Paris? Technologies, costs, and scientific understanding
Keeping 1.5°C Alive – Closing the Gap in the 2020s22

Many of the options to reduce emissions discussed in this report were already known at the time of the Paris Agreement and in some cases informed the initial NDCs submitted. Since then, however, the need for rapid emissions reductions has become more apparent, and progress in developing technologies and reducing costs has increased the potential for rapid low-cost reductions. In particular;
• Technology and cost developments have greatly increased the potential for rapid emission reductions in the power sector, in road transport, and parts of heavy industry (e.g. via electrification or the use of hydrogen).
• Improving scientific understanding has shown the vital need for forceful action on deforestation and methane emissions.
Technological progress and cost reductions
Global emissions have not yet started to fall. But technology and cost developments – in part driven by the momentum which the 2015 Paris Agreement helped create – have now made possible far more rapid and low-cost reductions than seemed feasible at Paris.18
• Technological progress and large-scale deployment has driven dramatic falls in the cost of wind and solar power (Exhibit 7), as a result, renewables are now the cheapest way to generate electricity in most regions, and are increasingly cost-competitive with fossil fuel-based generation on a total system cost basis.19
• Collapsing battery costs and improved energy densities have made battery-electric light-duty vehicles increasingly competitive with ICE vehicles, with further major cost reductions and performance improvements certain to occur (Exhibit 8).20
• Dramatic reductions in the cost of electrolysers are now a prospect, making possible significant cuts in the cost of green hydrogen production.21
Opportunities for the rapid and cost-effective decarbonisation of power systems and light-duty road transport have greatly increased as a result. Furthermore, work by the ETC and the Mission Possible Partnership has shown that the supposedly harder-to-abate heavy industry sectors (steel, cement, and chemicals) and long-distance transport (shipping and aviation) could all be decarbonised by 2050 at a trivial cost to global growth or living standards.22
These developments create a new context that is not yet fully reflected in countries’ strategies and NDCs. Together they make possible far more rapid emission reductions in the 2020s than were previously envisaged, with consequent earlier and sharper reductions in coal, oil, and gas use.
National and international strategies should therefore seize this opportunity, driving further technological progress, scale deployment, and faster emissions reductions. Major reports by the ETC have set out the actions required to ensure that progress is fast enough to deliver net-zero emissions by 2050.23
The potential for more rapid progress should also be matched by an increased ambition for the 2020s. Three of the priorities identified in this report – faster power sector decarbonisation, road transport electrification, and supply decarbonisation of other end uses – respond to this opportunity. Furthermore, the development and commercialisation in the 2020s of zero-carbon energy technologies for energy-intensive sectors driven will be vital to ensure deep decarbonisation in the 2030s and 2040s.
18 See SYSTEMIQ (2020), The Paris Effect: How The Climate Agreement is Reshaping the Global Economy.19 See ETC (2021) Making Clean Electrification Possible. 20 See ETC (2021) Making Clean Electrification Possible.21 See ETC (2021) Making the Hydrogen Economy Possible.22 ETC (2018) Mission Possible, ETC (2020) Making Mission Possible, Mission Possible Partnership.23 ETC (2020), Making Mission Possible; ETC (2021) Making Clean Electrification Possible; ETC (2021) Making the Hydrogen Economy Possible.
Keeping 1.5°C Alive – Closing the Gap in the 2020s 23

Exhibit 7
Exhibit 8
Wind and solar LCOE have dramatically decreased in the last 10 yearswith latest lowest auction prices for solar PV below $20/MWh
PV and wind LCOE global benchmarks
LCOE, $/MWh, 2020 realLowest auctions prices
150
200
250
300
350
400
2010 2012 2014 2016 2018 2020 2022
100
50
0
Fixed-axis PV
Solar PV
Offshorewind
Onshorewind
346
82
4841
39
312
213
103
Tracking PVOnshore windOffshore wind
• Portugal: $13.2/MWh (lowest offer) (Aug 2020)• India: $38/MWh for solar + batteries delivering 80% of hours per year (June 2020)• Abu Dhabi: $13.5/MWh (lowest offer) for 2 GW (April 2020)• Qatar: $15.7/MWh for 800 MW (Jan 2020)• Saudi arabia: $16.9/MWh for 900 MW (2019)• Portugal: $16/MWh for 1.4 GW (July 2019)
• Chile: $32.5/MWh for 240MW (mixed with solar and geothermal)• US: average wind price at $20/MWh (2017)• Mexico: $20.6/MWh for 250 MW (2017)
• UK: $51/MWh (£39.7/MWh) for 6 GW (2019)• France: $48/MWh for 600 GW (2019)
LEFT HAND SIDE: The global benchmark is a country weighted-average using the latest annual capacity additions.
RIGHT HAND SIDE: Economics of auction prices may be favoured by local tax treatments and other implicit subsidies.
SOURCE: Press research; BloombergNEF (2021) 1H 2021 LCOE Update.
Battery prices have decreased annually by 19% in the last decade and are expected to fall below US$100/kWh by 2024
Lithium-ion battery pack prices - Observed
Real 2020 $/kWh
Battery prices - Outlook
Predicted
1,191
924
726668
592
384295
220181 157 137
92 58 45
2010 2011 2012 2013 2014 2015 2016 2017 2018 2019 2020 2024 2030 2035
-19%
-19%
-8%-5%
Compound annualgrowth rate
SOURCE: Bloomberg New Energy Finance Lithium-ion Battery Price survey (2020).
Keeping 1.5°C Alive – Closing the Gap in the 2020s24

Deforestation and methane emissions – improved scientific understanding
New technologies – in particular synthetic meats – may soon make it possible to dramatically reduce the impact of food production on the natural environment and climate. But these developments are at an early stage, and the technologies relevant to nature-based solutions have evolved slowly rather than dramatically over the last five years. However, increasing scientific understanding makes rapid action to cut deforestation and to start reforestation even more vital than 5 years ago.
In particular:
• The IPCC Special Report on 1.5°C, published in Autumn 2018, made a compelling case for seeking to limit global warming to 1.5°C. This would be impossible without a rapid end to deforestation alongside significant carbon removals delivered by nature-based solutions.
• Latest deforestation trends and scientific analysis has increased the risk that major tropical rainforest could switch from being a net sink to a net source of carbon dioxide emissions.24
Meanwhile, trends in methane emissions and scientific analysis have greatly increased the importance of cutting methane emissions fast. The IPCC AR6 report estimates that methane emissions have been responsible for 0.5°C of warming since the pre-industrial era, compared with 0.8°C for CO2 (with some offsetting reductions resulting from aerosol and other gases).25 Estimates of total methane emissions are inherently less certain than for carbon dioxide (illustrating the vital importance of more effective measurement) but methane emissions have almost certainly risen by around 10% over the last 20 years.26 As the world continues to warm, and the adverse impacts of climate challenges become ever more apparent, it is vital to focus on short-term opportunities to reduce forcing effects and mitigate temperature increases. Cutting methane emissions is the largest such opportunity.
24 See, for example, Gatti et al (2021) Amazonia as a carbon source linked to deforestation and climate change.25 Figure SPM.2 in IPCC (2021) Summary for Policymakers in Climate Change 2021: The Physical Science Basis (AR6).26 NOAA (2021) Trends in CH4.
Keeping 1.5°C Alive – Closing the Gap in the 2020s 25

Chapter 3
Assessing the potential to go beyond NDCs: Methodology and approach
Keeping 1.5°C Alive – Closing the Gap in the 2020s26

This report aims to identify actions that could deliver significant reductions in emissions in the 2020s and which are not already included in NDCs. To do this we have:
• Used the IEA’s Net Zero pathway report, as well as a number of other analyses as a starting point;27
• Applied a set of criteria to assess the feasibility of implementation;
• Estimated how far the identified initiatives are already included within NDCs.
The IEA’s Net Zero report
In May 2021 the IEA published a landmark report on how to achieve net-zero by 2050. This report aimed to describe the emissions pathway required to meet a carbon budget compatible with a 1.5°C objective, without significant reliance on negative emissions after 2050 or on nature-based offsets in the next 30 years.
It sets out how the world could achieve a 38% reduction in CO2 emissions by 2030, with near-total decarbonisation of the global power system by 2040 and the application of electricity, hydrogen, bioenergy, and CCS to decarbonise the road transport, buildings, and the so-called hard-to-abate sectors (e.g. heavy industry, aviation, shipping). It also identified opportunities for energy efficiency improvement and consumer behaviour change, which account for 18% and 7% respectively of the emissions reductions between 2020-30; behaviour change is then responsible for a higher share (18%) of subsequent emission reductions between 2030 and 2050 (Exhibit 9).
All the reductions described by the IEA for the 2020s are clearly technically possible using technologies that are already available for commercial deployment.
Additional assessment criteria
The IEA’s recent report is an excellent starting point for identifying technically feasible emission reductions in the 2020s. In this report we draw on the IEA work but, in addition, apply three further sets of criteria to assess how feasible actual implementation will be:
27 See Technical Annex for full methodology and external references.
Exhibit 9
The IEA has developed a scenario driven by the need to reduce CO emissions on a path compatible with 1.5ºC without the use of nature-based offsets
IEA NZS; Pathway to Net Zero
Gt CO , Global, annual
IEA NZS: Emissions reductions by mitigation measure, 2020-2050
15
20
25
30
35
40 45
30
15
2020 2025 2030 2035 2040 2045 20502020 2030 2050
10
5
0
-5
Measures
Measures
Gt CO
-38%+24%
-50%
+51%
-100%
21.1
6.3
Transport Industry Electricity & Heat
OtherBuildings
Activity
Migration Measures
Behaviour andavoided demand
Energy efficiency
Hydrogen-based
Electrification
Bioenergy
Wind and solar
Other fuel shifts
CCUS
SOURCE: IEA (2021), Net Zero by 2050: A Roadmap for the Global Energy Sector
Keeping 1.5°C Alive – Closing the Gap in the 2020s 27

• Is the action either potentially cost-saving/cost-competitive? And if not, is the additional cost incurred one that could easily be absorbed by rich developed countries, whether in their domestic economy or through climate finance support to low-income developing countries?
• Is the action politically attractive for other reasons? For instance, because of co-benefits such as reduced local air pollution or job creation.
• Could the action be accelerated through an initiative or agreement launched at or after COP26? For example, can the action be driven by a small number of leading countries (rather than requiring comprehensive international agreements) and/or by a relatively small number of companies: are there already existing initiatives that could be leveraged and reinforced?
Adjusting for existing commitments in NDCs
To assess the potential for additional reductions in the 2020s beyond current commitments, we need to avoid double counting between the actions we have identified, and the abatement already included in current NDCs.
However, quantifying what is included in NDCs for each sets of actions is challenging. NDCs vary greatly in their detail and specificity and are not submitted in a consistent format with an easily quantifiable link between emissions targets and sectoral actions. Indeed, a 2016 ETC assessment of the NDCs submitted under the 2015 Paris Agreement suggested that 60% of the abatement in the NDCs was unspecified, with no indication of how the emissions reduction target would be achieved.28
To adjust for the potential already included in NDCs across our six groups of action, we, therefore, make a high-level assessment of the likely overlap of current NDCs for each action we have quantified (high overlap; moderate overlap; low overlap), drawing on a literature review of NDC commitments.29 We then scale down the total feasible potential for each sector based on the assessed overlap with current NDCs. This ensures that the additional actions we identify do not include the average of 3.5 GtCO2e included in current NDCs (Exhibit 10).
28 Energy Transitions Commission (2016), Pathways from Paris, Assessing the INDC Opportunity.29 See Technical Annex for further detail on our scaling down methodology.
Critical actions across six different sectors: 6 key steps
Total potential by 2030
Acceleratingemissions reductions
from methane
Nature Based Solutions(including carbon
removals)
Decarbonisingthe power sector
Decarbonisingroad transport
Supply-sidedecarbonisationin other sectors
Energyand resource efficiency
TOTAL
Total feasible potential by 2030
Assessment ofoverlap with NDCs
NDC overlapscaling
NDC overlapreduction
Additional feasiblepotential by 2030beyond NDCs
1 2 3 4 5 6
~4.2 [12.6] Gt COe
4 [11] Gt Gt COe
Moderate ~ -10-15% -0.5 [1.5] Gt COe
3.5 [11]Gt COe
~11 Gt CO 7.6 Gt CO Moderate ~ -10-15% -0.9 Gt CO 6. 6 Gt CO
~8 Gt CO 4.6 Gt CO High ~ -20-30% -1.2 Gt CO 3.5 Gt CO
~2.8 Gt CO 2.6 Gt CO Moderate ~ -10-15% -0.3 Gt CO 2.3 Gt CO
~3 Gt CO 2.2 Gt CO Low ~ -5% -0.1 Gt CO 2.1 Gt CO
~4.5 Gt CO 2.9 Gt CO Moderate ~ -10-15% -0.4 Gt CO 2.5 Gt CO
~33 Gt CO ~24 Gt CO -3.5 Gt CO 21 Gt COe
NOTE: Methane emissions in [ ] represent equivalence to carbon dioxide under a 20-year timeframe, assuming GWP=28.Exhibit 10
Keeping 1.5°C Alive – Closing the Gap in the 2020s28

Keeping 1.5°C Alive – Closing the Gap in the 2020s 29

Chapter 4
Feasible actions to accelerate emissions reductions – 6 key categories for priority action
Keeping 1.5°C Alive – Closing the Gap in the 2020s30

Using the criteria described in section 3, we have identified the potential to reduce emissions faster than NDC commitments during the 2020s. This section sets out the detailed findings, starting with reducing methane emissions and following with five key opportunities to accelerate carbon dioxide reductions.
4.1 Significant and rapid reductions in methane emissions
The IPCC AR6 report estimates that methane emissions have been responsible for 0.5°C of warming since the pre-industrial period, compared with 0.8°C produced by carbon.30 Since methane emissions are short-lived in the atmosphere, cutting methane emissions is the quickest way to reduce global temperature, offsetting the impact of the growing stock of carbon in the atmosphere. Though cutting methane emissions is not a substitute for action on CO2. In general, there has been insufficient focus on the need to reduce methane emissions, many NDCs pay little attention to it, and over the last 10 years, methane emissions have continued to rise.
A range of initiatives has recently been developed to address methane, which includes the European Union’s 2020 Methane Strategy, state-level targets set by New York and California, and industry-led efforts such as upstream oil and gas methane intensity targets from the OGCI, reporting frameworks such as the Oil and Gas Methane Partnership (OGMP), and certification standards such as MiQ.31 In September 2021, the Global Methane Pledge was launched by the US and the EU, who were joined by other large emitters in an agreement to reduce methane emissions by 30% by 2030. However, ETC analysis in this section suggests potential to achieve a 40% reduction, particularly in the largest emitting countries, with 60% reductions in fossil fuel emissions and 30% in the waste and agricultural sectors.
Cutting methane emissions dramatically by 2030 should therefore be a high priority at and after COP26.
In 2019, global methane emissions were estimated to be around 375 MtCH4 (equivalent to 31 GtCO2e if a 20-year GWP factor is applied, and 11 GtCO2e with a 100-year view), with around 135 MtCH4 from fuel production, transport and use, around 80 MtCH4 from waste management, and around 160 MtCH4 from the agriculture sector.32 There are opportunities to cut all categories of these emissions, with a distinction between:
• Fossil fuel derived emissions, where there are low-cost opportunities to cut emissions by at least 60% by 2030.
• Waste and agricultural emissions, where dramatic early reductions will be more difficult due to the very large number of producers and consumers involved, but where COP26 should still seek to achieve consensus around the necessity and possibility of significant reductions, reaching at least a 30% reduction by 2030.
Reducing methane emissions in the fossil fuel supply chain
Oil, gas, and coal are together responsible for around 120 MtCH4, with 80 MtCH4 in oil and gas and 40 MtCH4 in coal.33 In the oil and gas sector, emissions are highest in Russia, the US, and a set of other large oil and gas producing countries, followed by a large tail of countries with small emissions volumes together accounting for around 25% of the oil and gas total (Exhibit 11). Coal emissions are concentrated in key mining locations, with over 50% of coal mine methane emissions coming from China.34
30 IPCC (2021) Climate Change 2021: The Physical Science Basis (AR6).31 MiQ is a not-for-profit initiative that has designed a gas certification system which introduces natural gas to the market that has been differentiated based on methane
emissions during production.32 EDGAR Database.33 IEA (2020) Methane Tracker. Additional non-waste and non-agricultural methane emissions come from other energy sources such as biomass.34 UN (2021) Global Methane Assessment: Benefits and Costs of Mitigating Methane Emissions; Global Methane Initiative (2015) Coal Mine Methane Country Profile: China.
Keeping 1.5°C Alive – Closing the Gap in the 2020s 31
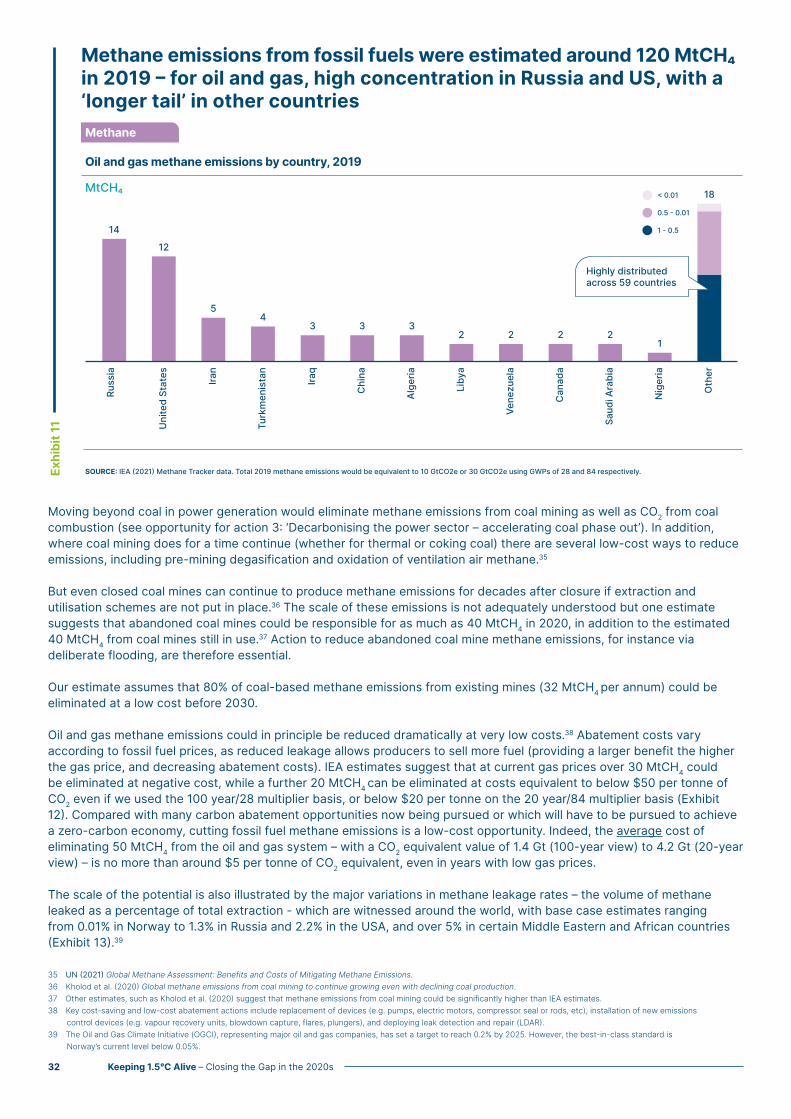
Moving beyond coal in power generation would eliminate methane emissions from coal mining as well as CO2 from coal combustion (see opportunity for action 3: ‘Decarbonising the power sector – accelerating coal phase out’). In addition, where coal mining does for a time continue (whether for thermal or coking coal) there are several low-cost ways to reduce emissions, including pre-mining degasification and oxidation of ventilation air methane.35
But even closed coal mines can continue to produce methane emissions for decades after closure if extraction and utilisation schemes are not put in place.36 The scale of these emissions is not adequately understood but one estimate suggests that abandoned coal mines could be responsible for as much as 40 MtCH4 in 2020, in addition to the estimated 40 MtCH4 from coal mines still in use.37 Action to reduce abandoned coal mine methane emissions, for instance via deliberate flooding, are therefore essential.
Our estimate assumes that 80% of coal-based methane emissions from existing mines (32 MtCH4 per annum) could be eliminated at a low cost before 2030.
Oil and gas methane emissions could in principle be reduced dramatically at very low costs.38 Abatement costs vary according to fossil fuel prices, as reduced leakage allows producers to sell more fuel (providing a larger benefit the higher the gas price, and decreasing abatement costs). IEA estimates suggest that at current gas prices over 30 MtCH4 could be eliminated at negative cost, while a further 20 MtCH4 can be eliminated at costs equivalent to below $50 per tonne of CO2 even if we used the 100 year/28 multiplier basis, or below $20 per tonne on the 20 year/84 multiplier basis (Exhibit 12). Compared with many carbon abatement opportunities now being pursued or which will have to be pursued to achieve a zero-carbon economy, cutting fossil fuel methane emissions is a low-cost opportunity. Indeed, the average cost of eliminating 50 MtCH4 from the oil and gas system – with a CO2 equivalent value of 1.4 Gt (100-year view) to 4.2 Gt (20-year view) – is no more than around $5 per tonne of CO2 equivalent, even in years with low gas prices.
The scale of the potential is also illustrated by the major variations in methane leakage rates – the volume of methane leaked as a percentage of total extraction - which are witnessed around the world, with base case estimates ranging from 0.01% in Norway to 1.3% in Russia and 2.2% in the USA, and over 5% in certain Middle Eastern and African countries (Exhibit 13).39
35 UN (2021) Global Methane Assessment: Benefits and Costs of Mitigating Methane Emissions.36 Kholod et al. (2020) Global methane emissions from coal mining to continue growing even with declining coal production. 37 Other estimates, such as Kholod et al. (2020) suggest that methane emissions from coal mining could be significantly higher than IEA estimates. 38 Key cost-saving and low-cost abatement actions include replacement of devices (e.g. pumps, electric motors, compressor seal or rods, etc), installation of new emissions
control devices (e.g. vapour recovery units, blowdown capture, flares, plungers), and deploying leak detection and repair (LDAR).39 The Oil and Gas Climate Initiative (OGCI), representing major oil and gas companies, has set a target to reach 0.2% by 2025. However, the best-in-class standard is
Norway’s current level below 0.05%.
Exhibit 11
Methane emissions from fossil fuels were estimated around 120 MtCHin 2019 – for oil and gas, high concentration in Russia and US, with a‘longer tail’ in other countries
Oil and gas methane emissions by country, 2019
Methane
MtCH
14
Russia
United States Iran
Turkmenistan
Iraq
China
Algeria
Libya
Venezuela
Canada
Saudi Arabia
Nigeria
Other
12
54
3 3 32 2 2 2
1
18< 0.01
0.5 - 0.01
1 - 0.5
Highly distributed across 59 countries
SOURCE: IEA (2021) Methane Tracker data. Total 2019 methane emissions would be equivalent to 10 GtCO2e or 30 GtCO2e using GWPs of 28 and 84 respectively.
Keeping 1.5°C Alive – Closing the Gap in the 2020s32
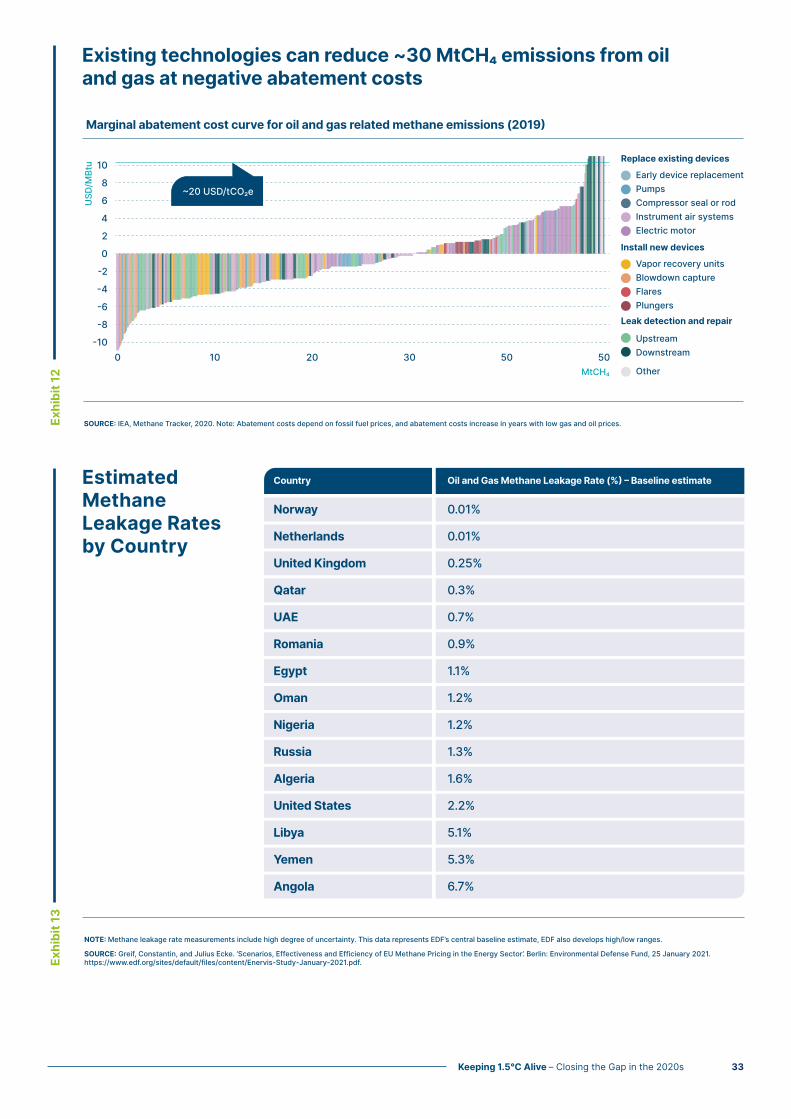
Exhibit 12
Exhibit 13
Existing technologies can reduce ~30 MtCH emissions from oiland gas at negative abatement costs
Marginal abatement cost curve for oil and gas related methane emissions (2019)
-4
-2
0
4
-6
-8
-100 10 20 30 50 50
6
10
USD/MBtu
MtCH
8
Replace existing devices
Early device replacementPumpsCompressor seal or rodInstrument air systems
Install new devices
Vapor recovery unitsBlowdown capture
Leak detection and repair
UpstreamDownstream
Other
FlaresPlungers
Electric motor
SOURCE: IEA, Methane Tracker, 2020. Note: Abatement costs depend on fossil fuel prices, and abatement costs increase in years with low gas and oil prices.
~20 USD/tCOe
2
Estimated Methane Leakage Rates by Country
Country
Norway
Oil and Gas Methane Leakage Rate (%) – Baseline estimate
0.01%
Netherlands 0.01%
United Kingdom 0.25%
Qatar 0.3%
UAE 0.7%
Romania 0.9%
Egypt 1.1%
Oman 1.2%
Nigeria 1.2%
Russia 1.3%
Algeria 1.6%
United States 2.2%
Libya 5.1%
Yemen 5.3%
Angola 6.7%
NOTE: Methane leakage rate measurements include high degree of uncertainty. This data represents EDF’s central baseline estimate, EDF also develops high/low ranges.
SOURCE: Greif, Constantin, and Julius Ecke. ‘Scenarios, Effectiveness and Efficiency of EU Methane Pricing in the Energy Sector’. Berlin: Environmental Defense Fund, 25 January 2021.https://www.edf.org/sites/default/files/content/Enervis-Study-January-2021.pdf.
Keeping 1.5°C Alive – Closing the Gap in the 2020s 33

The detailed actions to reduce these emissions will need to be taken by oil and gas companies across the world, with the largest IOCs and NOCs playing a major role, applying the wide range of technical options which the IEA has identified. However, forceful action will also require clear monitoring and detection of methane leaks. Here international satellites can play an increasingly effective role, and strong national regulations should be introduced to specify maximum acceptable leak rates and apply large fines for excess leaks. Certification schemes should be introduced to enable customers to assess the full climate impact of their oil or gas consumption.
Some of these priorities are already being pursued by existing initiatives, but COP26 could play a major role in gaining global consensus around the need and potential for forceful action, aligned around a global target of a 60% reduction by 2030, supported by internationally agreed mechanisms for monitoring and national reporting which will create incentives for national and corporate action.
Exhibit 14 sets out our scenario for potential methane fossil fuel emission reductions, with 80 MtCH4 eliminated by 2030, which would be equivalent to 2.2 GtCO2 (100 year view) – 6.7 GtCO2 (20 year view) of emissions reductions. 97% of country NDCs do cover methane emissions to some degree, and 13 countries, including Russia and Canada, have specifically set methane reduction targets, but the assessed overlap with current NDCs is still small, leaving an estimated additional potential of ~70 MtCH4 by 2030. 40
Exhibit 15 describes the specific actions required.
40 UNFCCC (Feb 2021) Nationally Determined Contributions under the Paris Agreement: Synthesis report by the Secretariat.
Exhibit 14
Methane
Global CH₄ emissions reductions vs BAU scenario, 2030
Overlapwith NDCs
Totalfeasible potential
Total additional potential
~ 80 MtCH₄~2.2
(100-year)-6.7
(20-year) GtCO₂e
Feasibility assessment
Existing voluntary and regulatory initiativesKey countries2/3 no cost, 1/3 additional cost – can affordESG pressure on oil and gas producers from key bloc buyers (e.g. EU) and financial sectorMonitoring potential
Existing voluntary initiativesReductions achieved with low cost solutionsSome ESG pressure on oil and gas producers from key bloc buyers and financial sectorMonitoring potential
Higher costLower buyer pressureLower ESG pressure on producers (e,g, National Oil companies)
Low cost and driven by coal phase outConcentrated in key countries (China)Monitoring potential
✓✓✓✓
✓
✓✓✓ ✓
•••
✓✓✓
~ 71 MtCH₄~1.9
(100-year)- 6 (20-year) GtCO₂e
0 10 20 30 40 50 60 70 80 90 100
22
NDC overlap assessment:
25
12
32
MtCH₄, Global, annual
Likely some overlap with existing NDC commitments
NOTE: Range for methane emissions illustrates CO₂ equivalence using GWPs of 28 and 84.
SOURCE: Expert interviews, IEA. UN (2021) Global Methane Assessment: Benefits and Costs of Mitigating Methane Emissions.
Moderate (~10-15% scale down)
Shaded / green – higher feasibility Unshaded / yellow – lower feasibility
Methane (Fossil): 2030 emissions reduction scope and feasibility
75% total reductionin Russia, US, China,Canada
Up to 50% (cost-savingor low-cost reduction)in other countries
80% low-costreduction in coal mining emissions
Additional 25%reduction (with
additionalcosts) in other
countries
Keeping 1.5°C Alive – Closing the Gap in the 2020s34
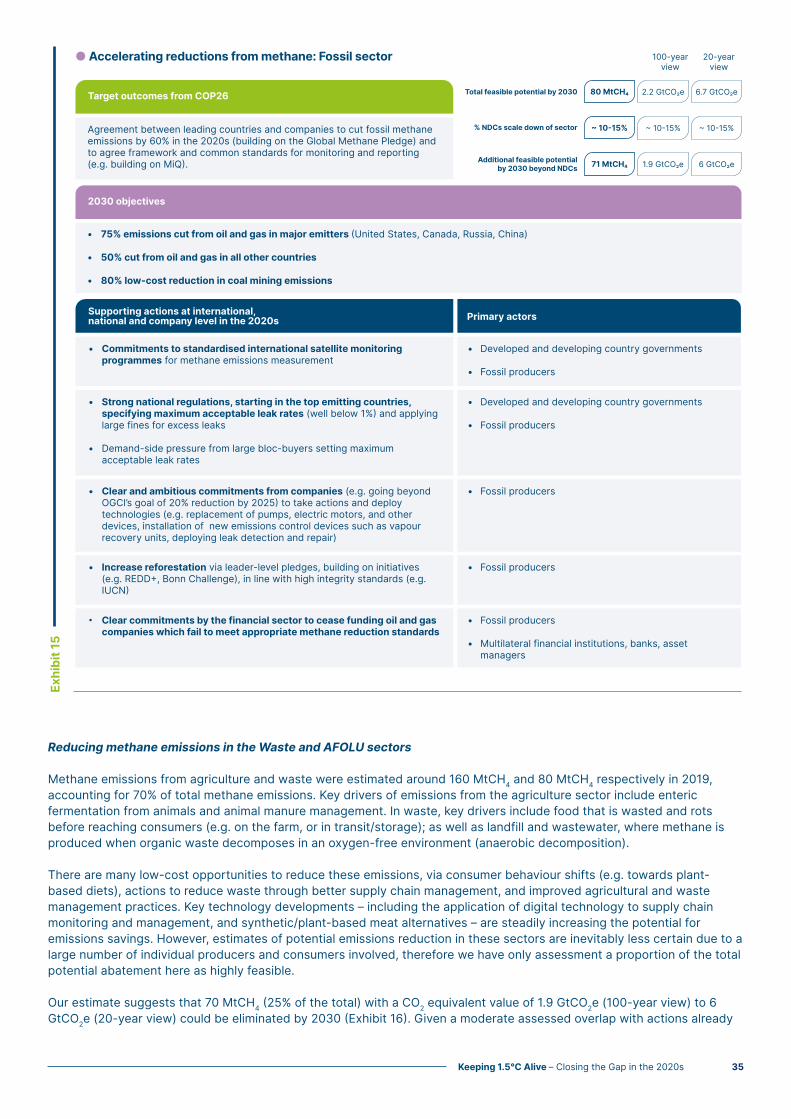
Reducing methane emissions in the Waste and AFOLU sectors
Methane emissions from agriculture and waste were estimated around 160 MtCH4 and 80 MtCH4 respectively in 2019, accounting for 70% of total methane emissions. Key drivers of emissions from the agriculture sector include enteric fermentation from animals and animal manure management. In waste, key drivers include food that is wasted and rots before reaching consumers (e.g. on the farm, or in transit/storage); as well as landfill and wastewater, where methane is produced when organic waste decomposes in an oxygen-free environment (anaerobic decomposition).
There are many low-cost opportunities to reduce these emissions, via consumer behaviour shifts (e.g. towards plant-based diets), actions to reduce waste through better supply chain management, and improved agricultural and waste management practices. Key technology developments – including the application of digital technology to supply chain monitoring and management, and synthetic/plant-based meat alternatives – are steadily increasing the potential for emissions savings. However, estimates of potential emissions reduction in these sectors are inevitably less certain due to a large number of individual producers and consumers involved, therefore we have only assessment a proportion of the total potential abatement here as highly feasible.
Our estimate suggests that 70 MtCH4 (25% of the total) with a CO2 equivalent value of 1.9 GtCO2e (100-year view) to 6 GtCO2e (20-year view) could be eliminated by 2030 (Exhibit 16). Given a moderate assessed overlap with actions already
Exhibit 15
● Accelerating reductions from methane: Fossil sector
Commitments to standardised international satellite monitoring programmes for methane emissions measurement
Supporting actions at international,national and company level in the 2020s Primary actors
Strong national regulations, starting in the top emitting countries, specifying maximum acceptable leak rates (well below 1%) and applying large fines for excess leaks
Demand-side pressure from large bloc-buyers setting maximum acceptable leak rates
Clear and ambitious commitments from companies (e.g. going beyond OGCI’s goal of 20% reduction by 2025) to take actions and deploy technologies (e.g. replacement of pumps, electric motors, and other devices, installation of new emissions control devices such as vapour recovery units, deploying leak detection and repair)
Agreement between leading countries and companies to cut fossil methane emissions by 60% in the 2020s (building on the Global Methane Pledge) and to agree framework and common standards for monitoring and reporting (e.g. building on MiQ).
Target outcomes from COP26
2030 objectives
Clear commitments by the financial sector to cease funding oil and gas companies which fail to meet appropriate methane reduction standards
•
Increase reforestation via leader-level pledges, building on initiatives (e.g. REDD+, Bonn Challenge), in line with high integrity standards (e.g. IUCN)
•
•
•
Developed and developing country governments
Fossil producers
•
•
Fossil producers•
Fossil producers•
Fossil producers
Multilateral financial institutions, banks, asset managers
•
•
•
•
Developed and developing country governments
Fossil producers
•
•
•
•
•
75% emissions cut from oil and gas in major emitters (United States, Canada, Russia, China)
50% cut from oil and gas in all other countries
80% low-cost reduction in coal mining emissions
100-yearview
20-yearview
80 MtCH 2.2 GtCOe 6.7 GtCOeTotal feasible potential by 2030
~ 10-15% ~ 10-15% ~ 10-15%% NDCs scale down of sector
71 MtCH 1.9 GtCOe 6 GtCOeAdditional feasible potential by 2030 beyond NDCs
Keeping 1.5°C Alive – Closing the Gap in the 2020s 35
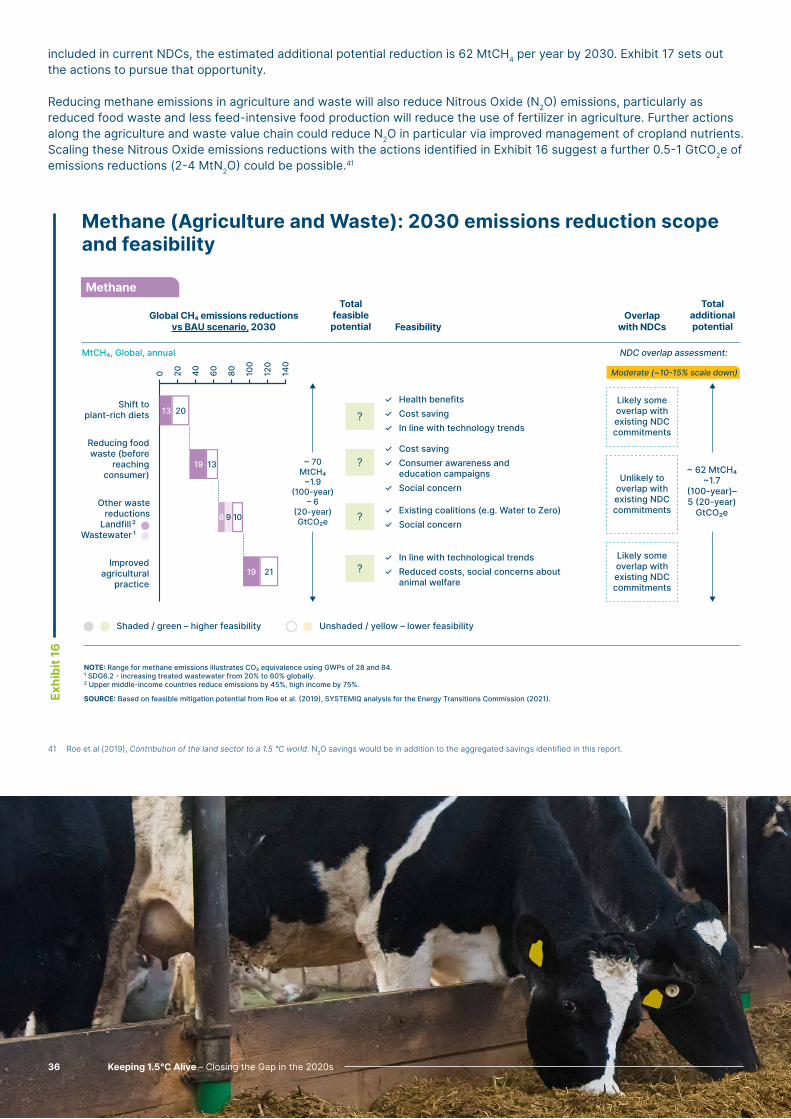
included in current NDCs, the estimated additional potential reduction is 62 MtCH4 per year by 2030. Exhibit 17 sets out the actions to pursue that opportunity.
Reducing methane emissions in agriculture and waste will also reduce Nitrous Oxide (N2O) emissions, particularly as reduced food waste and less feed-intensive food production will reduce the use of fertilizer in agriculture. Further actions along the agriculture and waste value chain could reduce N2O in particular via improved management of cropland nutrients. Scaling these Nitrous Oxide emissions reductions with the actions identified in Exhibit 16 suggest a further 0.5-1 GtCO2e of emissions reductions (2-4 MtN2O) could be possible.41
41 Roe et al (2019), Contribution of the land sector to a 1.5 °C world. N2O savings would be in addition to the aggregated savings identified in this report.
Exhibit 16
Methane (Agriculture and Waste): 2030 emissions reduction scope and feasibility
Methane
Global CH emissions reductions vs BAU scenario, 2030
Overlap with NDCs
Total feasible potential
~ 70 MtCH₄~1.9
(100-year)– 6
(20-year) GtCO₂e
Feasibility
Total additional potential
~ 62 MtCH₄~1.7
(100-year)– 5 (20-year) GtCO₂e
Unlikely to overlap with existing NDC commitments
Likely some overlap with existing NDC commitments
Likely some overlap with existing NDC commitments
NOTE: Range for methane emissions illustrates CO₂ equivalence using GWPs of 28 and 84. ¹ SDG6.2 - increasing treated wastewater from 20% to 60% globally. ² Upper middle-income countries reduce emissions by 45%, high income by 75%.
SOURCE: Based on feasible mitigation potential from Roe et al. (2019), SYSTEMIQ analysis for the Energy Transitions Commission (2021).
Shift toplant-rich diets
Reducing foodwaste (before
reachingconsumer)
Improvedagriculturalpractice
Other waste reductionsLandfill²
Wastewater ¹
Health benefitsCost savingIn line with technology trends
Cost savingConsumer awareness and education campaignsSocial concern
Existing coalitions (e.g. Water to Zero) Social concern
In line with technological trendsReduced costs, social concerns about animal welfare
✓✓✓
✓✓
✓
✓✓
✓✓
?
?
?
?
0 20 40 60 80 100
120
140
13
19
19 21
8 9 10
13
20
Shaded / green – higher feasibility Unshaded / yellow – lower feasibility
NDC overlap assessment:MtCH₄, Global, annual
Moderate (~10-15% scale down)
Keeping 1.5°C Alive – Closing the Gap in the 2020s36

Exhibit 17
Individual action encouraged by government and industry public awareness campaigns to scale adoption of plant-rich diets
Consumers
Developed, developing country and local governments
Leading food and agriculture companies, and sectoral associations
Commitment to develop labelling for low-methane meat, milk, and rice, and work with value chain to set low-methane standards,
Leading food and agriculture companies, and sectoral associations
Support for development of alternative proteins Leading food companies
Developed and developing country governments
Commitment to phase out policy support for intensive livestock farming and distorting subsidies
Developed and developing country governments
Industry commitments to reducing food waste arising on farms and in transit, e.g. via technology to improve supply chain effectiveness and procurement standards
Leading food, agriculture, and commodity trading companies and sectoral associations
Investment in wastewater treatment, particularly in developing countries enabled by development finance
Investment in waste collection, including separating organic and non-organic wastes, and recyclables
Water companies
Local governments
Multilateral financial institutions
● Accelerating reductions from methane: Agriculture and Waste sector
Agr
icul
ture
Was
te
Target outcomes from COP26
2030 objectives
Supporting actions at international,national and company level in the 2020s Primary actors
Country and company commitments to cut non fossil methane emissions by 30% in the 2020s, building on the Global Methane Pledge.
20% of people eating plant-rich diets globally, up from 10% today
30% reduction in emissions from food-chain waste
20% reduction in emissions from wastewater and landfill
•
•
•
•
•
•
•
•
•
•
••
••
••
•
•
•
•
•
100-yearview
20-yearview
70 MtCH 1.9 GtCOe 6 GtCOeTotal feasible potential by 2030
~ 10-15% ~ 10-15% ~ 10-15%% NDCs scale down of sector
62 MtCH 1.7 GtCOe 5 GtCOeAdditional feasible potential by 2030 beyond NDCs
Keeping 1.5°C Alive – Closing the Gap in the 2020s 37

4.2 Halting deforestation, beginning reforestation and other carbon sequestration opportunities Current levels of (net) carbon dioxide emissions resulting from the Food and Land use sector (FOLU) are estimated to be around 6 GtCO2.42,43 But the total potential to mitigate climate change is greater than this 6 GtCO2 figure, since the net figure reflects a combination of gross emissions sources of 16 GtCO2 (deriving primarily from deforestation to provide land for livestock and livestock feed production, cultivation of soil and oxidation of wood products) and gross carbon removals into sinks equal to around 11 GtCO2 (through forests and other ecosystems which sequesters carbon dioxide).44,45 There are clear opportunities both to reduce the sources (e.g. by ending deforestation) and to increase the sinks (e.g. through reforestation). If the world is to have any chance of limiting global warming to 1.5°C, AFOLU emissions, particularly from land use change, must switch from being a major source to a significant net sink of emissions as soon as possible.
In total we estimate total potential to reduce net emissions by as much as 12 GtCO2 by 2030 via (Exhibit 18):
• A rapid end to deforestation, particularly in tropical regions. Clearing a hectare of tropical forest for agriculture, can emit over 400 tonnes of CO2.46 And if current rates of deforestation continue, this would release over 40 GtCO2 into the atmosphere during the 2020s. In addition, it is vital to end the conversion of coastal wetlands and peatlands to agricultural uses. Together, actions to reduce FOLU related carbon dioxide sources could reduce annual emissions by 5 GtCO2 by 2030.
• Reforestation which could potentially remove more than 3 GtCO2 per year by 2030 and restoring coastal wetlands and peatlands a further 1 GtCO2.
• Improvements in forest management and improved sequestration of carbon in soils could remove a further 3 GtCO2 (e.g. through improved farming techniques, or in the form of biochar). 47
It has long been recognised that nature-based solutions could deliver emission reductions costs which are low compared with other mitigation options. Estimates suggest for instance that nearly 2 GtCO2 of deforestation could be avoided at a cost of less than $10 per tonne of CO2, with a further 1.5 GtCO2 available at less than $100 per tonne of CO2.48 Estimates for reforestation and afforestation are consistently in the range of around $5-50/tCO2.49 New technologies such as synthetic meat, genetic manipulation to increase crop yields or the application of digital technology to supply chain management and monitoring could contribute to faster progress. Consumer behaviour shifts towards plant-rich diets (which would also reduce methane emissions) could also play a major role.
However, past progress on ending deforestation has been slow. This reflects both the major short-term gains which can accrue from converting forest land to agriculture (for instance to soy farming), and the need for solutions to take into account multiple factors, including:
• Options to improve agricultural productivity but also to secure alternative livelihoods for forest-based communities.
• Uncertainties over existing land tenure rights.
• The misaligned incentives - including the “opportunity cost” of using the land - of multiple relevant actors connected along value chains from local individual farmers, through intermediate businesses to consumers across the world.
• The need for jurisdictional approaches to manage the use of land at a national or regional level, which ensures that emissions are genuinely reduced rather than simply displaced. In some cases countries may need direct support to develop these approaches.
• Impacts on biodiversity, water supply, ecosystem services and other nature benefits as well as on CO2 emissions.
42 FOLU CO2 emissions are expressed as the overall net figure which results from the combination of gross emissions and gross removals. FOLU CO2 emissions are generated primarily from the anthropogenic impacts of deforestation and other land use change. These emissions generated are in part offset by carbon sinks, which sequester emissions. Note ‘FOLU’ emissions are also at times referred to in the UNFCCC framework as ‘Land Use, Land Use Change and Forestry’ emissions (LULUCF).
43 Does not include non-CO2 emissions in this estimate.44 IPCC (2019) Climate Change and Land: an IPCC special report on climate change, desertification, land degradation, sustainable land management, food security, and
greenhouse gas fluxes in terrestrial ecosystems.45 It is important to acknowledge the significant uncertainty in these levels, since the emissions resulting when a hectare of forest is cut down or burnt varies very significantly
depending on specific local circumstance.46 Probos (2020) Tropical forests – the facts and the figures. 47 See Technical Annex for full details on methodology and sources, drawing in particular on the assessment in Roe et al (2019) Contribution of the land sector to a 1.5 °C
world.48 Based on estimates in Griscom et al. (2017) Natural Climate Solutions and Roe et al. (2021) Land-based measures to mitigate climate change: potential and feasibility by
country.49 Royal Society (2018) Greenhouse Gas Removal. Fuss et al. (2018) Negative emissions—Part 2: Costs, potentials and side effects.
Keeping 1.5°C Alive – Closing the Gap in the 2020s38

As a result, even low-cost opportunities may not be grasped without international agreement which commits major countries to action, supported by flows of climate finance which can offset the short-term incentives for deforestation and make reforestation and other nature-based solutions economic. Some initiatives already exist, and are driving some progress (e.g REDD+, the Forest Investment Program) 50, but a dramatic increase in scale is now required. These financial flows will have to involve major intergovernmental contributions but could also entail a major role for the private purchase of carbon removal credits by companies, supported by the development of appropriate carbon markets.
The ETC will shortly issue a report on Carbon Dioxide Removals which will explore the potential for and relative merits of different forms of financial flows, but it is clear that the required scale is very large. Achieving 5 GtCO2 emissions reductions at a cost of $40 per tonne would require a financial flow of $200 billion per annum. Such natural climate solutions (along with the phase-out of existing coal emissions considered in the next section) should be the highest priority use of international climate finance commitments.
Estimating a credible target for emissions reductions in the FOLU sector in the 2020s is therefore inherently more difficult than in relation to some other categories of action, but the technical potential is so great that achieving a best possible agreement and commitments at COP26 and after should be among the highest priorities. We estimate that a feasible programme of actions could reduce net emissions by around 7.5 GtCO2 by 2030, of which 4.6 GtCO2 result from reduced sources, with 2.9 GtCO2 reflecting increased sinks (carbon removals).
In addition to nature-based forms of carbon sequestration it is possible to achieve carbon removal via carbon capture technologies combined with geological storage of CO2, whether via BiCRS (Biomass Carbon Removal and Storage) or DACCS (direct air capture of CO2 plus storage). The forthcoming ETC report on carbon removals assesses this opportunity, alongside nature-based solutions. The potential for BiCRS is limited by the supply of truly sustainable biomass51 but the potential for DACCS is in technical terms limitless. It will however take time to reduce DACCS costs to reasonably affordable levels (e.g. $100 per tonne) and to build large-scale operations. For both technologies, early projects in the 2020s can pave the way for a larger scale up of engineered greenhouse gas removals beyond 2030. We estimate a realistic potential to use BiCRS and DACCS to achieve around 0.1 GtCO2/year of additional emission reductions by 2030. All of this would be additional to current NDCs (Exhibit 19). A majority of enhanced NDCs do reference nature-based solutions in their mitigation and adaptation strategies, but clear numerical targets are often lacking.52 After allowing for a “moderate” overlap with current NDCs, we estimate additional potential reductions at 6.6 GtCO2 per year by 2030. Specific actions required to deliver this are described in Exhibit 20.
50 The Climate Investment Fund’s a Forest Investment Program (FIP) provides direct investments to address the drivers of deforestation and forest degradation providing grants and low-interest loans to governments, communities and business stakeholders. See CIF (2020) Sustainable Forests.
51 See ETC (2021) Bioresources within a Net-Zero Emissions Economy: Making a Sustainable Approach Possible.52 WWF (2021) NDCs – A Force for Nature? 3rd Edition Enhanced NDCs.
Keeping 1.5°C Alive – Closing the Gap in the 2020s 39

Exhibit 19
BICRS and DACCS
Global CO₂ emissions reductionsvs BAU scenario, 2030
Totalfeasiblepotential
Totaladditional potential
Overlap with NDCs
Potential to shift bioenergy towards higher priority uses (in line with conclusions of ETC bioenergy report)
ETC workstreams on Carbon Dioxide Removals and on scaling CCS
✓
Emerging developments in DACCS as a scalable solutionSignificant clean power demand
ETC workstream on scaling CCS
✓
•
BICRS(BiomassCarbonRemoval
and Storage)
DACCS (DirectAir CarbonCapture andStorage)
Source: Hanna R, Abdulla A, Xu Y, Victor DG. (2021), “Emergency deployment of direct air capture as a response to the climate crisis”. Nat Commun., SYSTEMIQ analysis for the Energy Transitions Commission (2021).
Shaded / green – higher feasibility Unshaded / yellow – lower feasibility
GtCO, Global, annual
Feasibility Potential scales up rapidly beyond 2030
0.00
0.05
0.10
0.15
0.20
0.1 GtCO₂
0.04
0.06 0.06
0.1 GtCO₂
Unlikely to overlap with existing NDC commitments
BiCRS and DACCS: 2030 emissions removals scope and feasibility
Exhibit 18
AFOLU CO
Global CO emissions reductions vs BAU scenario, 2030
Overlap with NDCs
Total feasible potential
~ 7.5GtCO₂
Feasibility
Total additional potential
~ 6.5GtCO₂
Endingdeforestation
Endingconversion
coastal wetlandspeatlands
Reforestation
Restorationcoastal wetlandsand peatlands
Improved forestmanagement and
agroforestry
Enhanced soilsequestration in
agriculture,biochar
Unlikely to overlap with existing NDC commitments
Likely to overlap with existing NDC commitments
NOTE: ¹ "Maximum additional" mitigation potential by 2030 from Griscom et al. (2017). Estimate is constrained to be consistent with meeting human needs for food and fiber. ² "Cost effective" mitigation at <$100/tCO₂ in 2030 from Griscom et al. (2017). Estimate is constrained to be consistent with meeting human needs for food and fiber, and avoiding negative impacts to biodiversity (no establishment of forests where they are not the native cover type).
SOURCE: Roe et al. (2019)
In line with existing initiatives (e.g. REDD+, conservation initiatives)High geographic concentrationEnabled by tech focused on supply chain transparency and consumer awarenessImproving biodiversity and food securitySome costs, funding commitments
✓
✓✓
✓•
Additional cost outlays and funding commitmentsLess geographic concentrationConsumer awareness, social concernMonitoring potential
•
•✓✓
Plantation forestry initiatives (sustainable plantations) support by Development Finance Institutions Small scale and challenging business modelsHigh jobs creation potential
•
•✓
Earlier stage developments•
?
?
?
?
GtCO, Global, annual0 1 2 3 4 5 6 7 8 9 10 11 12
1
Indonesia
Brazil
ROW
0.8 0.8
1.5 1.5
10.3
0.3 0.3
210.6
Shaded / green – higher feasibility Unshaded / yellow – lower feasibility
Nature: 2030 emissions reduction and removals scope and feasibility
NDC overlap assessment:
Moderate (~10-15% scale down)
Keeping 1.5°C Alive – Closing the Gap in the 2020s40

Exhibit 20
Commitment to halt deforestation (esp. in Brazil, Indonesia, DRC), supported by financial support from developed countries (e.g. via Green Climate Fund, debt for nature swaps, grants)
Developed and developing country governments
Commitments to develop deforestation-free supply chains, building on existing initiatives (e.g. FACT Dialogue), and supported by due diligence standards, technology adoption for supply chain traceability, and individual action and public campaigns to scale deforestation-free consumption
Leading food, agriculture, mining, forestry, and commodity trading companies and sectoral organisation Consumers, encouraged by public information
Expansion of carbon market mechanisms, including Voluntary, non-Voluntary (e.g. EU ETS, CORSIA) with full accounting of land-use emissions and for high-quality, additional offsets
Task Force on Scaling Voluntary Carbon Markets (TFSVCM), other offset related initiatives, potential buyers Developed and developing country governments
Commitment to eliminating distorting agricultural subsidies (e.g. soy, palm) and support for high-yield crops improving agricultural productivity
Developed and developing country governments
Promote diet shift, “healthier calories”, and reduced consumption particularly in developed countries
Developed and developing country governments
Leading food and agriculture companiesConsumers
Commitments to accelerate standards and guidelines for CO2 storage development and appraisal process, sustainability of biomass feedstock
•
Increase reforestation via leader-level pledges, building on initiatives (e.g. REDD+, Bonn Challenge), in line with high integrity standards (e.g. IUCN)
Developed and developing country governments
Developed and developing country governments•
● Nature-based solutions (including carbon removals)
Target outcomes from COP26
Key 2030 targets
Supporting actions at international,national and company level in the 2020s Primary actors
A strong agreement on ending deforestation, supported by clear commitments for international climate finance from developed nations.
95% reduction in deforestation and conversion of coastal wetlands and peatlands, in tandem with support for sustainable livelihoods for dependent communities
1.8 Gt of CO2 removals from afforestation (on ~300 Mha) and restoration of coastal wetlands and peatlands, building on the Bonn Challenge
0.8 Gt of CO2 removals from improved forest management & agroforestry
0.3 Gt of CO2 removals from enhanced soil sequestration in agriculture and biochar (adoption of regenerative agriculture on ~400 Mha); 0.1 Gt of CO2 removals from scaling BICRS and DACCS
•
•
•
•
••
••
••
•
•
•
•
•
•
•
•
•
7.6 GtCOTotal feasible potential by 2030
~ 10-15%% NDCs scale down of sector
6.6 GtCOAdditional feasible potential by 2030 beyond NDCs
Keeping 1.5°C Alive – Closing the Gap in the 2020s 41
4.3 Decarbonising the power sector – accelerating coal phase out
Power sector emissions were 13.2 GtCO2 in 2019, of which 9.5 GtCO2 came from coal-fired power. China accounts for just under half of all coal-fired power emissions (4.5 GtCO2), and India for one-tenth (1 GtCO2).53 And while the pace of new coal developments has slowed, new coal plants are still being built in China and many developing countries. Even in OECD countries there are still 1.2 Gt of emissions from coal fired stations.
Reducing emissions from coal generation is therefore among the highest priority and highest potential actions. 54 It entails two distinct elements:
• First, ensuring that the near totality of new growth of electricity capacity and generation, concentrated primarily in developing economies, is zero-carbon.
• Secondly, by reducing emissions from existing coal generation in line with the IEA’s Net Zero pathway which assumes that the world can achieve zero carbon power systems by 2040, and earlier in developed economies. This could be achieved by (i) retiring existing coal plants (in particular the older less efficient ones) before end of life, (ii) by using coal generating plants for less of the year, increasingly providing a backup to renewable generation, (iii) by adding CCS.
The first step is a close to costless action in most parts of the world. Solar PV or onshore wind is now the cheapest form of new power generation in countries that make up two-thirds of the global population and 90% of electricity generation.55 ETC analysis of the Chinese and Indian power systems, shows moreover that it is technically feasible to rely entirely on zero carbon power sources (primarily VRE) for all electricity supply growth from now on, and such a strategy will impose very limited or no extra system cost, including allowance for all storage and flexibility requirements.56 Fourty-four countries have already committed to ‘no new coal’, and the bulk of proposed new coal power is located in a small subset of countries, where action could be targeted.57
A crucial objective of COP26 should therefore be to gain agreement on a “no new coal” strategy, building on the UN’s No New Coal initiative, supported by strong commitments from all major financial institutions and development banks, and national export credit agencies not to finance any new coal developments. We estimate that such a commitment could reduce 2030 emissions by another 0.7 GtCO2.
The phase out of existing fossil assets will present a greater challenge, in particular given the relatively young age of the coal fleet in China and India, where recent additions have been concentrated (Exhibit 21). While in some locations the cost of new renewables is already below the marginal cost of running coal plants – therefore making the early coal retirement economically favourable - some existing plants, particularly those supported by existing Power Purchase Agreements (PPAs) over multiple years, will continue to be economic in years ahead unless significant carbon prices are imposed.58 In these cases, early retirement of coal plants, or running them at lower utilisation rates may impose additional costs.59 Adding CCS to these plants could extend their lifetime and increase their utilisation but would also come at additional cost. However, given the size of the opportunity, action to reduce existing coal emissions must be a high priority:
• In developed countries this should be accepted as a necessary contribution towards global climate mitigation, and COP26 should aim for a commitment that all OECD countries will close down unabated coal plants by 2030. This could deliver 1.2 GtCO2 per year of emission reductions by 2030.
• In the case of lower-income developing countries, such as India or Indonesia, the early exit of a large portion of the existing coal fleet at additional cost will require support from climate finance, with some of the cost borne by richer developed economies, and the retirement of coal assets will also require well thought-out strategies for a just transition for affected workers.
53 BloombergNEF (2020) New Energy Outlook.54 The focus of this set of actions is on coal retirement and its displacement via variable renewables (VRE) to meet power system demand and system growth (supply-side);
effect of mitigation potential from additional electrification that is met via zero-carbon power (demand-side) is captured in other sectors.55 ETC (2021) Making Clean Electrification Possible.56 See TERI/ETC India (2020) Renewable Power Pathways: Modelling the Integration of Wind and Solar in India by 2030 and RMI/ETC China (2021) China Zero-Carbon
Electricity Growth in the 2020s: A Vital Step Towards Carbon Neutrality.57 E3G (2021) No New Coal by 2021. 58 ETC (2021) Making Clean Electrification Possible.59 See RMI (2020) How to Retire Early for an estimate of the costs of an early coal phaseout.
Keeping 1.5°C Alive – Closing the Gap in the 2020s42

Phasing out existing non-OECD coal assets which will be 20 or more years old in 2030 (~760 GW including China and India), could in total reduce emissions by 2.7 GtCO2/year by 2030, with 2.4 GtCO2/year assessed as higher feasibility. A further 2.7 GtCO2/year could be eliminated if newer non-OECD coal assets were retired early or equipped with CCS, but this is unlikely to be a feasible objective within the next 10 years and we consider only a small proportion of this to be possible (around 0.1 GtCO2/year). Higher feasibility potential for coal phase out is also underpinned by the need for Just Transition strategies, via funding for early retirement and re-skilling on coal miners. At national level, employment effects from coal phase out will usually be more than offset by the extra jobs created by renewables, at least during the next 30 years of rapid capacity expansion.60
The COP26 Presidency is already aiming to gain a “no new coal” commitment at COP26; and many OECD countries are accelerating existing coal phase out. Going beyond this to phase out, coal in lower income countries would require significant commitment of developed country funds. If, for instance, the additional cost incurred for retiring coal assets early were two cents per kWh of electricity produced, the cost per Gt of emission reductions would be about $20-$25 billion.61
Alongside ending deforestation and increasing reforestation, this is the highest priority potential use of the climate funds which developed countries have promised.
In total, actions related to coal phase-out could deliver 4.6 GtCO2 per year of emissions reductions by 2030, or 3.5 GtCO2 after adjustment or actions already in NDCs (Exhibit 22). A significant share of the no new coal and OECD coal phase out reductions is probably already coverered by current NDCs, 87% of which refer explicitly to plans for VRE expansion alongside quantitative domestic targets for increased renewable energy share (for instance those submitted by the EU, China, India and Japan). 62 But early phase out of existing coal is not yet envisaged by China nor by any low income developing country. The specific actions to deliver this reduction are set out in Exhibit 23.
60 ETC (2021) Making Clean Electrification Possible.61 Assuming 1000 Mt of emissions comes from 1 to 1.25 million GWh of coal generation, or 1000-1250 billion kilowatt-hours. At two cents per kilowatt-hour this is $20-$25
billion.62 UNFCCC (Feb 2021) Nationally Determined Contributions under the Paris Agreement: Synthesis report by the Secretariat; IRENA (2019), NDCs in 2020: Advancing
renewables in the power sector and beyond, International Renewable Energy Agency, Abu Dhabi.
Exhibit 21
Power sector emissions in 2019 were 13 GtCO₂, with a significant share coming from coal in key regions; challenge is relatively young age of the coal fleetCoal
Power sector emissions by region
Gt CO₂ , Global, annual
Coal fleet by age, China and India
GW
2.3
4.5
1
4
6
8
2
0
1,000
1,500
500
0
Coal capacity added post-2010Coal capacity added 2000-2010Coal capacity added pre-2000
Coal
Total Global Power Emissions, 13.2 GtCO₂Total Power Coal Emissions, 9.5 GtCO₂
SOURCE: BloombergNEF (2020) New Energy Outlook, Global Energy Monitor Coal Plant database, SYSTEMIQ analysis for the Energy Transitions Commission (2021).
OECD China
1.6
ROW India OECD
501
China
1,048
ROW
287
India
233
Keeping 1.5°C Alive – Closing the Gap in the 2020s 43

Exhibit 22
Coal
Global CO emissions reductions vs BAU scenario, 2030
Overlap with NDCs
Additionalto NDCs
Likely to overlap with existing NDC commitments
Feasibility
No additional costAir quality benefitsKey countries, Existing initiatives, e.g. Powering Past Coal Alliance
✓✓✓✓
No additional costAir quality benefitsKey countriesExisting initiatives, e.g. Powering Past Coal Alliance
✓✓✓✓
System readiness to deal with higher VREFeasible 2030 scale-up of VRE and zero-carbon flexibilityKey countriesSome additional cost – requires targeted climate finance in developing countries
✓✓
✓•
Cost and scaling challenges with CCSLikelihood for CCS to focus on sectors with fewer alternative decarbonisation opportunities
••
4.6GtCO₂
Total additional potential
3.5 GtCO₂
No new coal
OECD unabatedcoal phaseout by 2030
Phase out existing older
coal in non-OECD(> 20 years in 2030)
Phase out of newer unabated
coal assets(CCS)
Some likely overlap with existing NDC commitments
Unlikely to overlap with existing NDC commitments
NOTE: CCS assumes 90% capture rate.
SOURCE: BloombergNEF (2020) New Energy Outlook, Global Energy Monitor Coal Plant database, IEA (2021) Net Zero by 2050: A Roadmap for the Global Energy Sector, SYSTEMIQ analysis for the Energy Transitions Commission (2021).
Shaded / green – higher feasibility Unshaded / yellow – lower feasibility
GtCO, Global, annual0 1 2 3 4 5 6 7 8
0.10.50.3
1.8
0.60.10.20.2
Key countries for new coal pipeline include, Indonesia, Vietnam, Turkey
Key non-OECD countries include South Africa, Indonesia, Russia, Ukraine, Vietnam
China
India
ROW
1.2
0.30.35
0.351.7
NDC overlap assessment:
High (~20-30% scale down)
Coal: 2030 emissions reduction scope and feasibility
Keeping 1.5°C Alive – Closing the Gap in the 2020s44

Exhibit 23
Commitment to 2030 unabated coal phase out in OECD (e.g. via Powering Past Coal Alliance), alongside support for Just Transition strategies
Commitment to halt new coal projects (esp. in China and India)
China and India government
Developed country governments
Immediate commitments not to finance new coal power plants, new coal mines or coal mine extensions, and to cease financing companies in coal mining during the 2020s
Multilateral financial institutions
Banks
Targeted financial support from developed countries for early coal retirement in developing countries (e.g. India), e.g. via commitments from Green Climate Fund and/or via philanthropic/private sector capital
Developed country governments
Multilateral financial institutions
Banks
Philanthropic capital
Commitments to increased corporate procurement of renewables, via initiatives such as RE100, in addition to government-set quantitative targets for growth of zero-carbon generation and reduction of grid carbon intensity (gCO2/kWh)
Energy-intensive industry
Tech, finance, consulting
Developed and developing country governments
Immediate end to fossil fuel subsidies alongside redistributive measures
Introduction and extension of carbon pricing
Developed and developing country governments
● Decarbonising the power sector
Supporting actions at international,national and company level in the 2020s Primary actors
Target outcomes from COP26
2030 objectives
Agreement between leading countries and companies to cut fossil methane emissions by 60% in the 2020s (building on the Global Methane Pledge) and to agree framework and common standards for monitoring and reporting (e.g. building on MiQ).
No new coal from 2022
2030 coal phase out in OECD
Phase out older existing coal plants built before 2010
•
•
•
•
•
•
•
•
•
••
•
•
•
•
•
•
•
•
•
•
4.6 GtCOTotal feasible potential by 2030
~ 20-30%% NDCs scale down of sector
3.5 GtCOAdditional feasible potential by 2030 beyond NDCs
Keeping 1.5°C Alive – Closing the Gap in the 2020s 45
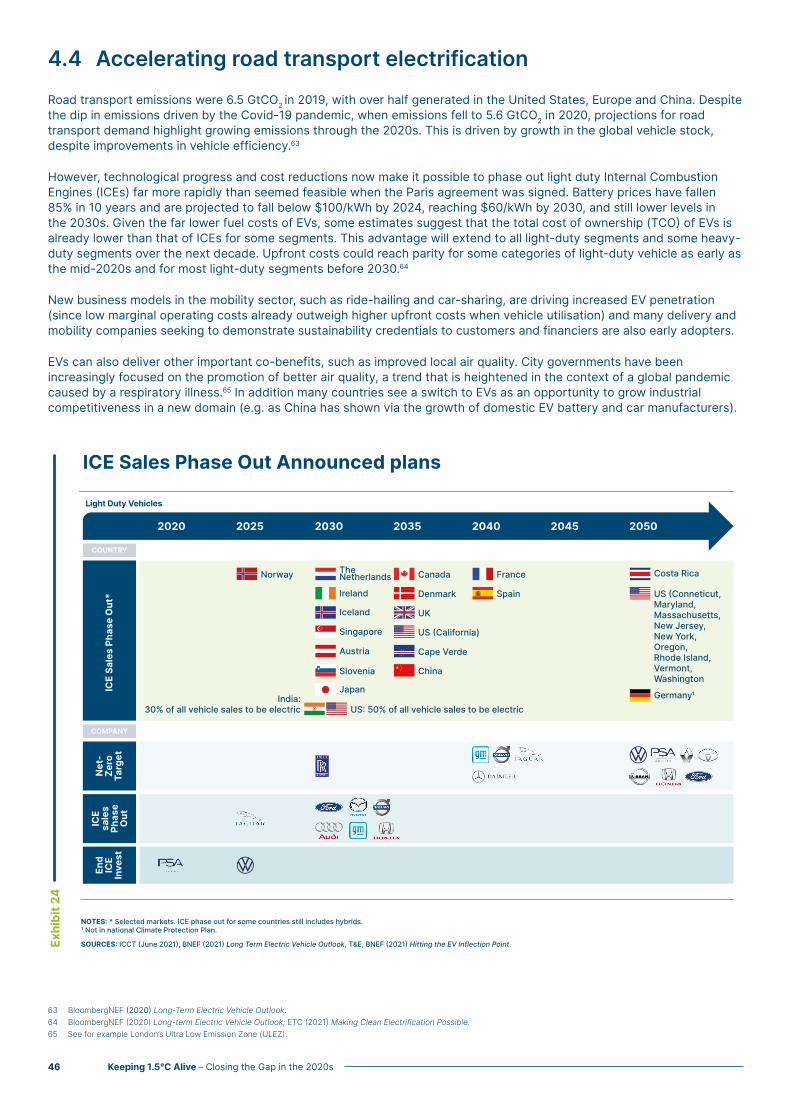
4.4 Accelerating road transport electrification
Road transport emissions were 6.5 GtCO2 in 2019, with over half generated in the United States, Europe and China. Despite the dip in emissions driven by the Covid-19 pandemic, when emissions fell to 5.6 GtCO2 in 2020, projections for road transport demand highlight growing emissions through the 2020s. This is driven by growth in the global vehicle stock, despite improvements in vehicle efficiency.63
However, technological progress and cost reductions now make it possible to phase out light duty Internal Combustion Engines (ICEs) far more rapidly than seemed feasible when the Paris agreement was signed. Battery prices have fallen 85% in 10 years and are projected to fall below $100/kWh by 2024, reaching $60/kWh by 2030, and still lower levels in the 2030s. Given the far lower fuel costs of EVs, some estimates suggest that the total cost of ownership (TCO) of EVs is already lower than that of ICEs for some segments. This advantage will extend to all light-duty segments and some heavy-duty segments over the next decade. Upfront costs could reach parity for some categories of light-duty vehicle as early as the mid-2020s and for most light-duty segments before 2030.64
New business models in the mobility sector, such as ride-hailing and car-sharing, are driving increased EV penetration (since low marginal operating costs already outweigh higher upfront costs when vehicle utilisation) and many delivery and mobility companies seeking to demonstrate sustainability credentials to customers and financiers are also early adopters.
EVs can also deliver other important co-benefits, such as improved local air quality. City governments have been increasingly focused on the promotion of better air quality, a trend that is heightened in the context of a global pandemic caused by a respiratory illness.65 In addition many countries see a switch to EVs as an opportunity to grow industrial competitiveness in a new domain (e.g. as China has shown via the growth of domestic EV battery and car manufacturers).
63 BloombergNEF (2020) Long-Term Electric Vehicle Outlook.64 BloombergNEF (2020) Long-term Electric Vehicle Outlook; ETC (2021) Making Clean Electrification Possible. 65 See for example London’s Ultra Low Emission Zone (ULEZ).
Exhibit 24
Light Duty Vehicles
ICE Sales Phase Out Announced plans
ICE Sales Phase Out*
COUNTRY
Net-
Zero
Target
ICE
sales
Phase
Out
End
ICE
Invest
COMPANY
2020 2025 2030 2035 2040 2045 2050
NOTES: * Selected markets. ICE phase out for some countries still includes hybrids.¹ Not in national Climate Protection Plan.
SOURCES: ICCT (June 2021), BNEF (2021) Long Term Electric Vehicle Outlook, T&E, BNEF (2021) Hitting the EV Inflection Point.
Norway TheNetherlands
Ireland
Iceland
Singapore
Austria
Slovenia
Japan
US: 50% of all vehicle sales to be electricIndia:
30% of all vehicle sales to be electric
Canada
Denmark
UK
US (California)
Cape Verde
China
France
Spain
Costa Rica
US (Conneticut,Maryland, Massachusetts,New Jersey, New York,Oregon, Rhode Island,Vermont, Washington
Germany
Keeping 1.5°C Alive – Closing the Gap in the 2020s46
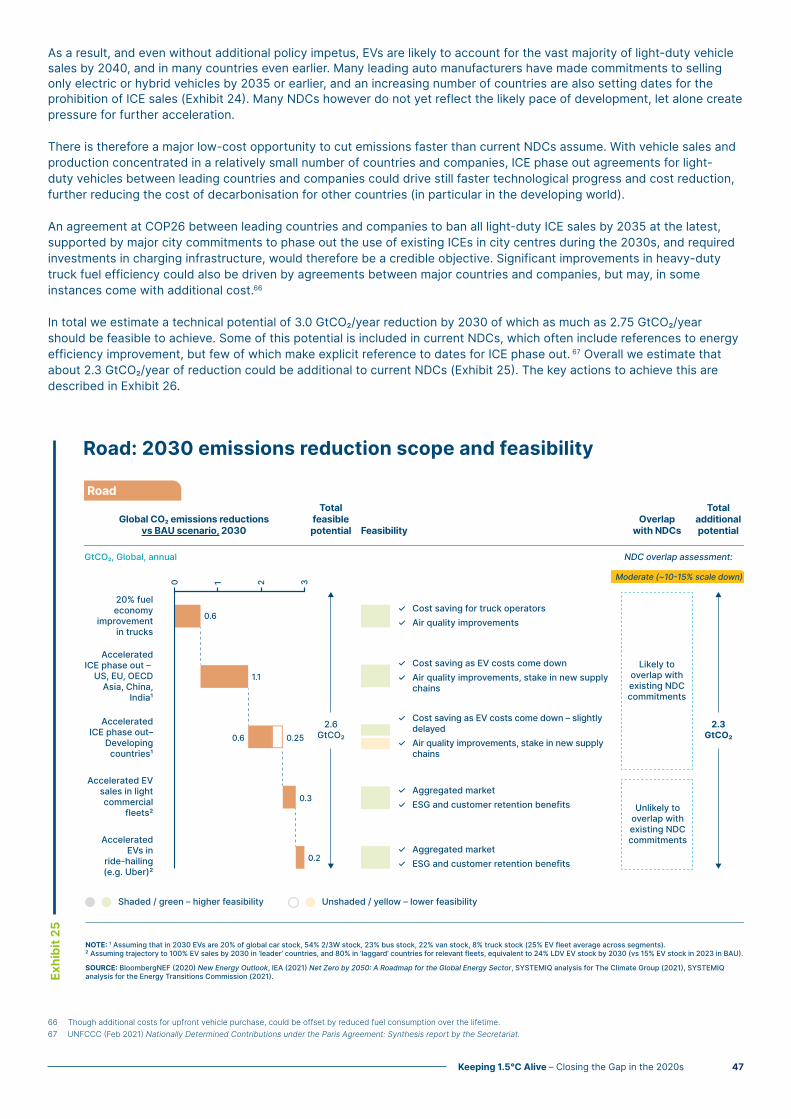
As a result, and even without additional policy impetus, EVs are likely to account for the vast majority of light-duty vehicle sales by 2040, and in many countries even earlier. Many leading auto manufacturers have made commitments to selling only electric or hybrid vehicles by 2035 or earlier, and an increasing number of countries are also setting dates for the prohibition of ICE sales (Exhibit 24). Many NDCs however do not yet reflect the likely pace of development, let alone create pressure for further acceleration.
There is therefore a major low-cost opportunity to cut emissions faster than current NDCs assume. With vehicle sales and production concentrated in a relatively small number of countries and companies, ICE phase out agreements for light-duty vehicles between leading countries and companies could drive still faster technological progress and cost reduction, further reducing the cost of decarbonisation for other countries (in particular in the developing world).
An agreement at COP26 between leading countries and companies to ban all light-duty ICE sales by 2035 at the latest, supported by major city commitments to phase out the use of existing ICEs in city centres during the 2030s, and required investments in charging infrastructure, would therefore be a credible objective. Significant improvements in heavy-duty truck fuel efficiency could also be driven by agreements between major countries and companies, but may, in some instances come with additional cost.66
In total we estimate a technical potential of 3.0 GtCO2/year reduction by 2030 of which as much as 2.75 GtCO2/year should be feasible to achieve. Some of this potential is included in current NDCs, which often include references to energy efficiency improvement, but few of which make explicit reference to dates for ICE phase out. 67 Overall we estimate that about 2.3 GtCO2/year of reduction could be additional to current NDCs (Exhibit 25). The key actions to achieve this are described in Exhibit 26.
66 Though additional costs for upfront vehicle purchase, could be offset by reduced fuel consumption over the lifetime. 67 UNFCCC (Feb 2021) Nationally Determined Contributions under the Paris Agreement: Synthesis report by the Secretariat.
Road
Road: 2030 emissions reduction scope and feasibility
Global CO emissions reductions vs BAU scenario, 2030
Overlap with NDCs
Total feasible potential
2.6GtCO₂
Likely to overlap with existing NDC commitments
Feasibility
Cost saving for truck operatorsAir quality improvements
✓✓
Cost saving as EV costs come downAir quality improvements, stake in new supply chains
✓✓
Cost saving as EV costs come down – slightly delayedAir quality improvements, stake in new supply chains
✓
✓
Aggregated marketESG and customer retention benefits
✓✓
Aggregated marketESG and customer retention benefits
✓✓
Total additional potential
2.3 GtCO₂
0 1 2 3
20% fueleconomy
improvementin trucks
AcceleratedICE phase out – US, EU, OECDAsia, China,
India¹
AcceleratedICE phase out–Developingcountries¹
Accelerated EVsales in lightcommercial
fleets²
AcceleratedEVs in
ride-hailing(e.g. Uber)²
Unlikely to overlap with existing NDC commitments
NOTE: ¹ Assuming that in 2030 EVs are 20% of global car stock, 54% 2/3W stock, 23% bus stock, 22% van stock, 8% truck stock (25% EV fleet average across segments). ² Assuming trajectory to 100% EV sales by 2030 in ‘leader’ countries, and 80% in ‘laggard’ countries for relevant fleets, equivalent to 24% LDV EV stock by 2030 (vs 15% EV stock in 2023 in BAU).
SOURCE: BloombergNEF (2020) New Energy Outlook, IEA (2021) Net Zero by 2050: A Roadmap for the Global Energy Sector, SYSTEMIQ analysis for The Climate Group (2021), SYSTEMIQ analysis for the Energy Transitions Commission (2021).
0.6
1.1
0.250.6
0.3
0.2
GtCO, Global, annual
Shaded / green – higher feasibility Unshaded / yellow – lower feasibility
NDC overlap assessment:
Moderate (~10-15% scale down)
Exhibit 25
Keeping 1.5°C Alive – Closing the Gap in the 2020s 47

Action from national Governments, and city and corporate actorsat COP26 beyond can deliver over 2 Gt/year of emissions reductions by 2030
Light-duty ICE sales bans by 2035, and commitments from major automakers for 100% zero-emission vehicles by 2035
Developed and developing country governments
Major auto manufacturers
Commitments to 100% new EV purchases in corporate and mobility fleets by 2030 at the latest (e.g. via EV100)
Logistics companies (e.g. Amazon)
Transport network companies (e.g. Uber)
Commitment to stringent fleet-wide fuel efficiency standards for cars, vans and HGVs in gCO2/km from the 2020s
Developed and developing country governments
Remove subsidies for petrol and diesel, maintain or increase taxation on petrol and diesel to create incentives for heavy-duty transition
Developed and developing country governments
Commitments to EV charging infrastructure rollout with clear international standards, alongside potential road tolls and fees for ICE vehicles, scrappage schemes for ICE vehicles
Developed and developing country, city governments
Bans and restrictions on use of ICE light duty vehicles in major cities aiming for comprehensive bans in most major cities (reinforcing and accelerating the Cities Race to Zero and the C40 Green and Healthy Streets Declaration)
City governments
● Decarbonising road transport
Target outcomes from COP26
2030 objectives
A strong agreement to commit to ending sales of light-duty ICE vehicles by 2035 at the latest, supported by clear targets from countries, cities and auto manufacturers.
Achieve 20% global EV stock in light duty vehicles
Achieve 10% global non-ICE stock for heavy goods vehicles (HGVs)
Achieve 25% EV stock in corporate and mobility fleets by 2030
Achieve 20% fuel efficiency improvement in HGVs
Supporting actions at international,national and company level in the 2020s Primary actors
•
•
•
•
•
•
•
•
•
•
••
••
••
••
2.6 GtCOTotal feasible potential by 2030
~ 10-15%% NDCs scale down of sector
2.3 GtCOAdditional feasible potential by 2030 beyond NDCs
Exhibit 26
Keeping 1.5°C Alive – Closing the Gap in the 2020s48

4.5 Accelerating supply decarbonisation in buildings, heavy industry and heavy transportAt the time of the Paris agreement, most analysis assumed that it would be difficult and very expensive to decarbonise sectors where direct electrification was either impossible or more difficult than in light duty road transport. But the ETC’s Mission Possible report of November 2018 showed that it is possible for all the so-called “hard-to-abate” sectors – such as steel, cement, chemicals, long-distance aviation and shipping – to achieve zero emissions by 2050 at very low costs to economic growth and consumer living standards. Key technologies to foster the transition alongside direct electrification include hydrogen, bioenergy and CCS.
Many leading companies and sectoral organisations within these sectors have now made commitments to achieve net zero emissions by 2050, and sectoral programmes within the MPP are developing feasible pathways from today to that 2050 objective.
These pathways are often “convex curve” in shape, with only limited progress in the 2030s, followed by acceleration in the 2030s. This in part reflects the inherent difficulty of achieving major early emission reductions in sectors which have long lasting capital assets such as steel or cement plants, ships or planes.
However, a feasible set of actions could still deliver over 1 GtCO2 per year of additional emissions reductions from the hard to abate industrial and long-distance transport sectors, plus another 1 Gt from accelerated electrification of residential heating and industry (Exhibit 27).
• In the steel sector, which currently accounts for around 3 GtCO2 of emissions per annum globally, analysis by the Net Zero Steel Initiative illustrates that up to 1.3 GtCO2 could be eliminated by 2030 if carbon pricing reaching around $60/tCO2 by 2030, or equivalent mechanisms were imposed. This level of decarbonisation would require around 50 near-zero carbon steel plants by 2030. This would result in increased steel prices, but the total cost impact on consumer living standards and economic growth would be minimal. Additionally, steel production is concentrated in a relatively small number of countries (China, Japan, Korea, the EU, the US and India), and leading steel companies have already committed to net zero by 2050. This increases the potential for coordinated action between a small group of countries and companies.
• Opportunities are smaller in long-distance shipping and aviation both because these account for smaller current emissions (about 1 Gt in each case) and because the costs of abatement per tonne of CO2 are much higher. Despite this, forceful early action is essential to make a path to decarbonisation possible in the 2030s and 40s, through scaling up a market for low-carbon fuels. Additionally, the existence of international regulating bodies in these sectors, such as the IMO and ICAO, creates natural coordinating mechanisms which are missing in other sectors. Feasible commitments to ensure that 10% of the fuel burnt in shipping and aviation comes from new low carbon fuels by 2030 could together deliver 0.2 GtCO2/year of additional abatement by 2030.
• MPP work on possible decarbonisation pathways in the chemicals and cement sectors is at an earlier stage, but it is likely that these sectors could also deliver abatement which is not covered by existing NDCs. A forthcoming report from the Global Cement and Concrete Association68 suggest that today’s 2.7 GtCO2/year of cement and concrete -related emissions could be cut to around 2.3 GtCO2/year by 2030, en route to zero by 2050.
• There is a major opportunity to drive accelerated decarbonisation in industry, as well as residential heat via more rapid electrification, with this heating opportunity concentrated in richer developed countries.
Progress in all of these sectors will be driven by a combination of direct electrification, and the use of hydrogen, CCS, and biofuels (in particular in aviation). Green hydrogen will play a major role, and coordinated international action to spur its development could play an important role in supporting sectoral decarbonisation initiatives.
In residential heat there are major opportunities to accelerate electrification using heat pumps,69 with upfront investments delivering subsequent fuel cost reductions. Specific strategies in this arena are inherently national, given different starting points, but there could be a role for COP26 to galvanise action across the major affected countries (primarily richer nations in Northern latitudes) and to spur technological progress in heat pump efficiency improvement. National policies could complement this by banning new gas boiler installations. We estimate potential to reduce emissions by 1 GtCO2/year by 2030.
In total, we estimate a reduction opportunity in these sectors of 2.2 GtCO2/year by 2030, of which 2.1 GtCO2/year would be additional to NDCs. This reflects the very limited ambition in most current NDCs for early decarbonisation of either the supposedly hard to abate sectors or residential heating.70
Action required to deliver this is described in Exhibit 28.
68 GCCA (October 2021) Concrete Action. 69 Or, in cases where electrification via heat pumps is difficult, using resistive heating (though this requires additional low-carbon electricity generation). 70 UNFCCC (Feb 2021) Nationally Determined Contributions under the Paris Agreement: Synthesis report by the Secretariat.
Keeping 1.5°C Alive – Closing the Gap in the 2020s 49

Exhibit 27
Supply-side other
Global CO emissions reductions vs BAU scenario, 2030
Total feasible potential
Total additional potential
Overlap with NDCs
2.2GtCO₂
Feasibility
Switch to more efficient tech (e.g. heat pumps)Supportive regulation for new buildsLower energy bills once installedAdditional Capex costs for retrofit (suggesting some subsidies required), disaggregated actors
✓✓✓•
Key countries (China, Japan, Korea, EU, US, India)Limited impact on end-consumer pricesAdditional cost premiumLong-lasting capital assets
✓✓••
Limited impact on end-consumer pricesAdditional cost premiumLong-lasting capital assets
✓••
International regulatory bodyHigher abatement cost
✓•
International regulatory bodyHigher abatement cost
✓•
2.1 GtCO₂
0.0
1.00.5
2.0
1.5 3.0
2.5
Acceleratedelectrificationof buildingheating andindustry
Steel
Aviation
Shipping
Cementand concrete
Unlikely to overlap with existing NDC commitments
NOTE: ¹ Represents impact from fuel switch for additional electrification in ETC scenarios vs BNEF BAU Power scenario, excluding impact on road transport.
SOURCE: Mission Possible Partnership Analysis, BloombergNEF, ETC (2021) Bioresources within a Net-Zero Emissions Economy, SYSTEMIQ analysis for the Energy Transitions Commission (2021).
1
0.8 0.6
0.1
0.1
0.20.2
GtCO, Global, annual
?
Shaded / green – higher feasibility Unshaded / yellow – lower feasibility
NDC overlap assessment:
Low (~5% scale down)
Other supply-side decarbonisation: 2030 emissions reduction scope and feasibility
Potential scales up rapidly beyond 2030
Keeping 1.5°C Alive – Closing the Gap in the 2020s50

Exhibit 28
Introduce policy support to overcome “green cost premiums” via:
Carbon pricing, quantitative fuel mandates and contracts for difference
Public procurement (or voluntary/ encouraged private procurement) of decarbonised materials (e.g building on Clean Energy Ministerial Industrial Deep Decarbonisation Initiative
Regulated product standards – carbon emissions intensity of materials (e.g. steel or cement), or lifecycle emissions standards on end-products (e.g. auto, white goods) to create markets for decarbonised materials
Developed and developing country governmentsEnergy-intensive industries
Major customers of energy-intensive industries (automotive, construction, international freight)
Commitments to phasing out the use of gas boilers in new builds by 2025, and to support heat pump deployment and technological advance
Developed, developing country and city governments
National/ regional commitments from public and private stakeholders to develop green hydrogen capacity (e.g EU commitment to 40 GW by 2030, Green Hydrogen Catapult objective of 25GW by 2026), and regulations to switch existing hydrogen use to clean hydrogen
Developed and developing country governments
Energy producers, energy-intensive industries
IMO and constituent members ICAO and constituent members
Developed and developing country governments
Strengthening of IMO 2050 target for 50% reduction to net zero with strong 2030 reduction target and supporting policy measures (e.g carbon price, zero carbon fuel mandate) Strengthening of ICAO 2050 target for 50% reduction to net zero with strong 2030 reduction target and supporting policy measures (e.g carbon price, zero carbon fuel mandate)
● Supply-side decarbonisation in other sectors
Supporting actions at international,national and company level in the 2020s Primary actors
Target outcomes from COP26
2030 objectives
A strong agreement between leading coalitions of countries, companies and sectoral organisations to drive accelerated decarbonisation of the steel, cement, aviation and shipping sectors, building on existing sectoral initiatives such as the Net Zero Steel Initiative and the Getting to Zero Coalition for shipping.
Leading countries should also commit to accelerated electrification, and scaling up clean hydrogen.
1 Gt of CO2 reductions from accelerated electrification in buildings and industry
At least a 25% reduction in steel emissions (implying a need for ~50 near zero-emissions steel plants)
10% sustainable aviation fuel (SAF) penetration
5-7% zero-emission shipping fuel
•
•
•
•
•
•
•
•
•
•
•
•
•
•
•
•
••
•
2.2 GtCOTotal feasible potential by 2030
~ 5%% NDCs scale down of sector
2.1 GtCOAdditional feasible potential by 2030 beyond NDCs
Keeping 1.5°C Alive – Closing the Gap in the 2020s 51

4.6 Energy and resource efficiency improvements
In principle improvements in energy productivity (GDP per unit of energy consumed) should be a significant opportunity for low-cost reductions in the 2020s. Major opportunities exist along three dimensions:
• Improvements in the energy efficiency of buildings, appliances, transport and industrial equipment. For example, an initiative to double the efficiency of air conditioning, lighting and appliances in key countries, could lead to a reduction of at least 0.5 GtCO2/year by 2030.71
• Improvements in material efficiency and circularity, for instance through better designed buildings which require less steel or cement input, and greatly increased recycling or reuse multiple products.
• Wider improvements in energy productivity, for instance through the development of shared transport systems or better designed cities which reduce transport emissions while still delivering high quality mobility services. These wider energy productivity improvements sometimes rely on consumer behaviour change, e.g. via shifts in modes of transport (e.g. towards ride-hailing, car-sharing, micromobility), as well as investments in upgrades to city design (e.g. cycling lanes).
Many past analyses have identified large opportunities along each of these dimensions, many of which are in principle available at low or negative cost, and most of which can be achieved with technology already available. In its Net Zero by 2050 report, the IEA estimated that 25% of the CO2 reductions attainable by 2030 – amounting to 5 GtCO2/year – could come from either energy efficiency improvements or behaviour change, with a further 8 GtCO2/year reduction possible in the subsequent 20 years (Exhibit 29). Additionally, the IRP (2018) report The Weight of Cities highlighted the emissions savings potential through redesigning infrastructure in cities, and that this could be achieved with limited investment, delivered by compact forms with higher densities, smaller scale urban blocks and dense street patterns, and retrofitting buildings to be more energy efficient.72
71 See COP26 Product Efficiency Call to Action. Overall savings have been scaled down to reflect a reduction in coal in the power sector in the ETC’s analysis. 72 IRP (2018) The Weight of Cities: Resource Requirements of Future Urbanization.
Exhibit 29
Energy & resource efficiency
Global CO emissions reductions vs BAU scenario, 2030
2.9 GtCO₂
Feasibility
Small addition to construction costCost saving, lower energy billsExisting technology
✓✓✓
Covid-led change In travel patterns (remote work)ESG pressure on corporates
✓
✓
In line with existing trends (e.g. flight shaming)Covid-led change in travel patterns
✓✓
Increased ESG pressures on corporatesCost savingExisting potential has struggled to be realised
✓✓•
Local initiatives and targets, digital technology enablers, efficiency savings High Capex cost for retrofits – may not be repaid during lifetime
✓
•
Mindset shifts, city infrastructure upgrades
•2.5 GtCO₂
Buildingefficiency(New) and appliancestandards
Building efficiency(Existing)
Modal shift(cycling,
eco-driving,no ICE in cities)
Reducedbusinesstravel¹
Air travel -Changingconsumer attitudes²
Energy productivityin Industry
0 1 2 3 4 5
1.4
0.70.2
0.50.2
0.15
0.05
0.90.9
Some likely overlap with existing NDC commitments
NOTE: ¹ Reducing business class flights by 50% ² 5% reduction of air travel.
SOURCE: Climate Action Tracker research, IEA (2021) Net Zero by 2050: A Roadmap for the Global Energy Sector, SYSTEMIQ analysis for the Energy Transitions Commission (2021).
GtCO, Global, annual
?
Overlap with NDCs
Total additional potential
NDC overlap assessment:Moderate (~10-15% scale down)
Shaded / green – higher feasibility Unshaded / yellow – lower feasibility
Energy and resource efficiency: 2030 emissions reduction scope and feasibility
Keeping 1.5°C Alive – Closing the Gap in the 2020s52

However, recent improvements in energy productivity have been disappointing, with annual improvement rates of only 1.5% in 2018 and 1.6% in 2019, falling to just 0.8% in 2020, as low energy prices, induced by the COVID-19 crisis, diluted incentives to reduce energy use.73
This disappointing performance reflects the inherent nature of many energy and resource efficiency opportunities. Some depend on actions with large lead times before full results, such as better city design. Many depend on action by a large number of diverse producers and consumers, making it more difficult to design specific policies and projects which can drive rapid progress in the way that is possible in the power system or road transport. And in some areas – for example the renovation of existing buildings - rapid action will only occur if governments set clear requirements and renovation standards. Finally, behaviour change often only occurs after slowly growing shifts in consumer perception, with political resistance to driving rapid and enforced change. Moreover, strong action on all aspects of energy productivity during the 2020s is essential to drive more rapid reductions in the 2030s and 2040s.
Giving this complexity, our scenario assumes that a lower proportion of the technically feasible opportunity for energy productivity improvement can be realised than in the other five categories (Exhibit 29). But out of 5 GtCO2/year of technically feasible progress (broadly in line with the IEA’s Net Zero pathway), an estimated 2.9 GtCO2/year could be seized, if COP26 was the launching pad for multiple initiatives agreed by leading national, local and city governments and by leading companies who can play a major role in driving increased recycling (Exhibit 30).
The overlap between actions and current NDCs is assessed as “moderate”. Although many countries identify improved energy efficiency for buildings as a key action, only 25% focus on opportunities in industry, with policies to improve material circularity often vague and unambitious.74 Actions to induce changes in behaviour that could improve energy efficiency are less frequent, and lacking in specificity. Accounting for this “moderate” overlap, the additional potential would be 2.5 GtCO2/year.
73 IEA (2020) Energy Efficiency 2020.74 UNFCCC (Feb 2021) Nationally Determined Contributions under the Paris Agreement: Synthesis report by the Secretariat.
Exhibit 30
Global commitments to adopt best-in-class building & appliance efficiency (e.g. via C40 Net-Zero Buildings Declaration, C40 Construction Declaration, Super Efficient Equipment & Appliance Deployment, PECA, Kigali Cooling Efficiency Programme) and fiscal support for retrofits
Developed, developing country and city governments
Commitments to increase taxation of business class flights and short-haul flights and commitments to reducing flying
Developed and developing country governments
Tech, finance, consulting
Separate collection of waste and recyclables and recycling/collection targets, commitments to repair, light weighting targets, supply chain transparency
Developed, developing country and city governments
Energy-intensive industry
Commitments from major cities to develop net zero mobility plans, decreasing the need for individual road transport (e.g. via Cities Race to Zero, C40 Green and Healthy Streets Declaration)
City governments
● Energy and resource efficiency
Supporting actions at international,national and company level in the 2020s Primary actors
Target outcomes from COP26
2030 objectives
A strong agreement to make energy and resource efficiency improvements key features of future NDCs, supported by adoption of best-in-class building standards and product efficiencies (e.g. via the Product Efficiency Call to Action).
15%+ reduction in building emissions from non-heating efficiency (implying a doubling of the efficiency of air conditioning, lighting and appliances in key countries and a commitment to zero-emissions in new builds from 2021 in OECD and from 2025 in non-OECD)
5%+ reduction in transport emissions from additional efficiency and reduced consumption (including 20% reduction in total aviation emissions), driven by modal shift away from cars in urban centres, reduced business air travel and lower air travel demand growth
10%+ reduction in industry emissions from efficiency and reduced consumption, driven by improvements across energy, material, and service efficiency
•
•
•
•
•
•
•
•
•
•
•
•
•
2.9 GtCOTotal feasible potential by 2030
~ 10-15%% NDCs scale down of sector
2.5 GtCOAdditional feasible potential by 2030 beyond NDCs
Keeping 1.5°C Alive – Closing the Gap in the 2020s 53

Adding it up – Can we close the gap?
Chapter 5
Keeping 1.5°C Alive – Closing the Gap in the 2020s54

The six actions identified in this report could in principle close over 90% of the gap between the emissions pathway implied by the latest NDCs and what is required for the world to be on a path to limit global warming to 1.5°C by 2030. Exhibits 31 and 32 show our estimate of potential reductions with the figures adjusted to remove estimated overlap with NDCs.
• Feasible methane emission cuts of 130 MtCH4 per year beyond current NDCs could deliver the carbon equivalent of between 3.5 GtCO2 (100-year view) 11 GtCO2 (20-year view) of emissions reductions by 2030.
• Ending deforestation, beginning reforestation, improving forest management and agroforestry, and deploying BiCRS and DACCS could achieve around 6.6 GtCO2 per year by 2030.
• Commitments to build no new coal power assets and to begin the phase out of existing coal generation could deliver 3.5 GtCO2 of additional reduction.
• And a combination of actions in road transport, heavy industry, shipping and aviation, and through the acceleration of energy efficiency and productivity improvements, could deliver an additional 7 GtCO2 of reductions.
To different degrees, these actions could be the subject of focused, practical collaborations between groups of countries, and/or companies - which COP26 could launch, or where they exist, strengthen.
The biggest uncertainties among the six categories of action identified relate to nature-based solutions and the retirement of existing coal assets – since both will likely require financial commitments by rich developed countries (or companies) to support accelerated action in lower income developing nations.
By contrast, most of actions required to achieve methane reduction, road transport and energy productivity-based emission reductions are possible at very low or no additional cost, while accelerated action to decarbonise heavy industry, shipping and aviation will impose costs which can be easily absorbed since diffused across the global economy, very small relative to global GDP, and primarily eventually borne by rich country consumers.
But new commitments and agreements at COP26 would accelerate that progress yet further. Indeed recent technological and cost reduction progress, combined with company and sectoral commitments make it likely that in many sectors emissions reductions will progress faster than current NDCs even without new agreements. Moreover across all sectors of the economy, the stronger the reduction commitments made, and the more that countries work together, the faster technological progress, economy of scale and learning curve effects will drive down the cost of emission reductions, in some cases to costs below that of the high carbon equivalent.
Other actions to fill (and go beyond) the remaining emissions gap are also certainly technically feasible, and some of these have been identified in the individual sections of this report. However, these actions have been excluded from our summary total either because they are likely to entail higher cost, or because the multiplicity and diversity of the decision makers involved makes it more difficult for them to be progressed by agreements between coalitions of leading countries, companies and other actors.
Faster progress on these and other opportunities will need to be covered by further tightening of country NDCs in the future and encouraged by wide-ranging policy levers such as carbon pricing.
Overall, the conclusion of this report is that there are technically feasible and reasonably cost-effective actions which would give the world a 50% chance of limiting global warming to 1.5°C while delivering a 90% chance of limiting warming to 2°C.
A 1.5°C pathway is not yet out of reach: but we are running out of time to make it attainable. COP26 must catalyse the actions required to attain it.
Keeping 1.5°C Alive – Closing the Gap in the 2020s 55

Exhibit 31
Exhibit 32
Global CH emissions
Mt CH, Global, annual GtCOe, Global, annualBased on 20-year GWP = 84
0
100
200
300
400
2019
~380 1871
62
0 ~235
NDCs Fossil Ag, Waste Gap 2030-1.5°Ccompatible
Highly feasible actions to reduce methane can deliver an additional ~130 MtCH₄ (3.5-11 GtCO₂e) beyond current NDCs in 2030
Key actions~ 130 MtCH
Sector potential scaled down based on likely overlap to avoid double
counting with NDCs
0
10
20
30
40
2019 NDCs Fossil Ag, Waste Gap 2030-1.5°Ccompatible
Sector potential scaled down based on likely overlap to avoid double
counting with NDCs33 1.5 6
5
0 20
Key actions~ 11 GtCOe
Based on 100-year GWP = 28
0
10
20
2019 NDCs Fossil Ag, Waste Gap 2030-1.5°Ccompatible
10 0.5 1.91.7
0 6.6
Key actions~ 3.5 GtCOe
NOTE: NDC emissions reductions are based on average of CAT “pledges and targets” pathway adjusted for CH₄. 1.5C compatible levels in 2030 are based on IPCC 1.5C no/low overshoot scenario median.
SOURCE: IPCC (2018), Global warming of 1.5°C. An IPCC Special Report, Climate Action Tracker (CAT), SYSTEMIQ analysis for the Energy Transitions Commission (2021).
Highly feasible actions to reduce carbon dioxide can deliver an additional ~17 GtCO₂ reductions beyond current NDCs in 2030Global CO₂ emissions
Gt CO₂, Global, annual
50
40
30
20
10
02030-BAU
> 40
Achievedby NDCs
Nature-based solutions (including carbon removals)
Power Road Supply sidedecarbonisationin other sectors
Energy andresourceefficiency
Gap 2030 - 1.5°Ccompatible
(CAT average)
NOTE: 2030 BAU CO₂ emissions are estimated based on CAT CO₂e 2030 BAU average (53GtCO₂e) minus current methane levels in GWP=25 terms (9.3 GtCO₂e). NDC emissions reductions are estimated based on average of CAT “pledges and targets” pathway adjusted for CO₂. 1.5°C and 2°C compatible levels in 2030 are based on IPCC 1.5°C no/low overshoot scenario ranges.
SOURCE: IPCC (2018), Global warming of 1.5°C. An IPCC Special Report, Climate Action Tracker (CAT), SYSTEMIQ analysis for the Energy Transitions Commission (2021).
2019
> 252°C
~19-241.5°C
3
6.6
3.52.3
2.12.5
~2Key actions~ 17 GtCO₂
Sector potential scaled down based on likely overlap to avoid double counting with NDCs
EBIT = Energy, Buildings, Transport and Industry
Key EBIT actions~ 10 GtCO₂
Keeping 1.5°C Alive – Closing the Gap in the 2020s56

Keeping 1.5°C Alive – Closing the Gap in the 2020s 57

Chapter 6
Actions at and after COP26
Keeping 1.5°C Alive – Closing the Gap in the 2020s58

By COP26 the submitted NDCs are likely to fall well short of what is required to put the world on a 1.5°C compatible pathway. But this report has identified a suite of technically and economically feasible actions which could be implemented during the 2020s to deliver sufficient reductions by 2030 to make a 1.5°C limit still attainable. A comprehensive summary of these actions is presented in the tables at the end of this section.
The ideal outcome of COP26 would therefore be a set of collaboration efforts between leading countries, companies and other actors which – building on the NDCs – would accelerate action to deliver the six categories of additional reductions. For many of the actions identified in this report, initiatives are already underway, driven by the COP26 Presidency and the High-Level Champions (such as initiatives on phasing out coal in power generation, nature-based solutions and road transport)75.
Implementing these initiatives is a challenging but plausible aim for COP26 and beyond. However even if implemented, the current initiatives will not be sufficient to close the entirety of the gap in the way which Exhibit 32 suggests is possible. But they could catalyse a process which could close the gap over the next few years. This process could entail:
• Gaining widespread agreement that the six categories of action identified in this report are in principle feasible and economically affordable, and that the world should seek to agree action programmes for each category as soon as possible;
• Launching processes at COP26 which will drive further progress on the highest priority actions, for instance by gaining international agreement to establish an independent monitoring and reporting process for methane emissions along with targets for methane emissions reduction;
• Gaining agreement to a high level approach which could ensure tightening of future NDC commitments, reflecting progress on the actions and agreements identified in this report, which will be subject to the UNFCCC stock take in 2023.
Key outcomes at COP26 are:
• Country and company to cut global fossil methane emissions by 60% in the 2020s (building on the Global Methane Pledge).
• Country and company commitments to cut non fossil methane emissions by 30% in the 2020s, building on the Global Methane Pledge.
• Strong agreement on ending deforestation and driving ecosystem restoration, supported by clear commitments for international climate finance from developed nations.
• Strong agreement between major countries to move beyond coal in the 2020s, with clear commitments to no new coal, and developed country support for early exit.
• Strong agreement to commit to ending sales of light-duty ICE vehicles by 2035 at the latest, supported by clear targets from countries, cities and auto manufacturers.
• Strong agreement between countries, companies and sectoral organisations for accelerated decarbonisation of the steel, cement, aviation and shipping sectors.
• Strong agreement to make energy and resource efficiency key features of future NDCs, supported by adoption of best-in-class building standards, product efficiencies.
75 For example, The Race to Zero campaign commits those companies that sign up, across all sectors, to halving emissions by 2030 and achieving net zero emissions as soon as possible - and by 2050 at the latest. The Powering Past Coal Alliance secures commitments to phase out existing coal power from national governments, and subnational actors. The actions identified here can be driven in part through initiatives like this.
Keeping 1.5°C Alive – Closing the Gap in the 2020s 59

Key actions at international, national and company level to keep Paris Agreement aims in reach
Additional feasible potential by 2030 beyond NDCs
6.6 GtCO Nature-based solutions
Commitments to standardised international satellite monitoring programmes for methane emissions measurement
Clear and ambitious commitments from companies (e.g. going beyond OGCI’s goal of 20% reduction by 2025) to take actions and deploy technologies (e.g. replacement of pumps, electric motors, and other devices, installation of new emissions control devices such as vapour recovery units, deploying leak detection and repair)
Individual action encouraged by government and industry public awareness campaigns to scale adoption of plant-rich diets
Commitment to develop labelling for low-methane meat, milk, and rice, and work with value chain to set low-methane standards,
Support for development of alternative proteins
Industry commitments to reducing food waste arising on farms and in transit, e.g. via technology to improve supply chain effectiveness and procurement standards
Investment in wastewater treatment, particularly in developing countries enabled by development finance
Investment in waste collection, including separating organic and non-organic wastes, and recyclables
Commitment to phase out policy support for intensive livestock farming and distorting subsidies
Commitment to halt deforestation (esp. in Brazil, Indonesia, DRC), supported by financial support from developed countries (e.g. via Green Climate Fund, debt for nature swaps, grants)
Expansion of carbon market mechanisms, including Voluntary, non-Voluntary (e.g. EU ETS, CORSIA) with full accounting of land-use emissions and for high-quality, additional offsets
Commitment to eliminating distorting agricultural subsidies (e.g. soy, palm) and support for high-yield crops improving agricultural productivity
Commitments to accelerate standards and guidelines for CO2 storage development and appraisal process, sustainability of biomass feedstock
Promote diet shift, “healthier calories”, and reduced consumption particularly in developed countries
Commitments to develop deforestation-free supply chains, building on existing initiatives (e.g. FACT Dialogue), and supported by due diligence standards, technology adoption for supply chain traceability, and individual action and public campaigns to scale deforestation-free consumption
Increase reforestation via leader-level pledges, building on initiatives (e.g. REDD+, Bonn Challenge), in line with high integrity standards (e.g. IUCN)
Strong national regulations, starting in the top emitting countries, specifying maximum acceptable leak rates (well below 1%) and applying large fines for excess leaks
Demand-side pressure from large bloc-buyers setting maximum acceptable leak rates
Certification schemes which can enable customers to assess the full climate impact of oil or gas consumption (e.g. MIQ)
Clear commitments by the financial sector to cease funding oil and gas companies which fail to meet appropriate methane reduction standards
Accelerating reductions from methane - Fossil sector
71 MtCH Accelerating reductions from methane - Agriculture and Waste sector
62 MtCH
Keeping 1.5°C Alive – Closing the Gap in the 2020s60

Decarbonising the power sector
Energy and resource efficiency
Decarbonising road transport
Supply-side decarbonisation in other sectors
Global commitments to adopt best-in-class building & appliance efficiency (e.g. via C40 Net-Zero Buildings Declaration, C40 Construction Declaration, Super Efficient Equipment & Appliance Deployment, PECA, Kigali Cooling Efficiency Programme) and fiscal support for retrofits
Commitments from major cities to develop net zero mobility plans, decreasing the need for individual road transport (e.g. via Cities Race to Zero, C40 Green and Healthy Streets Declaration)
Commitments to increase taxation of business class flights and short-haul flights and commitments to reducing flying
Separate collection of waste and recyclables and recycling/collection targets, commitments to repair, light weighting targets, supply chain transparency
Commitments from major cities to develop net zero mobility plans, decreasing the need for individual road transport (e.g. via Cities Race to Zero, C40 Green and Healthy Streets Declaration)
Introduce policy support to overcome “green cost premiums” via:
Light-duty ICE sales bans by 2035, and commitments from major automakers for 100% zero-emission vehicles by 2035
Commitments to 100% new EV purchases in corporate and mobility fleets by 2030 at the latest (e.g. via EV100)
Commitment to stringent fleet-wide fuel efficiency standards for cars, vans and HGVs in gCO2/km from the 2020s
Remove subsidies for petrol and diesel, maintain or increase taxation on petrol and diesel to create incentives for heavy-duty transition
Commitments to EV charging infrastructure rollout with clear international standards, alongside potential road tolls and fees for ICE vehicles, scrappage schemes for ICE vehicles
Bans and restrictions on use of ICE light duty vehicles in major cities aiming for comprehensive bans in most major cities (reinforcing and accelerating the Cities Race to Zero and the C40 Green and Healthy Streets Declaration)
Strengthening of IMO 2050 target for 50% reduction to net zero with strong 2030 reduction target and supporting policy measures (e.g carbon price, zero carbon fuel mandate)
Strengthening of ICAO 2050 target for 50% reduction to net zero with strong 2030 reduction target and supporting policy measures (e.g carbon price, zero carbon fuel mandate)
National/ regional commitments from public and private stakeholders to develop green hydrogen capacity (e.g EU commitment to 40 GW by 2030, Green Hydrogen Catapult objective of 25GW by 2026), and regulations to switch existing hydrogen use to clean hydrogen
Commitments to phasing out the use of gas boilers in new builds by 2025, and to support heat pump deployment and technological advance
Commitment to 2030 unabated coal phase out in OECD (e.g. via Powering Past Coal Alliance), alongside support for Just Transition strategies
Commitment to halt new coal projects (esp. in China and India)
Targeted financial support from developed countries for early coal retirement in developing countries (e.g. India), e.g. via commitments from Green Climate Fund and/or via philanthropic/private sector capital
Commitments to increased corporate procurement of renewables, via initiatives such as RE100, in addition to government-set quantitative targets for growth of zero-carbon generation and reduction of grid carbon intensity (gCO2/kWh)
Immediate commitments not to finance new coal power plants, new coal mines or coal mine extensions, and to cease financing companies in coal mining during the 2020s
Immediate end to fossil fuel subsidies alongside redistributive measures
Introduction and extension of carbon pricing
3.5 GtCO 2.3 GtCO
2.1 GtCO
2.5 GtCO
Carbon pricing, quantitative fuel mandates and contracts for difference Public procurement (or voluntary/ encouraged private procurement) of decarbonised materials (e.g building on Clean Energy Ministerial Industrial Deep Decarbonisation InitiativeRegulated product standards – carbon emissions intensity of materials (e.g. steel or cement), or lifecycle emissions standards on end-products (e.g. auto, white goods) to create markets for decarbonised materials
•
•
•
Keeping 1.5°C Alive – Closing the Gap in the 2020s 61
Acknowledgements
The team that developed this report comprised:
Lord Adair Turner (Chair), Faustine Delasalle (Director), Ita Kettleborough (Deputy-Director), Mike Hemsley (Head of Analysis), Elena Pravettoni (Lead author), Sanna O’Connor-Morberg, Serena Ho, Tommaso Mazzanti, Hettie Morrison, Caroline Randle, Alasdair Graham, Scarlett Benson, Julia Okatz, Mark Meldrum, Julia Turner, Rob Campbell-Davis, Kash Burchett, Andreas Wagner, Carlos Agnes, Maximilian Held, Rafal Malinowski, Michael Kast, John-Henry Charles, Marco van Veen, Liesbeth Huisman (SYSTEMIQ).
The team would also like to thank the ETC members and experts for their active participation:
Rajit Nanda (ACWA Power); Elke Pfeiffer (Allianz); Javier Bonaplata, Nicola Davidson (ArcelorMittal); Abyd Karmali (Bank of America); Paul Bodnar (Blackrock); William Zimmern (BP); Jeanne Ng (CLP); Rob Kelly (Climateworks Australia); Dana Barsky (Credit Suisse); Bin Lyu (Development Research Center of the State Council); Tanisha Beebee (DRAX); Adil Hanif (EBRD); Michael Ding (Envision); Rebecca Collyer, Pete Harrison, John Lucas, Claire Muurmans, Phillip Niessen (European Climate Foundation); Patrick Curran (Grantham Institute, London School of Economics); Matt Gorman (Heathrow Airport); Andrea Griffin, Abhishek Joseph (HSBC); Francisco Laveran (Iberdrola); Chris Dodwell (Impax Asset Management); Yanan Fu (Institute of Climate Change and Sustainable Development, Tsinghua University); Ben Murphy (IP Group), Christopher Kaminker (Lombard Odier); Charles Liang, Jinpeng Ma (LONGi Solar); Ben Abraham (Modern Energy); Matt Hinde (National Grid); Emil Damgaard Gann (Ørsted); Aditi Garg (ReNew Power); Xavier Chalbot, Jonathan Grant (Rio Tinto); Elizabeth Hartman (RMI); Charlotte Brookes, Mallika Ishwaran (Royal Dutch Shell); Emmanuel Normant (Saint Gobain); Emmanuelle Simonet, Vincent Minier, Vincent Petit (Schneider Electric); Elham Ali, Tracey Crowe, Brian Dean (SE4All); Camilla Palladino (SNAM); Jesper Kansbod, Martin Pei (SSAB); Matt Beasley (Silicon Ranch); Alistair McGirr (SSE); Abhishek Goyal (Tata Group); Madhulika Sharma (Tata Steel); A K Saxena (TERI); Reid Detchon (United Nations Foundation); Mikael Nordlander (Vattenfall); Rowan Douglas (Willis Towers Watson); Johan Engebratt, Niklas Gustafsson (Volvo Group); Rasmus Valanko (We Mean Business); Jennifer Layke, Taryn Fransen, Richard Waite, Katie Lebling, Fred Stolle (World Resources Institute), Mark Trueman (Worley).
The team would also like to thank the ETC’s broader network of experts for their input:
BCG, BEIS (James Foster, Stephen Devlin, Carolina Salvaterra, Sam Karslake), Climate Action Tracker (Claire Stockwell, Matthew Gidden, Claire Fyson), COP26 High Level Champions, the COP26 Strategy Unit, DEFRA (Ruth Davis, Catriona Moss, Felicity McCourt, Alfred Casson), E3G (Nick Mabey, Larissa Gross, Leo Roberts, Chris Littlecott, Chris Radojewski, Camilla Fenning), ECIU Richard Black), Grantham Institute (Nick Stern), Greenpeace (Jennifer Morgan), GSCC (Ria Voorhaar, Ed King, Tom Brookes), SYSTEMIQ (Janez Potocnik, Jeremy Oppenheim, Guido Schmidt-Traub, Irena Spazzapan, Ben Dixon, Morten Rosse), UCL (Simon Lewis), WRI (Graham Wynne), WWF (Manuel Pulgar-Vidal, Dean Cooper).
Keeping 1.5°C Alive – Closing the Gap in the 2020s62

Keeping 1.5°C Alive – Closing the Gap in the 2020s 63