Embed Size (px)
Citation preview
ENGINEER - Vol. XXXIX, No. 02, pp. 42-49,2006 © The Institution of Engineers, Sri Lanka
The following paper rece ived . . .
Kelani Ganga Conservation Barrage and Results of Model Studies
N.K.M. Nanseer and S.G.G. Rajkumar
Abstract: Kelani Ganga is the main source of water supply for domestic and industrial areas around Colombo, Sri Lanka. An extraction rate of 6.0m3/s (114mgd) is presently necessary at the Ambatale intake on the Kelani Ganga and it is planned to increase this to 12m3/s in the future to cater for the natural increase of demand and for extending the supply to a wider area. However, pumping at the Ambatale intake has been occasionally suspended due to salinity intrusion during dry periods and this has been an increasingly frequent occurrence at this intake due to various reasons. The construction of a conservation barrage downstream of the Ambatale intake has been identified as the most feasible solution to this problem. However, one of the major impacts that could result from the construction of a conservation barrage is that it might cause an unacceptable rise in flood levels upstream.
A mathematical model study was conducted to assess the impact of the proposed conservation barrage on flood levels in the Kelani Ganga. This model was based on an earlier flood model study carried out in 1992, and updated using the latest river cross-sections. The model also benefited from the results of a physical model study, which was carried out to optimise the scour and the siltation patterns, and improve the hydraulic performance of the conservation barrage.
There has been a rapid lowering of the bed level of the Kelani Ganga since the 1960s because of increased sand mining. The Kelani Ganga Flood Study of 1992 concluded that this decline, though it had a beneficial effect of lowering the low and medium flood levels, kept the high flood levels (eg. similar to levels in 1947) unchanged. However, the present study shows that further deepening of the river in the last 12 years has an effect even on the high flood levels.
The combined physical and mathematical model study was used to predict the water level rise due to the construction of the conservation barrage at Ambatale and to investigate the impact of changes in channel geometry on flood levels. Some historical floods and constant discharges were used for this analysis. This paper describes the results of the mathematical model making reference to the impact of sand mining on flood levels.
Key words: Conservation Barrage, Mathematical Model, Physical Model, Flood Level Rise, Sand Mining.
1. Introduction
The Kelani Ganga is the third major river in Sri Lanka with a catchment area of 2,229km 2 and an average annual runoff of 5,500 MCM. It is the main source of the domestic and industrial water supply for the Colombo area and around 80% of the greater Colombo area is supplied from it. Salinity intrusion has become an ever-increasing problem in the lower reach of the Kelani Ganga and it has threatened the Ambatale water intakes several times in the past. The seriousness of the problem of salinity at Ambatale had been recognized for two decades and the problem has been aggravated due to the increased demand for the Greater
Colombo area, continued sand mining and the lowering of dry season flows.
In 1993, a study by the Danish Hydraul ic Inst i tute (DHI) and the Lanka Hydraul ic Institute (LHI) found that unacceptable salinity levels would occur if the river discharge downstream of Ambatale falls below 3 3 m 3 / s and recommended the construction of a barrage as it will not be possible to sustain this discharge at all times.
Eng. N KM Nanseer. BSc. Eng.. MSc. (Hydrology and Water Resource). AMIESL. Water Resources Specialist. LHI Eng. SCG Rajkumar. BScEng.. MEng (Construction Management). MBA. MIESL, Project Director. Natimal Water Supply & Drainage Board
ENGINEER 42
I
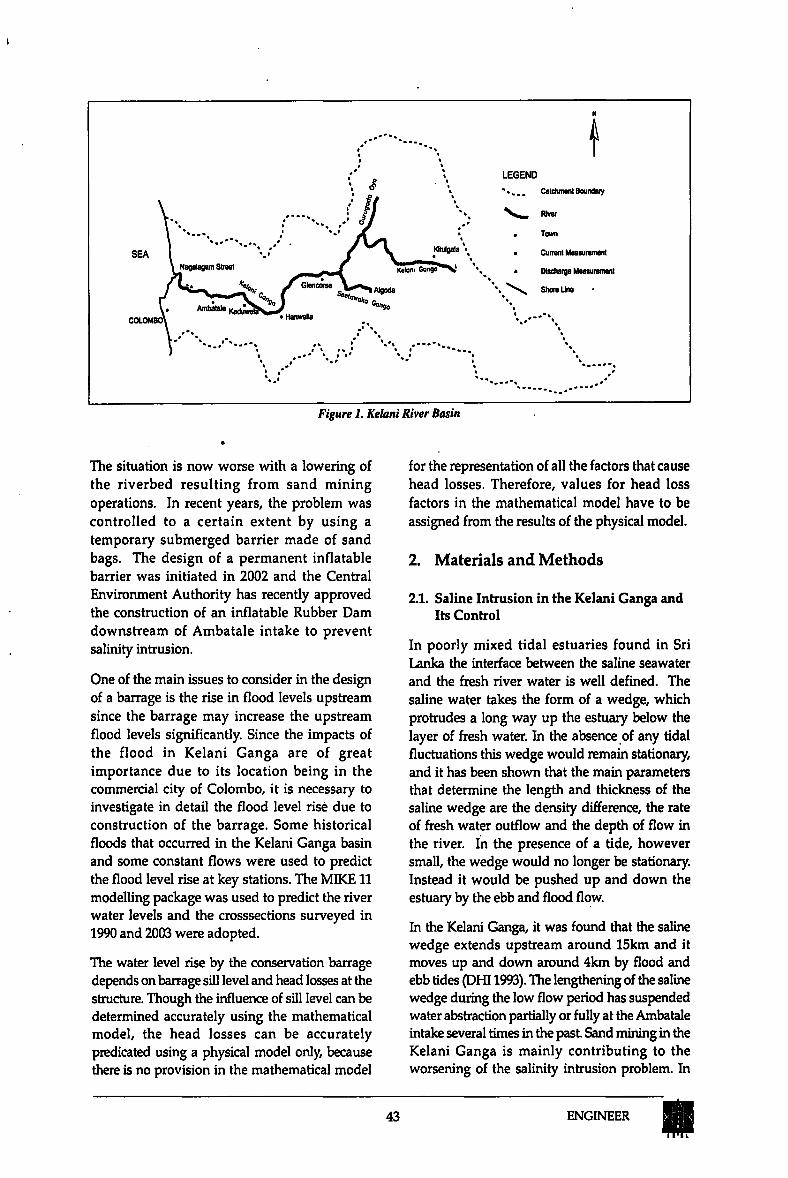
The situation is now worse with a lowering of the riverbed resul t ing from sand mining operations. In recent years, the problem was controlled to a cer tain extent by using a temporary submerged barrier made of sand bags. The design of a permanent inflatable barrier was initiated in 2002 and the Central Environment Authority has recently approved the construction of an inflatable Rubber Dam downstream of Ambatale intake to prevent salinity intrusion.
One of the main issues to consider in the design of a barrage is the rise in flood levels upstream since the barrage may increase the upstream flood levels significantly. Since the impacts of the flood in Kelani Ganga are of great importance due to its location being in the commercial city of Colombo, it is necessary to investigate in detail the flood level rise due to construction of the barrage. Some historical floods that occurred in the Kelani Ganga basin and some constant flows were used to predict the flood level rise at key stations. The MIKE 11 modelling package was used to predict the river water levels and the crosssections surveyed in 1990 and 2003 were adopted.
The water level rise by the conservation barrage depends on barrage sill level and head losses at the structure. Though the influence of sill level can be determined accurately using the mathematical model, the head losses can be accurately predicated using a physical model only, because there is no provision in the mathematical model
for the representation of all the factors that cause head losses. Therefore, values for head loss factors in the mathematical model have to be assigned from the results of the physical model.
2. Materials and Methods
2.1. Saline Intrusion in the Kelani Ganga and Its Control
In poorly mixed tidal estuaries found in Sri Lanka the interface between the saline seawater and the fresh river water is well defined. The saline water takes the form of a wedge, which protrudes a long way up the estuary below the layer of fresh water. In the absence of any tidal fluctuations this wedge would remain stationary, and it has been shown that the main parameters that determine the length and thickness of the saline wedge are the density difference, the rate of fresh water outflow and the depth of flow in the river. In the presence of a tide, however small, the wedge would no longer be stationary. Instead it would be pushed up and down the estuary by the ebb and flood flow.
In the Kelani Ganga, it was found that the saline wedge extends upstream around 15km and it moves up and down around 4km by flood and ebb tides (DHI1993). The lengthening of the saline wedge during the low flow period has suspended water abstraction partially or fully at the Ambatale intake several times in the past. Sand mining in the Kelani Ganga is mainly contributing to the worsening of the salinity intrusion problem. In
43
1990 it w a s rea l ized that p u m p i n g had to be
shutdown during the dry periods unless salinity
intrusion was some h o w controlled. It resulted
in the cons t ruc t ion o f a t e m p o r a r y s and bag
barrier downst ream of the Ambata le intake.
A p e r m a n e n t s o l u t i o n to c o n t r o l s a l i n i t y
intrusion into the in take is the shifting of the
intake upstream of the r iver beyond the reach of
the s a l i n i t y w e d g e . F o r s u c h a s o l u t i o n the
Amba ta l e i n t ake had to be shifted to Pugoda
loca ted abou t 32 k m u p s t r e a m o f A m b a t a l e .
However , siting the comple te extraction works
in a different location would be a lengthy, costly
and unnecessary exercise, wi th the potential for
increased environmenta l and social damage due
to the extensive pipel ine works that would be
required. T h e o ther pe rmanen t solut ion is the
construct ion of a reservoir upst ream to ensure
min imum flow ( 3 3 m 3 / s ) required to push down
the s a l i n i t y w e d g e . B u t , it r e q u i r e s t he
acquisit ion of a large extent of land and could be
costly compared to the construct ion of a salinity
barrage just downs t ream of the intake location.
A sal ini ty ba r rage cou ld be a f ixed wei r or a
gated regulator structure or an inflatable rubber
d a m a n d f a c t o r s s u c h a s f l o o d l e v e l r i s e ,
navigat ion etc. shou ld be cons idered to select
the suitable barrage type.
In the last ten years several studies were carried
out to decide the feasibi l i ty of cons t ruc t ing a
permanent salinity barrage and now it is found
that such a structure is the most suitable solution
for the Kelani Ganga to control salinity intrusion
s ince it costs less compared to other solut ions
such as shifting the intake to Pugoda etc. and it
h a s a l o w e r i m p a c t o n t h e e n v i r o n m e n t .
However , a bar rage is normal ly cons idered to
have a detr imental impact on fisheries, on the
transport of solids and affects changes in erosion
wi th in the r iver channe l , as wel l as be ing an
impedance to navigation. A high, fixed barrage
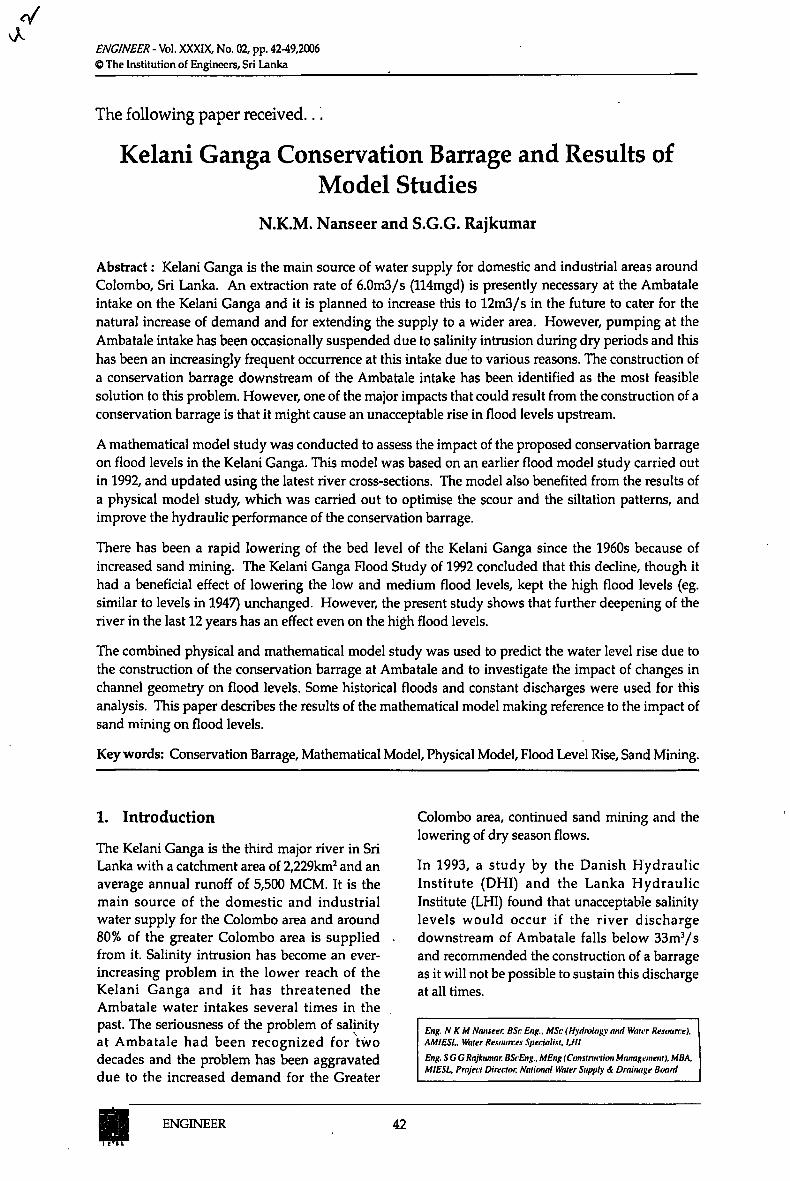
Figure 2: Salinity Barrage location Map
w o u l d ce r t a in ly lead to c o n c e r n on all these
points. However , the use of an inflatable barrage
al lows considerable flexibility in the operat ion
of the barrage, and will al low the river to flow
m o r e or l e s s n o r m a l l y . F i g u r e 2 s h o w s the
location of the barrage.
2.2. Flooding in the Kelani Ganga and Its Impacts
The Kelani G a n g a has been subjected to many historical f loods. Very heavy s to rms occurred several times, like in 1832, Oct 1913, May 1927, May 1928, Oct 1930, May 1933, May 1936, May 1937, May 1939, May 1940, Aug 1947, Oct 1966, Oct 1967 and June 1989 and have caused the lower catchment to suffer from flash floods. These floods have caused the loss of human lives and houses and damages to houses and properties. In the past it was also observed that the impacts of, flood levels have particularly increased in the Kelani Ganga basin due to the encroachment of structures in the flood plain, such as constructions across the river, etc.. However, it is also observed that there was a drop in the flood level due to the lowering of the river bed resulting from sand mining in the Kelani Ganga.
Dha rmasena (1989) has noted classif ication of floods in the Kelani Ganga based on the water level at Naga l agam Gaug ing station (closer to Colombo) and it is shown in Table 1.
Based on this classif icat ion major floods have o c c u r r e d in 1 9 5 6 , 1 9 6 6 , 1 9 6 7 a n d 1 9 8 9 , D a n g e r o u s f loods h a v e occur red in 1913 and 1940 and a Critical flood has occurred in 1947. Thus, flooding in the Kelani Ganga has a long history and sufficient at tention has to be paid when any issue that influences the flood impact is considered.
Table 1: Classification of flood
Classification Water Level at Nagalagam Str.
Minor Flood Major Flood Dangerous Flood Critical Flood
> 5 feet above M S L > 8 feet above M S L > 10 feet above M S L > 12 feet above M S L
2.3. Model Description
The M I K E 11 software developed by the Danish Hydraul ic Institute has been used to predict the wate r levels and d ischarges of rainfall events and constant flows. The Kelani river system was
Si1!?: ENGINEER 44
originally set up by DHI in 1991 to assess the existing level of protection against flooding and to evaluate the feasibility of alternative options for improved protection (DHI 1992). This model has been later used in 1993 and 2000 for salinity intrusion studies and flood impact studies respectively. The conservation barrage was incorporated in the model downstream of Ambatale intake for both flood studies and salinity s tudies . For all these s tudies crosssections surveyed in 1990 had been used.
Since it was evident that changes in the river geometry had taken place in the last thirteen years that could alter the flood levels and the conveyance capacity of the Kelani Ganga, the model was updated using crosssect ions surveyed in 2003. The resurvey of crosssections covers the river stretch from Hanwella (Chainage 60 .06 km) to downstream of Ambatale (chainage 80.80 km). The surveying was restricted to only this stretch of the river since, during the previous studies (eg. Western River Basins Sec tor Project , 2000) , it was revealed that even for a 100 year return period flood only this reach of the river could be influenced by the construction of a barrage at Ambatale. It is also reported that bed degradation had mostly occurred between Hanwella and Ambatale during the time period from 1990 to 2000. Comparison of river bed levels surveyed in 2003 with that surveyed in 1990 showed that there is around 1.23m drop of the bed levels (LHI 2003).
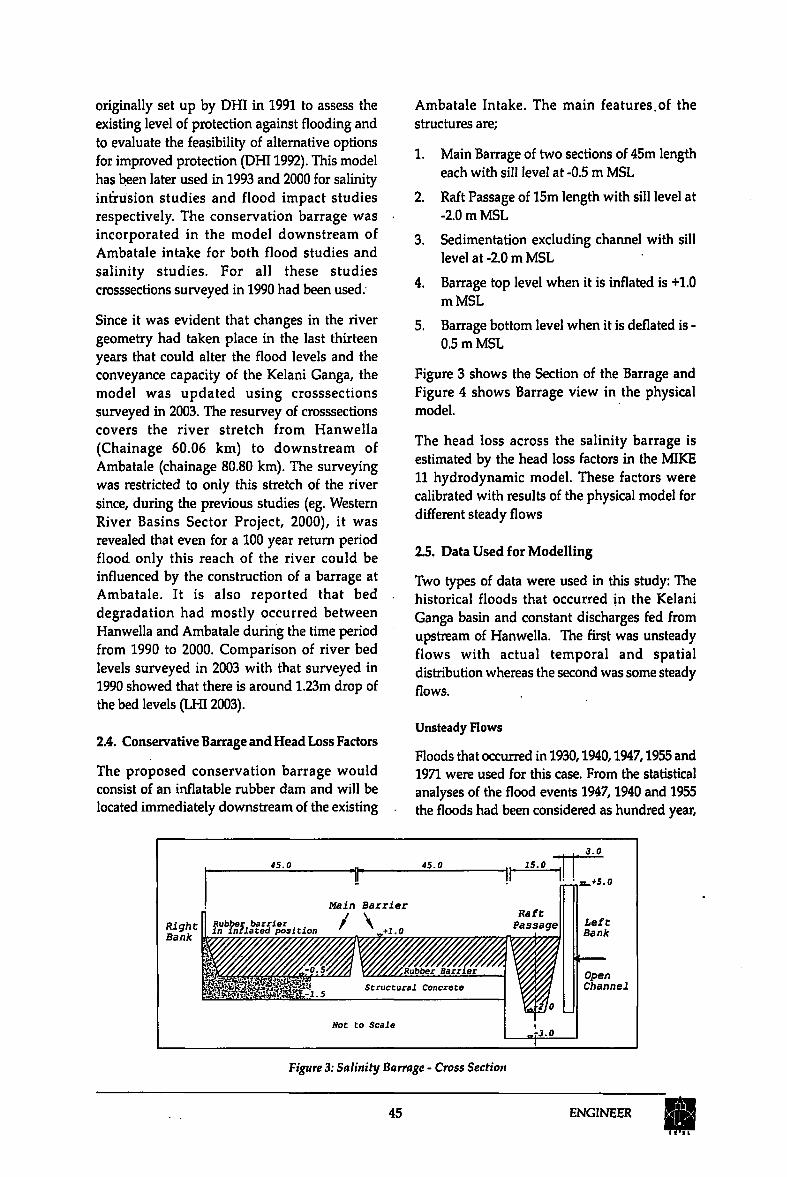
2.4. Conservative Barrage and Head Loss Factors
The proposed conservation barrage would consist of an inflatable rubber dam and will be located immediately downstream of the existing
Ambatale Intake. The main features.of the structures are;
1. Main Barrage of two sections of 45m length each with sill level at -0.5 m MSL
2. Raft Passage of 15m length with sill level at -2.0 m MSL
3. Sedimentation excluding channel with sill level at-2.0 m MSL
4. Barrage top level when it is inflated is +1.0 m M S L
5. Barrage bottom level when it is deflated is -0.5 m M S L
Figure 3 shows the Section of the Barrage and Figure 4 shows Barrage view in the physical model.
The head loss across the salinity barrage is estimated by the head loss factors in the MIKE 11 hydrodynamic model. These factors were calibrated with results of the physical model for different steady flows
2.5. Data Used for Modelling
Two types of data were used in this study: The historical floods that occurred in the Kelani Ganga basin and constant discharges fed from upstream of Hanwella. The first was unsteady flows with actual temporal and spatial distribution whereas the second was some steady flows.
Unsteady Flows
Floods that occurred in 1930,1940,1947,1955 and 1971 were used for this case. From the statistical analyses of the flood events 1947,1940 and 1955 the floods had been considered as hundred year,
45.0 45.0 15.0
Right Bank
Rubber barrier in inflated position
Main Barrier
+1.0
Raft
Passage
Hot to Scale
3.0
.+5.0
Left Bank
Open Channel
Figure 3: Salinity Barrage - Cross Section
45 ENGINEER
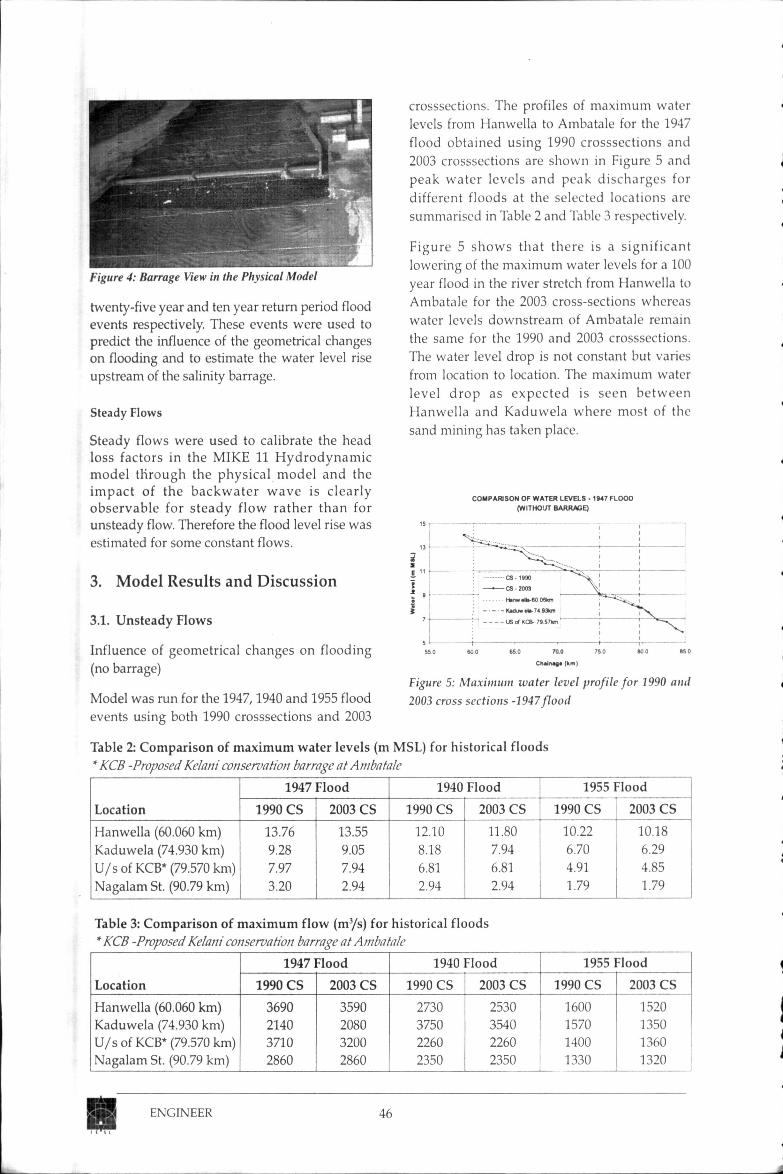
Figure 4: Barrage View in the Physical Model
twenty-five year and ten year return period flood events respectively. These events were used to predict the influence of the geometrical changes on flooding and to est imate the water level rise upstream of the salinity barrage.
Steady F lows
Steady f lows were used to ca l ibra te the head loss f ac to r s in t he M I K E 11 H y d r o d y n a m i c m o d e l t h r o u g h the p h y s i c a l m o d e l a n d the i m p a c t o f t h e b a c k w a t e r w a v e is c l e a r l y o b s e r v a b l e for s t e a d y f l o w r a t h e r t h a n for unsteady flow. Therefore the flood level rise was est imated for some constant flows.
3. Model Results and Discussion
3.1. Unsteady Flows
Inf luence o f geomet r i ca l c h a n g e s on f looding (no barrage)
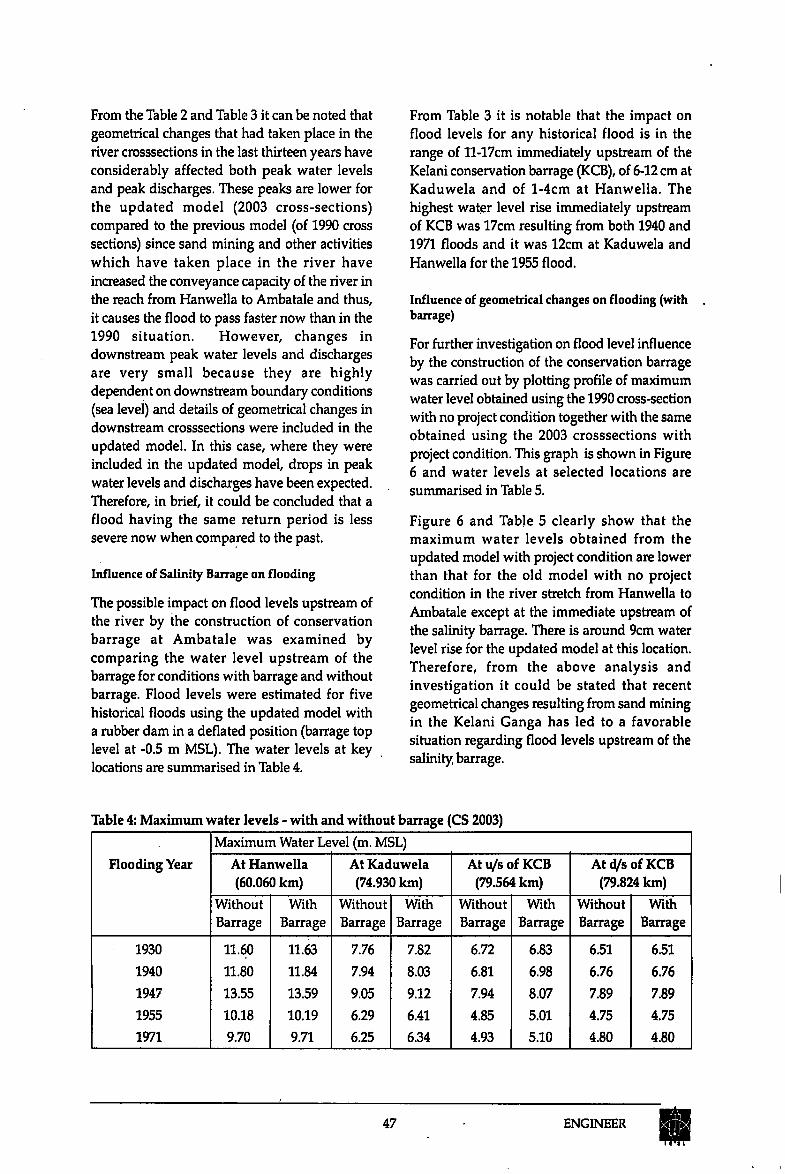
Model was run for the 1 9 4 7 , 1 9 4 0 and 1955 flood events using both 1990 crosssect ions and 2003
crosssect ions . T h e profiles of m a x i m u m water
levels from Hanwel la to Ambata le for the 1947
flood o b t a i n e d us ing 1 9 9 0 c r o s s s e c t i o n s and
2003 c rosssec t ions are shown in Figure 5 and
p e a k w a t e r l e v e l s a n d p e a k d i s c h a r g e s for
different f loods at the se lec ted l oca t i ons are
summarised in Table 2 and Table 3 respectively.
F i g u r e 5 s h o w s t h a t t h e r e is a s i g n i f i c a n t
lowering of the m a x i m u m water levels for a 100
year flood in the river stretch from Hanwel la to
A m b a t a l e for the 2003 c ross -sec t ions whereas
water levels downs t r eam of Amba ta l e remain
the same for the 1990 and 2003 crosssec t ions .
The water level drop is not constant but varies
from location to location. The m a x i m u m water
l e v e l d r o p as e x p e c t e d is s e e n b e t w e e n
H a n w e l l a and K a d u w e l a w h e r e m o s t o f the
sand mining has taken place.
C O M P A R I S O N O F W A T E R L E V E L S • 1*47 F L O O D
(WITHOUT B A R R A G E )
1 CS-1990 .
1 • CS20O3 » n w«»>-60C* W n
Kaduwtto-74.93en
us o< KC8- n.snm —v. ; i 1 . 1 r '
ChainaQ* (hm)
Figure 5: Maximum water level profile for 1990 and
2003 cross sections -1947flood
Table 2: Comparison of maximum water levels (m MSL) for historical floods * KCB -Proposed Kelani conservation barrage at Ambatale
1947 Flood 1940 Flood 1955 Flood
Location 1990 C S 2003 C S 1990 C S 2003 C S 1990 C S 2003 C S
Hanwella (60.060 km) 13.76 13.55 12.10 11.80 10.22 10.18
Kaduwela (74.930 km) 9.28 9.05 8.18 7.94 6.70 6.29
U / s of KCB* (79.570 km) 7.97 7.94 6.81 6.81 4.91 4.85
Nagalam St. (90.79 km) 3.20 2.94 2.94 2.94 1.79 1.79
Table 3: Comparison of maximum flow (m'/s) for historical floods * KCB -Proposed Kelani conservation barrage at Ambatale
Location
19471 :Iood 1940 Flood 1955 Flood
Location 1990 C S 2003 C S 1990 C S 2003 C S 1990 C S 2003 C S
Hanwel la (60.060 k m ) Kaduwela (74.930 km) U / s of KCB* (79.570 km) Nagalam St. (90.79 km)
3690 2140 3710 2860
3590 2080 3200 2860
2730 3750 2260 2350
2530 3540 2260 2350
1600 1570 1400 1330
1520 1350 1360 1320
p ENGINEER 46
From the Table 2 and Table 3 it can be noted that geometrical changes that had taken place in the river crosssections in the last thirteen years have considerably affected both peak water levels and peak discharges. These peaks are lower for the updated model (2003 cross-sect ions) compared to the previous model (of 1990 cross sections) since sand mining and other activities which have taken place in the river have increased the conveyance capacity of the river in the reach from Hanwella to Ambatale and thus, it causes the flood to pass faster now than in the 1990 situation. However , changes in downstream peak water levels and discharges are very small because they are highly dependent on downstream boundary conditions (sea level) and details of geometrical changes in downstream crosssections were included in the updated model. In this case, where they were included in the updated model, drops in peak water levels and discharges have been expected. Therefore, in brief, it could be concluded that a flood having the same return period is less severe now when compared to the past.
Inf luence o f Sa l in i ty B a r r a g e o n f looding
The possible impact on flood levels upstream of the river by the construction of conservation barrage at Ambata le was examined by comparing the water level upstream of the barrage for conditions with barrage and without barrage. Flood levels were estimated for five historical floods using the updated model with a rubber dam in a deflated position (barrage top level at -0.5 m MSL). The water levels at key locations are summarised in Table 4.
From Table 3 it is notable that the impact on flood levels for any historical flood is in the range of l l -17cm immediately upstream of the Kelani conservation barrage (KCB), of 6-12 cm at Kaduwela and of l - 4cm at Hanwella . The highest water level rise immediately upstream of KCB was 17cm resulting from both 1940 and 1971 floods and it was 12cm at Kaduwela and Hanwella for the 1955 flood.
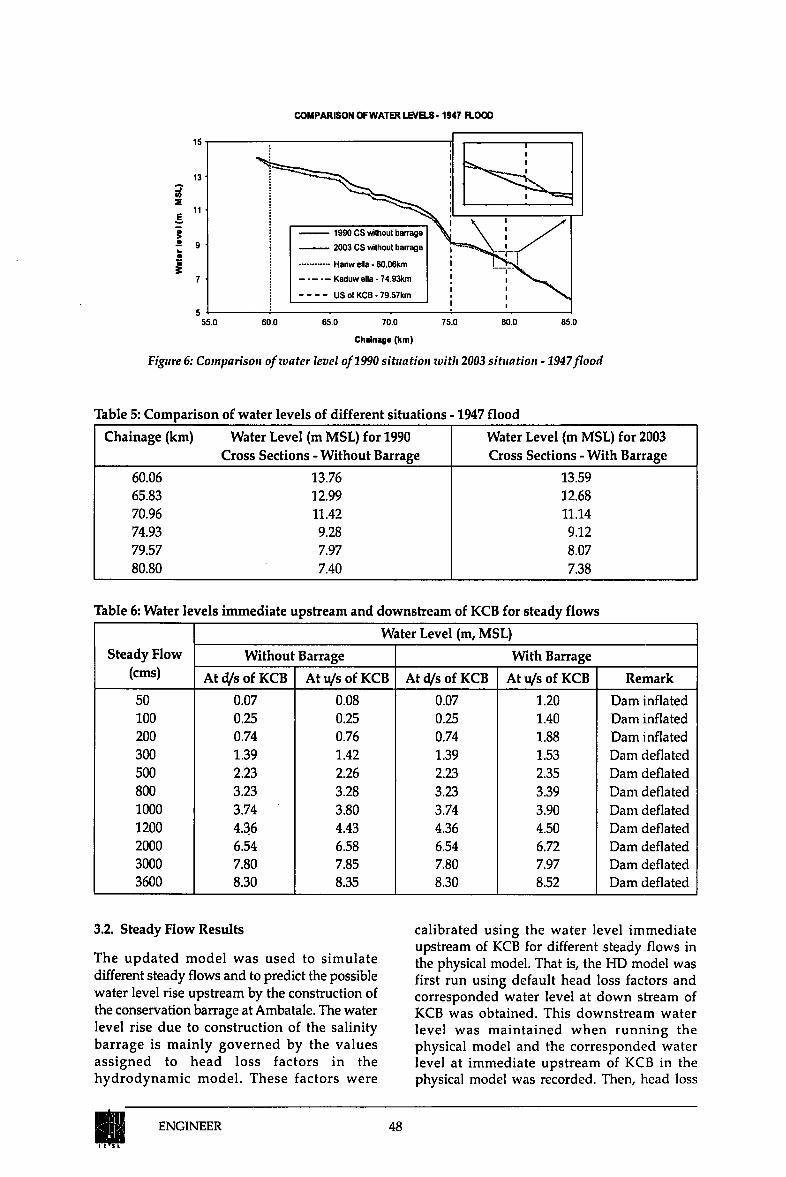
Inf luence o f g e o m e t r i c a l c h a n g e s o n f looding (with barrage )
For further investigation on flood level influence by the construction of the conservation barrage was carried out by plotting profile of maximum water level obtained using the 1990 cross-section with no project condition together with the same obtained using the 2003 crosssections with project condition. This graph is shown in Figure 6 and water levels at selected locations are summarised in Table 5.
Figure 6 and Table 5 clearly show that the maximum water levels obtained from the updated model with project condition are lower than that for the old model with no project condition in the river stretch from Hanwella to Ambatale except at the immediate upstream of the salinity barrage. There is around 9cm water level rise for the updated model at this location. Therefore, from the above analysis and investigation it could be stated that recent geometrical changes resulting from sand mining in the Kelani Ganga has led to a favorable situation regarding flood levels upstream of the salinity, barrage.
Table 4: Maximum water levels - with and without barrage (CS 2003)
Maximum Water Level (m. MSL)
Flooding Year At Hanwella (60.060 km)
At Kaduwela (74.930 km)
At u/s of KCB (79.564 km)
A t d / s o f KCB (79.824 km)
Without Barrage
With Barrage
Without Barrage
With Barrage
Without Barrage
With Barrage
Without Barrage
With Barrage
1930 11.60 11.63 7.76 7.82 6.72 6.83 6.51 6.51
1940 11.80 11.84 7.94 8.03 6.81 6.98 6.76 6.76
1947 13.55 13.59 9.05 9.12 7.94 8.07 7.89 7.89
1955 10.18 10.19 6.29 6.41 4.85 5.01 4.75 4.75
1971 9.70 9.71 6.25 6.34 4.93 5.10 4.80 4.80
47 ENGINEER
C O M P A R I S O N O F W A T E R L E V E L S - 1947 F L O O D
Z
s
55.0 60.0 75.0 80.0 85.0 65.0 70.0 Chainage (km)
Figure 6: Comparison of water level of 1990 situation with 2003 situation -1947flood
Table 5: Comparison of water levels of different situations -1947 flood
Chainage (km) Water Level (m MSL) for 1990 Cross Sections - Without Barrage
Water Level (m MSL) for 2003 Cross Sections - With Barrage
60.06 13.76 13.59 65.83 12.99 12.68 70.96 11.42 11.14 74.93 9.28 9.12 79.57 7.97 8.07 80.80 7.40 7.38
Table 6: Water levels immediate upstream and downstream of KCB for steady flows
Steady Flow (cms)
Water Level (m, MSL)
Steady Flow (cms)
Without Barrage With Barrage Steady Flow (cms) At d/s of KCB At u/s of KCB At d/s of KCB At u/s of KCB Remark
50 0.07 0.08 0.07 1.20 Dam inflated 100 0.25 0.25 0.25 1.40 Dam inflated 200 0.74 0.76 0.74 1.88 Dam inflated 300 1.39 1.42 1.39 1.53 Dam deflated 500 2.23 2.26 2.23 2.35 Dam deflated 800 3.23 3.28 3.23 3.39 Dam deflated 1000 3.74 3.80 3.74 3.90 Dam deflated 1200 4.36 4.43 4.36 4.50 Dam deflated 2000 6.54 6.58 6.54 6.72 Dam deflated 3000 7.80 7.85 7.80 7.97 Dam deflated 3600 8.30 8.35 8.30 8.52 Dam deflated
3.2. Steady Flow Results
The updated model was used to s imulate different steady flows and to predict the possible water level rise upstream by the construction of the conservation barrage at Ambatale. The water level rise due to construction of the salinity barrage is mainly governed by the values assigned to head loss factors in the hydrodynamic model . These factors were
calibrated using the water level immediate upstream of KCB for different steady flows in the physical model. That is, the HD model was first run using default head loss factors and corresponded water level at down stream of KCB was obtained. This downstream water level was maintained when running the physical model and the corresponded water level at immediate upstream of KCB in the physical model was recorded. Then, head loss
E N G I N E E R 48
factors in HD model were adjusted until the same water level of the physical model at the immediate upstream of KCB was obtained. Once, these factors were calibrated they were fixed when running the HD model for other steady flows. However, two different set of head loss factors were found in calibration; one for the flow within the bank (<1400m3/s) and other for the flow over bank ( > 1 4 0 0 m 3 / s ) . The calibrated head loss factors were later used to simulate the historical floods and to predict the likely water level rise at the upstreams of KCB. Water levels for such events are already presented in section 3.1.
The different steady flows considered were 50, 100, 200, 300, 500, 1000, 1200, 2000, 3000 and 3600m 3 /s . Results were obtained for both with project (salinity barrage) and without project situation and used as boundary conditions in the physical model. For flows (less than 250m 3 / s) barrage top level was kept at +1.0 m MSL (Rubber dam in inflated position) and for higher flows (higher than 250m 3 / s ) barrage gates were kept at -0.5 m MSL (Rubber dam in deflated position). The results obtained for steady flows are summarised in Table 6.
Table 6 can be used to compute the water level rise immediately upstream of the conservation barrage. This shows that when the rubber dam was in a deflated position the maximum water level rise was 17cm for the steady flow 3600m 3 /s while the minimum was 7c.m for the flow 1200m 3 /s . It is also noted that when the rubber dam is inflated during low river flow there is around 1.12m water level rise' which would increase the water abstraction efficiency.
4. Conclusions
This study looks at two aspects of the Kelani Ganga floods which are of general interest: firstly the impact of sand mining and secondly the impact of the proposed Kelani Conservation Barrage which has been identified as the most feasible solution for the salinity intrusion problem.
The study carried out in 1990-92 has concluded that although the lowering of the riverbed (as measured in 1990) had an impact on low and medium flood levels in the Kelani Ganga, there was no significant lowering of the extreme flood levels. This study shows that the intensification
of sand mining, which had lowered the bed further in the intervening 13 years had indeed begun to make an impact on the extreme floods as well.
The construction of the salinity barrage has been found to have a small impact on the present flood levels upstream of the barrage. However, these flood levels were found to be lower than the equivalent flood levels under 1990 conditions. In other words, the lowering of the river bed has had one beneficial effect - i.e. it had taken away the negative flood impact of the salinity barrage before it was built.
6. References
1. Danish Hydraulic Institute in association with Lanka Hydraulic Institute, March 1992, ' Kelani Ganga Flood Protection Study' - Final Report prepared for Irrigation Deparment.
2. Danish Hydraulic Institute in association with Lanka Hydraulic Institute, February 1993, 'Kelani Ganga Water Quality Study' -Final Report prepared for National Water Supply and Drainage Board.
3. Danish Hydraulic Institute in association with Lanka Hydraulic Institute and Sir William Halcrow & Partners Ltd, 2000, 'Western River Basins Sector Project, Annex 2 - Kelani Conservation Barrage'- Final Report prepared for Asian Development Bank.
4. Dharmasena G.T, 1989 /Floods in Kelani Ganga ' , Hydrological Annual 1 9 8 8 / 8 9 publised by the Irrigation Department.
5. Lanka Hydraulic Institute, November 1997, 'Field Measurements in the Kelani Ganga at Ambatale' -Report prepared for SCP-Gersar.
6. Lanka Hydraulic Institute, September 2003, 'Mathematical Model Study for Kelani Conservation Barrage'-Final Report prepared for Environmental Engineering Consultant.
7. Lanka Hydraulic Institute, September 2003, 'Physical Model Study for Kelani Conservation Barrage'-Final Report prepared for Environmental Engineering Consultant.
8. SCP-Gersar, 1998, 'Feasibility Study on Salini ty Barr ier at Ambatale in Kelani Ganga' - Report prepared for National Water Supply and Drainage Board.
49