Embed Size (px)
Citation preview
www.adas.co.uk
Greenhouse gases – How to reduce emissions
Insert image here
Insert image here
Ken Smith, ADAS Wolverhampton
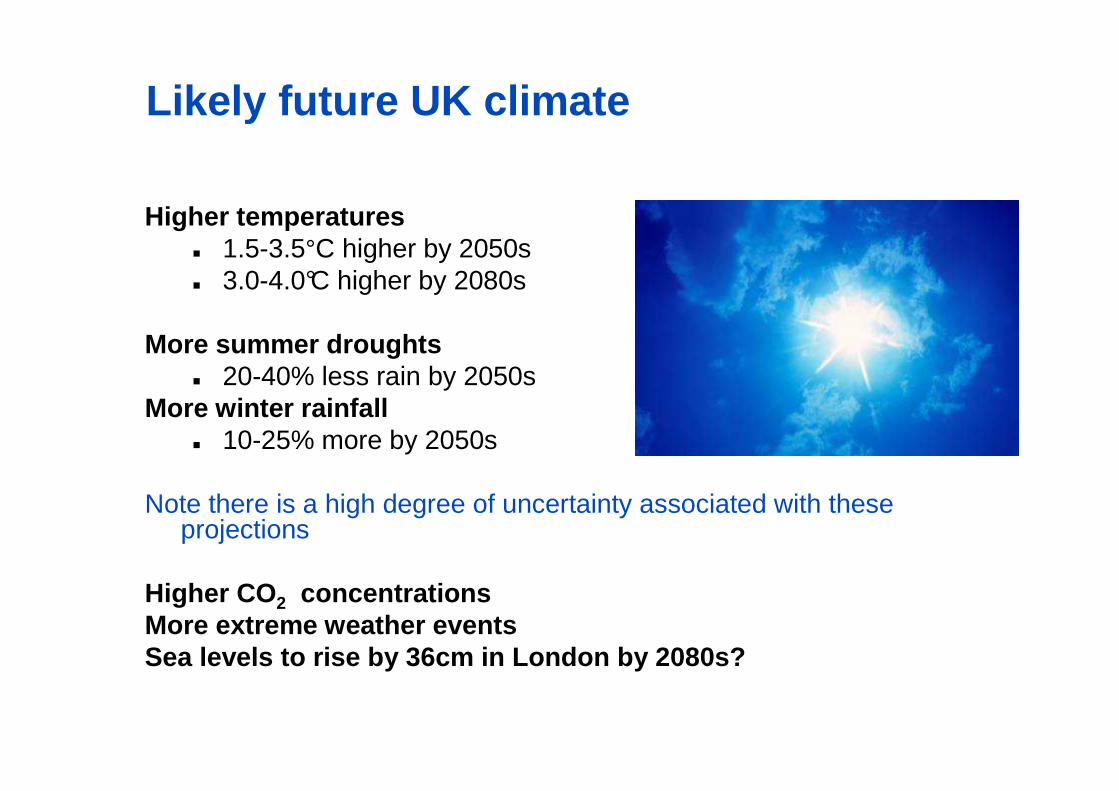
Likely future UK climate
Higher temperatures� 1.5-3.5°C higher by 2050s� 3.0-4.0°C higher by 2080s
More summer droughts� 20-40% less rain by 2050s
More winter rainfall� 10-25% more by 2050s
Note there is a high degree of uncertainty associated with theseprojections
Higher CO 2 concentrationsMore extreme weather eventsSea levels to rise by 36cm in London by 2080s?

Climate change - gases
What causes climate change?� levels of greenhouse gases (GHGs) in the atmosphereAct as blanket keeping planet warm
What gases are of concern in agriculture?Nitrous oxide – 298 x more potent than CO2
• Manufacture artificial N• Application of organic & artificial N• Livestock manures
Methane – 25 x more potent than CO2
• Ruminant livestock
Carbon dioxide (CO2)• Diesel fuel use• Electricity• Other fossil fuels
Methane
NitrousOxide
CarbonDioxide

GHG emissions reduction targets
Climate Change Act 2008 - UK domestic ambition (from 1990)
• 23% reduction by 2012• 29% reduction by 2017
• 35% reduction by 2022
• 50% reduction by 2027
Ultimate goal• 80% reduction by 2050• Equivalent to 155.6 Mt CO2e
Agriculture contribution• 3Mt CO2e per year against 2008
baseline
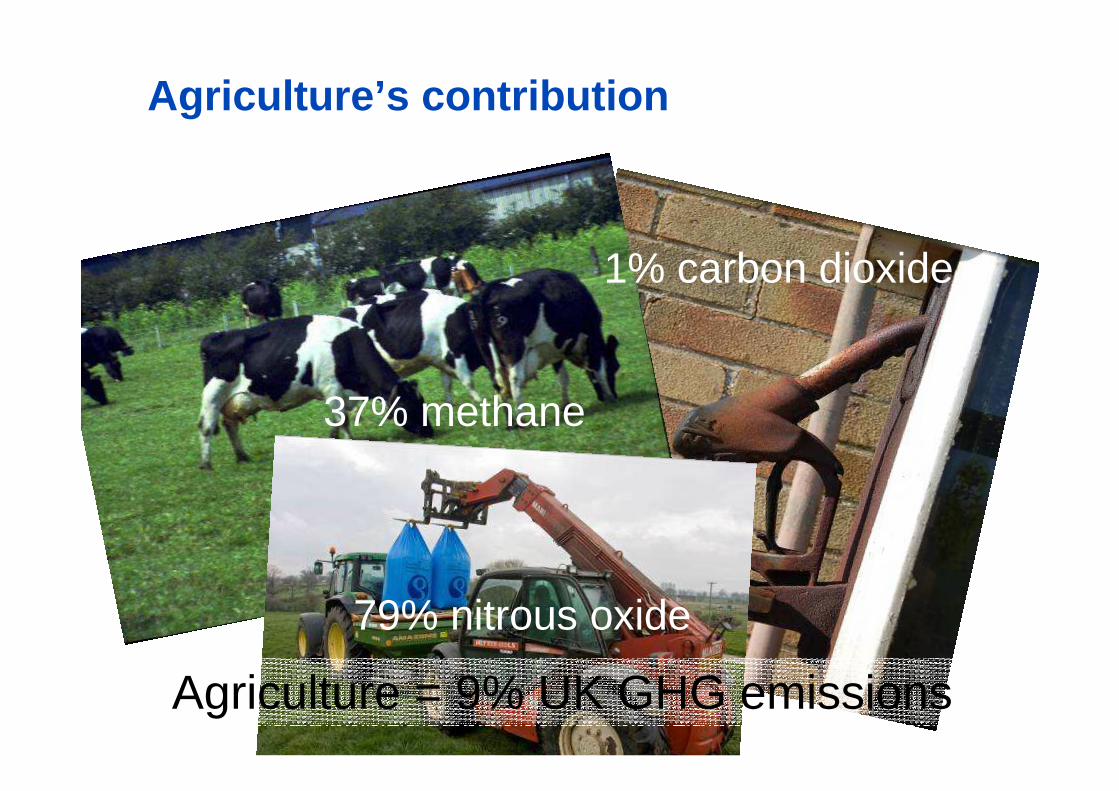
Agriculture ’s contribution
1% carbon dioxide
37% methane
79% nitrous oxide
Agriculture = 9% UK GHG emissions

Greenhouse Gas Action Plan
Voluntary industry initiative to reduce emissions
15 on-farm actions targeting • � management crop nutrients & soils
• � manure and slurry handling practices• � animal health, nutrition & breeding
• Protecting and enhancing carbon stores
• � fuel and energy management (renewable energy)
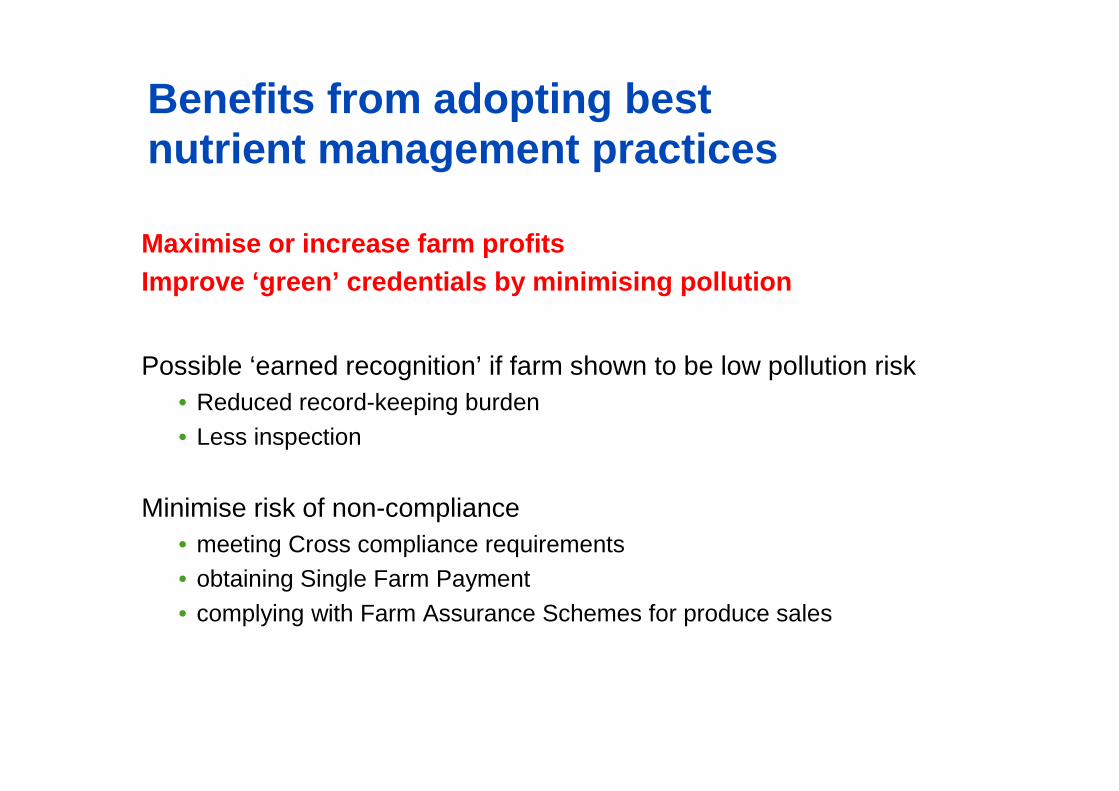
Benefits from adopting best nutrient management practices
Maximise or increase farm profitsImprove ‘green’ credentials by minimising pollution
Possible ‘earned recognition’ if farm shown to be low pollution risk• Reduced record-keeping burden
• Less inspection
Minimise risk of non-compliance• meeting Cross compliance requirements• obtaining Single Farm Payment
• complying with Farm Assurance Schemes for produce sales
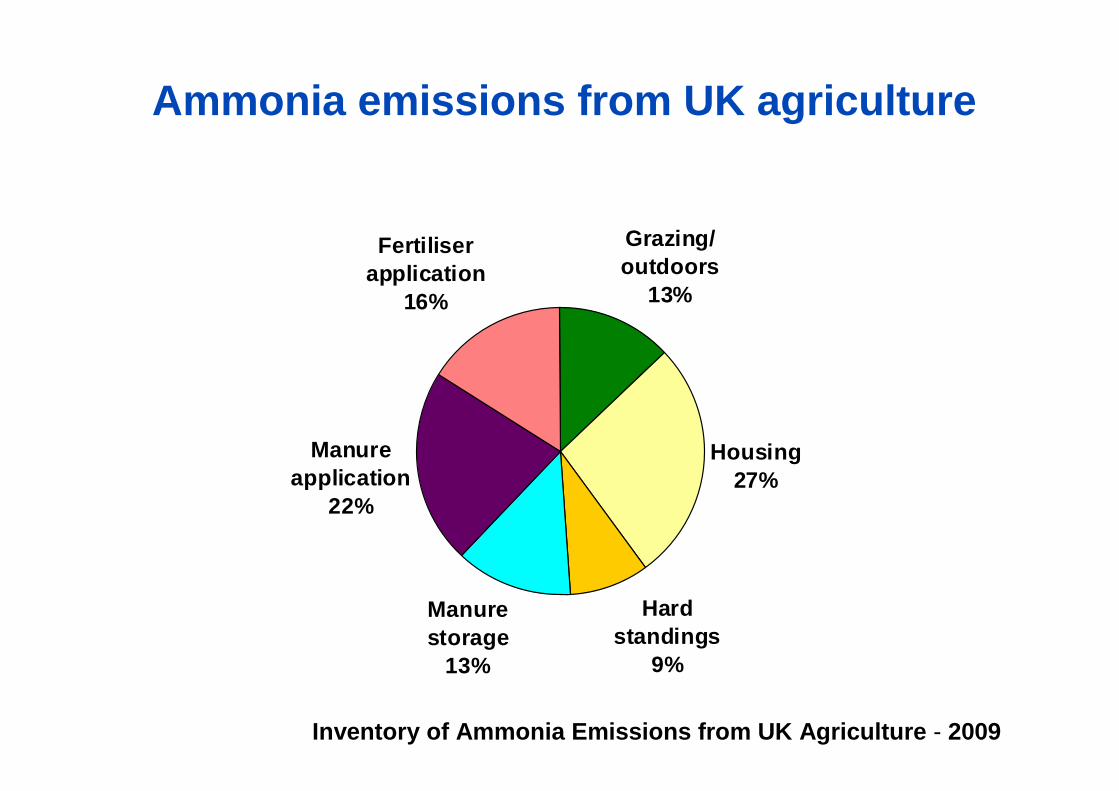
Ammonia emissions from UK agriculture
Inventory of Ammonia Emissions from UK Agriculture - 2009
Housing27%
Manure application
22%
Manure storage
13%
Hard standings
9%
Grazing/outdoors
13%
Fertiliser application
16%
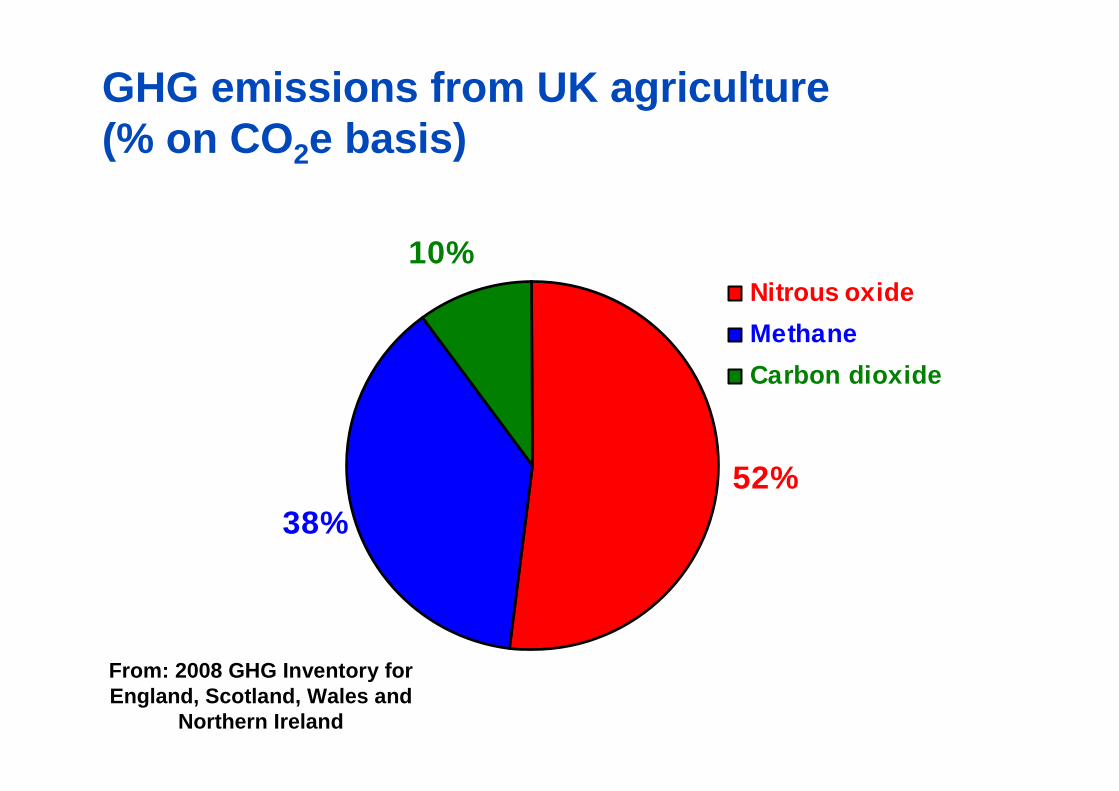
GHG emissions from UK agriculture(% on CO 2e basis)
Defra (2007)
10%
52%38%
Nitrous oxide
Methane
Carbon dioxide
From: 2008 GHG Inventory for England, Scotland, Wales and
Northern Ireland

Checklist for good nutrient management
1. Choose appropriate cropping
2. Plan manure applications
3. Assess soil type and improve structural conditions
4. Understand and comply with relevant regulations and assurance scheme requirements
5. Adopt the Nutrient Planning cycle
6. Buy most appropriate fertiliser(s)
7. Accurately apply fertilisers and manures
8. Keep records as aid to future planning and decisions
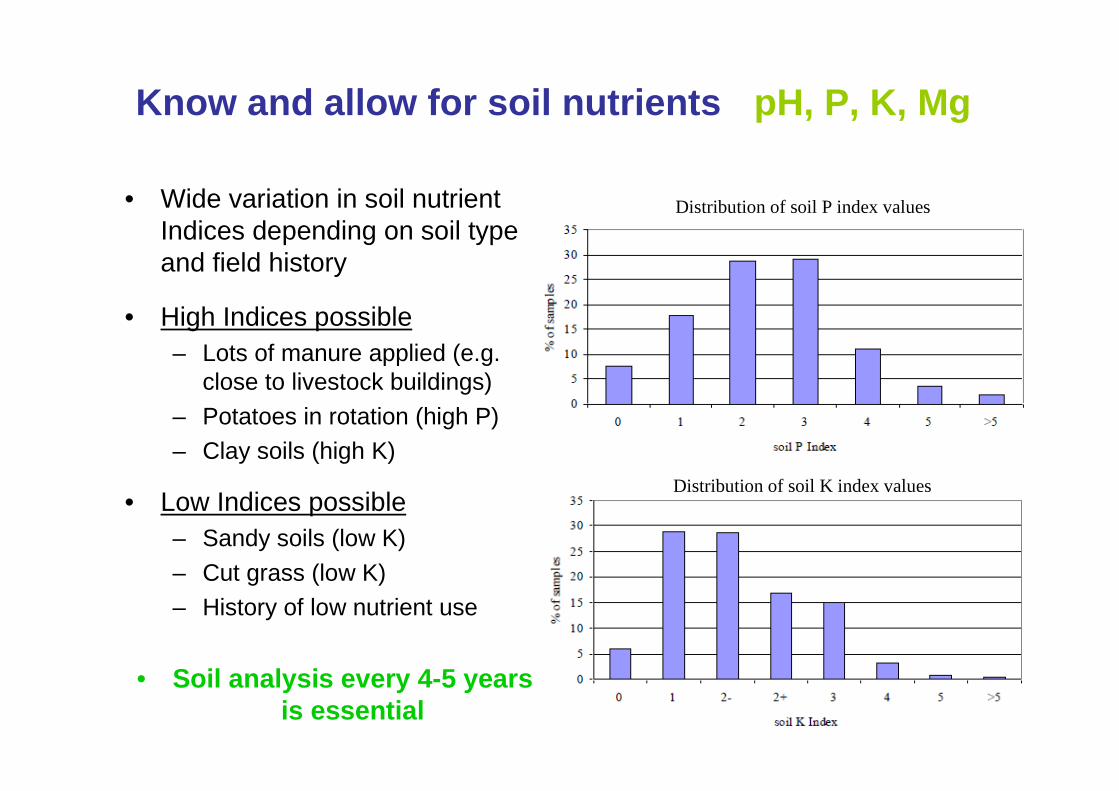
Know and allow for soil nutrients pH, P, K, Mg
• Wide variation in soil nutrient Indices depending on soil type and field history
• High Indices possible– Lots of manure applied (e.g.
close to livestock buildings)
– Potatoes in rotation (high P)– Clay soils (high K)
• Low Indices possible– Sandy soils (low K)
– Cut grass (low K)– History of low nutrient use
• Soil analysis every 4-5 years is essential
Distribution of soil P index values
Distribution of soil K index values

Correct nitrogen use can double crop yields
0
80
0 40 80 120 160 200 240 280 320
Nitrogen applied (kg/ha)
Yie
ld (
t/ha)
0
10
Nitr
oge
n le
ach
ed (
kg/h
a)
Rapid response
The economic optimum rate of nitrogen
Biological maximum yield
Penalty at high rates

Nitrate concentrations in over-winter drainage following different previous crops (1990-2006)*
*(Source: Defra NVZ AP consultation document D3, 2007)
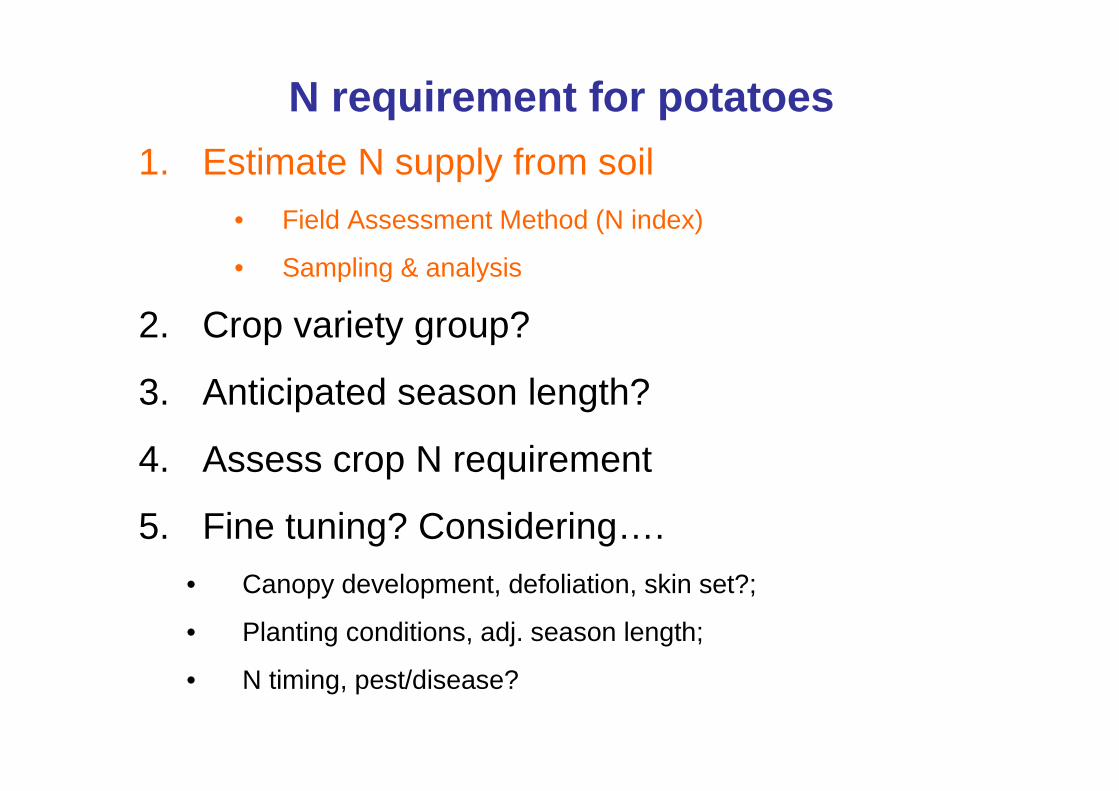
N requirement for potatoes1. Estimate N supply from soil
• Field Assessment Method (N index)
• Sampling & analysis
2. Crop variety group?
3. Anticipated season length?
4. Assess crop N requirement
5. Fine tuning? Considering….
• Canopy development, defoliation, skin set?;
• Planting conditions, adj. season length;
• N timing, pest/disease?

Nitrogen use on maincrop potatoes grown in Britain between 1990 and 2009. Source: BSFP
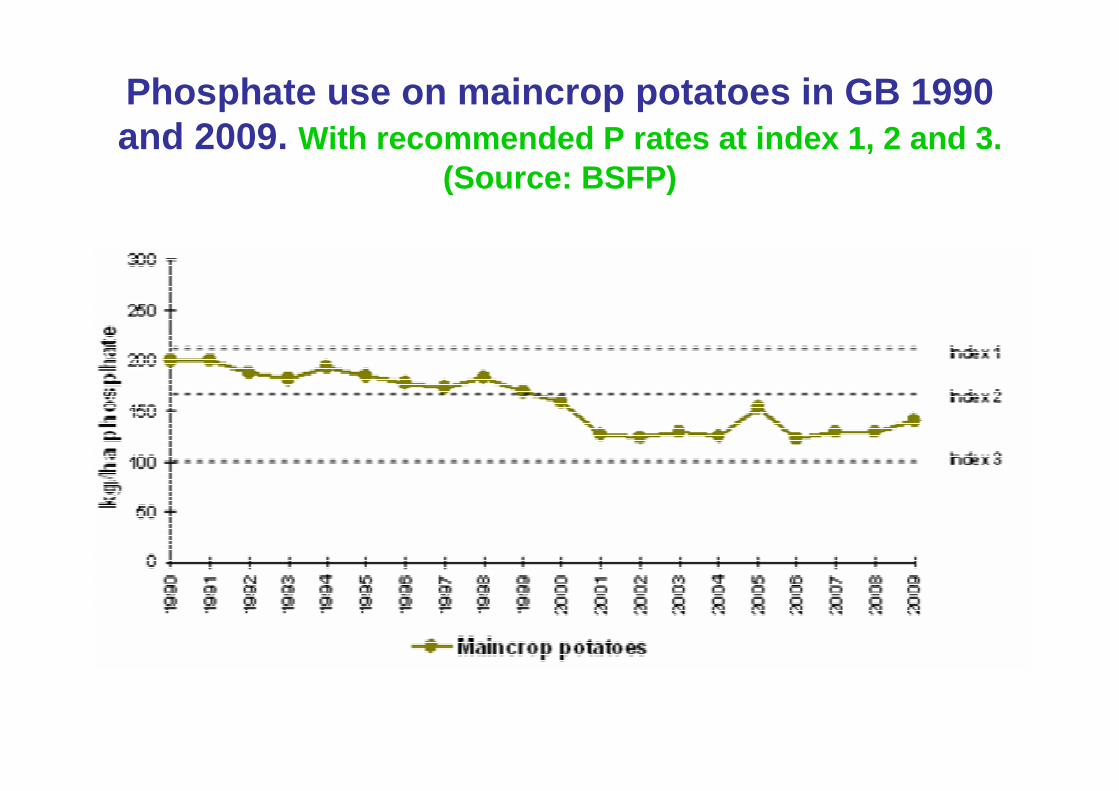
Phosphate use on maincrop potatoes in GB 1990 and 2009. With recommended P rates at index 1, 2 and 3.
(Source: BSFP)
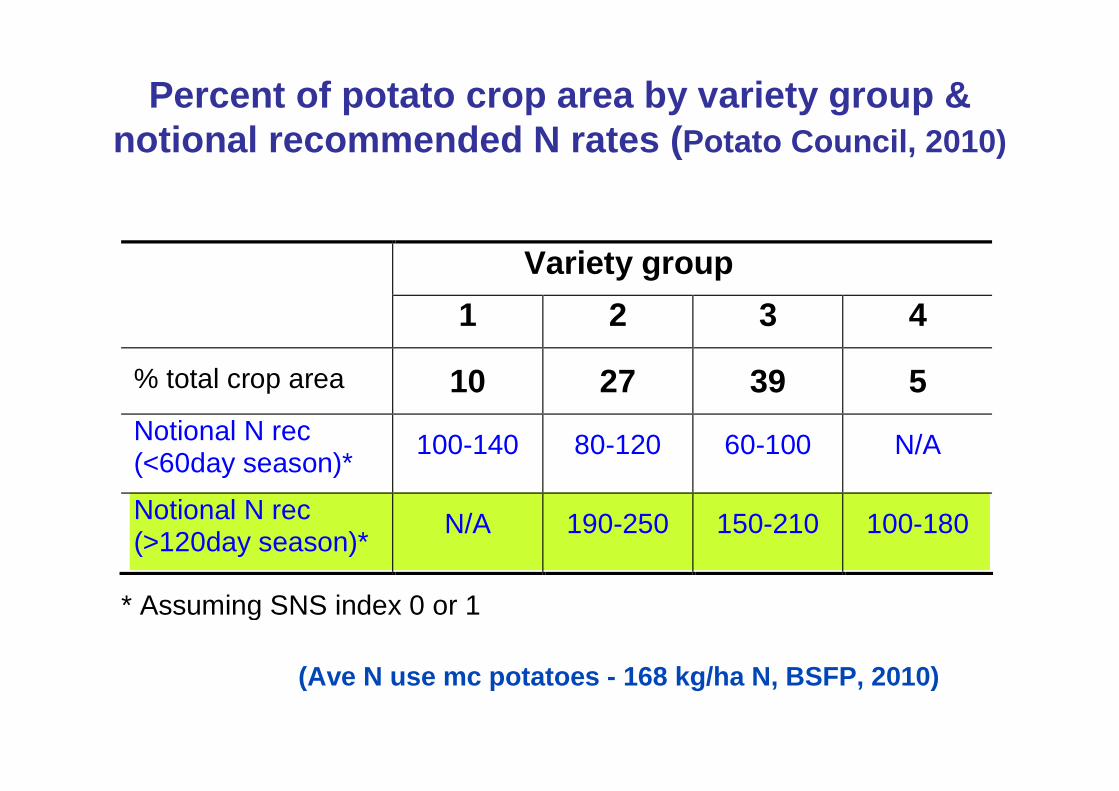
Variety group 1 2 3 4
% total crop area 10 27 39 5 Notional N rec (<60day season)*
100-140 80-120 60-100 N/A
Notional N rec (>120day season)*
N/A 190-250 150-210 100-180
* Assuming SNS index 0 or 1
Percent of potato crop area by variety group & notional recommended N rates ( Potato Council, 2010)
(Ave N use mc potatoes - 168 kg/ha N, BSFP, 2010)

Know and allow for soil nutrientsSoil N Supply (SNS)
• Field Assessment Method (FAM)– Based on soil type, rainfall and cropping
history– Provides a good guide but take account of
farm experience
• Measuring SMN– More worthwhile if likely SNS is higher than
120 kg N/ha (Index 4 and over)• Organic manures regularly used• Grass ploughed out (not year 1)
• After field vegetables leaving high-N residues
– Spring (0-90cm) or autumn (0-60cm) sampling, not within 2-3 months of a nitrogen application
– 10-15 sub-samples, carefully mixed– Sample kept cool (not frozen) and sent to lab
for analysis within 3 days

FAM - Excess Winter Rainfall
Long term ‘Average’(whole winter to 30 March)
To February 2012
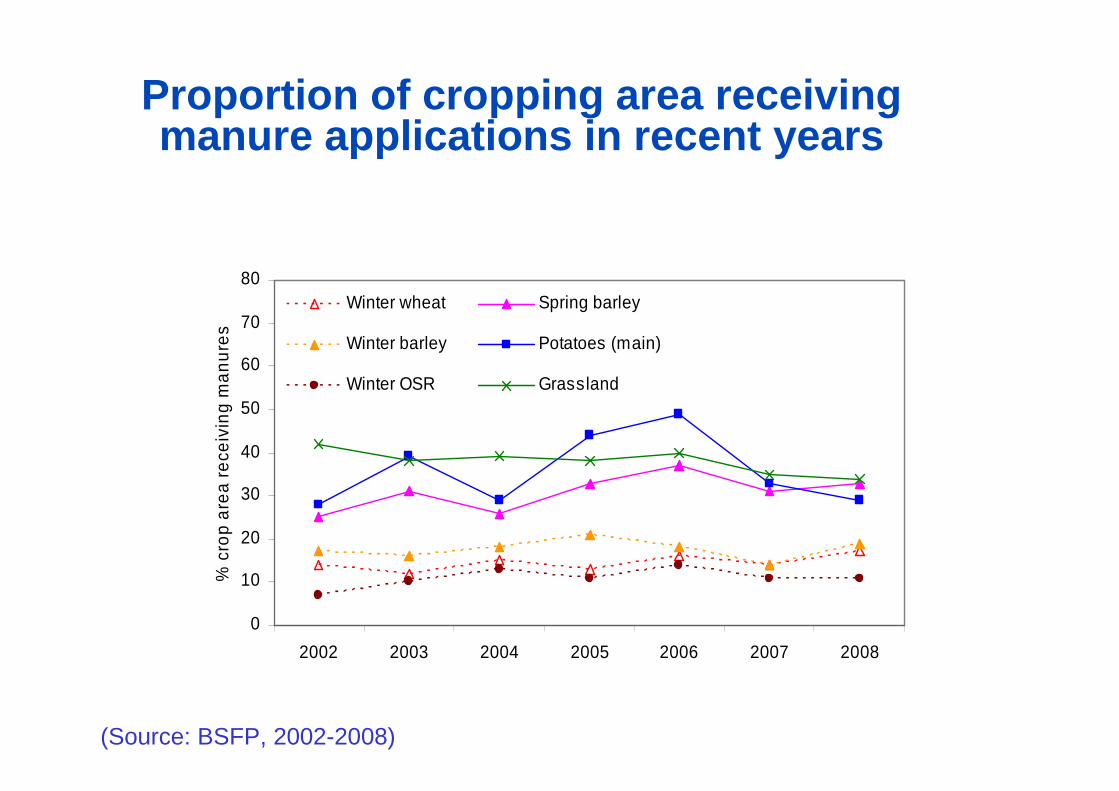
Proportion of cropping area receiving manure applications in recent years
0
10
20
30
40
50
60
70
80
2002 2003 2004 2005 2006 2007 2008
% c
rop
are
a r
ece
ivin
g m
an
ure
s
Winter wheat Spring barley
Winter barley Potatoes (main)
Winter OSR Grassland
(Source: BSFP, 2002-2008)

Impact of manure use on fertiliser nitrogen input –maincrop potatoes (Source: BSFP 2008)
0
2040
6080
100
120140
160180
200
2001 2002 2003 2004 2005 2006 2007 2008 2009
Ove
rall
N u
se k
g/ha
no manure
with manure
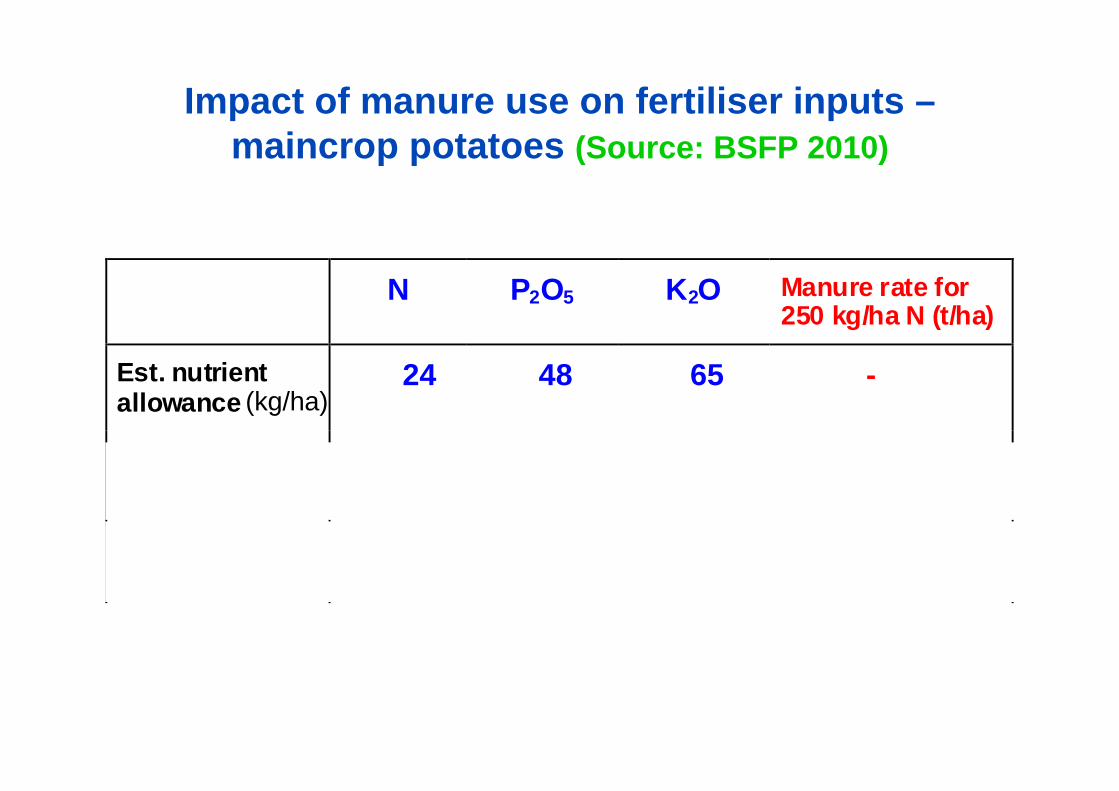
Impact of manure use on fertiliser inputs –maincrop potatoes (Source: BSFP 2010)
N P2O5 K2O Manure rate for 250 kg/ha N (t/ha)
Est. nutrient allowance
24 48 65 -
Supplied by FYM (t/ha)
40 25 8 42
Supplied by P litter (t/ha)
2 3 4 8
(kg/ha)
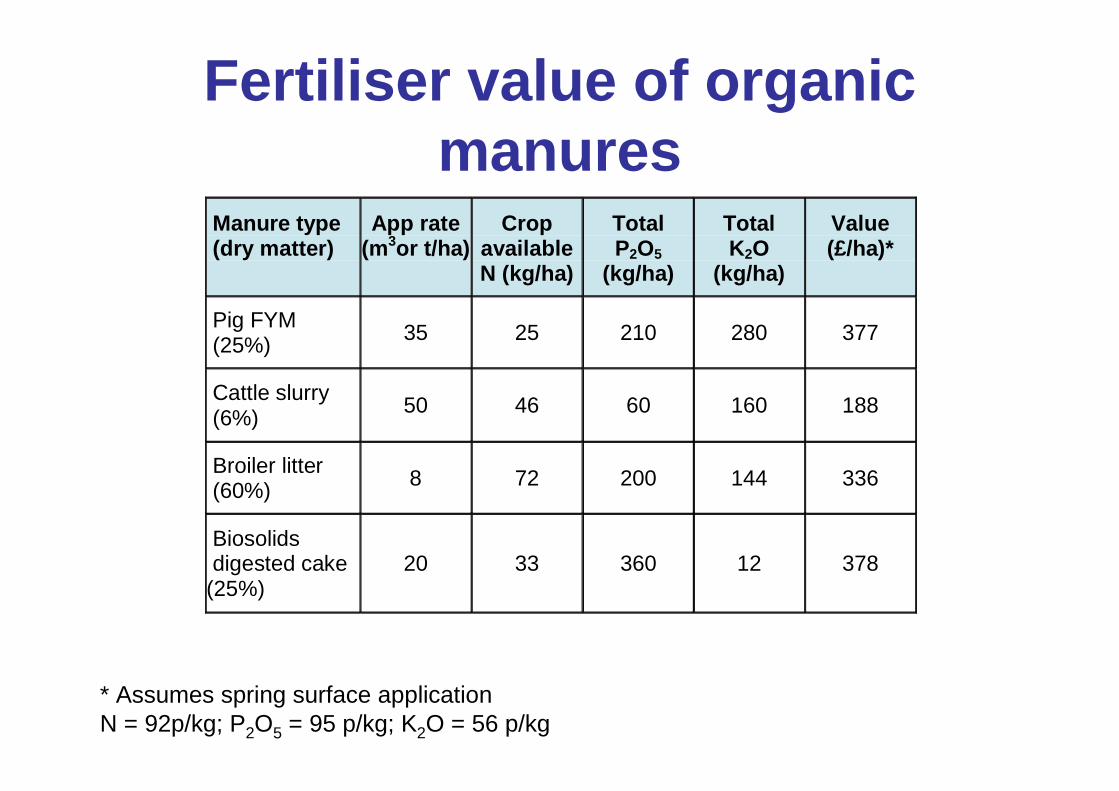
Fertiliser value of organic manures
* Assumes spring surface applicationN = 92p/kg; P2O5 = 95 p/kg; K2O = 56 p/kg
Manure type (dry matter)
App rate (m3or t/ha)
Crop available N (kg/ha)
Total P2O5
(kg/ha)
Total K2O
(kg/ha)
Value (£/ha)*
Pig FYM (25%) 35 25 210 280 377
Cattle slurry (6%)
50 46 60 160 188
Broiler litter (60%) 8 72 200 144 336
Biosolids digested cake (25%)
20 33 360 12 378

Make the most of organic manure nutrientsCreate a farm manure application plan
1. Select fields/crops that will benefit most from the nutrients and organic matter applied
2. Determine the supply of organic manure nutrients
3. Choose best application equipment
4. Choose best application timing and incorporation
5. Reduce application rates of manufactured fertiliser

Manure nutrient content
• ‘Typical figures’– Fertiliser Manual– PLANET
• Analysis– Laboratory
• Wet chemistry• NIRS
– On farm• Slurry hydrometers• N meters (Agros/Quantofix)

Cattle slurry, total nitrogen
0
2
4
6
8
0 5 10 15 20
Dry matter (%)
Tot
al N
(kg
/t FW
)
Range of N content at
6% DM 1.2 – 4.5 kg/m3
Fertiliser Manual ‘standard’ N 2.3 kg/m3 at 6% DM

It should be remembered that…
• The costs of manure handling and application are likely to be similar whether done badly…or well
• Risks of over application;– Nutrient losses to water– Nutrient losses to air– Lost £££
• Risks of under application;– Reduced crop yield– Lost £££
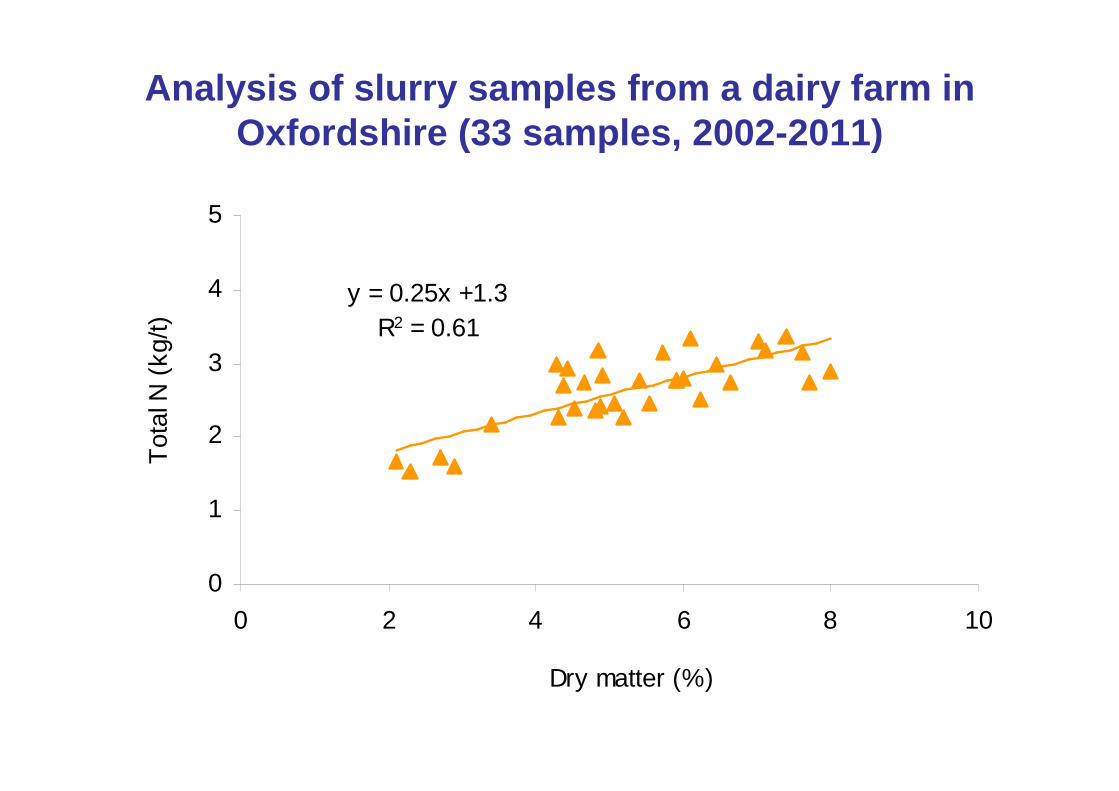
y = 0.25x +1.3R2 = 0.61
0
1
2
3
4
5
0 2 4 6 8 10
Dry matter (%)
Tot
al N
(kg
/t)
Analysis of slurry samples from a dairy farm in Oxfordshire (33 samples, 2002-2011)

Further reasons for manure analysis
Livestock manure N efficiency values for N max compliance in NVZs
Manure type Crop avail N (% Ntotal) pre 1st Jan 2012
Crop avail N (% Ntotal) from 1st Jan 2012
Cattle slurry 20% 35%
Pig slurry 25% 45%
Poultry manure/litter
20% 30%
Other manures 10% 10%
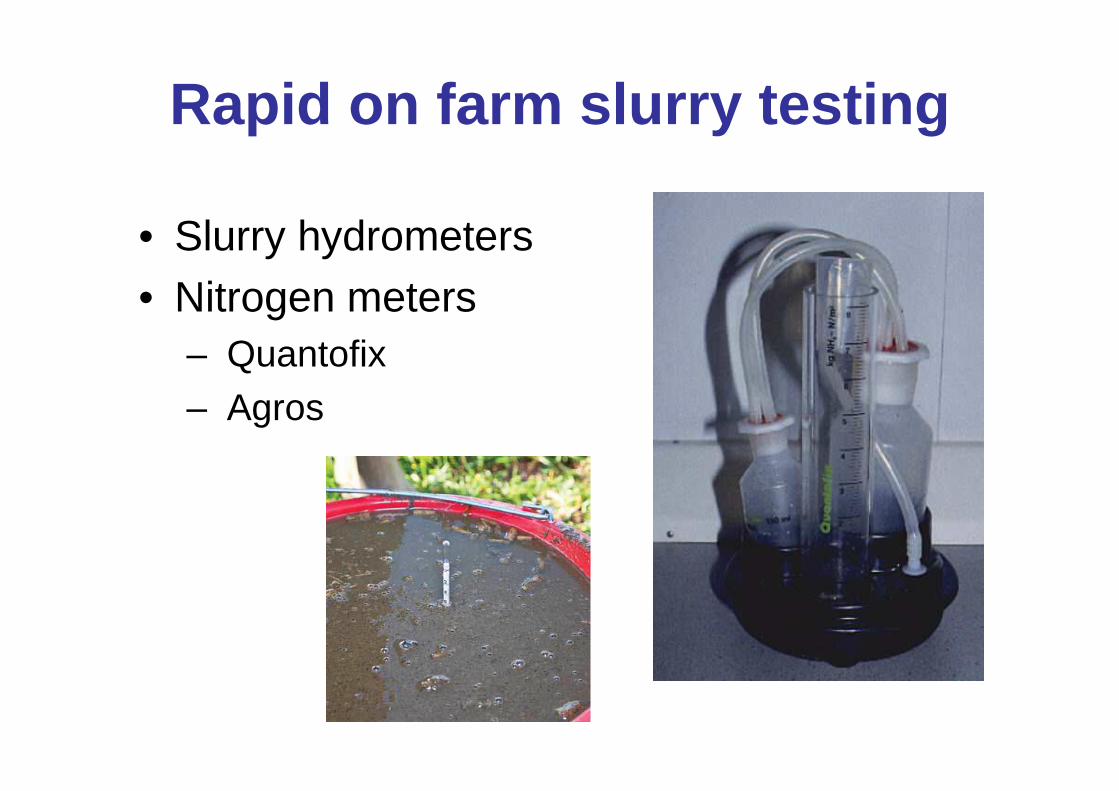
Rapid on farm slurry testing
• Slurry hydrometers• Nitrogen meters
– Quantofix– Agros
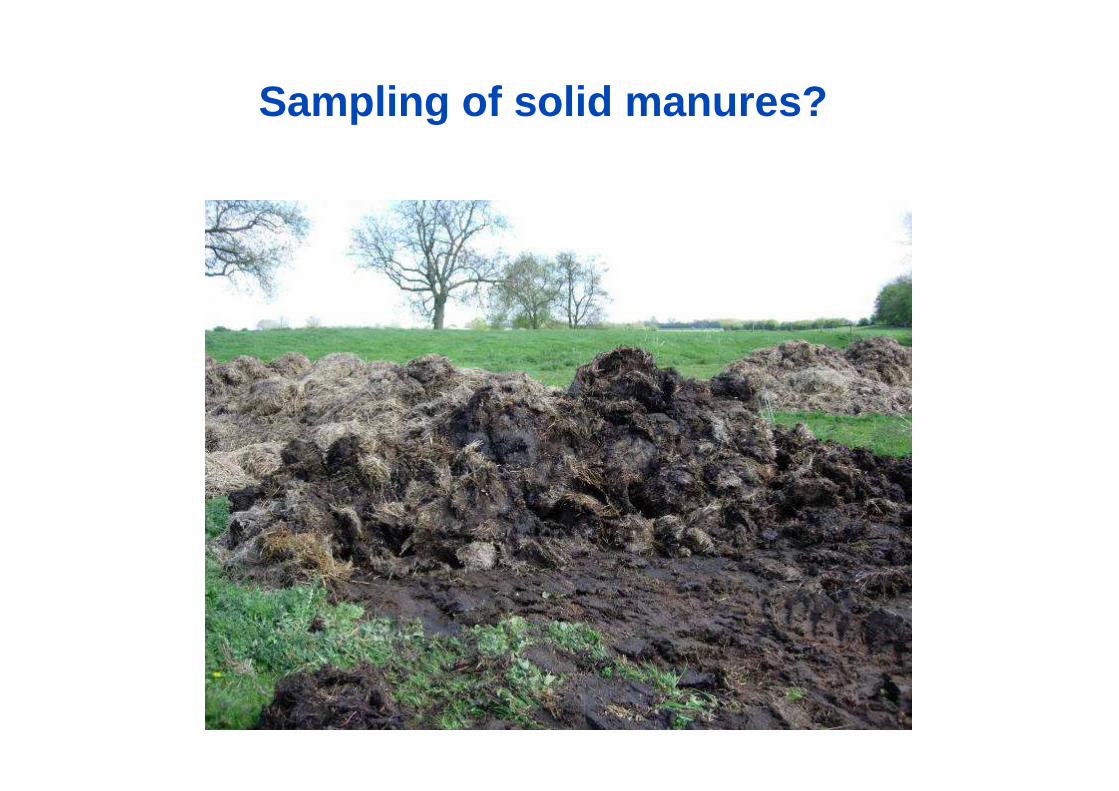
Sampling of solid manures?
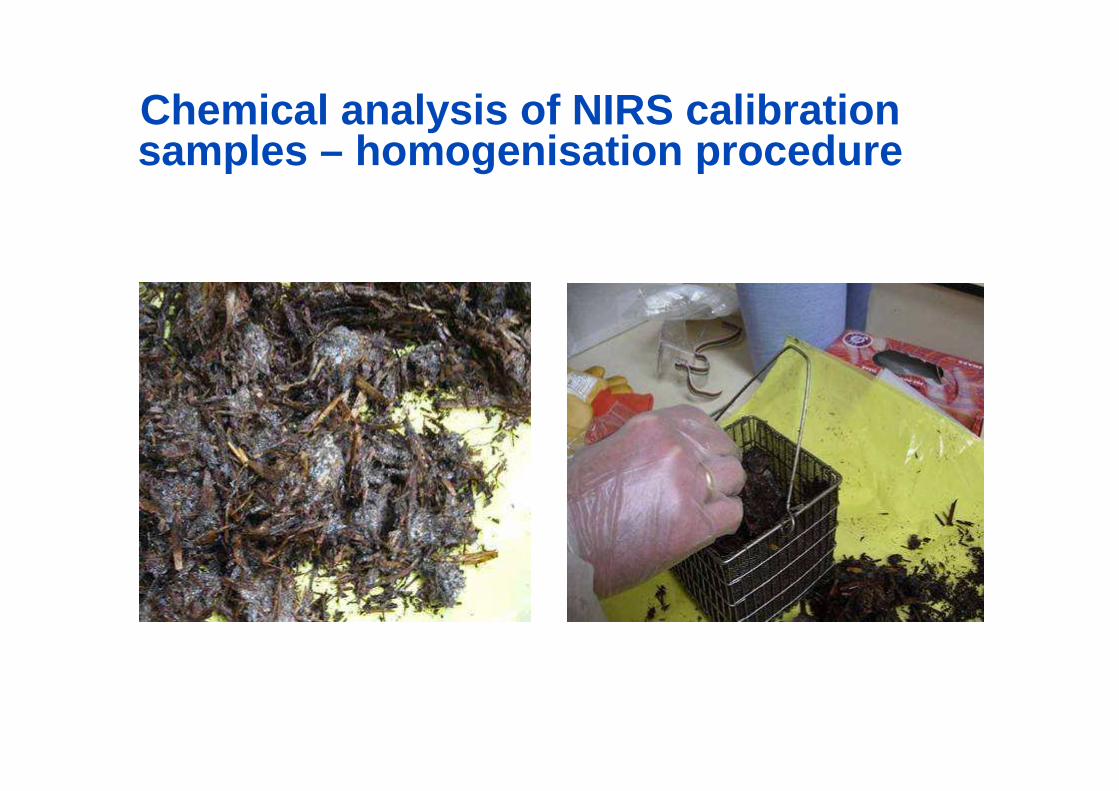
Chemical analysis of NIRS calibration samples – homogenisation procedure
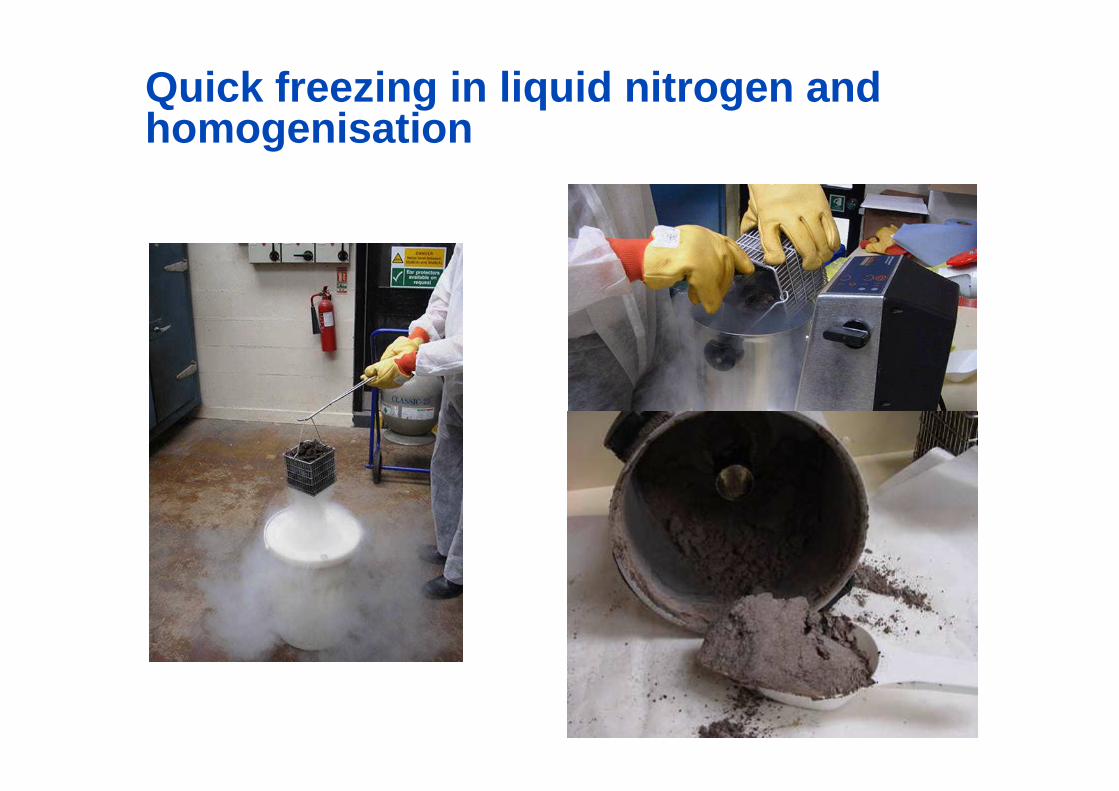
Quick freezing in liquid nitrogen and homogenisation
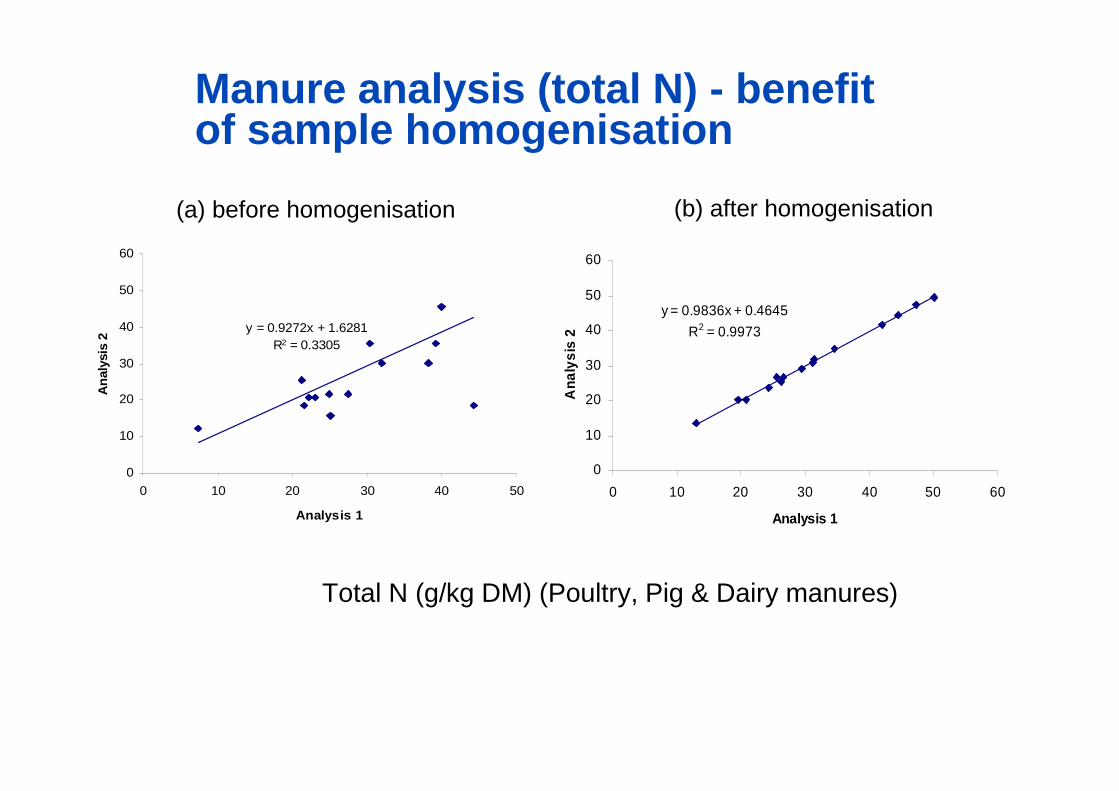
Total N (g/kg DM) (Poultry, Pig & Dairy manures)
Manure analysis (total N) - benefit of sample homogenisation
y = 0.9272x + 1.6281R2 = 0.3305
0
10
20
30
40
50
60
0 10 20 30 40 50
Analysis 1
Ana
lysi
s 2
y = 0.9836x + 0.4645
R2 = 0.9973
0
10
20
30
40
50
60
0 10 20 30 40 50 60
Analysis 1
Ana
lysi
s 2
(a) before homogenisation (b) after homogenisation

Scanning of manure samples and estimation of nutrient content by NIRS

NIRS calibration for total N
Total nitrogen ( g/Kg ) Calibration fit.
R2 94.78 RPD 4.38
y = 0.9478x + 0.331
R2 = 0.9478
-1
4
9
14
19
24
29
34
39
44
49
0 5 10 15 20 25 30 35 40 45 50
True
NIR
S fi
t
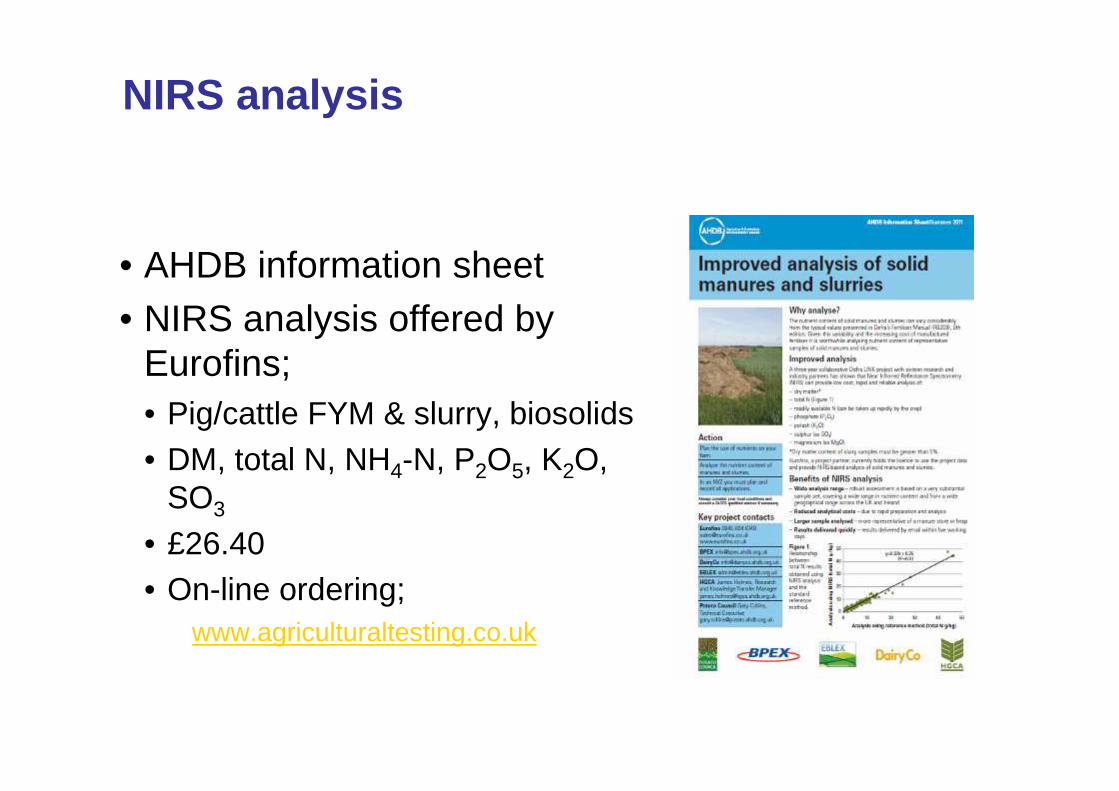
NIRS analysis
• AHDB information sheet• NIRS analysis offered by
Eurofins;• Pig/cattle FYM & slurry, biosolids• DM, total N, NH4-N, P2O5, K2O,
SO3
• £26.40• On-line ordering;
www.agriculturaltesting.co.uk

Sampling strategy - manure N application rate** & associated variability* (cv%)
0
50
100
150
200
250
0 5 10 15 20
Sample number
Man
ure
N r
ate
kg/h
a
0.0
5.0
10.0
15.0
cv%
Manure N rate
cv% (means)
(* Simulated variability for 3 replicates - cv%) (Tidy heap)
(** based on FYM N content and notional application rate 20t/ha)

0
50
100
150
200
0 5 10 15 20
Sample number
Ma
nu
re N
ra
te k
g/h
a
0.0
5.0
10.0
15.0
CV
%
Manure N rate
cv% (means)
Sampling strategy - manure N application rate** & associated variability* (cv%)
(* Simulated variability for 3 replicates – cv%) (Untidy heap)
(** based on FYM N content and notional application rate 20t/ha)

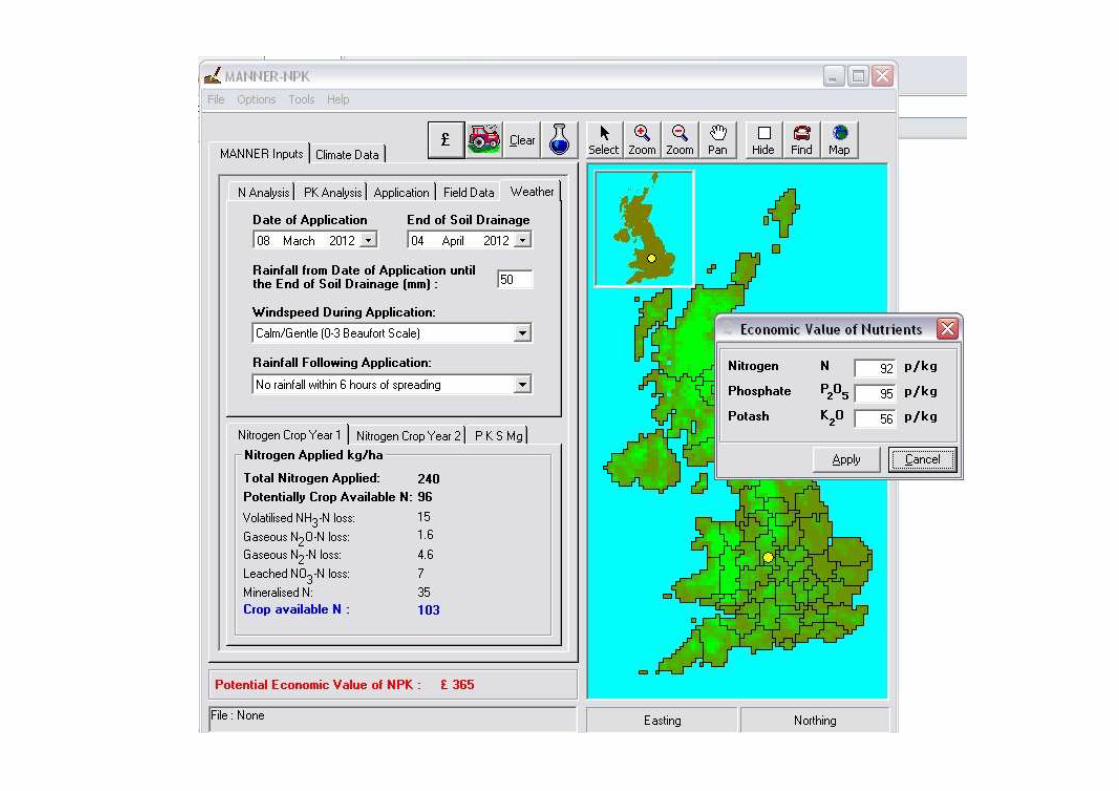
Nutrient management tools
0
1
2
3
4
5
6
7
8
9
10
0 50 100 150 200 250 300
Nitrogen supply (kg/ha)
Gra
in y
ield
(t/h
a)
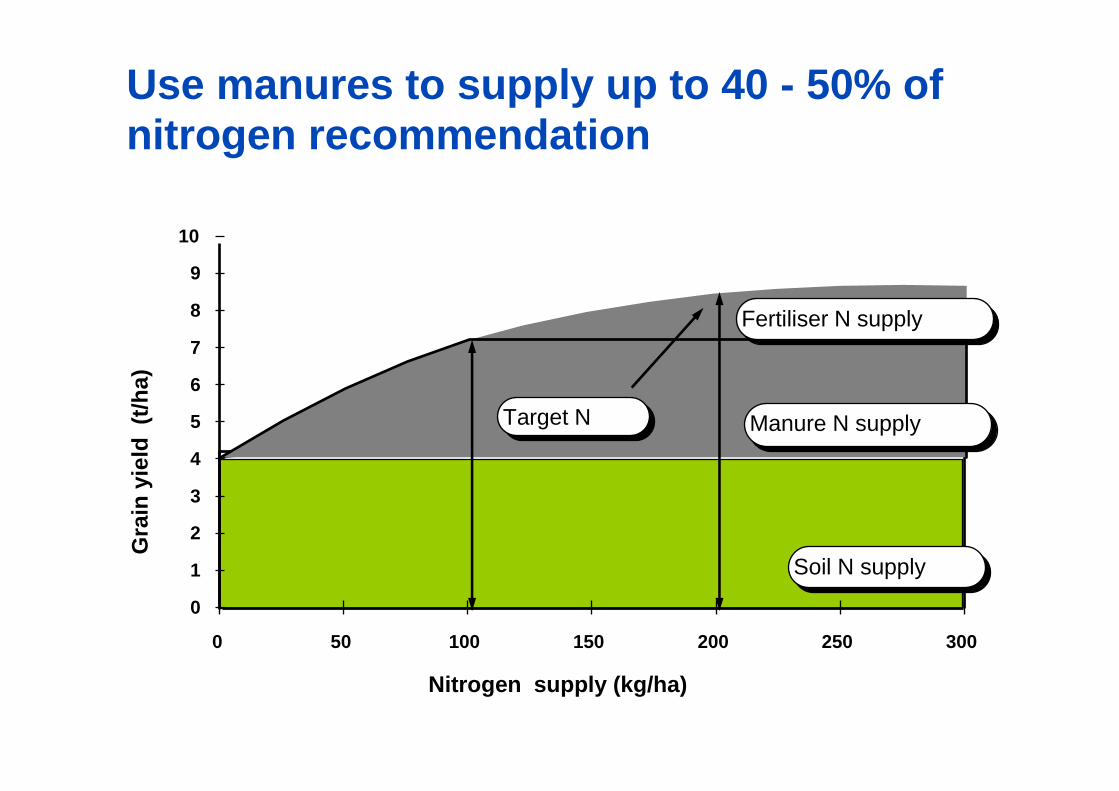
Manure N supply
Fertiliser N supply
Soil N supply
Target N
Use manures to supply up to 40 - 50% of nitrogen recommendation

Nitrogen fertiliser types
Ammonium nitrate (33.5-34.5% N)Most common, straight N or NPK compound
Reliable and rapidly availableSafety hazard
Liquid urea ammonium nitrate (UAN, 37% w/v)
Common in arable as easy handling and accurate
Urea granules (46% N)Often cheap but high risk of ammonia loss
Agrotain urease inhibitor reduces ammonia loss
0
5
10
15
20
25
30
Urea Urea+Ag AN
Am
mon
ia lo
ss (
% N
app
lied)
Source: Chambers & Dampney (2009).
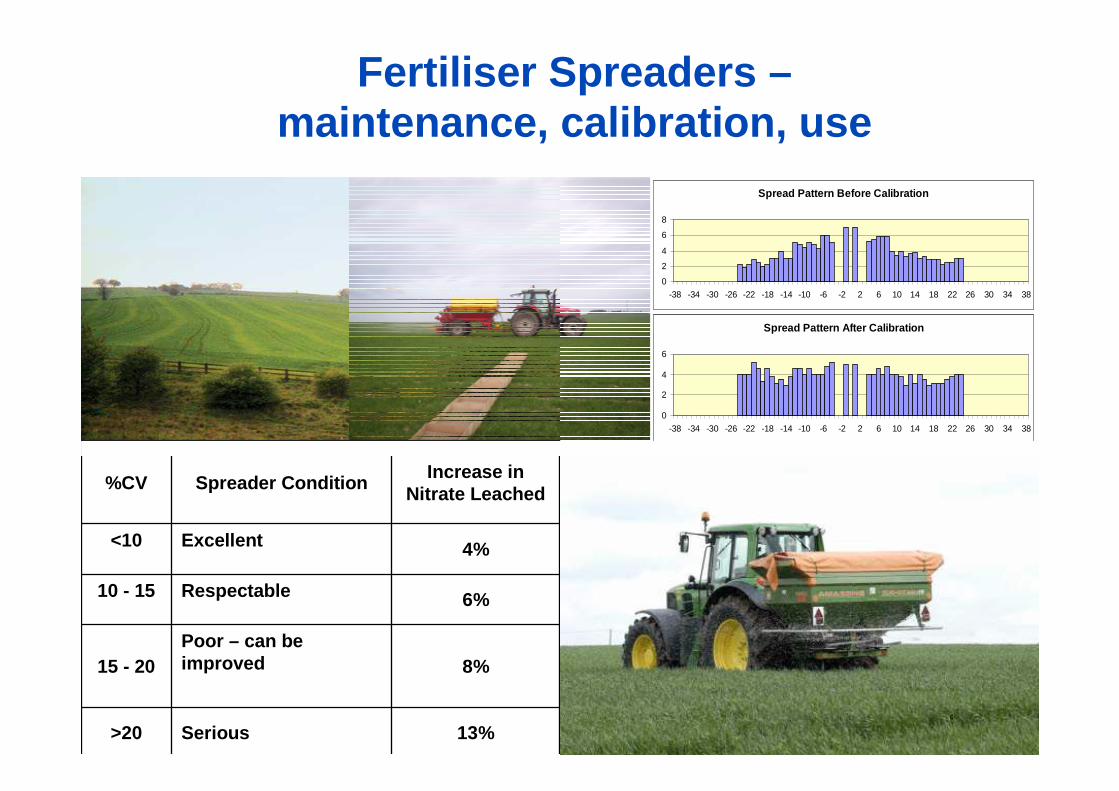
Fertiliser Spreaders –maintenance, calibration, use
13%Serious >20
8%Poor – can be improved15 - 20
6%Respectable10 - 15
4%Excellent<10
Increase in Nitrate LeachedSpreader Condition%CV
Spread Pattern Before Calibration
0
2
4
6
8
-38 -34 -30 -26 -22 -18 -14 -10 -6 -2 2 6 10 14 18 22 26 30 34 38
Spread Pattern After Calibration
0
2
4
6
-38 -34 -30 -26 -22 -18 -14 -10 -6 -2 2 6 10 14 18 22 26 30 34 38
Spread Pattern Before Calibration
0
2
4
6
8
-38 -34 -30 -26 -22 -18 -14 -10 -6 -2 2 6 10 14 18 22 26 30 34 38
Spread Pattern After Calibration
0
2
4
6
-38 -34 -30 -26 -22 -18 -14 -10 -6 -2 2 6 10 14 18 22 26 30 34 38
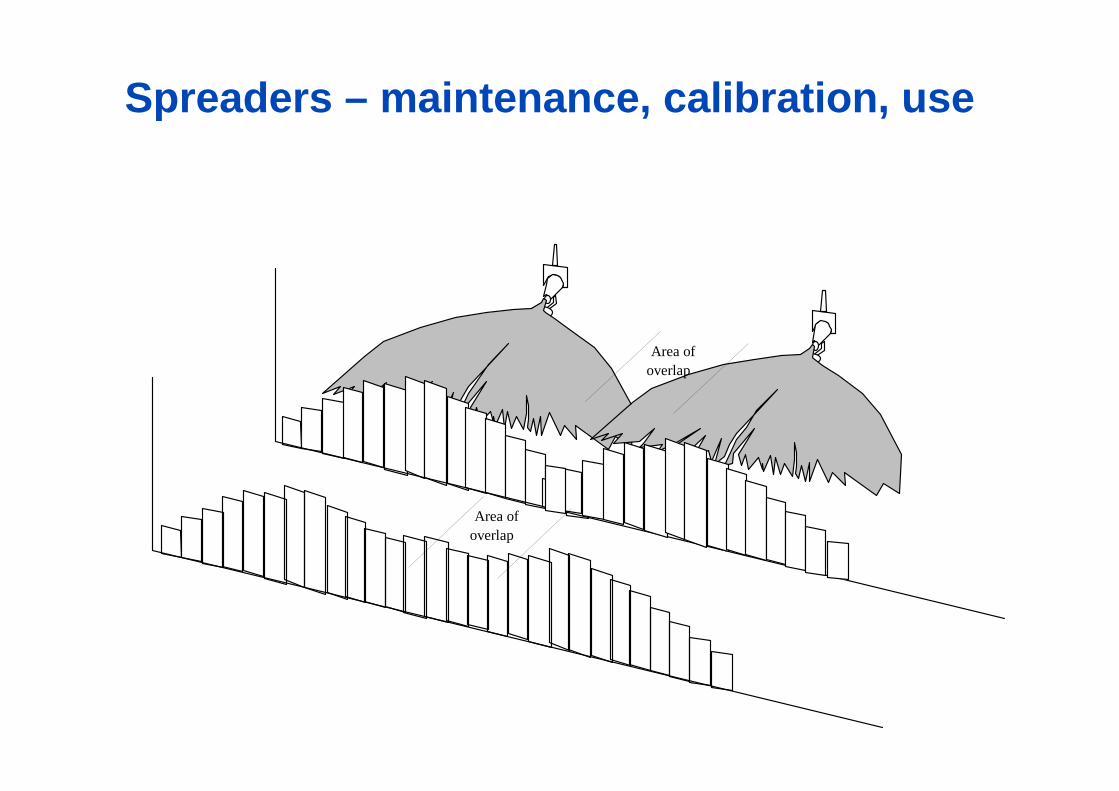
Spreaders – maintenance, calibration, use
Area of overlap
Area of overlap

Green manures
� Cover crop grown primarily to add nutrients and organic matter to soil
� Typically, autumn - late winter (4 months?), destroyed while still green
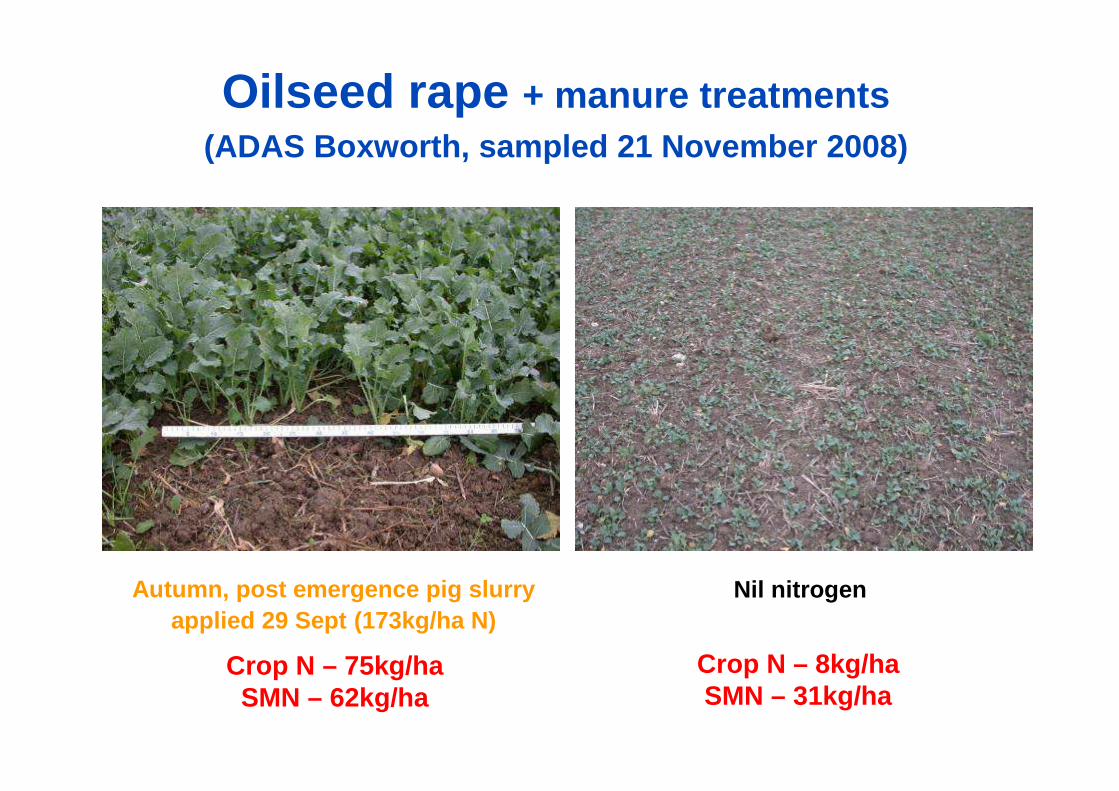
Crop N – 75kg/haSMN – 62kg/ha
Oilseed rape + manure treatments (ADAS Boxworth, sampled 21 November 2008)
Autumn, post emergence pig slurry applied 29 Sept (173kg/ha N)
Nil nitrogen
Crop N – 8kg/haSMN – 31kg/ha

Green manures: N uptake
� Species and over-winter weather influence N retention by green manures

Green cover: N uptake
� NO3 loss is smallest (& N uptake greatest) when cover established early
� Cover crops can reduce NO 3loss over-winter by 50 kg/ha N

Potato Council Green Manures Grower Field Trial (pre - potatoes, spring 2012)
plot crop target sowing date
seed rate kg/ha
seedbed fert. kg/ha N
1 rye early Sept 180 -
2 Natural regeneration
n/a n/a -
3 mustard (std) mid Aug 20 -
4 bare stubble n/a n/a -
5 oil radish mid Aug 25 50
6 caliente mustard mid Aug 8 50
(WB Daw & Son, Rugeley, Staffs)

Green manures grower field trial LH – stubble; RH – mustard (1st Feb 2012)

Green manures: promoting greater resource efficiency
Green Manures …
� take up c.30-50 kg N/ha otherwise leached over-wint er
� conserve water and nutrients otherwise lost from la nd
� reduce risk of erosion, loss of topsoil and water p ollution
� can supply available N and soil aeration benefits w hen used prior to spring-sown crops
� suppress weeds; some species discourage pests &/or diseases
� species choice, management methods and ELS points can keep costs down and minimise limitations
� establish by mid-Sept; destroy mid-Dec to mid-Feb
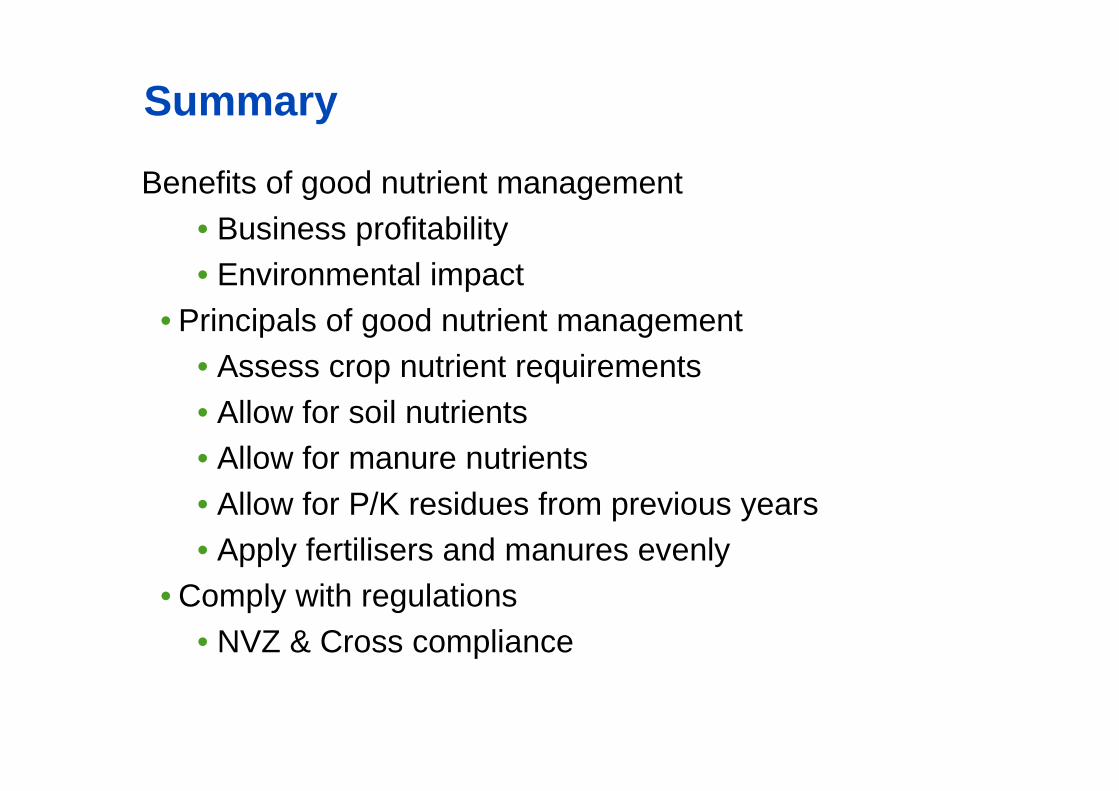
Summary
Benefits of good nutrient management• Business profitability• Environmental impact
• Principals of good nutrient management• Assess crop nutrient requirements• Allow for soil nutrients• Allow for manure nutrients• Allow for P/K residues from previous years• Apply fertilisers and manures evenly
• Comply with regulations• NVZ & Cross compliance

Potato Council South West Potato Day, 26 April 2012
Reducing greenhouse gas emissions
Thank You!