Embed Size (px)
Citation preview

ANNUAL REPORT
For the Financial Period 1 January 2013 to 31 May 2014
KENANGA GROWTH FUND
Kenanga Investors Berhad (353563-P)


KENANGA GROWTH FUND
Contents Page
Corporate Directory ii
Directory of Manager’s Offi ces iii
Fund Information 1
Manager’s Report 2 - 6
Fund Performance 7 - 9
Trustee’s Report 10 - 11
Independent Auditor’s Report 12 - 13
Statement by the Manager 14
Financial Statement 15 - 43

ii Kenanga Growth Fund Annual Report
CORPORATE DIRECTORY
MANAGER: KENANGA INVESTORS BERHAD (Company No. 353563-P) REGISTERED OFFICE BUSINESS OFFICEKenanga Investors Berhad (KIB) Suite 12.02, 12th Floor, Kenanga International,8th Floor, Kenanga International, Jalan Sultan Ismail,Jalan Sultan Ismail, 50250 Kuala Lumpur, Malaysia.50250 Kuala Lumpur, Malaysia. Tel: 03-2057 3688Tel: 03-2162 1490 Fax: 03-2161 8807Fax: 03-2161 4990 E-mail: [email protected] Website: www.KenangaInvestors.com.my
BOARD OF DIRECTORS INVESTMENT COMMITTEEDatuk Syed Ahmad Alwee Alsree Bruce Kho Yaw Huat (Chairman) (Chairman)Syed Zafi len Syed Alwee Syed Zafi len Syed Alwee (Independent Director) (Independent Member)YM Raja Dato’ Seri Abdul Aziz bin Raja Salim Vivek Sharma (Independent Director) (Independent Member)Vivek Sharma Peter John Rayner (Independent Director) (Independent Member)Peter John Rayner Abdul Razak bin Ahmad (Independent Director)Bruce Kho Yaw HuatAbdul Razak bin Ahmad
COMPANY SECRETARY: NORLIZA ABD SAMAD (MAICSA 7011089)9th Floor, Kenanga International, Jalan Sultan Ismail, 50250 Kuala Lumpur, Malaysia.Tel: 03-2162 1490 Fax: 03-2161 4990 TRUSTEE: CIMB COMMERCE TRUSTEE BERHAD (Company No. 167913-M) REGISTERED OFFICE BUSINESS OFFICE Level 13, Menara CIMB Level 21, Menara CIMBJalan Stesen Sentral 2 Jalan Stesen Sentral 2Kuala Lumpur Sentral Kuala Lumpur Sentral50490 Kuala Lumpur. 50490 Kuala Lumpur.Tel: 03-2261 8888 Tel: 03-2261 8888Fax: 03-2261 0099 Fax: 03-2261 9889Website: www.cimb.com
AUDITOR: ERNST & YOUNG (AF: 0039)Level 23A, Menara Milenium, Jalan Damanlela, Pusat Bandar Damansara, 50490 Kuala Lumpur.Tel: 03-7495 8000 Fax: 03-2095 5332
TAX ADVISER: ERNST & YOUNG TAX CONSULTANTS SDN BHD (Company No. 179793-K)Level 23A, Menara Milenium, Jalan Damanlela, Pusat Bandar Damansara, 50490 Kuala Lumpur.Tel: 03-7495 8000 Fax: 03-2095 5332
MEMBERSHIP: FEDERATION OF INVESTMENT MANAGERS MALAYSIA (FIMM)19-06-1, 6th Floor, PNB Damansara, 19 Lorong Dungun, Damansara Heights, 50490 Kuala Lumpur.Tel: 03-2093 2600 Fax: 03-2093 2700 Website: www.fi mm.com.my

iiiKenanga Growth Fund Annual Report
DIRECTORY OF MANAGER’S OFFICES
REGIONAL BRANCH OFFICES:
Kuala LumpurSuite 12.02, 12th FloorKenanga InternationalJalan Sultan Ismail50250 Kuala Lumpur, MalaysiaTel : 03-2057 3688 Fax : 03-2161 8807
MelakaNo. 25-1 Jalan Kota Laksamana 2/17Taman Kota Laksamana Seksyen 275200 MelakaTel : 06-281 8913 / 06-282 0518 Fax : 06-281 4286
KlangNo. 12 Jalan Batai Laut 3, Taman Intan41300 Klang, Selangor Darul EhsanTel : 03-3341 8818 / 03-3348 7889 Fax : 03-3341 8816
Penang16th Floor, Menara Boustead Penang 39, Jalan Sultan Ahmad Shah 10050 Penang. Tel : 04-227 3788 Fax : 04-210 6644
Seremban 2nd Floor, No. 1D-2 Jalan Tuanku Munawir 70000 Seremban, Negeri SembilanTel : 06-761 5678 Fax : 06-761 2242
Johor BahruLot 11.03, 11th FloorMenara MSC Cyberport5 Jalan Bukit Meldrum80300 Johor Bahru, JohorTel : 07-223 7505 / 4798 Fax : 07-223 4802
Kuching1st Floor, No 71, Lot 7Lot 10900, Jalan Tun Jugah93350 Kuching, SarawakTel : 082-572 228 Fax : 082-572 229
Kota KinabaluA-03-11, 3rd FloorBlock A Warisan SquareJalan Tun Fuad Stephens88000 Kota Kinabalu, SabahTel : 088-447 089 / 088-448 106 Fax : 088-447 039
IpohSuite 1, 2nd Floor,63 Persiaran Greenhill,30450 Ipoh, Perak, MalaysiaTel : 05-254 7573 / 7570 Fax : 05-254 7606

1 Kenanga Growth Fund Annual Report
1. FUND INFORMATION
1.1 Fund Name
Kenanga Growth Fund (KGF or the Fund)
1.2 Fund Type / Category
Equity / Growth
1.3 Investment Objective
The Fund aims to provide unit holders with long-term capital growth.
1.4 Investment Strategy
The Fund’s assets are actively invested in a diversifi ed portfolio of Malaysian equity and equity-related securities of companies with sustainable business model that is trading at discount to its intrinsic value.
1.5 Duration
The Fund was launched on 17 January 2000 and shall exist as long as it appears to the Manager and the Trustee that it is in the interests of the unit holders for it to continue.
1.6 Performance Benchmark
FTSE-Bursa Malaysia Kuala Lumpur Composite Index (FBM-KLCI).
1.7 Distribution Policy
Income distribution is incidental, if any.
1.8 Breakdown of unit holdings of KGF as at 31 May 2014
Size of holdings No. of unitholders No. of units held 5,000 and below 3,978 6,603,028 5,001 - 10,000 1,013 7,281,418 10,001 - 50,000 1,507 32,699,331 50,001 - 500,000 376 43,549,888 500,001 and above 20 145,660,145 Total 6,894 235,793,810

2Kenanga Growth Fund Annual Report
2. MANAGER’S REPORT
2.1 Explanation on whether the Fund has achieved its investment objective.
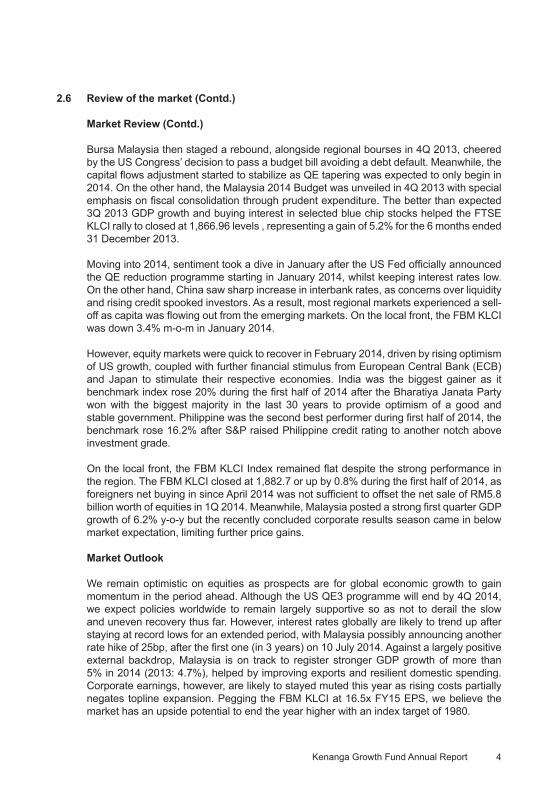
For the periods 1-year, 3-years and since inception, the Fund outperformed its benchmark. Since inception, the Fund has appreciated by 253.8% in Net Asset Value terms (whilst its benchmark rose 96.5%), thus achieving the Fund’s stated objective to provide long-term capital growth.
2.2 Comparison between the Fund’s performance and performance of the benchmark
Performance Chart Since Launch (17/01/2000– 31/05/2014)Kenanga Growth Fund vs FTSE-Bursa Malaysia Kuala Lumpur Composite Index
Source: Lipper
2.3 Investment strategies and policies employed during the period under review
For the period under review, the Fund continued with its strategy of investing in companies with sustainable business models and competent management, whilst trading at a discount to their intrinsic / fair value. The Fund focused on companies whose top line / revenue should prove to be relatively more resilient to a global economic slowdown and have the ability to maintain their profi t margins.
Sectors that we favour include: i) oil and gas, ii) construction, iii) exporters, iv) plantations, and v) manufacturers.

3 Kenanga Growth Fund Annual Report
2.4 The Fund’s asset allocation as at 31 May 2014 and comparison with the previous fi nancial year as at 31 December 2012.
Asset 31 May 2014 31 Dec 2012 Quoted investment securities 77.3% 90.4% Short term deposits and cash 22.7% 9.6%
Reason for the differences in asset allocation
As at 31 May 2014, the asset allocation of the Fund stood at 77.3% in equities and the balance of 22.7% in liquidity. The decreased in equities exposure during the period under review mainly due to infl ow of new fund.
2.5 Fund performance analysis based on NAV per unit (adjusted for income distribution; if any) since last review period.
Period under review Kenanga Growth Fund 38.23% FTSE-Bursa Malaysia Kuala Lumpur Composite Index (FBM-KLCI) 10.92%
Source: Lipper
For the period under review to 31 May 2014, the Fund appreciated by 38.23%, outperforming the 10.92% increase in the FBM-KLCI. The outperformance was mainly due to stock selection.
2.6 Review of the market
Market Review
In the fi rst half of 2013, equity markets were on an uptrend benefi tting from the abundant liquidity unleashed from the US’s quantitative easing (QE)3 programme, whilst governments around the world adopted a loose monetary policy to help refl ate their respective economies. The Japanese Nikkei, for example, soared 31.6% from January 2013 to June 2013, following the government’s surprise decision to infl ate the long stagnant economy with a US-style QE programme. The emerging countries of ASEAN, led by Philippines and Thailand rose by 11.6% and 11.2% respectively in the same period as investors reacted positively to the strong economic growth of these economies.
Malaysia lagged the regional markets especially in the fi rst quarter of 2013 due to uncertainty over the 13th Malaysia General Election. It then played a strong catch-up post election as the political risk premium associated with election uncertainty was removed with the incumbent party staying fi rmly in control.
There was a major downturn in June 2013 after the Fed’s chairman Ben Bernanke fi rst hinted on scaling back on its QE3 programme. The situation was made worse when the PBoC initially refused to ease a liquidity squeeze in China interbank market which caused a sharp spike in SHIBOR rate where it peaked at 13.4%. As a result, China domestic (-14% m-on-m), Philippines (-7.9% m-o-m) and Hong Kong (-7.1% m-o-m) markets fell signifi cantly in June 2013.
4Kenanga Growth Fund Annual Report
2.6 Review of the market (Contd.)
Market Review (Contd.)
Bursa Malaysia then staged a rebound, alongside regional bourses in 4Q 2013, cheered by the US Congress’ decision to pass a budget bill avoiding a debt default. Meanwhile, the capital fl ows adjustment started to stabilize as QE tapering was expected to only begin in 2014. On the other hand, the Malaysia 2014 Budget was unveiled in 4Q 2013 with special emphasis on fi scal consolidation through prudent expenditure. The better than expected 3Q 2013 GDP growth and buying interest in selected blue chip stocks helped the FTSE KLCI rally to closed at 1,866.96 levels , representing a gain of 5.2% for the 6 months ended 31 December 2013.
Moving into 2014, sentiment took a dive in January after the US Fed offi cially announced the QE reduction programme starting in January 2014, whilst keeping interest rates low. On the other hand, China saw sharp increase in interbank rates, as concerns over liquidity and rising credit spooked investors. As a result, most regional markets experienced a sell-off as capita was fl owing out from the emerging markets. On the local front, the FBM KLCI was down 3.4% m-o-m in January 2014.
However, equity markets were quick to recover in February 2014, driven by rising optimism of US growth, coupled with further fi nancial stimulus from European Central Bank (ECB) and Japan to stimulate their respective economies. India was the biggest gainer as it benchmark index rose 20% during the fi rst half of 2014 after the Bharatiya Janata Party won with the biggest majority in the last 30 years to provide optimism of a good and stable government. Philippine was the second best performer during fi rst half of 2014, the benchmark rose 16.2% after S&P raised Philippine credit rating to another notch above investment grade.
On the local front, the FBM KLCI Index remained fl at despite the strong performance in the region. The FBM KLCI closed at 1,882.7 or up by 0.8% during the fi rst half of 2014, as foreigners net buying in since April 2014 was not suffi cient to offset the net sale of RM5.8 billion worth of equities in 1Q 2014. Meanwhile, Malaysia posted a strong fi rst quarter GDP growth of 6.2% y-o-y but the recently concluded corporate results season came in below market expectation, limiting further price gains.
Market Outlook
We remain optimistic on equities as prospects are for global economic growth to gain momentum in the period ahead. Although the US QE3 programme will end by 4Q 2014, we expect policies worldwide to remain largely supportive so as not to derail the slow and uneven recovery thus far. However, interest rates globally are likely to trend up after staying at record lows for an extended period, with Malaysia possibly announcing another rate hike of 25bp, after the fi rst one (in 3 years) on 10 July 2014. Against a largely positive external backdrop, Malaysia is on track to register stronger GDP growth of more than 5% in 2014 (2013: 4.7%), helped by improving exports and resilient domestic spending. Corporate earnings, however, are likely to stayed muted this year as rising costs partially negates topline expansion. Pegging the FBM KLCI at 16.5x FY15 EPS, we believe the market has an upside potential to end the year higher with an index target of 1980.

5 Kenanga Growth Fund Annual Report
2.6 Review of the market (Contd.)
Market Outlook (Contd.)
In the near-term, however, based on historical statistics, third quarter equity performances are not among the most exciting periods – Since 2000 to 2013 they performed by -0.4% on average. We are currently experiencing toppish market valuation, threat of an interest rate hike, creeping infl ation but the good news is there is still ample liquidity in the system supporting equity prices. Put together, we believe market would be lackluster with range bound trading in 3Q until corporate earnings catches up with the current premium valuations. As we expect a stronger 4Q, we will add on current market weakness to take advantage of a rebound in the subsequent months.
Strategy
We will continue to adopt a bar-bell strategy of investing in both beta and defensive stocks while adding on any market weakness. Our stock selection favours sectors that will benefi t from being the main drivers of the economy such as the oil & gas (which will continue to form the core holdings due to robust CAPEX programme underpinning earnings growth), construction (benefi ciary of ETP programme), exporters/manufacturers (benefi ciaries of weak Ringgit and recovering external demand like glove, tech, ICT etc.) and plantation sector (rebound of CPO price from a decline in 2013).

6Kenanga Growth Fund Annual Report
2.7 Income Distribution
For the fi nancial period under reviewed, the Fund has declared the followings income distribution:
Gross/Net Cum-NAV Ex-NAV distribution per unit per unit per unit Distribution Date (sen) (RM) (RM)
28 May 2014 6.00 1.0497 0.9897
2.8 Details of any unit split exercise
The Fund did not carry out any unit split exercise during the fi nancial period under review.
2.9 Signifi cant changes in the state of affair of the Fund during the period
Pursuant to a supplemental deed dated 19 November 2013 between Kenanga Investors Berhad and CIMB Commerce Trustee Berhad, CIMB Commerce Trustee Berhad has agreed to act as the trustee for the fund and replaced HSBC (Malaysia) Trustee Berhad.
In addition to the above, the fi nancial year end for the Fund was changed to 31 May from 31 December.
2.10 Circumstances that materially affect any interests of the unitholders
During the period under review, there were no circumstances that materially affected any interests of the unitholders. However there was a change in the trustee of the Fund and fi nancial year end as detailed in 2.9.
2.11 Rebates & Soft commissions
Any rebates received are channeled back to the Fund. On the other hand, soft commissions received from the stockbrokers for goods and services such as technical analysis software, fundamental database, fi nancial wire services, stock quotation system and portfolio management software incidental to investment management of the Fund shall be retained by the Manager. For the period under review, the Manager has received soft commissions from stockbrokers.
7 Kenanga Growth Fund Annual Report
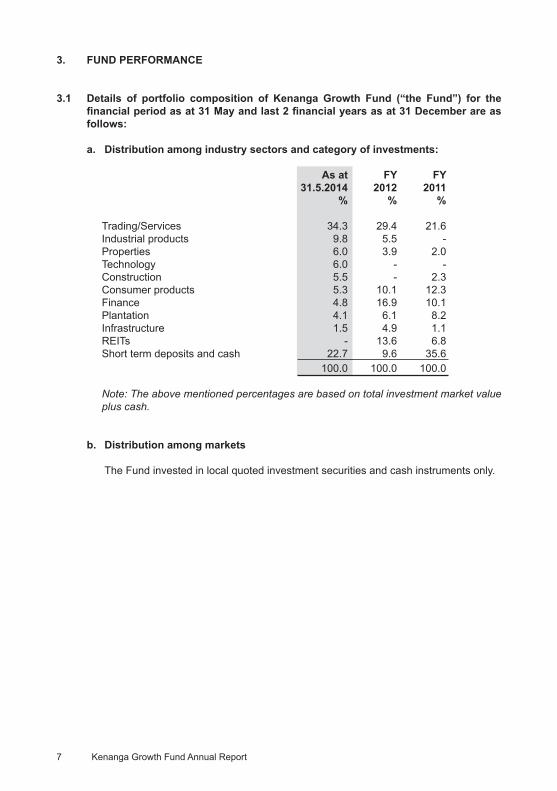
3. FUND PERFORMANCE
3.1 Details of portfolio composition of Kenanga Growth Fund (“the Fund”) for the fi nancial period as at 31 May and last 2 fi nancial years as at 31 December are as follows:
a. Distribution among industry sectors and category of investments:
As at FY FY 31.5.2014 2012 2011 % % %
Trading/Services 34.3 29.4 21.6 Industrial products 9.8 5.5 - Properties 6.0 3.9 2.0 Technology 6.0 - - Construction 5.5 - 2.3 Consumer products 5.3 10.1 12.3 Finance 4.8 16.9 10.1 Plantation 4.1 6.1 8.2 Infrastructure 1.5 4.9 1.1 REITs - 13.6 6.8 Short term deposits and cash 22.7 9.6 35.6 100.0 100.0 100.0
Note: The above mentioned percentages are based on total investment market value plus cash.
b. Distribution among markets
The Fund invested in local quoted investment securities and cash instruments only.

8Kenanga Growth Fund Annual Report
3.2 Performance details of the Fund for the fi nancial period ended 31 May 2014 and last 2 fi nancial years ended 31 December are as follows:
Period 1.1.2013 to FY FY 31.5.2014 2012 2011
Net asset value (“NAV”) (RM Million) 234.29* 80.51 51.91 Units in circulation (Million) 235.79 106.24 24.35 NAV per unit (RM) 0.9936* 0.7578 2.1317 Highest NAV per unit (RM) 1.0517 2.2536 2.1317 Lowest NAV per unit (RM) 0.7436 0.7324 1.7905 Total return (%) 38.23 14.06 19.28 - Capital growth (%) 31.12 7.29 19.28 - Income distribution (%) 7.11 6.77 - Gross distribution per unit (sen) 6.00# 4.81 - Net distribution per unit (sen) 6.00# 4.73 - Unit split (ratio) - 2:1 - Management expense ratio (“MER”) (%)1 2.24 1.88 1.63 Portfolio turnover ratio (“PTR”) (times)2 1.34 0.49 0.49
Note: Total return is the actual return of the Fund for the respective fi nancial period/years, computed based on NAV per unit and net of all fees.
MER is computed based on the total fees and expenses incurred by the Fund divided by the average fund size calculated on a daily basis. PTR is computed based on the average of the total acquisitions and total disposals of investment securities of the Fund divided by the average fund size calculated on a daily basis.
1 MER is higher against previous fi nancial year mainly due to longer period during the fi nancial
period under review.
2 PTR is higher against previous year mainly due to infl ow of new fund.
* Based on bid price fair valuation method on all investments held by the Fund as at 31 May 2014, the NAV and NAV per unit would be RM233.11 million and RM0.9886 respectively.
(As disclosed under Note 11 of the fi nancial statements)
# Date of distribution is shown in part 2.7 - Income Distribution.

9 Kenanga Growth Fund Annual Report
3.3 Average total return of the Fund
1 Year 3 Years 5 Years 31 May 13 31 May 11 31 May 09 - 31 May 14 - 31 May 14 - 31 May 14
Kenanga Growth Fund 19.30% 22.85% 37.40% FTSE-Bursa Malaysia Kuala Lumpur Composite Index (FBM-KLCI) 5.89% 6.74% 15.88%
Source: Lipper
3.4 Annual total return of the Fund
Period under review 1 Year 1 Year 1 Year 1 Year 31 Dec 12 31 Dec 11 31 Dec 10 31 Dec 09 31 Dec 08 - 31 May 14 -31 Dec 12 -31 Dec 11 -31 Dec 10 -31 Dec 09
Kenanga Growth Fund 38.23% 14.06% 19.07% 32.71% 33.31% FTSE-Bursa Malaysia Kuala Lumpur Composite Index (FBM-KLCI) 10.92% 10.34% 0.78% 19.34% 45.17%
Source: Lipper
Investors are reminded that past performance is not necessarily indicative of future performance. Unit prices and investment returns may fl uctuate
10Kenanga Growth Fund Annual Report
4.1 TRUSTEE’S REPORT TO THE UNITHOLDERS OF KENANGA GROWTH FUND
We have acted as Trustee of KENANGA GROWTH FUND (“the Fund”) for the fi nancial period from 1 January 2013 to 2 December 2013. To the best of our knowledge, KENANGA INVESTORS BERHAD (“the Manager”), has operated and managed the Fund in accordance with the following:
a) limitations imposed on the investment powers of the Manager and the Trustee under
the Deeds, the Securities Commission’s Guidelines on Unit Trust Funds, the Capital Markets and Services Act 2007 and other applicable laws;
b) valuation/pricing is carried out in accordance with the Deeds and any regulatory requirements; and
c) creation and cancellation of units are carried out in accordance with the Deeds and
any regulatory requirements.
For HSBC (Malaysia) Trustee Berhad
TAN BEE NIE Head, Trustee Operations
Kuala Lumpur, Malaysia 23 July 2014

11 Kenanga Growth Fund Annual Report
4.2 TRUSTEE’S REPORT TO THE UNITHOLDERS OF KENANGA GROWTH FUND
We, CIMB COMMERCE TRUSTEE BERHAD (“the Trustee”), being the Trustee of KENANGA GROWTH FUND (“the Fund”) are of the opinion that KENANGA INVESTORS BERHAD (“the Manager”), acting in the capacity of Manager of the Fund, has fulfi lled its duties in the following manner for the fi nancial period from 3 December 2013 to 31 May 2014.
a) The Fund has been managed in accordance with the limitations imposed on the
investment powers of the Manager and the Trustee under the Deed, the Securities Commission Malaysia’s Guidelines on Unit Trust Funds, the Capital Markets and Services (Amendment) Act 2012 and other applicable laws during fi nancial period from 3 December 2013 to 31 May 2014;
b) Valuation/pricing of units of the Fund has been carried out in accordance with the Deed and relevant regulatory requirements;
c) Creation and cancellation of units have been carried out in accordance with the Deed
and relevant regulatory requirements; and d) The distribution of returns by the Fund is tied to and refl ects the investment objective
of the Fund.
For and on behalf of CIMB COMMERCE TRUSTEE BERHAD (167913-M)
LEE KOOI YOKE Chief Operating Offi cer
Kuala Lumpur, Malaysia 23 July 2014
12Kenanga Growth Fund Annual Report
5. INDEPENDENT AUDITORS’ REPORT TO THE UNIT HOLDERS OF KENANGA GROWTH FUND
Report on the fi nancial statements
We have audited the fi nancial statements of Kenanga Growth Fund (“the Fund”), which comprise the statement of fi nancial position as at 31 May 2014 and the statement of comprehensive income, statement of changes in net asset value and statement of cash fl ows for the fi nancial period 1 January 2013 to 31 May 2014, and a summary of signifi cant accounting policies and other explanatory information, as set out on pages 15 to 43.
Manager’s and Trustee’s responsibility for the fi nancial statements and fair presentation
The Manager of the Fund is responsible for the preparation of fi nancial statements so as to give a true and fair view in accordance with Malaysian Financial Reporting Standards and International Financial Reporting Standards. The Manager is also responsible for such internal control as the Manager determines is necessary to enable the preparation of fi nancial statements that are free from material misstatement, whether due to fraud or error. The Trustee is responsible for ensuring that the Manager maintains proper accounting and other records as are necessary to enable true and fair presentation of these fi nancial statements.
Auditors’ responsibility
Our responsibility is to express an opinion on these fi nancial statements based on our audit. We conducted our audit in accordance with approved standards on auditing in Malaysia. Those standards require that we comply with ethical requirements and plan and perform the audit to obtain reasonable assurance about whether the fi nancial statements are free from material misstatement.
An audit involves performing procedures to obtain audit evidence about the amounts and disclosures in the fi nancial statements. The procedures selected depend on our judgment, including the assessment of risks of material misstatement of the fi nancial statements, whether due to fraud or error. In making those risk assessments, we consider internal control relevant to the Fund’s preparation of fi nancial statements that give a true and fair view in order to design audit procedures that are appropriate in the circumstances, but not for the purpose of expressing an opinion on the effectiveness of the Fund’s internal control. An audit also includes evaluating the appropriateness of the accounting policies used and the reasonableness of accounting estimates made by the Manager, as well as evaluating the overall presentation of the fi nancial statements.
We believe that the audit evidence we have obtained is suffi cient and appropriate to provide a basis for our audit opinion.
13 Kenanga Growth Fund Annual Report
5. INDEPENDENT AUDITORS’ REPORT TO THE UNIT HOLDERS OF KENANGA GROWTH FUND (CONTD.)
Opinion
In our opinion, the fi nancial statements give a true and fair view of the fi nancial position of the Fund as at 31 May 2014 and of its fi nancial performance, changes in net asset value and the cash fl ows of the Fund for the fi nancial period 1 January 2013 to 31 May 2014 in accordance with Malaysian Financial Reporting Standards and International Financial Reporting Standards.
Other matters This report is made solely to the unitholders of the Fund, as a body, in accordance with
the requirements of the Securities Commission Malaysia’s Guidelines on Unit Trust Funds, and for no other purpose. We do not assume responsibility to any other person for the content of this report.
Ernst & Young Gloria Goh Ewe Gim AF: 0039 No. 1685/04/15(J) Chartered Accountants Chartered Accountant
Kuala Lumpur, Malaysia
23 July 2014
14Kenanga Growth Fund Annual Report
6. STATEMENT BY THE MANAGER
I, Abdul Razak Bin Ahmad, being the director of Kenanga Investors Berhad, do hereby state that, in the opinion of the Manager, the accompanying statement of fi nancial position as at 31 May 2014 and the related statement of comprehensive income, statement of changes in net asset value and statement of cash fl ows for the fi nancial period ended 31 May 2014 together with notes thereto, are drawn up in accordance with Malaysian Financial Reporting Standards and International Financial Reporting Standards so as to give a true and fair view of the fi nancial position of Kenanga Growth Fund as at 31 May 2014 and of its fi nancial performance and cash fl ows for the period then ended and comply with the requirements of the Deed.
For and on behalf of the Manager Kenanga Investors Berhad
Abdul Razak Bin Ahmad
Kuala Lumpur, Malaysia
23 July 2014

The accompanying notes form an integral part of the fi nancial statements.
Kenanga Growth Fund Annual Report15
7. FINANCIAL STATEMENT
7.1 STATEMENT OF COMPREHENSIVE INCOME FOR THE FINANCIAL PERIOD 1 JANUARY 2013 TO 31 MAY 2014
1.1.2013 to 1.1.2012 to Note 31.5.2014 31.12.2012 RM RM
INVESTMENT INCOMEInterest income 1,006,665 439,543 Dividend income 4,085,101 1,781,080 Net gain from investments: - Financial assets at fair value through profi t or loss (“FVTPL”) 40,915,657 6,905,968 46,007,423 9,126,591
EXPENSESManager’s fee 4 2,805,385 984,019 Trustee’s fee 5 121,846 55,432 Auditors’ remuneration 20,000 16,707 Tax agent’s fee 3,068 2,491 Administration expenses 19,910 23,573 Brokerage and other transaction costs 901,981 154,320 3,872,190 1,236,542
NET INCOME BEFORE TAX 42,135,233 7,890,049 Income tax expense 6 (91,723) (83,800) NET INCOME AFTER TAX, REPRESENTING TOTAL COMPREHENSIVE INCOME FOR THE PERIOD/YEAR 42,043,510 7,806,249 Net income after tax is made up as follows: Realised gain 28,110,043 3,215,089 Unrealised gain 13,933,467 4,591,160 42,043,510 7,806,249
Distribution for the period/year:Net distributions 12 13,269,939 5,025,340 Gross distribution per unit (sen) 12 6.00 4.81 Net distribution per unit (sen) 12 6.00 4.73

The accompanying notes form an integral part of the fi nancial statements.
Kenanga Growth Fund Annual Report 16
7.2 STATEMENT OF FINANCIAL POSITION AS AT 31 MAY 2014
Note 31.5.2014 31.12.2012 RM RM
INVESTMENTSFinancial assets at FVTPL 7 180,382,817 77,165,068 Short term deposits 8 50,051,000 7,966,479 230,433,817 85,131,547
OTHER ASSETSAmount due from Manager 1,344,899 885,890 Other receivables 9 2,809,579 11,465 Tax recoverable 102,833 126,527 Cash at bank 2,923,606 252,945 7,180,917 1,276,827
TOTAL ASSETS 237,614,734 86,408,374
LIABILITIESAmount due to Trustee 18,030 5,600 Amount due to Stockbrokers 4,419,646 840,813Other payables 27,500 28,500 Distribution payables 41,318 5,025,340 TOTAL LIABILITIES 4,506,494 5,900,253
EQUITYUnitholder’s contribution 176,273,387 55,449,337 Retained earnings 56,834,853 25,058,784 NET ASSET VALUE (“NAV”) ATTRIBUTABLE TO UNITHOLDERS 10 233,108,240 80,508,121
TOTAL EQUITY AND LIABILITIES 237,614,734 86,408,374
NUMBER OF UNITS IN CIRCULATION 10 (a) 235,793,810 106,243,983 NET ASSET VALUE PER UNIT – EX DISTRIBUTION (RM) 11 0.9886 0.7578

The accompanying notes form an integral part of the fi nancial statements.
Kenanga Growth Fund Annual Report17
7.3 STATEMENT OF CHANGES IN NET ASSET VALUE FOR THE FINANCIAL PERIOD 1 JANUARY 2013 TO 31 MAY 2014
Unitholders’ Retained Total Note contribution earnings NAV
RM RM RM
31.5.2014At beginning of the period 55,449,337 25,058,784 80,508,121 Total comprehensive income - 42,043,510 42,043,510 Creation of units 10(a) 167,807,300 - 167,807,300 Cancellation of units 10(a) (59,283,714) - (59,283,714)Distribution equalisation 10(a) 15,302,962 - 15,302,962 Income distribution 12 3,002,498 (10,267,441) (13,269,939)At end of the period 176,273,387 56,834,853 233,108,240
31.12.2012 At beginning of the year 33,603,092 18,307,221 51,910,313 Total comprehensive income - 7,806,249 7,806,249 Creation of units 10(a) 23,733,343 - 23,733,343Cancellation of units 10(a) (6,258,764) - (6,258,764) Distribution equalisation 10(a) 8,342,320 - 8,342,320Income distribution 12 (3,970,654) (1,054,686) (5,025,340) At end of the year 55,449,337 25,058,784 80,508,121

The accompanying notes form an integral part of the fi nancial statements.
Kenanga Growth Fund Annual Report 18
7.4 STATEMENT OF CASH FLOWS FOR THE FINANCIAL PERIOD 1 JANUARY 2013 TO 31 MAY 2014
1.1.2013 to 1.1.2012 to 31.5.2014 31.12.2012 RM RM
CASH FLOWS FROM OPERATING AND INVESTING ACTIVITIES
Proceeds from sale of fi nancial assets at FVTPL 143,674,109 16,122,756 Purchase of fi nancial assets at FVTPL (205,789,982) (52,145,437)Net dividends received 3,699,197 1,690,268 Interest received 996,966 444,697 Manager’s fee paid (2,632,568) (943,347)Trustee’s fee paid (109,416) (53,263)Auditors’ remuneration paid (20,000) (6,509)Tax agent’s fee paid (3,568) - Payment for other fees and expenses (20,410) (26,065)Cash used in operating and investing activities (60,205,672) (34,916,900)Income tax refund 20,093 - Net cash used in operating and investing activities (60,185,579) (34,916,900)
CASH FLOWS FROM FINANCING ACTIVITIES
Cash received from units created 174,623,765 34,130,915 Cash paid on units cancelled (69,679,499) (9,551,370)Distribution paid (3,505) - Net cash generated from fi nancing activities 104,940,761 24,579,545 NET INCREASE/(DECREASE) IN CASH AND CASH EQUIVALENTS 44,755,182 (10,337,355)CASH AND CASH EQUIVALENTS AT BEGINNING OF THE PERIOD/YEAR 8,219,424 18,556,779 CASH AND CASH EQUIVALENTS AT END OF THE PERIOD/YEAR 52,974,606 8,219,424 Cash and cash equivalents comprise: Cash at bank 2,923,606 252,945 Short term deposits 50,051,000 7,966,479 52,974,606 8,219,424

19 Kenanga Growth Fund Annual Report
7.5 NOTES TO THE FINANCIAL STATEMENTS FOR THE FINANCIAL PERIOD 1 JANUARY 2013 TO 31 MAY 2014
1. THE FUND, THE MANAGER AND THEIR PRINCIPAL ACTIVITIES
Kenanga Growth Fund (the “Fund”) was constituted pursuant to a Deed dated 30 December 1999, (collectively, together with deeds supplemental thereto, referred to as “the Deed”) between the Manager, Kenanga Investors Berhad and HSBC (Malaysia) Trustee Berhad (“the Trustee” prior to 3 December 2013). The Fund has changed its trustee to CIMB Commerce Trustee Berhad (“the Trustee” with effect from 3 December 2013). The aforesaid change was effected on 3 December 2013 via a Second Master Supplemental Deed dated 19 November 2013. The Fund commenced operations on17 January 2000 and will continue to be in operation until terminated as provided under Clause 12 of the Deed.
Kenanga Investors Berhad is a wholly-owned subsidiary of Kenanga Investment Bank Berhad, which in turn is a wholly-owned subsidiary of K & N Kenanga Holdings Berhad, listed on the main board of Bursa Malaysia Securities Berhad. All of these companies are incorporated in Malaysia.
The principal place of business of the Manager is Suite 12.02, 12th Floor, Kenanga International, Jalan Sultan Ismail, 50250 Kuala Lumpur.
The Fund seeks to provide Unitholders with long term capital growth.
The Fund changed its fi nancial year end from 31 December to 31 May pursuant to the Second Master Supplemental Deed dated 19 November 2013.
The fi nancial statements were authorised for issue by the Chief Executive Offi cer of the Manager on 23 July 2014.
2. FINANCIAL RISK AND MANAGEMENT OBJECTIVES AND POLICIES
The Fund is exposed to a variety of risks including market risk (which includes interest rate risk and price risk), credit risk and liquidity risk. Whilst these are the most important types of fi nancial risks inherent in each type of fi nancial instruments, the Manager and the Trustee would like to highlight that this list does not purport to constitute an exhaustive list of all the risks inherent in an investment in the Fund.
The Fund has an approved set of investment guidelines and policies as well as internal controls which sets out its overall business strategies to manage these risks to optimise returns and preserve capital for the unitholders, consistent with the long term objectives of the Fund.

20Kenanga Growth Fund Annual Report
2. FINANCIAL RISK AND MANAGEMENT OBJECTIVES AND POLICIES (CONTD.) a. Market Risk Market risk is the risk that the fair value or future cash fl ows of a fi nancial instrument
will fl uctuate because of changes in market prices. Market risk includes interest rate risk and price risk.
Market risk arises when the value of the fi nancial instruments fl uctuate in response to the activities of individual companies, general market or economic conditions. It stems from the fact that there are economy-wide perils, which threaten all businesses. Hence, investors are exposed to market uncertainties. Fluctuation in the prices of fi nancial instruments caused by uncertainties in the economic, political and social environment will affect the fair value of the Fund.
The Manager manages the risk of unfavorable changes in prices by cautious review of the fi nancial instruments and continuous monitoring of their performance and risk profi les.
i. Interest rate risk
The Fund is not exposed to signifi cant interest rate risk as its deposits are short term in nature and have fi xed interest rates.

21 Kenanga Growth Fund Annual Report
2. FINANCIAL RISK AND MANAGEMENT OBJECTIVES AND POLICIES (CONTD.) a. Market Risk (Contd.) i. Interest rate risk (Contd.)
Interest rate risk exposure
The following table analyses the Fund’s interest rate risk exposure. The Fund’s assets and liabilities are disclosed at fair value and categorised by the earlier of contractual re-pricing or maturity dates.
Non- Weighted exposure average to interest effective Up to rate interest 1 year movement Total rate* RM RM RM % 31.5.2014AssetsFinancial assets at FVTPL - 180,382,817 180,382,817 Short term deposits 50,051,000 - 50,051,000 3.00Other assets 12,164 7,065,920 7,078,084 50,063,164 187,448,737 237,511,901 Liabilities Other liabilities - 4,506,494 4,506,494 Total interest rate sensitivity gap 50,063,164 182,942,243 233,005,407 31.12.2012Assets Financial assets at FVTPL - 77,165,068 77,165,068 Short term Islamic deposits 7,966,479 - 7,966,479 2.97Other assets 2,465 1,147,835 1,150,300 7,968,944 78,312,903 86,281,847 Liabilities Other liabilities - 5,900,253 5,900,253
Total interest rate sensitivity gap 7,968,944 72,412,650 80,381,594
* Computed based on interest-bearing assets only.

22Kenanga Growth Fund Annual Report
2. FINANCIAL RISK AND MANAGEMENT OBJECTIVES AND POLICIES (CONTD.) a. Market Risk (Contd.) ii. Price risk
Price risk is the risk of unfavorable changes in the fair values of quoted equity securities and quoted collective investment scheme. The Fund invests in quoted equity securities and quoted collective investment schemes which are exposed to price fl uctuations. This may then affect the unit price of the Fund.
Price Risk Sensitivity
Manager’s best estimate of the effect on the profi t for the period due to a reasonably possible change in investments in quoted equity securities and quoted collective investment schemes with all other variables held constant is indicated in the table below:
Changes in Effects on profi t price for the period/year Increase/(Decrease) Increase/(Decrease) Basis points RM 31.5.2014 Financial assets at FVTPL 5/(5) 90,191/(90,191) 31.12.2012 Financial assets at FVTPL 5/(5) 38,583/(38,583)
In practice, the actual trading results may differ from the sensitivity analysis above and the difference could be material.
Price risk concentration
The following table sets out the Fund’s exposure and concentration to price risk based on its portfolio of quoted investment securities as at the reporting date.
Fair value Percentage of NAV 31.5.2014 31.12.2012 31.5.2014 31.12.2012 RM RM % % Financial assets at FVTPL 180,382,817 77,165,068 77.4 95.8

23 Kenanga Growth Fund Annual Report
2. FINANCIAL RISK AND MANAGEMENT OBJECTIVES AND POLICIES (CONTD.) a. Market Risk (Contd.) ii. Price risk (Contd.)
Price risk concentration (Contd.)
The Fund’s concentration of quoted investment securities price risk analysed by the Fund’s quoted equity securities and quoted collective investment schemes by sector is as follows:
Fair value Percentage of NAV 31.5.2014 31.12.2012 31.5.2014 31.12.2012 RM RM % % Trading/Services 79,942,381 25,102,330 34.3 31.2 Industrial products 22,976,635 4,672,708 9.9 5.8 Properties 14,075,805 3,350,480 6.0 4.1 Technology 14,052,365 - 6.0 - Construction 12,747,324 - 5.5 - Consumer products 12,350,286 8,666,999 5.3 10.8 Finance 11,279,567 14,402,472 4.8 17.9 Plantation 9,516,212 5,219,040 4.1 6.5 Infrastructure 3,442,242 4,179,000 1.5 5.2 REITs - 11,572,039 - 14.4 180,382,817 77,165,068 77.4 95.9

24Kenanga Growth Fund Annual Report
2. FINANCIAL RISK AND MANAGEMENT OBJECTIVES AND POLICIES (CONTD.) b. Credit Risk Credit risk is the risk that the counterparty to a fi nancial instrument will cause a
fi nancial loss to the Fund by failing to discharge an obligation. The Manager manages the credit risk by undertaking credit evaluation to minimise such risk.
i. Credit risk exposure
At the reporting date, the Fund’s maximum exposure to credit risk is represented by the carrying amount of each class of fi nancial assets recognised in the statement of fi nancial position.
ii. Financial assets that are either past due or impaired
As at reporting date, there are no fi nancial assets that are either past due or impaired.
iii. Credit quality of fi nancial assets
The Fund deposits only with reputable fi nancial institutions. The following table analyses the fi nancial institutions by rating category:
Short term deposits
Percentage of total short term deposits Percentage of NAV 31.5.2014 31.12.2012 31.5.2014 31.12.2012 % % % %
Rating P1 100.0 100.0 21.5 9.9
c. Liquidity Risk
Liquidity risk is defi ned as the risk that the Fund will encounter diffi culty in meeting obligations associated with fi nancial liabilities that are to be settled by delivering cash or another fi nancial asset. Exposure to liquidity risk arises because of the possibility that the Fund could be required to pay its liabilities or cancel its units earlier than expected. The Fund is exposed to cancellation of its units on a regular basis. Units sold to unitholders by the Manager are cancellable at the unitholder’s option based on the Fund’s NAV per unit at the time of cancellation calculated in accordance with the Deed.
The liquid assets comprise cash, deposits with licensed fi nancial institutions and other instruments, which are capable of being converted into cash within 7 days.
The following table analyses the maturity profi le of the Fund’s fi nancial assets and fi nancial liabilities in order to provide a complete view of the Fund’s contractual commitments and liquidity.

25 Kenanga Growth Fund Annual Report
2. FINANCIAL RISK AND MANAGEMENT OBJECTIVES AND POLICIES (CONTD.) c. Liquidity Risk (Contd.)
Note Up to 1 year RM
31.5.2014 Assets Financial assets at FVTPL 180,382,817 Short term deposits 50,051,000 Other assets 7,078,084 (i) 237,511,901 Liabilities Other liabilities (ii) 4,506,494 Equity (iii) 233,108,240 Liquidity gap (102,833) 31.12.2012 Assets Financial assets at FVTPL 77,165,068 Short term Islamic deposits 7,966,479 Other assets 1,150,300 (i) 86,281,847 Liabilities Other liabilities (ii) 5,900,253 Equity (iii) 80,508,121 Liquidity gap (126,527)

26Kenanga Growth Fund Annual Report
2. FINANCIAL RISK AND MANAGEMENT OBJECTIVES AND POLICIES (CONTD.) c. Liquidity Risk (Contd.)
i) Financial assets
Analysis of fi nancial assets at FVTPL into maturity groupings is based on the expected date on which these assets will be realised. The Fund’s investments have been included in the “up to 1 year” category on the assumption that these are highly liquid investments which can be realised should all of the Fund’s unitholders’ equity be required to be redeemed. For other assets, the analysis into maturity groupings is based on the remaining period from the end of the reporting period to the contractual maturity date or if earlier, the expected date on which the assets will be realised.
ii) Financial liabilities
The maturity grouping is based on the remaining period from the end of the reporting period to the contractual maturity date. When counterparty has a choice of when the amount is paid, the liability is allocated to the earliest period in which the Fund can be required to pay.
iii) Equity
As unitholders can request for redemption of their units, they have been categorised as having a maturity of “up to 1 year”. As a result, it appears that the Fund has a liquidity gap within “up to 1 year”. However, the Fund believes that it would be able to liquidate its investments should the need arises to satisfy all the redemption requirements of the Fund.
3. SUMMARY OF SIGNIFICANT ACCOUNTING POLICIES
a. Basis of Accounting
The fi nancial statements of the Fund have been prepared in accordance with Malaysian Financial Reporting Standards (“MFRS”) as issued by Malaysian Accounting Standards Board (“MASB”) and International Financial Reporting Standards (“IFRS”) issued by International Accounting Standards Board (“IASB”).
The accounting policies adopted are consistent with those of the previous fi nancial year except for the adoption of the new and amended MFRS and IC interpretations which became effective for the fund on 1 January 2013. The adoption of the new and amended MFRS and IC interpretations did not have any signifi cant impact on the fi nancial position or performance of the Fund.
The fi nancial statements have been prepared on the historical cost basis except as disclosed in the accounting policies below.

27 Kenanga Growth Fund Annual Report
3. SUMMARY OF SIGNIFICANT ACCOUNTING POLICIES (CONTD.)
b. Standard and Interpretations Issued But Not Yet Effective
As at the date of authorisation of these fi nancial statements, the following Standards and Amendments have been issued by MASB but are not yet effective and have not been adopted by the Fund.
Effective for fi nancial period Description beginning on or after Amendments to MFRS 132: Offsetting Financial Assets and Financial Liabilities 1 January 2014 Amendments to MFRS 10, MFRS 12, and MFRS 127: Investment Entities 1 January 2014 Amendments to MFRS 136: Recoverable Amount Disclosure for Non-Financial Assets 1 January 2014 IC Interpretation 21 Levies 1 January 2014 Amendments to MFRSs contained in the documents entitled Annual Improvements 2010 - 2012 cycle 1 July 2014 Amendments to MFRSs contained in the documents entitled Annual Improvements 2011 - 2014 cycle 1 July 2014 MFRS 9: Financial Instruments (IFRS 9 Issued by IASB in November 2009) To be announced MFRS 9: Financial Instruments (IFRS 9 Issued by IASB in October 2010) To be announced MFRS 9: Financial Insrumentss: Hedge Accounting and amendments to MFRS 9, MFRS 7 and MFRS 139 To be announced
The Fund will adopt the above pronouncements when they become effective in the respective fi nancial periods. These pronouncements are not expected to have any signifi cant impact to the fi nancial statements of the Fund upon their initial application, other than MFRS 9.
MFRS 9 refl ects the fi rst phase of work on the replacement of MFRS 139 and applies to classifi cation and measurement of fi nancial assets and fi nancial liabilities as defi ned in MFRS 139. The standard was initially effective for annual periods beginning on or after 1 January 2013, but Amendments to MFRS 9: Mandatory Effective Date of MFRS 9 and Transition Disclosures, issued in March 2012, moved the mandatory effective date to 1 January 2015. Subsequently, on 14 February 2014, it was announced that the new effective date will be decided when the project is closer to completion. The adoption of the fi rst phase of MFRS 9 will have an effect on the classifi cation and measurement of the Fund’s fi nancial assets, but will not have an impact on classifi cation and measurements of the Fund’s fi nancial liabilities. The Fund will quantify the effect in conjunction with the other phases, when the fi nal standard including all phases is issued.

28Kenanga Growth Fund Annual Report
3. SUMMARY OF SIGNIFICANT ACCOUNTING POLICIES (CONTD.)
c. Financial Assets
Financial assets are recognised in the statement of fi nancial position when, and only when, the Fund becomes a party to the contractual provisions of the fi nancial instrument.
When fi nancial assets are recognised initially, they are measured at fair value, plus, in the case of fi nancial assets not at FVTPL, directly attributable transaction costs.
The Fund determines the classifi cation of its fi nancial assets at initial recognition, which are receivables.
i. Financial assets at FVTPL
Financial assets are classifi ed as fi nancial assets at FVTPL if they are held for trading or are designated as such upon initial recognition.
Financial assets held for trading include quoted equity securities and quoted collective investment schemes acquired principally for the purpose of selling in the near term.
Subsequent to initial recognition, fi nancial assets at FVTPL are measured at fair value. Changes in the fair value of those fi nancial instruments are recorded in profi t or loss.
Interest earned and dividend revenue elements of such instruments are recorded separately in “interest income” and “dividend income” respectively.
ii. Receivables
Financial assets with fi xed or determinable payments that are not quoted in an active market are classifi ed as receivables.
Subsequent to initial recognition, receivables are measured at amortised cost using the effective rate method. Gain or loss is recognised in profi t or loss when the receivable is derecognised or impaired, and through the amortisation process.
A fi nancial asset is derecognised when the contractual right to receive cash fl ows from the asset has expired. On derecognition of a fi nancial asset, the difference between the carrying amount and the sum of the consideration received is recognised in profi t or loss.

29 Kenanga Growth Fund Annual Report
3. SUMMARY OF SIGNIFICANT ACCOUNTING POLICIES (CONTD.) d. Impairment of Financial Assets
The Fund assesses at each reporting date whether there is any objective evidence that a fi nancial asset is impaired.
To determine whether there is objective evidence that an impairment loss on fi nancial assets has been incurred, the Fund considers factors such as the probability of insolvency or signifi cant fi nancial diffi culties of the debtor and default or signifi cant delay in payments.
If any such evidence exists, the amount of impairment loss is measured as the difference between the asset’s carrying amount and the present value of estimated future cash fl ows discounted at the fi nancial asset’s original effective rate of return. The impairment loss is recognised in profi t or loss.
The carrying amount of the fi nancial asset is reduced by the impairment loss directly for all fi nancial assets, with the exception of receivables, where the carrying amount is reduced through the use of an allowance account. When a receivable becomes uncollectible, it is written off against the allowance account.
If in a subsequent period, the amount of the impairment loss decreases and the decrease can be related objectively to an event occurring after the impairment was recognised, the previously recognised impairment loss is reversed to the extent that the carrying amount of the assets does not exceed its amortised cost at the reversal date. The amount of reversal is recognised in profi t or loss.
e. Income
Income is recognised to the extent that it is probable that the economic benefi ts will fl ow to the Fund and the income can be reliably measured. Income is measured at the fair value of consideration received or receivable.
Interest income is recognised using the effective interest rate method.
Dividend income is recognised on declared basis, when the right to receive the dividend is established.
f. Cash and Cash Equivalents For the purposes of the statement of cash fl ows, cash and cash equivalents include
cash at bank and short term deposits with fi nancial institutions.
g. Income Tax Expense
Income tax on the profi t or loss for the fi nancial period comprises current tax. Current tax is the expected amount of income taxes payable in respect of the taxable profi t for the fi nancial period.

30Kenanga Growth Fund Annual Report
3. SUMMARY OF SIGNIFICANT ACCOUNTING POLICIES (CONTD.)
h. Unrealised reserves
Unrealised reserves represent the net gain or loss arising from carrying investments at their fair values at reporting date. This reserve is not distributable.
i. Financial Liabilities
Financial liabilities are classifi ed according to the substance of the contractual arrangements entered into and the defi nitions of a fi nancial liability.
Financial liabilities are recognised in the statement of fi nancial position when, and only when, the Fund becomes a party to the contractual provisions of the fi nancial instrument. The Fund’s fi nancial liabilities are classifi ed as other fi nancial liabilities. The Fund’s fi nancial liabilities are recognised initially at fair value and subsequently measured at amortised cost using the effective interest method.
A fi nancial liability is derecognised when the obligation under the liability is extinguished. Gains and losses are recognised in profi t or loss when the liabilities are derecognised, and through the amortisation process.
j. Unitholders’ Contribution – NAV Attributable to Unitholders
The unitholders’ contribution to the Fund is classifi ed as equity instruments.
Distribution equalisation represents the average amount of undistributed net income included in the creation or cancellation price of units. This amount is either refunded to unitholders by way of distribution and/or adjusted accordingly when units are released back to the Trustee.
k. Functional and Presentation Currency
The fi nancial statements of the Fund are measured using the currency of the primary economic environment in which the Fund operates (“the functional currency”). The fi nancial statements are presented in Ringgit Malaysia (“RM”), which is also the Fund’s functional currency.
l. Distribution
Distributions are at the discretion of the Manager. A distribution to the Fund’s unitholders is accounted for as a deduction from retained earnings.

31 Kenanga Growth Fund Annual Report
3. SUMMARY OF SIGNIFICANT ACCOUNTING POLICIES (CONTD.)
m. Signifi cant Accounting Judgments and Estimates
The preparation of fi nancial statements requires the use of certain accounting estimates and exercise of judgment. Estimates and judgments are continually evaluated and are based on past experience, reasonable expectations of future events and other factors.
i. Critical judgments made in applying accounting policies
There are no major judgments made by the Manager in applying the Fund’s accounting policies.
ii. Key sources of estimation uncertainty
There are no key assumptions concerning the future and other key sources of estimation uncertainty at the reporting date, that have a signifi cant risk of causing a material adjustment to the carrying amounts of assets and liabilities within the next fi nancial period.
4. MANAGER’S FEE The Manager’s fee is computed on a daily basis at a rate not exceeding 1.5% per annum
of the NAV of the Fund as provided under Clause 13.1 of the Deed. The Manager is currently charging Manager’s fee of 1.50% per annum of the NAV of the Fund.
5. TRUSTEE’S FEE
The Trustee’s fee is computed at 0.05% per annum of the NAV of the Fund effective from 3 December 2013. Prior to 3 December 2013, the Trustee’s fee was computed at 0.08% per annum of the NAV of the Fund.
However, under Clause 13.2 of the Deed, the Trustee is entitled to a fee not exceeding 0.10% per annum of the NAV of the Fund and subject to a minimum fee of RM18,000 per annum.

32Kenanga Growth Fund Annual Report
6. INCOME TAX EXPENSE
1.1.2013 to 1.1.2012 to 31.5.2014 31.12.2012 RM RM Malaysian income tax: Current period tax 17,500 83,800 Under provision of tax in prior year 74,223 - 91,723 83,800
Income tax is calculated at the Malaysian statutory tax rate of 25% of the estimated assessable income for the fi nancial period. The statutory tax rate will be reduced to 24% effective year of assessment 2016.
Income tax is calculated on investment income less partial deduction for permitted expenses as provided for under Section 63B of the Income Tax Act, 1967.
A reconciliation of income tax expense applicable to net income before tax at the statutory income tax rate to income tax expense at the effective income tax rate of the Fund is as follows:
1.1.2013 to 1.1.2012 to 31.5.2014 31.12.2012 RM RM Net income before tax 42,135,233 7,890,049 Tax at Malaysian statutory tax rate of 25% (fi nancial year ended 31 December 2012: 25%) 10,533,808 1,972,512 Tax effect of: Income not subject to tax (11,413,733) (2,177,996) Expenses not deductible for tax purposes 258,910 56,320 Restriction on tax deductible expenses for unit trust fund 638,515 232,964 Under provision of tax in prior year 74,223 - Tax expense for the period/year 91,723 83,800
33 Kenanga Growth Fund Annual Report
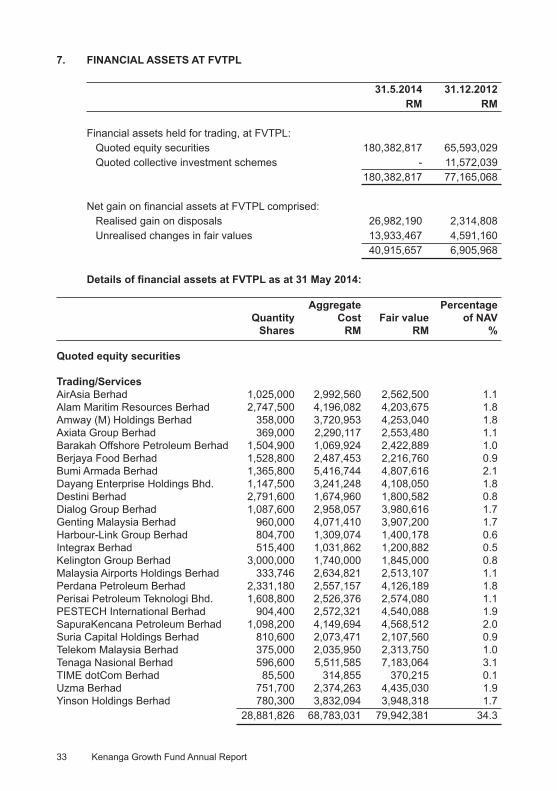
7. FINANCIAL ASSETS AT FVTPL
31.5.2014 31.12.2012 RM RM Financial assets held for trading, at FVTPL: Quoted equity securities 180,382,817 65,593,029 Quoted collective investment schemes - 11,572,039 180,382,817 77,165,068 Net gain on fi nancial assets at FVTPL comprised: Realised gain on disposals 26,982,190 2,314,808 Unrealised changes in fair values 13,933,467 4,591,160 40,915,657 6,905,968
Details of fi nancial assets at FVTPL as at 31 May 2014:
Aggregate Percentage Quantity Cost Fair value of NAV Shares RM RM %
Quoted equity securities
Trading/ServicesAirAsia Berhad 1,025,000 2,992,560 2,562,500 1.1 Alam Maritim Resources Berhad 2,747,500 4,196,082 4,203,675 1.8 Amway (M) Holdings Berhad 358,000 3,720,953 4,253,040 1.8 Axiata Group Berhad 369,000 2,290,117 2,553,480 1.1 Barakah Offshore Petroleum Berhad 1,504,900 1,069,924 2,422,889 1.0 Berjaya Food Berhad 1,528,800 2,487,453 2,216,760 0.9 Bumi Armada Berhad 1,365,800 5,416,744 4,807,616 2.1 Dayang Enterprise Holdings Bhd. 1,147,500 3,241,248 4,108,050 1.8 Destini Berhad 2,791,600 1,674,960 1,800,582 0.8 Dialog Group Berhad 1,087,600 2,958,057 3,980,616 1.7 Genting Malaysia Berhad 960,000 4,071,410 3,907,200 1.7 Harbour-Link Group Berhad 804,700 1,309,074 1,400,178 0.6 Integrax Berhad 515,400 1,031,862 1,200,882 0.5 Kelington Group Berhad 3,000,000 1,740,000 1,845,000 0.8 Malaysia Airports Holdings Berhad 333,746 2,634,821 2,513,107 1.1 Perdana Petroleum Berhad 2,331,180 2,557,157 4,126,189 1.8 Perisai Petroleum Teknologi Bhd. 1,608,800 2,526,376 2,574,080 1.1 PESTECH International Berhad 904,400 2,572,321 4,540,088 1.9 SapuraKencana Petroleum Berhad 1,098,200 4,149,694 4,568,512 2.0 Suria Capital Holdings Berhad 810,600 2,073,471 2,107,560 0.9 Telekom Malaysia Berhad 375,000 2,035,950 2,313,750 1.0 Tenaga Nasional Berhad 596,600 5,511,585 7,183,064 3.1 TIME dotCom Berhad 85,500 314,855 370,215 0.1 Uzma Berhad 751,700 2,374,263 4,435,030 1.9 Yinson Holdings Berhad 780,300 3,832,094 3,948,318 1.7 28,881,826 68,783,031 79,942,381 34.3

34Kenanga Growth Fund Annual Report
7. FINANCIAL ASSETS AT FVTPL (CONTD.)
Details of fi nancial assets at FVTPL as at 31 May 2014 (Contd.):
Aggregate Percentage Quantity Cost Fair value of NAV Shares RM RM %
Quoted equity securities (Contd.)
Industrial productsCahya Mata Sarawak Berhad 579,300 4,286,921 5,677,140 2.4 Coastal Contracts Bhd. 1,106,800 4,353,919 5,423,320 2.3 Kian Joo Can Factory Berhad 767,800 2,009,958 2,510,706 1.1 KNM Group Berhad 5,847,000 4,092,900 4,356,015 1.9 Press Metal Berhad 1,415,100 4,913,824 5,009,454 2.2 9,716,000 19,657,522 22,976,635 9.9
PropertiesCrescendo Crorporation Berhad 89,700 233,220 241,293 0.1 IJM Land Berhad 1,580,400 4,401,255 4,867,632 2.1 Maltion Berhad 2,132,500 2,055,275 2,121,837 0.9 Sunway Berhad 1,775,666 4,962,673 5,433,538 2.3 Tambun Indah Land Berhad 716,500 1,353,883 1,411,505 0.6 6,294,766 13,006,306 14,075,805 6.0
TechnologyElsoft Research Berhad 3,500,000 2,800,000 3,150,000 1.4 Globetronic Technology Bhd. 903,900 2,607,115 3,561,366 1.5 Inari Amertron Berhad 1,751,000 2,372,001 4,955,330 2.1 ViTrox Corporation Berhad 1,186,900 1,554,374 2,385,669 1.0 7,341,800 9,333,490 14,052,365 6.0
ConstructionBenalec Holdings Berhad 2,319,300 2,443,609 2,504,844 1.1 Gamuda Berhad 943,900 4,478,633 4,153,160 1.8 Hock Seng Lee Berhad 1,029,400 2,088,303 2,038,212 0.9 Protasco Berhad 2,088,200 3,468,507 4,051,108 1.7 6,380,800 12,479,052 12,747,324 5.5
Consumer productsAsia File Corporation Bhd. 200,000 1,422,091 1,410,000 0.6 Dutch Lady Milk Industries Berhad 48,000 1,121,029 2,232,960 1.0 Karex Berhad 873,700 2,709,140 2,647,311 1.1 Nestlé (M) Berhad 39,000 1,874,506 2,623,140 1.1 QL Resources Berhad 1,057,500 2,275,179 3,436,875 1.5 2,218,200 9,401,945 12,350,286 5.3

35 Kenanga Growth Fund Annual Report
7. FINANCIAL ASSETS AT FVTPL (CONTD.)
Details of fi nancial assets at FVTPL as at 31 May 2014 (Contd.):
Aggregate Percentage Quantity Cost Fair value of NAV Shares RM RM %
Quoted equity securities (Contd.)
FinanceCIMB Group Holdings Berhad 320,982 2,266,212 2,356,008 1.0 Hong Leong Financial Group Berhad 185,100 2,306,622 2,850,540 1.2 Malayan Banking Berhad 312,091 2,798,149 3,083,459 1.3 OSK Holdings Berhad 1,779,500 2,968,993 2,989,560 1.3 2,597,673 10,339,976 11,279,567 4.8
PlantationsGenting Plantations Berhad 172,200 1,636,290 1,935,528 0.9 IJM Plantations Berhad 762,900 2,569,736 2,822,730 1.2 IOI Corporation Berhad 386,300 1,620,005 1,904,459 0.8 Kulim (Malaysia) Berhad 827,100 2,881,661 2,853,495 1.2 2,148,500 8,707,692 9,516,212 4.1
InfrastructureDiGi.Com Berhad 635,100 2,893,183 3,442,242 1.5
Total fi nancial assets at FVTPL 154,602,197 180,382,817 77.4
Excess of fair value over cost 25,780,620
8. SHORT TERM DEPOSITS
Short term deposits are held with licensed fi nancial institutions in Malaysia, on a daily renewal basis at the prevailing interest rate.
9. OTHER RECEIVABLES
31.5.2014 31.12.2012 RM RM Amount due from stockbrokers 2,490,633 - Dividend receivable 306,782 9,000 Interest receivable from short term deposits 12,164 2,465 2,809,579 11,465

36Kenanga Growth Fund Annual Report
10. NET ASSET VALUE ATTRIBUTABLE TO UNITHOLDERS
NAV attributed to unitholders is represented by:
Note 31.5.2014 31.12.2012 RM RM Unitholders’ contribution (a) 176,273,387 55,449,337 Retained earnings: Realised reserves 31,054,233 13,211,631 Unrealised reserves 25,780,620 11,847,153 56,834,853 25,058,784
233,108,240 80,508,121
(a) Unitholders’ contribution
1.1.2013 to 31.5.2014 1.1.2012 to 31.12.2012 No. of units RM No. of units RM
At beginning of the period/year 106,243,983 55,449,337 24,351,372 33,603,092 Add: Creation of units 207,947,049 167,807,300 38,706,884 23,733,343 Add: Creation of bonus units - - 52,072,627 - Less: Cancellation of units (78,397,222) (59,283,714) (8,886,900) (6,258,764) Distribution equalisation - 15,302,962 - 8,342,320 Income distribution (Note 12) - (3,002,498) - (3,970,654) At end of the period/year 235,793,810 176,273,387 106,243,983 55,449,337
The number of units legally or benefi cially held by the Manager, Kenanga Investors Berhad and parties related to the Manager as at 31 May 2014 were 12,853,661 units valued at RM12,707,129 (31 December 2012: 33,577,812 units valued at RM25,445,266).
37 Kenanga Growth Fund Annual Report
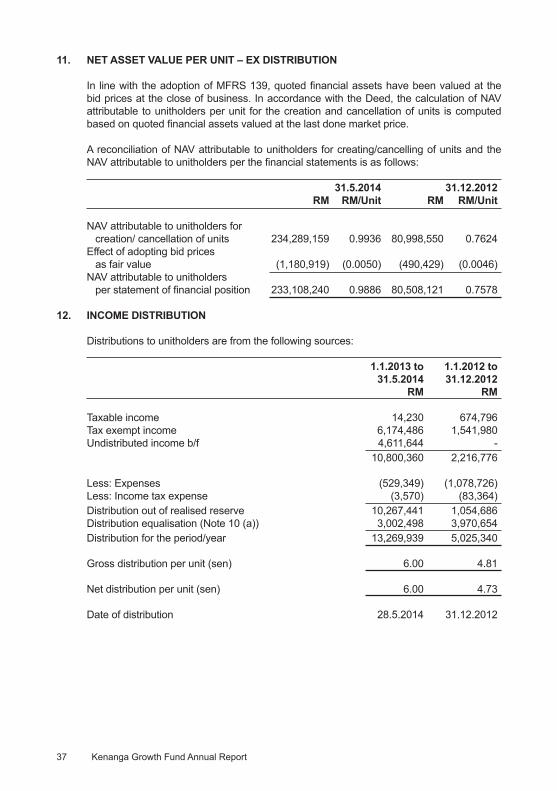
11. NET ASSET VALUE PER UNIT – EX DISTRIBUTION
In line with the adoption of MFRS 139, quoted fi nancial assets have been valued at the bid prices at the close of business. In accordance with the Deed, the calculation of NAV attributable to unitholders per unit for the creation and cancellation of units is computed based on quoted fi nancial assets valued at the last done market price.
A reconciliation of NAV attributable to unitholders for creating/cancelling of units and the NAV attributable to unitholders per the fi nancial statements is as follows:
31.5.2014 31.12.2012 RM RM/Unit RM RM/Unit
NAV attributable to unitholders for creation/ cancellation of units 234,289,159 0.9936 80,998,550 0.7624 Effect of adopting bid prices as fair value (1,180,919) (0.0050) (490,429) (0.0046) NAV attributable to unitholders per statement of fi nancial position 233,108,240 0.9886 80,508,121 0.7578
12. INCOME DISTRIBUTION
Distributions to unitholders are from the following sources:
1.1.2013 to 1.1.2012 to 31.5.2014 31.12.2012 RM RM
Taxable income 14,230 674,796 Tax exempt income 6,174,486 1,541,980 Undistributed income b/f 4,611,644 - 10,800,360 2,216,776
Less: Expenses (529,349) (1,078,726) Less: Income tax expense (3,570) (83,364) Distribution out of realised reserve 10,267,441 1,054,686 Distribution equalisation (Note 10 (a)) 3,002,498 3,970,654 Distribution for the period/year 13,269,939 5,025,340 Gross distribution per unit (sen) 6.00 4.81 Net distribution per unit (sen) 6.00 4.73 Date of distribution 28.5.2014 31.12.2012

38Kenanga Growth Fund Annual Report
13. PORTFOLIO TURNOVER RATIO
The portfolio turnover ratio (“PTR”) for the fi nancial period 1 January 2013 to 31 May 2014 is 1.34 times (fi nancial year ended 31 December 2012: 0.49 times).
PTR is the ratio of the average acquisitions and disposals of investments of the Fund for the fi nancial period/year to the average NAV of the Fund, calculated on a daily basis.
14. MANAGEMENT EXPENSE RATIO
The management expense ratio (“MER”) for the fi nancial period 1 January 2013 to 31 May 2014 is 2.24% (fi nancial year ended 31 December 2012: 1.88%).
MER is the ratio of total fees and recovered expenses of the Fund expressed as a percentage of the Fund’s average NAV, calculated on a daily basis.
15. TRANSACTIONS WITH STOCKBROKING COMPANIES
Brokerage, stamp duty Transaction Percentage and clearing Percentage value of total fee of total RM % RM %
Kenanga Investment Bank Berhad* 121,559,350 34.5 342,366 34.4 Maybank Investment Bank Berhad 59,515,701 16.9 159,943 16.1 Public Investment Bank Berhad 40,589,427 11.5 108,046 10.8RHB Investment Bank Berhad 28,064,036 8.0 78,041 7.8 CIMB Investment Bank Berhad 19,947,977 5.6 81,071 8.1 Alliance Investment Bank Berhad 19,240,318 5.4 52,903 5.3 UOB Kay Hian Securities (M) Sdn Bhd 14,344,483 4.1 51,241 5.1 JP Morgan Securities (Malaysia) Sdn Bhd 10,151,106 2.9 30,666 3.1 Citigroup Global Markets Malaysia Sdn Bhd 5,276,662 1.5 16,647 1.7 Hong Leong Investment Bank Berhad 5,096,103 1.4 12,058 1.2 Others 28,811,857 8.2 63,553 6.4 352,597,020 100.0 996,535 100.0
The above transaction values are in respect of quoted investment securities.
* Kenanga Investment Bank Berhad is a related party of Kenanga Investors Berhad.
The directors of the Manager are of the opinion that the transactions with the related party have been entered into in the normal course of business and have been established on terms and conditions that are not materially different from that obtainable in transactions with unrelated parties. The Manager is of the opinion that the above dealings have been transacted on an arm’s length basis.

39 Kenanga Growth Fund Annual Report
16. SEGMENTAL REPORTING
a. Business Segment
In accordance with the objective of the Fund, the Fund can invest 75% to 95% in quoted Malaysian investment securities. The following table provides an analysis of the Fund’s revenue, results, assets and liabilities by business segments:
Quoted investment Other securities investments Total RM RM RM 31.5.2014 Revenue Segment income 45,000,758 1,006,665 Segment expenses (901,981) - Net segment income representing segment results 44,098,777 1,006,665 45,105,442 Unallocated expenditure (2,970,209) Net income before tax 42,135,233 Income tax expense (91,723) Net income after tax 42,043,510 Assets Investments 180,382,817 50,051,000 Other segment assets 2,797,415 12,164 Total segment assets 183,180,232 50,063,164 233,243,396 Unallocated assets 4,371,338 237,614,734
Equity and liabilities Other segment liabilities representing total segment liabilities 4,419,646 - 4,419,646 Unallocated liabilities 86,848 Equity 233,108,240 237,614,734

40Kenanga Growth Fund Annual Report
16. SEGMENTAL REPORTING (CONTD.)
a. Business Segment (Contd.)
Quoted investment Other securities investments Total RM RM RM 31.12.2012 Revenue Segment income 8,687,048 439,543 Segment expenses (154,320) - Net segment income representing segment results 8,532,728 439,543 8,972,271 Unallocated expenditure (1,082,222) Net income before tax 7,890,049 Income tax expense (83,800) Net income after tax 7,806,249 Assets Investments 77,165,068 7,966,479 Other segment assets 9,000 2,465 Total segment assets 77,174,068 7,968,944 85,143,012 Unallocated assets 1,265,362 86,408,374
Equity and liabilities Other segment liabilities representing total segment liabilities 840,813 - 840,813 Unallocated liabilities 5,059,440 Equity 80,508,121 86,408,374
b. Geographical Segments
As all of the Fund’s investments are located in Malaysia, the Fund does not have separate identifi able geographical segments.
41 Kenanga Growth Fund Annual Report
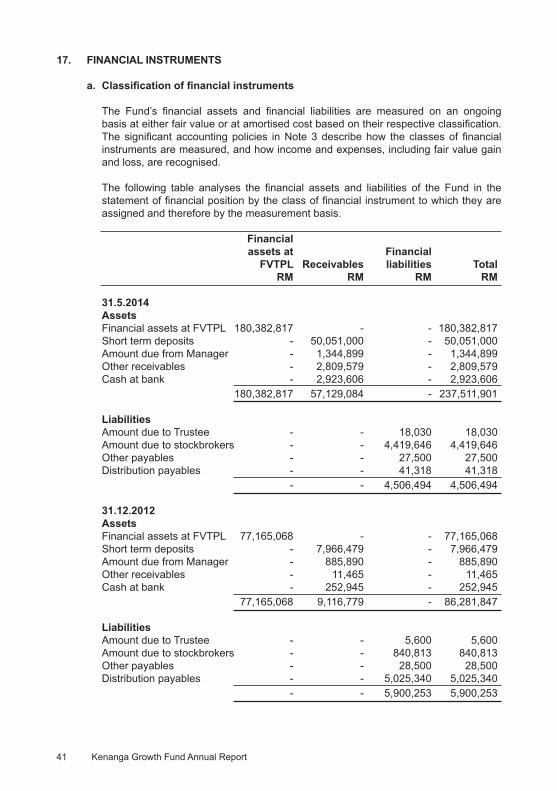
17. FINANCIAL INSTRUMENTS
a. Classifi cation of fi nancial instruments
The Fund’s fi nancial assets and fi nancial liabilities are measured on an ongoing basis at either fair value or at amortised cost based on their respective classifi cation. The signifi cant accounting policies in Note 3 describe how the classes of fi nancial instruments are measured, and how income and expenses, including fair value gain and loss, are recognised.
The following table analyses the fi nancial assets and liabilities of the Fund in the statement of fi nancial position by the class of fi nancial instrument to which they are assigned and therefore by the measurement basis.
Financial assets at Financial FVTPL Receivables liabilities Total RM RM RM RM 31.5.2014 Assets Financial assets at FVTPL 180,382,817 - - 180,382,817 Short term deposits - 50,051,000 - 50,051,000 Amount due from Manager - 1,344,899 - 1,344,899 Other receivables - 2,809,579 - 2,809,579 Cash at bank - 2,923,606 - 2,923,606 180,382,817 57,129,084 - 237,511,901 Liabilities Amount due to Trustee - - 18,030 18,030 Amount due to stockbrokers - - 4,419,646 4,419,646 Other payables - - 27,500 27,500 Distribution payables - - 41,318 41,318 - - 4,506,494 4,506,494 31.12.2012 Assets Financial assets at FVTPL 77,165,068 - - 77,165,068 Short term deposits - 7,966,479 - 7,966,479 Amount due from Manager - 885,890 - 885,890 Other receivables - 11,465 - 11,465 Cash at bank - 252,945 - 252,945 77,165,068 9,116,779 - 86,281,847 Liabilities Amount due to Trustee - - 5,600 5,600 Amount due to stockbrokers - - 840,813 840,813 Other payables - - 28,500 28,500 Distribution payables - - 5,025,340 5,025,340 - - 5,900,253 5,900,253

42Kenanga Growth Fund Annual Report
17. FINANCIAL INSTRUMENTS (CONTD.)
a. Financial instruments that are carried at fair value
The Fund’s fi nancial assets at FVTPL are carried at fair value. The fair values of these fi nancial assets were determined using prices in active markets.
The following table shows the fair value measurements by level of the fair value measurement hierarchy:
Level 1 Level 2 Level 3 Total RM RM RM RM
Investments 31.5.2014 - Quoted equity securities 180,382,817 - - 180,382,817 31.12.2012 - Quoted equity securities 65,593,029 - - 65,593,029 - Quoted collective investment schemes 11,572,039 - - 11,572,039
Level 1: Quoted prices in active market Level 2: Model with all signifi cant inputs which are observable market data Level 3: Model with inputs not based on observable market data
The fair value of quoted equity securities and quoted collective investment schemes are determined by reference to Bursa Malaysia Securities Berhad’s bid price at reporting date.
c. Financial instruments not carried at fair value and whose carrying amounts are reasonable approximation of fair value
The carrying amounts of the Fund’s fi nancial assets and liabilities are not carried at fair value but approximate fair values due to the relatively short term maturity of these fi nancial instruments.

43 Kenanga Growth Fund Annual Report
18. CAPITAL MANAGEMENT
The capital of the Fund can vary depending on the demand for creation and cancellation of units to the Fund.
The Fund’s objectives for managing capital are:
a. To invest in investments meeting the description, risk exposure and expected return indicated in its prospectus;
b. To maintain suffi cient liquidity to meet the expenses of the Fund, and to meet cancellation requests as they arise; and
c. To maintain suffi cient fund size to make the operation of the Fund cost-effi cient.
No changes were made to the capital management objectives, policies or processes during the current and previous fi nancial period/year.

44Kenanga Growth Fund Annual Report


Investor Services Center Head Offi ce, Kuala LumpurToll Free Line: 1 800 88 3737 Suite 12.02, 12th Floor, Kenanga International,Fax: +603 2057 3722 Jalan Sultan Ismail, 50250 Kuala Lumpur, Malaysia.Email: [email protected] Tel: 03-2057 3688 Fax: 03-2161 8807