Embed Size (px)
Citation preview

64
DAFTAR PUSTAKA
Aiba A. 1973. Biochemical Engineering. New York : Academic Press, Inc
Akoh CC, DB Min. 2002. Food Lipid. New York: Marcel Dekker, Inc
Alyas SA, A Abdulah, NA Idris. 2006. Changes of carotene content during
heating of red palm olein. J Oil Palm Res (Special Issue - April 2006): 99-
102
Anderson D. 2005. A Primer on Oils Processing Technology. Di dalam : Shahidi,
F, editor. Bailey’s Industrial Oil and Fat Products. Ed ke-6. Canada : A
John Wiley & Sons, Inc. Vol 5. hlm 16- 33
AOAC. 1995. Official Methods of Analysis of AOAC International. Sixteenth
Edition, 5th Revision, 1999. Vol. 2. USA : AOAC Inc.
AOCS. 2003. Official Methods and Recommended Practices of the AOCS. Fifth
edition. USA : AOCS
Ayorinde FO Hassan, Mahmoud. 1995. Deacidification of Vegetable Oils.
Washington DC. United States Patens: 5414100
Baharin BS, RA Latiep, YB Che Man, RA Rahman. 2001. The effect of carotene
extraction system on crude palm oil quality, carotene composition, and
carotene stability during storage. J Am Oil Chem Soc 78 (8): 851-855
Basiron Y. 2005. Palm Oil. Di dalam : Shahidi, F, editor. Bailey’s Industrial Oil
and Fat Products. Ed ke-6. Canada : A John Wiley & Sons, Inc. Vol 2. hlm
333- 420
Bauernfeind JC, Klaul, H. 1981. Carotens as Colorans and Vitamin A Precursore.
Florida: Academic Press
Baryeh EA. 2001. Effects of palm oil processing parameters on yield. J Food Eng
April 2001
Belitz HD, W Grosch. 1999. Food Chemistry. 2nd
Eds. New York: Springer-
Verlag Berlin heidelberg
Bhosle BM, Subramanian R. 2005. New approaches in deacidification of edible
oil – a Review. J Food Eng 69:481-494
Bockisch M. 1993. Fats and Oil Handbook. Germany: AOCS press
Bonnie TY, Choo YM 1999. Oxidation and thermal degradation of carotenoid. J
Oil Palm Res 2 (1): 62-78
65
Boyd HW, R Westfall, SF Stasch. 1981. Marketing Research Text and Cases.
Edisi ke- 5. Chicago: Richard D Irwin, Inc
Budiman TAFS. 1987. Usaha Meningkatkan Daya Saing Industri Minyak Sawit.
Medan : Lokakarya manajemen Industri Kelapa Sawit
Burke MR. 2005. Soaps. Di dalam : Shahidi, F., editor. Bailey’s Industrial Oil and
Fat Products. Ed ke-6. Canada : A John Wiley & Sons, Inc. Vol 6. hlm 105
Cochran WG, GM Cox. 1957. Experimental Designs. 2nd
Eds. Canada: John
Wiley and Sons, Inc
De Witt GF, Chong, YH. 1988. The Nutrional Value of Palm Oil Minor
Component. Palm Oil Research Institut of Malaysia, Malaysia
Djatmiko B, Widjaja P. 1985. Teknologi Minyak dan Lemak I. Bogor:
Agroindustri Press Institut Pertanian Bogor
Dijkstra AJ, Opstal MV. 1990. The Total Degumming Process. Di dalam :
Erickson DR (ed). Edible Fats and Oils Processing : Basic Principles and
Modern Practices. World Conference Proceedings. AOCS, Champaign,
Illinois. Hlmn :176 – 177
Dijkstra AJ, JC Segers. 2007. Production and Refining of Oils and Fats. Di dalam
: Gunstone, FD, JL Harwood, AJ Dijkstra, Editor. The Lipid Handbook
with CD ROM. Edisi ke-3. Francis: CRC Press
Eskin. 1979. Plant Pigment, Flavor and Texture. New York : Academic Press
Fauzi Y, Widyastuti YE, Satyawibawa I, Hartono R. 2006. Kelapa Sawit Budi
Daya, Pemanfaatan Hasil dan Limbah, Analisis Usaha dan Pemasaran.
Jakarta: Penebar Swadaya
Gayathri GN, Platel K, Prakash J, Srinivasan K. 2003. Influence of antioxidant
spices on the retention of beta-carotene in vegetables during domestic
cooking processes. J Food Chem 84: 35-43
Gibon V, WD Greyt, M Kellens. 2007. Palm Oil Refining. Eur. J Lipid Sci
Technol 109 : 315–335
Goei King An S. 2008. Prospek Industri Sawit Sebagai Bahan Baku Industri :
Tarik Menarik Antara Pangan dan Energi. Seminar Tahunan MAKSI:
Penelitian dan Pengembangan untuk Mendukung Agribisnis Kelapa Sawit
Nasional: Bogor, 31 Januari 2008
Goh SH, YM Choo, ASH Ong. 1987. Minor constituents in palm oil. J Am Oil
Chem Soc 62(2): 237-240

66
Gross J. 1991. Pigments in Vegetables: Chlorophylls and Carotenoids. New York
: An AVI Book
Gunstone FD. 2005. Vegetable Oils. Di dalam : Shahidi, F, editor. Bailey’s
Industrial Oil and Fat Products. Ed ke-6. Canada : A John Wiley & Sons,
Inc. Vol 1. hlm 217-229
Gunstone FD, JL Harwood, AJ Dijkstra. 2007. The Lipid Handbook. Ed ke-3.
New York : CRC Press
Hafidi A, D Pioch, H Ajana. 2005. Membrane-based simultaneous degumming
and deacidification of vegetable oils. Elsevier : Innovative Food Science
and Emerging Technologies. 6 : 203-212
Hamilton RJ, AB Han. 1980. Fats and Oils : Chemistry and Technology. London:
Applied Science Publ. Ltd
Hartley CWS. 1977. The Oil Palm. London :Longmans
Hariyadi P. 2006. Minyak Sawit Ingridien Pangan Potensial. Food Review
Indonesia. Bogor: PT. Media Pangan Indonesia, Maret 2006. Eds 1(2): 13
Hastinah T. 1997. Kinetika degradasi termal β-karoten dalam Minyak Sawit.
[skripsi]. Bogor: Fakultas Teknologi Pertanian Institut Pertanian Bogor
Hui YH. 1996. Bailey`s Industrial Oil and Fat Products. Volume ke-4, Edible Oil
and Fat Products: Processing Technology. New York : A Wiley-
Interscience Publication, John Wiley and Sons, Inc
Jacques PF, Chylack LT, Wu S. 1991. Epidemologic evidence of a role for the
antioxidant vitamins and carotenoids in cataract prevention. J Am Clin
Nutr 53 : 352S-355S
Jatmika A, T Haryati, P Guritno. 1996. Preparation of red palm oil. Di dalam : B.
Muhammad, MA Ngan, MS Affandi, CY May, A Kuntom, CC Let, AGM
Top, dan K Yaacob, editors. Proceedings of the 1996 PORIM
International Congress; Malaysia, 23-28 September 1996. Malaysia:
MPOB. Hlm 382-386
Ketaren S. 2005. Minyak dan Lemak Pangan. Jakarta: Universitas Indonesia Press
Kritchevsky D, SA Tepper, SK Czarnecki, K Sundram. 2001. Red palm oil in
experimental atherosclerosis. Proceedings 2001 PIPOC International
Palm Oil Congress. Food Technology and Nutrition Conference;
Malaysia, 20-22 Agustus 2001. Malaysia: MPOB. Hlm 87-93
Kumalaningsih S. 2006. Antioksidan Alami. Surabaya : Trubus Agrisana
67
Lin SW. 2002. Palm Oil. F D Gunstone (eds). Di dalam Vegetables Oil in Food
Technology: Composition, Properties and Uses. USA and Canada:
Blackwell Publishing CRC Press
Lin CH, Chen BH. 2005. Stability of carotenoids in tomato juice during storage.
Elvesier Ltd. J Food Chem 90: 837-846
Liu W, W Kai Pang, W Kwang Huang. 2006. Exact confidence bounds for the
coefficient of variation of a normally distributed population. Int J Statist
Syst 1(1):81-86
Mac Dougall DB. 2002. Colour in Food. England : Woodhead Publ. Limited
Manorama R, SSP Rao, N Radhika. 1999. Purification of palm carotene extracts
from red palm oil and evaluation of their stability and vitamin A potency.
Proceedings PORIM Chemistry and Technology. Malaysia : 128-137
Marty C, Berset C. 1990. Factors affecting the thermal degradation of all trans β-
carotene. J Agri Food Chem 38: 1063-1067
Mas`ud F. 2007. Optimasi Proses Deasidifikasi untuk Meminimalkan kerusakan
Karotenoid dalam Pemurnian Minyak Sawit (Elaeis guineensis, Jacq).
[tesis]. Bogor: Pascasarjana Institut Pertanian Bogor
Mayes PA. 2003. Struktur dan Fungsi Vitamin Larut Lipid. Di dalam: Murray,
RK., Granner, DK., Mayes, PA., Rodwell, VW. Biokimia Harper. Ed ke-
25. Jakarta: penerbit buku kedokteran. hlm 613-622
Meyer LH. 1982. Food Chemistry. New York: Reinhold Publ.Co
Morad NA, MMKA Aziz, Rohani. 2006. Process Design in Degumming and
Bleaching of Palm Oil. Centre of Lipids Engineering and Apllied Research
(CLEAR). Malaysia: Universiti Teknologi Malaysia
Muchtadi TR. 1992. Karakterisasi Komponen Intrinsik Utama Buah Sawit (Elaeis
guineensis, Jacq.) dalam Rangka Optimalisasi Proses Ekstraksi Minyak
dan Pemanfaatan Provitamin A. [disertasi]. Bogor: Pascasarjana Institut
Pertanian Bogor
O`Brien RD. 2004. Fats and Oils. 2nd
eds. Boca Raton London, New York
Washington D.C: CRC Press
Ooi CK, Choo, YM Yap, SC Ma, AN. 1996. Refining red palm oil. Elaeis 8(1)
June 1996: 20-28
Pahan I. 2006. Panduan Lengkap Kelapa Sawit. Jakarta : Penebar Swadaya

68
Pandrangi S, LF Laborde. 2004. Retention of folate, carotenoids, and other quality
characteristics in commercially packaged fresh spinach. J Food Sci 69 (9):
C702-C707
Patel JK, NM Patel, RL Shiyani. 2001. Coefficient of variation in field
experiments and yardstick thereof-An empirical study. Curr sci
81(9):1163-1164
Pathak MP. 2005. Quality of CPO and Refining operations. Proceedings 0f
Chemistry & Technology Conference-International Palm Oil Congress;
Malaysia, 25-29 September 2005. Malaysia: MPOB. Hlm 426-430
Ping BTY, GEC Lian. 2005. Spectroscopic identification of geometrical isomer of
α- and β-carotenes from palm oil. J of Oil Palm Res Desember 2005: 92-
102
Ping BTY, CY May. 2007. Practical guide to establishing palm carotenoids
profiles by HPLC with three dimensional diode array detector. Malaysia:
MPOB
[PORIM]. 1988. Basic Background Information On Palm Oil Malaysian. Kuala
Lumpur: Palm Oil Promotion Council
[PORIM]. 2005. PORIM Test Methods. Malaysia: Palm Oil Research Institute
of Malaysia; Ministry of Primary Industries
Puah CW, YM Choo, AN Ma, CH Chuah. 2007. The effect of physical refining
on palm vitamin E (tocopherol, tocotrienol and tocomonoenol). Am J Appl
Sci 4 (6): 374-377
Purbowo A. Pengaruh Penggorengan terhadap Mutu Minyak Sawit Merah.
[skripsi]. Bogor: Fakultas Teknologi Pertanian Institut Pertanian Bogor
Rahayu SDT. 1996. Teknik Pemekatan β-karoten Minyak Sawit Kasar dengan
Transesterifikasi dan Saponifikasi. [skripsi]. Bogor: Fakultas Teknologi
Pertanian Institut Pertanian Bogor
Rianto D. 1995. Sifat Fisik Kimia dan Stabilitas Panas Minyak Sawit Merah.
[skripsi]. Bogor: Fakultas Teknologi Pertanian Institut Pertanian Bogor
Scrimgeour C. 2005. Chemistry of Fatty Acid. Di dalam : Shahidi, F, editor.
Bailey’s Industrial Oil and Fat Products. Ed ke-6. Canada : A John Wiley
& Sons, Inc. Vol 1. hlm 1-43
Setyadjit. 1982. Mempelajari Pengaruh Penggunaan Bahan Kimia NaOH, Na2CO3
dan KOH untuk Netralisasi Minyak Kelapa Sawit Kasar (Elaeis guineensis
Jacq). [skripsi]. Bogor: Fakultas Teknologi Pertanian Institut Pertanian
Bogor

69
Standar Nasional Indonesia (SNI) – 01 – 2901 -1992. Minyak Kelapa Sawit.
Dewan Standarisasi Nasional (DSN)
Siregar KA. 1999. Aspek Keteknikan Pertanian pada Proses Pengolahan Kelapa
Sawit di PTP Nusantara VII Unit Usaha Rejosari Lampung Selatan.
[skripsi]. Bogor: Fakultas Teknologi Pertanian Institut Pertanian Bogor
Siswanto H. 2000. Mempelajari Proses Produksi dan Pengendalian Mutu
Pengolahan Minyak Goreng di PT Smart Corporation Surabaya. [skripsi].
Bogor: Fakultas Teknologi Pertanian Institut Pertanian Bogor
Smith JE. 1990. Prinsip Bioteknology. Jakarta : Gramedia
Somaatmadja D. 1981. Minyak Sawit Untuk Persediaan Minyak Makan di
Indonesia. Bogor: Departemen perindustrian, balai Penelitian dan
Pengembangan Industri
Sundram K. 2007. Palm Oil: Chemistry and Nutrition Updates. Malaysia : MPOB
Susila WR. 1991. Verifikasi dan Validasi Model. Maret-Juni 1991. Surabaya :
Forum statistik. Hlm 22-25
Tan B. 1987. Novel Aspects of Palm Oil Carotenoid Analytical Biochemistry. Int.
Oil Palm/Palm Oil Conf.: 370-376
Taylor DS. 2005. Bleaching. F Shahidi (eds). Di dalam: Bailey`s Industrial Oil
and Fat Products. Edible Oil and Fat Products: Processing Technologies.
Volume ke-5, New York : A Wiley-Interscience Publication, John Wiley
and Sons, Inc
Unnithan UR, SP Foo. 2001. Red palm oil: current advancements in our
knowledge. Proceedings 2001 PIPOC International Palm Oil Congress.
Food Technology and Nutrition Conference; Malaysia, 20-22 Agustus
2001. Malaysia: MPOB. Hlm 43-47
Valentas JK, L Levine, JP Clark. 1991. Food Processing Operation and Scale up.
New York: Marcel Dekker Inc, Madison
Wei PC, CY May, MA Ngan, CC Hock. 2004. Degumming and bleaching: effect
on selected constituents of palm oil. J of oil Palm Res 16 (2): 57-63
Winarno FG. 1992. Kimia Pangan dan Gizi. Jakarta : PT. Gramedia Pustaka
Utama
Winarno FG 1999. Minyak Goreng dalam Menu Masyarakat. Bogor: Pusat
Pengembangan Teknologi Pangan Institut Pertanian Bogor
70
Wirakartakusumah MA, G Priyanto, M Arpah, B Nurtama. 1991. Teknik Pangan
Lanjut. Laboratorium Rekayasa Proses Pangan. Bogor : PAU pangan dan
Gizi
Wrolstad et al. 2005. Handbook of Food Analytical Chemistry. Canada : A John
Wiley and Sons Inc
Wulandari OV. (2000). Pemanfaatan Minyak Sawit untuk Produksi Emulsi Kaya
Beta Karoten Sebagai Suplemen Vitamin A. [skripsi]. Bogor: Fakultas
Teknologi Pertanian Institut Pertanian Bogor
Ziegler RG, Mayne ST, Swanson CA. 1996. Nutrition and Lung Cancer. Cancer
Causes Control. 7 : 157-177
71
LAMPIRAN

72
Lampiran 1 Konsentrasi sodium hidroksida pada derajat Baume yang berbeda*)
Derajat Baume Konsentrasi sodium hidroksida (%)
10
12
14
16
18
20
22
24
26
28
30
6.57
8.00
9.50
11.06
12.68
14.36
16.09
17.87
19.70
21.58
23.50 *)
Hui (1996)
73
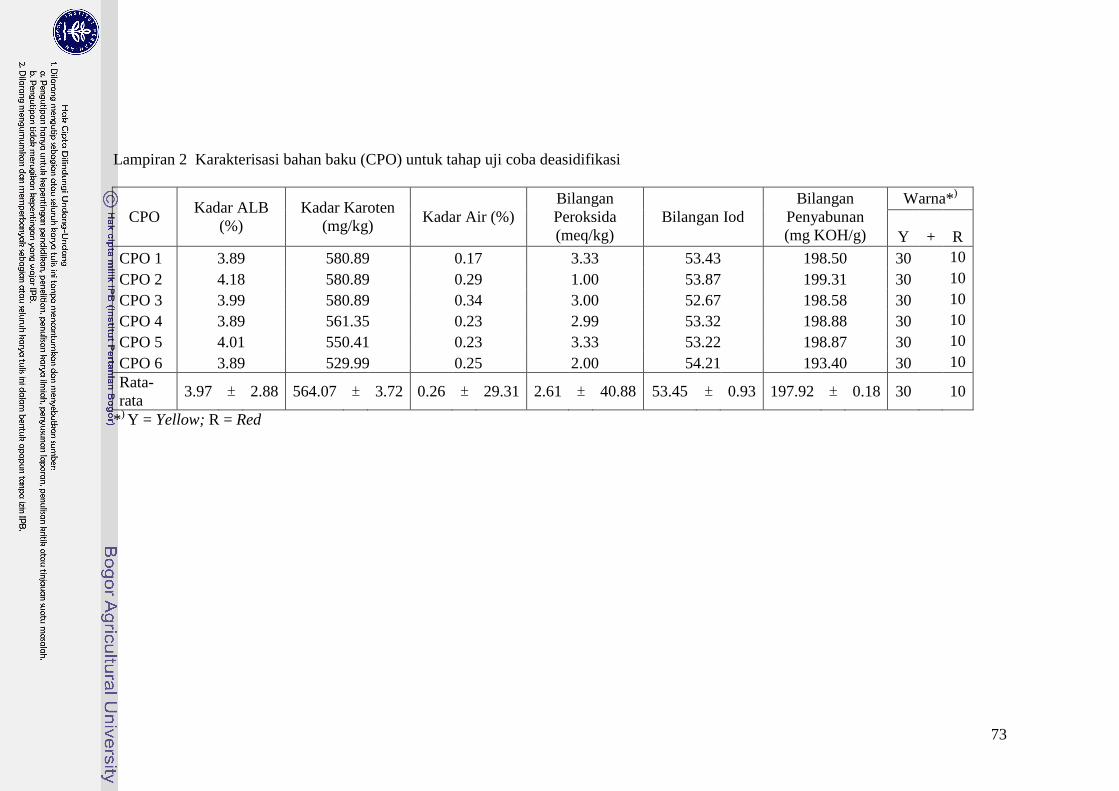
Lampiran 2 Karakterisasi bahan baku (CPO) untuk tahap uji coba deasidifikasi
CPO Kadar ALB
(%)
Kadar Karoten
(mg/kg) Kadar Air (%)
Bilangan
Peroksida
(meq/kg)
Bilangan Iod
Bilangan
Penyabunan
(mg KOH/g)
Warna*)
Y + R
CPO 1 3.89 580.89 0.17 3.33 53.43 198.50 30 10
CPO 2 4.18 580.89 0.29 1.00 53.87 199.31 30 10
CPO 3 3.99 580.89 0.34 3.00 52.67 198.58 30 10
CPO 4 3.89 561.35 0.23 2.99 53.32 198.88 30 10
CPO 5 4.01 550.41 0.23 3.33 53.22 198.87 30 10
CPO 6 3.89 529.99 0.25 2.00 54.21 193.40 30 10
Rata-
rata 3.97 ± 2.88 564.07 ± 3.72 0.26 ± 29.31 2.61 ± 40.88 53.45 ± 0.93 197.92 ± 0.18 30 10
*) Y = Yellow; R = Red

74
Lampiran 3 Hasil analisis sifat fisiko kimia CPO dan NRPO tahap uji coba deasidifikasi minyak sawit merah skala pilot plant
Perlakuan Kadar ALB (%)
Kadar Karoten
(mg/kg) Kadar air (%)
Bilangan Peroksida
(meq/kg)
U1*)
U2 U3 U1 U2 U1 U2 U3 U1 U2 U3
CPO 1 3.92 3.83 3.92 563.46 598.32 0.17 0.17 0.17 2.00 3.99 4.00
Rata-rata**)
3.89 ± 1.40 580.89 ± 4.24 0.17 ± 1.23 3.33 ± 34.68
Deasidifikasi;
[NaOH] = 16oBe;
Ekses 7.5%
NaOH; RPM =
56
0.82 0.82 0.82 517.76 521.66 0.20 0.23 0.23 1.99 1.00 2.00
Rata-rata 0.82 ± 0.00 519.71 ± 0.53 0.22 ± 7.87 1.66 ± 34.57
CPO 2 4.18 4.18 4.18 563.46 598.32 0.30 0.30 0.27 1.00 1.00 1.00
Rata-rata 4.18 ± 0.00 580.89 ± 0.04 0.29 ± 5.84 1.00 ± 0.06
Deasidifikasi;
[NaOH] = 16oBe;
Ekses 20%
NaOH; RPM =
56
0.16 0.16 0.16 539.44 528.52 0.18 0.15 0.17 2.00 2.00 1.00
Rata-rata 0.16 ± 0.00 533.98 ± 1.45 0.17 ± 9.17 1.66 ± 34.76 *)
ulangan **)
rata-rata ± standar deviasi
75
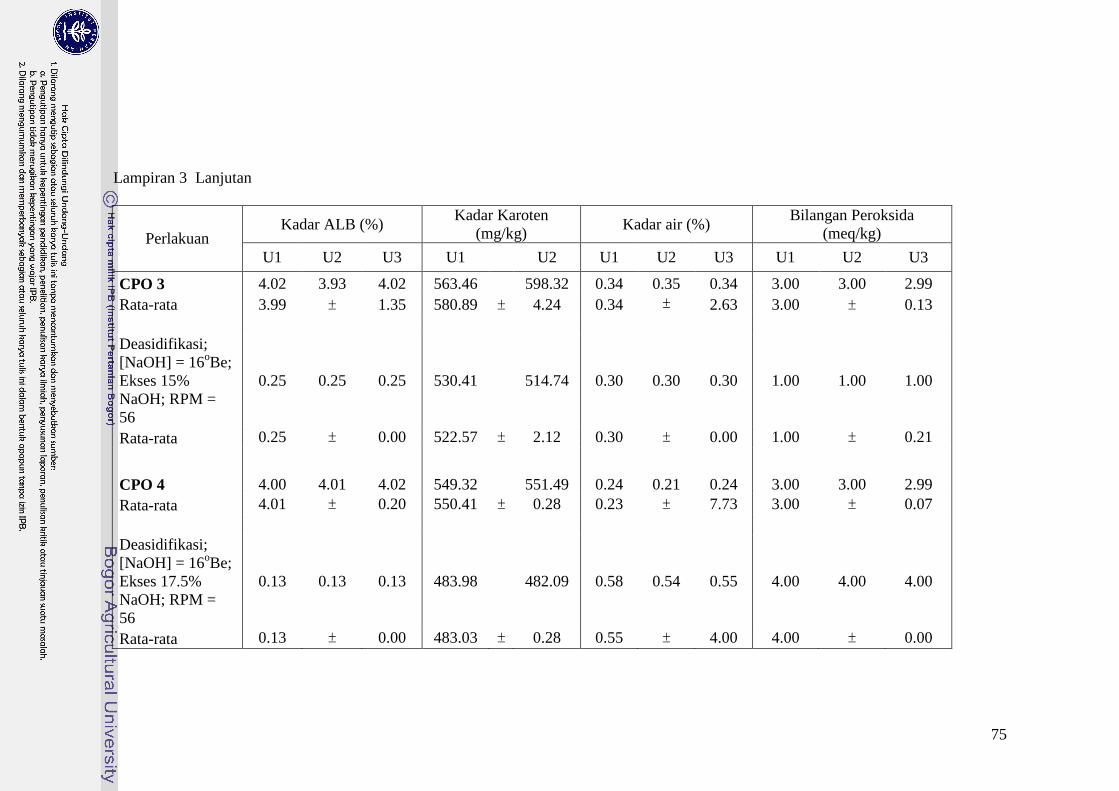
Lampiran 3 Lanjutan
Perlakuan Kadar ALB (%)
Kadar Karoten
(mg/kg) Kadar air (%)
Bilangan Peroksida
(meq/kg)
U1 U2 U3 U1 U2 U1 U2 U3 U1 U2 U3
CPO 3 4.02 3.93 4.02 563.46 598.32 0.34 0.35 0.34 3.00 3.00 2.99
Rata-rata 3.99 ± 1.35 580.89 ± 4.24 0.34 ± 2.63 3.00 ± 0.13
Deasidifikasi;
[NaOH] = 16oBe;
Ekses 15%
NaOH; RPM =
56
0.25 0.25 0.25 530.41 514.74 0.30 0.30 0.30 1.00 1.00 1.00
Rata-rata 0.25 ± 0.00 522.57 ± 2.12 0.30 ± 0.00 1.00 ± 0.21
CPO 4 4.00 4.01 4.02 549.32 551.49 0.24 0.21 0.24 3.00 3.00 2.99
Rata-rata 4.01 ± 0.20 550.41 ± 0.28 0.23 ± 7.73 3.00 ± 0.07
Deasidifikasi;
[NaOH] = 16oBe;
Ekses 17.5%
NaOH; RPM =
56
0.13 0.13 0.13 483.98 482.09 0.58 0.54 0.55 4.00 4.00 4.00
Rata-rata 0.13 ± 0.00 483.03 ± 0.28 0.55 ± 4.00 4.00 ± 0.00
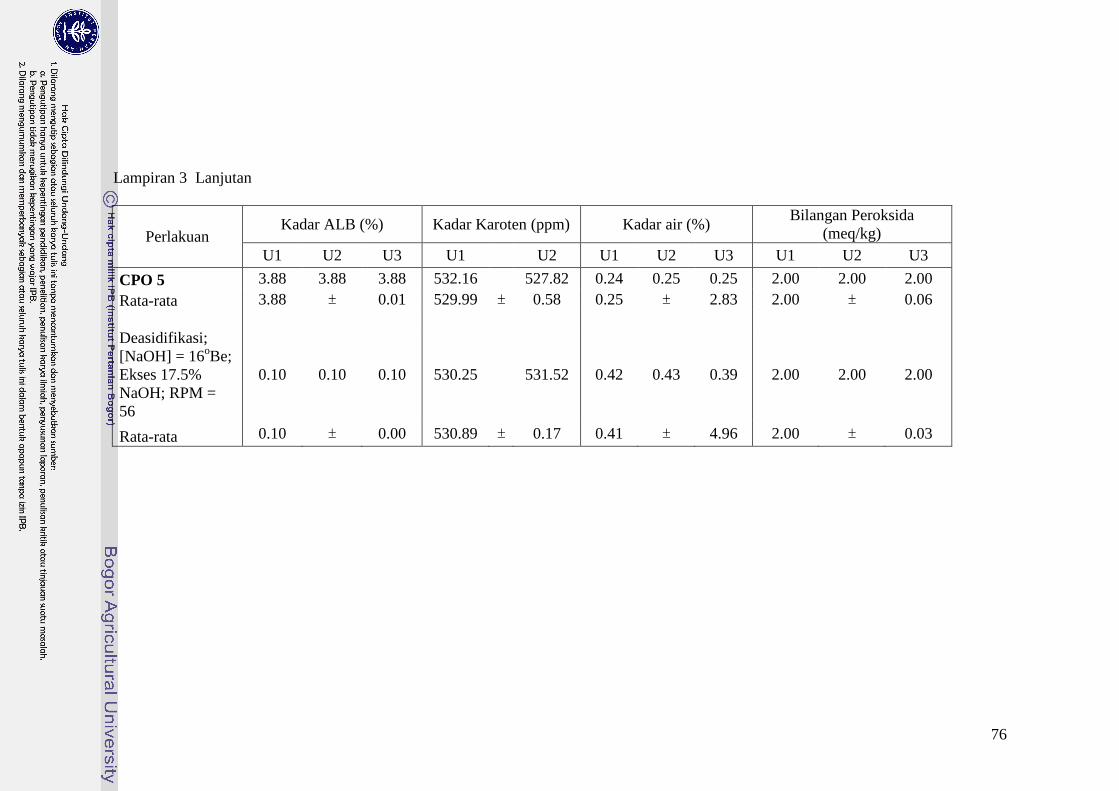
76
Lampiran 3 Lanjutan
Perlakuan Kadar ALB (%) Kadar Karoten (ppm) Kadar air (%)
Bilangan Peroksida
(meq/kg)
U1 U2 U3 U1 U2 U1 U2 U3 U1 U2 U3
CPO 5 3.88 3.88 3.88 532.16 527.82 0.24 0.25 0.25 2.00 2.00 2.00
Rata-rata 3.88 ± 0.01 529.99 ± 0.58 0.25 ± 2.83 2.00 ± 0.06
Deasidifikasi;
[NaOH] = 16oBe;
Ekses 17.5%
NaOH; RPM =
56
0.10 0.10 0.10 530.25 531.52 0.42 0.43 0.39 2.00 2.00 2.00
Rata-rata 0.10 ± 0.00 530.89 ± 0.17 0.41 ± 4.96 2.00 ± 0.03

77
Lampiran 3 Lanjutan
Perlakuan Bilangan iod
Bilangan penyabunan
(mg KOH/g) Oil loss
(%)
Refining
factor
Rendemen
(%)
Warna
U1 U2 U3 U1 U2 U3 Y + R
CPO 1 53.08 53.89 53.32 198.97 198.32 198.21 30 10
Rata-rata 53.43 ± 0.77 198.50 ± 0.21
Deasidifikasi;
[NaOH] =
16oBe; excess
7.5% NaOH;
RPM = 56
51.78 51.50 51.72 193.41 193.31 193.00 42.17 10.83 60.17
Rata-rata 51.66 ± 0.29 193.24 ± 0.11
CPO 2 53.17 54.03 54.42 200.22 198.38 199.33 30 10
Rata-rata 53.87 ± 1.18 199.31 ± 0.46
Deasidifikasi;
[NaOH] =
16oBe; excess
20% NaOH;
RPM = 56
53.30 53.71 53.26 203.95 206.69 201.58 25.83 6.18 77.40
Rata-rata 53.42 ± 0.47 204.07 ± 1.25
78
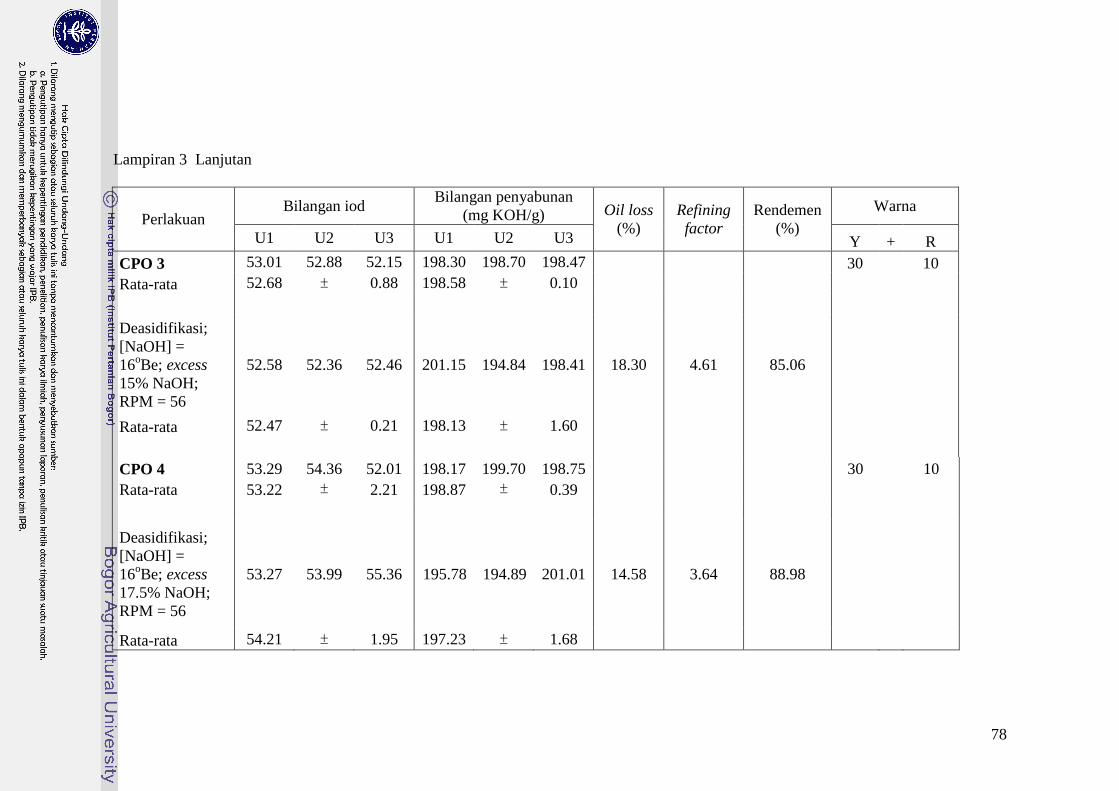
Lampiran 3 Lanjutan
Perlakuan Bilangan iod
Bilangan penyabunan
(mg KOH/g) Oil loss
(%)
Refining
factor
Rendemen
(%)
Warna
U1 U2 U3 U1 U2 U3 Y + R
CPO 3 53.01 52.88 52.15 198.30 198.70 198.47 30 10
Rata-rata 52.68 ± 0.88 198.58 ± 0.10
Deasidifikasi;
[NaOH] =
16oBe; excess
15% NaOH;
RPM = 56
52.58 52.36 52.46 201.15 194.84 198.41 18.30 4.61 85.06
Rata-rata 52.47 ± 0.21 198.13 ± 1.60
CPO 4 53.29 54.36 52.01 198.17 199.70 198.75 30 10
Rata-rata 53.22 ± 2.21 198.87 ± 0.39
Deasidifikasi;
[NaOH] =
16oBe; excess
17.5% NaOH;
RPM = 56
53.27 53.99 55.36 195.78 194.89 201.01 14.58 3.64 88.98
Rata-rata 54.21 ± 1.95 197.23 ± 1.68

79
Lampiran 3 Lanjutan
Perlakuan Bilangan iod
Bilangan penyabunan
(mg KOH/ g) Oil loss
(%)
Refining
factor
Rendemen
(%)
Warna
U1 U2 U3 U1 U2 U3 Y + R
CPO 6 54.39 54.47 54.06 193.04 191.21 195.94 30 10
Rata-rata 54.31 ± 0.40 193.40 ± 1.23
Deasidifikasi;
[NaOH] =
16oBe; excess
17.5% NaOH;
RPM = 56
53.27 53.99 55.36 195.78 194.89 201.01 14.58 3.64 88.98
Rata-rata 54.21 ± 1.95 197.23 ± 1.68
80
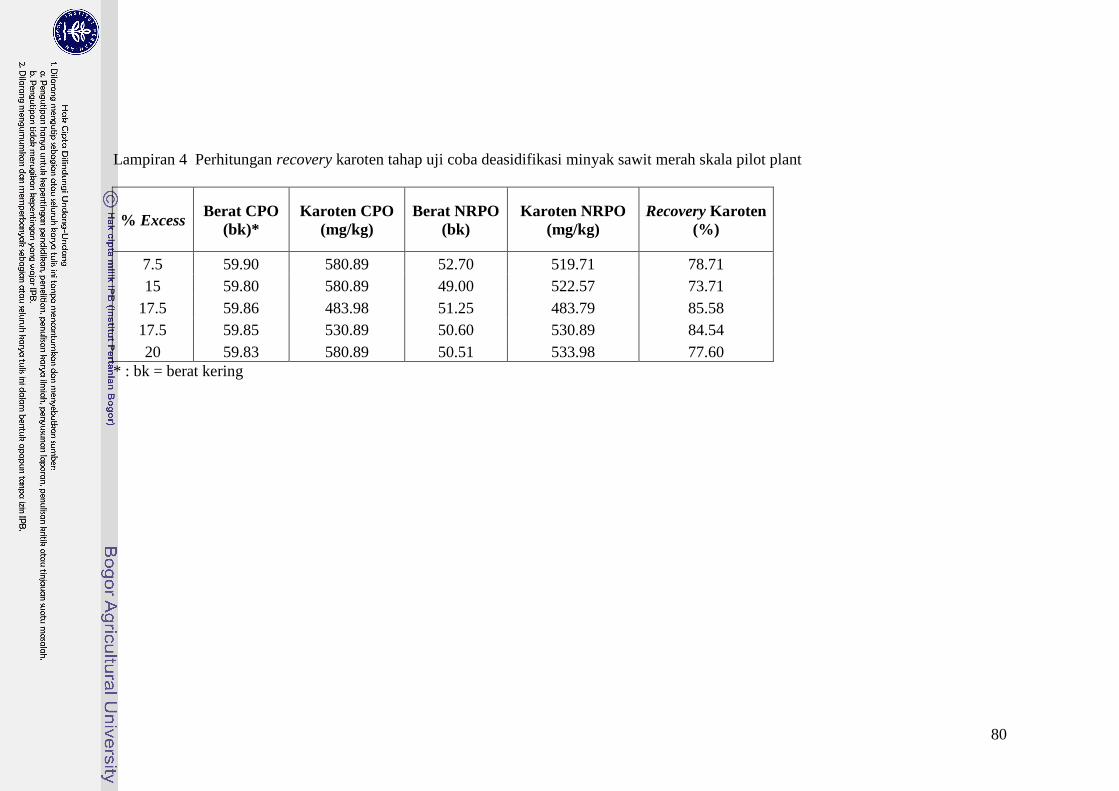
Lampiran 4 Perhitungan recovery karoten tahap uji coba deasidifikasi minyak sawit merah skala pilot plant
% Excess Berat CPO
(bk)*
Karoten CPO
(mg/kg)
Berat NRPO
(bk)
Karoten NRPO
(mg/kg)
Recovery Karoten
(%)
7.5 59.90 580.89 52.70 519.71 78.71
15 59.80 580.89 49.00 522.57 73.71
17.5 59.86 483.98 51.25 483.79 85.58
17.5 59.85 530.89 50.60 530.89 84.54
20 59.83 580.89 50.51 533.98 77.60
* : bk = berat kering
81
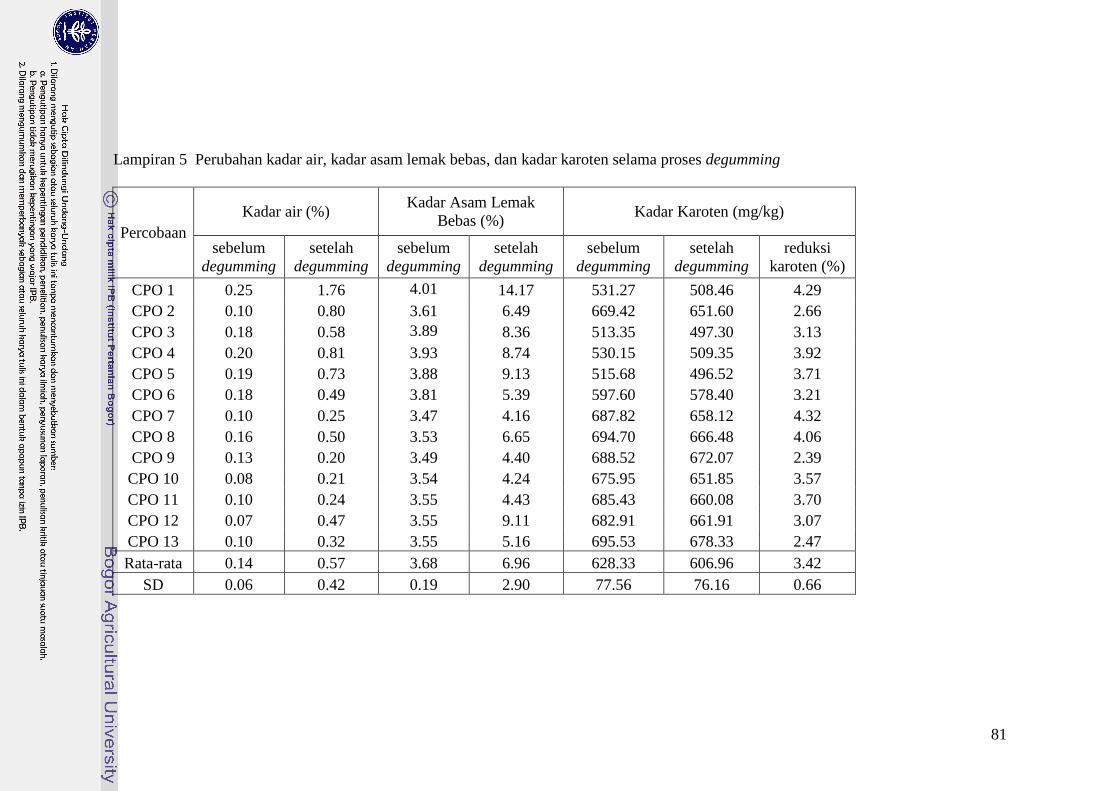
Lampiran 5 Perubahan kadar air, kadar asam lemak bebas, dan kadar karoten selama proses degumming
Percobaan
Kadar air (%) Kadar Asam Lemak
Bebas (%) Kadar Karoten (mg/kg)
sebelum
degumming
setelah
degumming
sebelum
degumming
setelah
degumming
sebelum
degumming
setelah
degumming
reduksi
karoten (%)
CPO 1 0.25 1.76 4.01 14.17 531.27 508.46 4.29
CPO 2 0.10 0.80 3.61 6.49 669.42 651.60 2.66
CPO 3 0.18 0.58 3.89 8.36 513.35 497.30 3.13
CPO 4 0.20 0.81 3.93 8.74 530.15 509.35 3.92
CPO 5 0.19 0.73 3.88 9.13 515.68 496.52 3.71
CPO 6 0.18 0.49 3.81 5.39 597.60 578.40 3.21
CPO 7 0.10 0.25 3.47 4.16 687.82 658.12 4.32
CPO 8 0.16 0.50 3.53 6.65 694.70 666.48 4.06
CPO 9 0.13 0.20 3.49 4.40 688.52 672.07 2.39
CPO 10 0.08 0.21 3.54 4.24 675.95 651.85 3.57
CPO 11 0.10 0.24 3.55 4.43 685.43 660.08 3.70
CPO 12 0.07 0.47 3.55 9.11 682.91 661.91 3.07
CPO 13 0.10 0.32 3.55 5.16 695.53 678.33 2.47
Rata-rata 0.14 0.57 3.68 6.96 628.33 606.96 3.42
SD 0.06 0.42 0.19 2.90 77.56 76.16 0.66
82
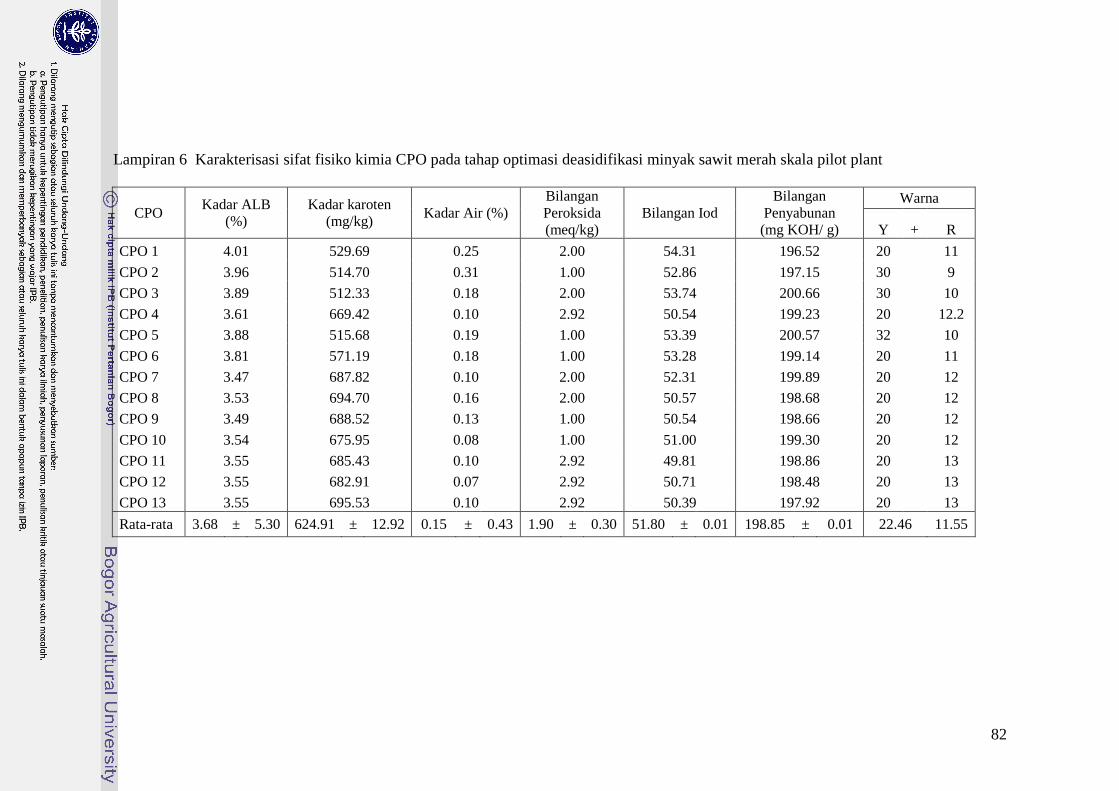
Lampiran 6 Karakterisasi sifat fisiko kimia CPO pada tahap optimasi deasidifikasi minyak sawit merah skala pilot plant
CPO Kadar ALB
(%)
Kadar karoten
(mg/kg) Kadar Air (%)
Bilangan
Peroksida
(meq/kg)
Bilangan Iod
Bilangan
Penyabunan
(mg KOH/ g)
Warna
Y + R
CPO 1 4.01 529.69 0.25 2.00 54.31 196.52 20 11
CPO 2 3.96 514.70 0.31 1.00 52.86 197.15 30 9
CPO 3 3.89 512.33 0.18 2.00 53.74 200.66 30 10
CPO 4 3.61 669.42 0.10 2.92 50.54 199.23 20 12.2
CPO 5 3.88 515.68 0.19 1.00 53.39 200.57 32 10
CPO 6 3.81 571.19 0.18 1.00 53.28 199.14 20 11
CPO 7 3.47 687.82 0.10 2.00 52.31 199.89 20 12
CPO 8 3.53 694.70 0.16 2.00 50.57 198.68 20 12
CPO 9 3.49 688.52 0.13 1.00 50.54 198.66 20 12
CPO 10 3.54 675.95 0.08 1.00 51.00 199.30 20 12
CPO 11 3.55 685.43 0.10 2.92 49.81 198.86 20 13
CPO 12 3.55 682.91 0.07 2.92 50.71 198.48 20 13
CPO 13 3.55 695.53 0.10 2.92 50.39 197.92 20 13
Rata-rata 3.68 ± 5.30 624.91 ± 12.92 0.15 ± 0.43 1.90 ± 0.30 51.80 ± 0.01 198.85 ± 0.01 22.46 11.55

83
Lampiran 7 Hasil analisis sifat fisiko kimia CPO dan NRPO tahap optimasi proses deasidifikasi minyak sawit merah skala pilot plant
Perlakuan Kadar ALB (%) Kadar Karoten (mg/kg) Kadar air (%) Rendemen
(%)
Refining
factor
Oil loss
(%) U1 U2 U3 U1 U1 U3 U1 U2 U3
CPO 1 4.02 3.98 4.02 526.43 531.10 536.28 0.26 0.25 0.26
Rata-rata 4.01 ± 0.66 531.27 ± 0.93 0.25 ± 1.04
Deasidifikasi
59oC, 25 menit
0.10 0.10 0.10 536.43 534.93 535.89 0.48 0.49 0.48 88.20 3.83 15.33
Rata-rata 0.10 ± 0.00 535.75 ± 0.14 0.48 ± 0.75
CPO 2 3.97 3.93 3.97 516.61 517.93 514.69 0.30 0.31 0.31
Rata-rata 3.96 ± 0.66 516.41 ± 0.32 0.31 ± 1.83
Deasidifikasi
59oC, 25 menit
0.10 0.10 0.10 519.92 521.49 523.14 0.63 0.65 0.63 88.50 3.79 15.00
Rata-rata 0.10 ± 0.00 521.52 ± 0.31 0.63 ± 1.88
84
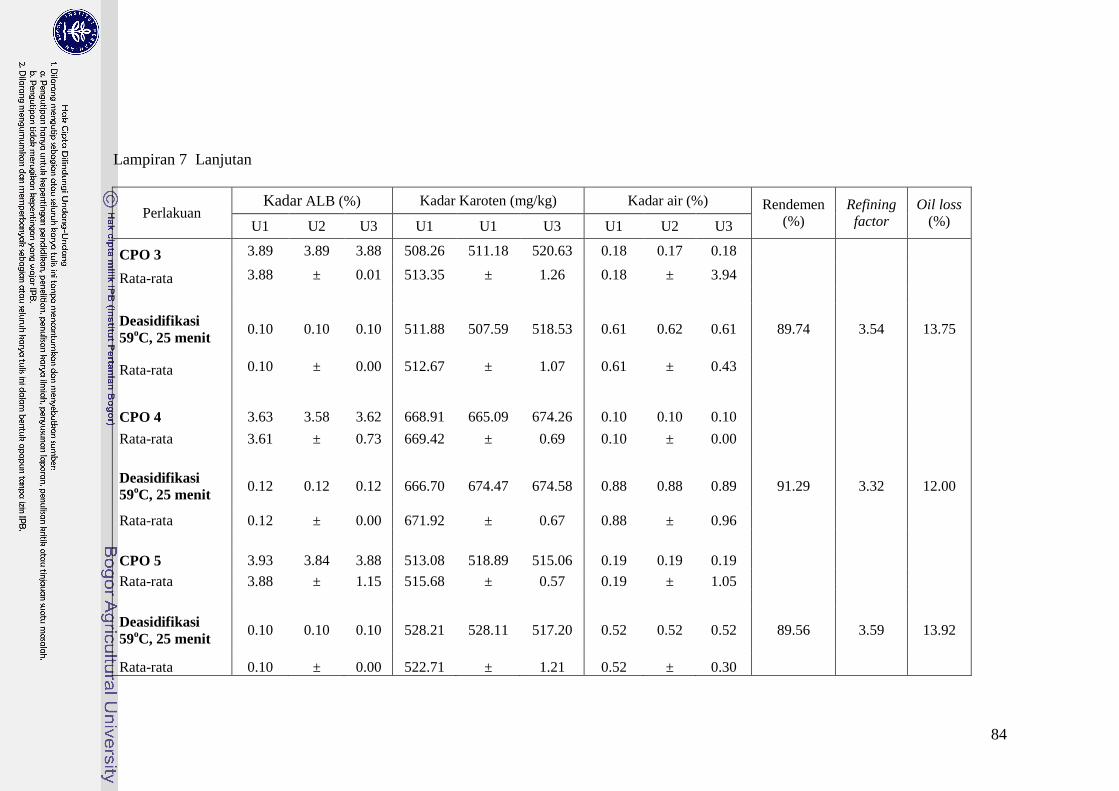
Lampiran 7 Lanjutan
Perlakuan Kadar ALB (%) Kadar Karoten (mg/kg) Kadar air (%) Rendemen
(%)
Refining
factor
Oil loss
(%) U1 U2 U3 U1 U1 U3 U1 U2 U3
CPO 3 3.89 3.89 3.88 508.26 511.18 520.63 0.18 0.17 0.18
Rata-rata 3.88 ± 0.01 513.35 ± 1.26 0.18 ± 3.94
Deasidifikasi
59oC, 25 menit
0.10 0.10 0.10 511.88 507.59 518.53 0.61 0.62 0.61 89.74 3.54 13.75
Rata-rata 0.10 ± 0.00 512.67 ± 1.07 0.61 ± 0.43
CPO 4 3.63 3.58 3.62 668.91 665.09 674.26 0.10 0.10 0.10
Rata-rata 3.61 ± 0.73 669.42 ± 0.69 0.10 ± 0.00
Deasidifikasi
59oC, 25 menit
0.12 0.12 0.12 666.70 674.47 674.58 0.88 0.88 0.89 91.29 3.32 12.00
Rata-rata 0.12 ± 0.00 671.92 ± 0.67 0.88 ± 0.96
CPO 5 3.93 3.84 3.88 513.08 518.89 515.06 0.19 0.19 0.19
Rata-rata 3.88 ± 1.15 515.68 ± 0.57 0.19 ± 1.05
Deasidifikasi
59oC, 25 menit
0.10 0.10 0.10 528.21 528.11 517.20 0.52 0.52 0.52 89.56 3.59 13.92
Rata-rata 0.10 ± 0.00 522.71 ± 1.21 0.52 ± 0.30

85
Lampiran 7 Lanjutan
Perlakuan Kadar ALB (%) Kadar Karoten (mg/kg) Kadar air (%) Rendemen
(%)
Refining
factor
Oil loss
(%) U1 U2 U3 U1 U1 U3 U1 U2 U3
CPO 6 3.79 3.79 3.84 570.76 569.81 573.00 0.19 0.17 0.18
Rata-rata 3.81 ± 0.67 571.19 ± 0.29 0.18 ± 3.91
Deasidifikasi
59oC, 11 menit
0.15 0.15 0.15 588.22 582.42 579.81 0.67 0.68 0.70 90.70 3.35 12.75
Rata-rata 0.15 ± 0.00 584.02 ± 0.74 0.69 ± 2.35
CPO 7 3.49 3.45 3.49 693.00 686.65 683.79 0.10 0.10 0.10
Rata-rata 3.47 ± 0.71 687.82 ± 0.69 0.10 ± 1.19
Deasidifikasi
59oC, 39 menit
0.16 0.16 0.16 695.49 688.02 694.53 0.80 0.79 0.78 91.12 3.46 12.00
Rata-rata 0.16 ± 0.00 692.68 ± 0.59 0.79 ± 1.35
CPO 8 3.54 3.53 3.54 705.22 698.36 680.53 0.16 0.15 0.16
Rata-rata 3.53 ± 0.04 694.70 ± 1.83 0.16 ± 0.74
Deasidifikasi
75oC, 25 menit
0.17 0.17 0.17 681.34 681.34 679.55 0.34 0.32 0.32 88.89 4.03 14.25
Rata-rata 0.17 ± 0.00 680.74 ± 0.15 0.33 ± 3.02
86
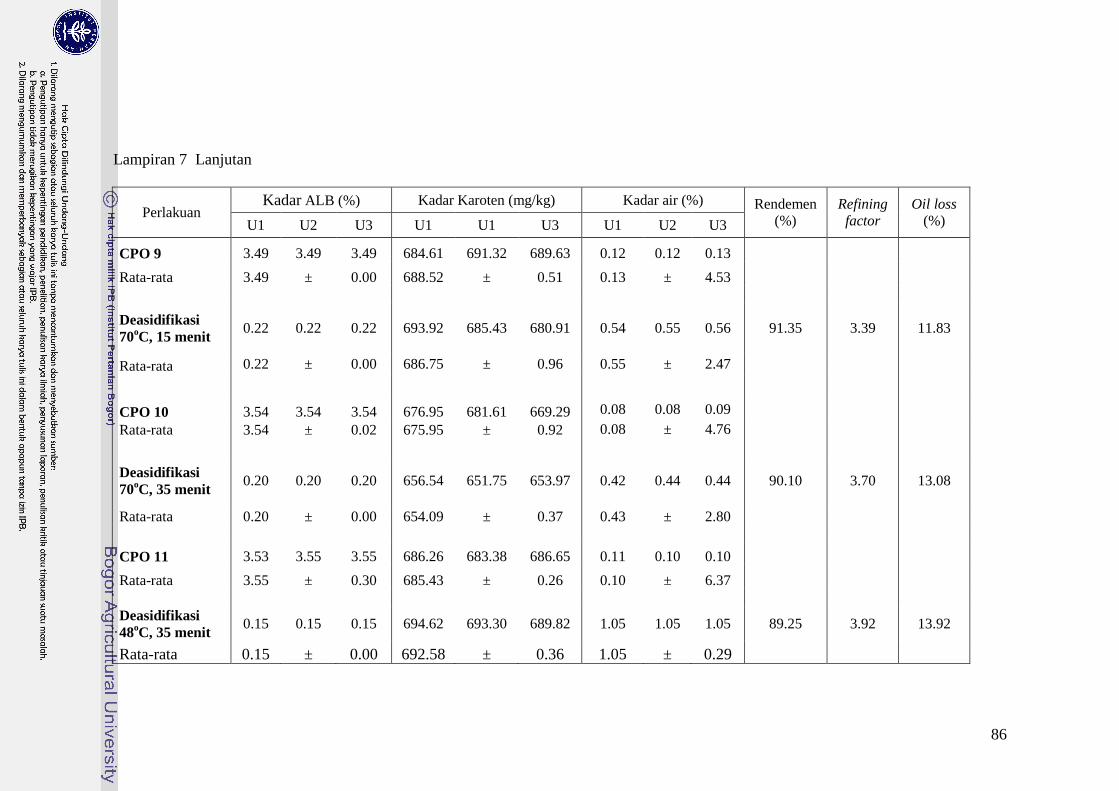
Lampiran 7 Lanjutan
Perlakuan Kadar ALB (%) Kadar Karoten (mg/kg) Kadar air (%) Rendemen
(%)
Refining
factor
Oil loss
(%) U1 U2 U3 U1 U1 U3 U1 U2 U3
CPO 9 3.49 3.49 3.49 684.61 691.32 689.63 0.12 0.12 0.13
Rata-rata 3.49 ± 0.00 688.52 ± 0.51 0.13 ± 4.53
Deasidifikasi
70oC, 15 menit
0.22 0.22 0.22 693.92 685.43 680.91 0.54 0.55 0.56 91.35 3.39 11.83
Rata-rata 0.22 ± 0.00 686.75 ± 0.96 0.55 ± 2.47
CPO 10 3.54 3.54 3.54 676.95 681.61 669.29 0.08 0.08 0.09
Rata-rata 3.54 ± 0.02 675.95 ± 0.92 0.08 ± 4.76
Deasidifikasi
70oC, 35 menit
0.20 0.20 0.20 656.54 651.75 653.97 0.42 0.44 0.44 90.10 3.70 13.08
Rata-rata 0.20 ± 0.00 654.09 ± 0.37 0.43 ± 2.80
CPO 11 3.53 3.55 3.55 686.26 683.38 686.65 0.11 0.10 0.10
Rata-rata 3.55 ± 0.30 685.43 ± 0.26 0.10 ± 6.37
Deasidifikasi
48oC, 35 menit
0.15 0.15 0.15 694.62 693.30 689.82 1.05 1.05 1.05 89.25 3.92 13.92
Rata-rata 0.15 ± 0.00 692.58 ± 0.36 1.05 ± 0.29
87
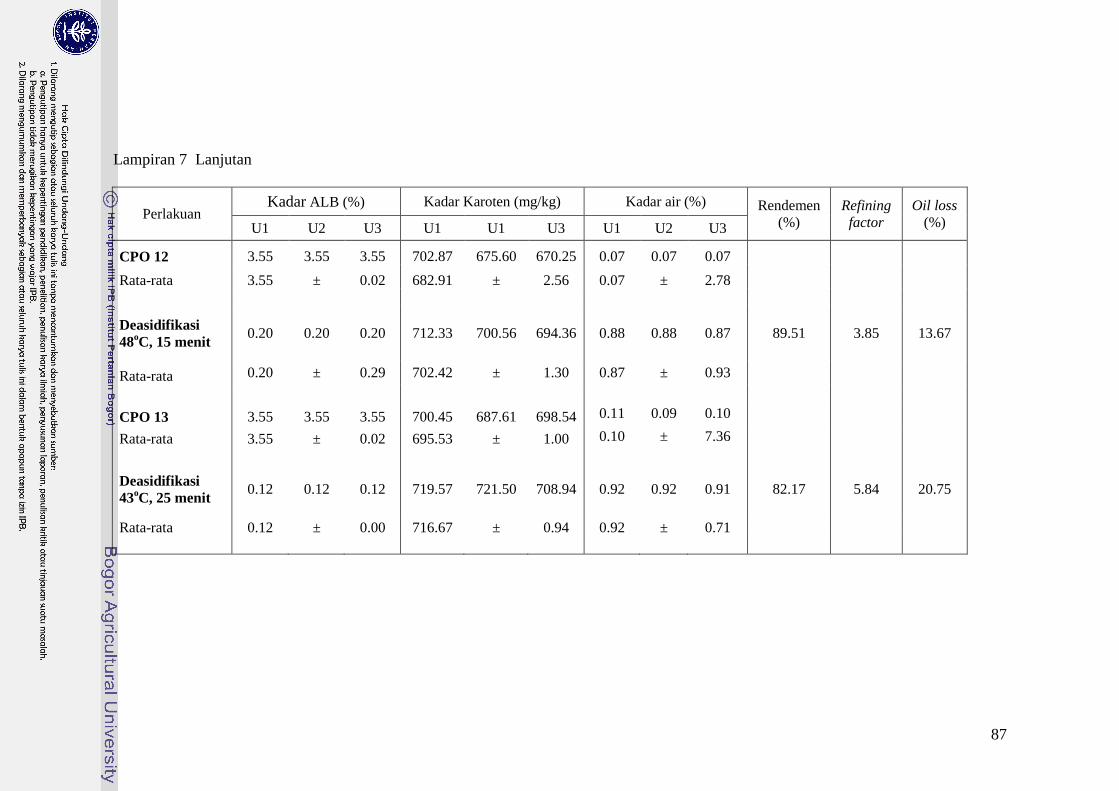
Lampiran 7 Lanjutan
Perlakuan Kadar ALB (%) Kadar Karoten (mg/kg) Kadar air (%) Rendemen
(%)
Refining
factor
Oil loss
(%) U1 U2 U3 U1 U1 U3 U1 U2 U3
CPO 12 3.55 3.55 3.55 702.87 675.60 670.25 0.07 0.07 0.07
Rata-rata 3.55 ± 0.02 682.91 ± 2.56 0.07 ± 2.78
Deasidifikasi
48oC, 15 menit
0.20 0.20 0.20 712.33 700.56 694.36 0.88 0.88 0.87 89.51 3.85 13.67
Rata-rata 0.20 ± 0.29 702.42 ± 1.30 0.87 ± 0.93
CPO 13 3.55 3.55 3.55 700.45 687.61 698.54 0.11 0.09 0.10
Rata-rata 3.55 ± 0.02 695.53 ± 1.00 0.10 ± 7.36
Deasidifikasi
43oC, 25 menit
0.12 0.12 0.12 719.57 721.50 708.94 0.92 0.92 0.91 82.17 5.84 20.75
Rata-rata 0.12 ± 0.00 716.67 ± 0.94 0.92 ± 0.71
88
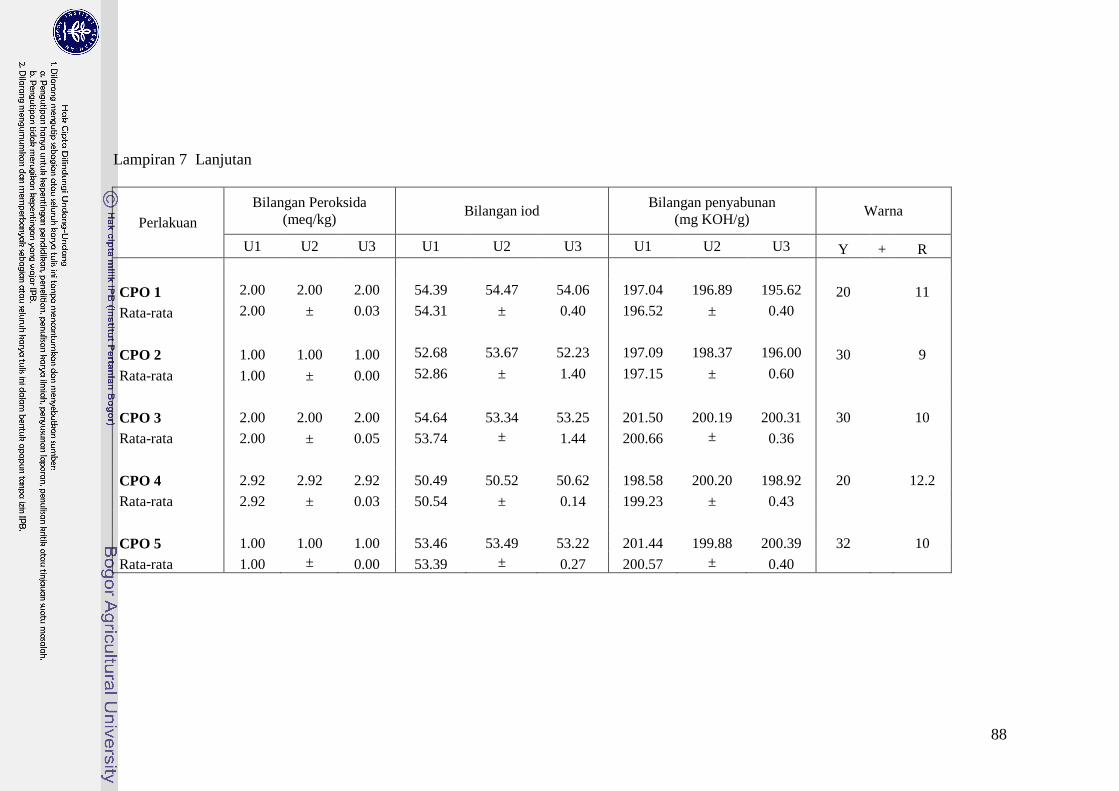
Lampiran 7 Lanjutan
Perlakuan
Bilangan Peroksida
(meq/kg) Bilangan iod
Bilangan penyabunan
(mg KOH/g) Warna
U1 U2 U3 U1 U2 U3 U1 U2 U3 Y + R
CPO 1 2.00 2.00 2.00 54.39 54.47 54.06 197.04 196.89 195.62 20 11
Rata-rata 2.00 ± 0.03 54.31 ± 0.40 196.52 ± 0.40
CPO 2 1.00 1.00 1.00 52.68 53.67 52.23 197.09 198.37 196.00 30 9
Rata-rata 1.00 ± 0.00 52.86 ± 1.40 197.15 ± 0.60
CPO 3 2.00 2.00 2.00 54.64 53.34 53.25 201.50 200.19 200.31 30 10
Rata-rata 2.00 ± 0.05 53.74 ± 1.44 200.66 ± 0.36
CPO 4 2.92 2.92 2.92 50.49 50.52 50.62 198.58 200.20 198.92 20 12.2
Rata-rata 2.92 ± 0.03 50.54 ± 0.14 199.23 ± 0.43
CPO 5 1.00 1.00 1.00 53.46 53.49 53.22 201.44 199.88 200.39 32 10
Rata-rata 1.00 ± 0.00 53.39 ± 0.27 200.57 ± 0.40
89
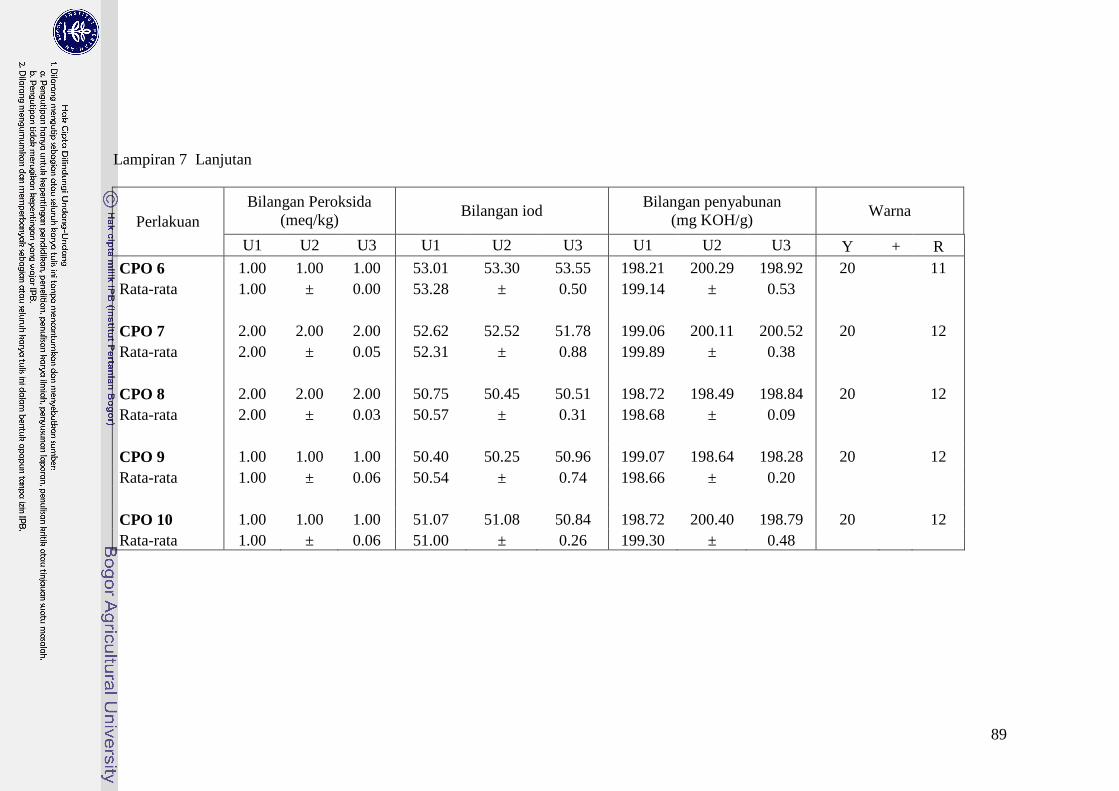
Lampiran 7 Lanjutan
Perlakuan
Bilangan Peroksida
(meq/kg) Bilangan iod
Bilangan penyabunan
(mg KOH/g) Warna
U1 U2 U3 U1 U2 U3 U1 U2 U3 Y + R
CPO 6 1.00 1.00 1.00 53.01 53.30 53.55 198.21 200.29 198.92 20 11
Rata-rata 1.00 ± 0.00 53.28 ± 0.50 199.14 ± 0.53
CPO 7 2.00 2.00 2.00 52.62 52.52 51.78 199.06 200.11 200.52 20 12
Rata-rata 2.00 ± 0.05 52.31 ± 0.88 199.89 ± 0.38
CPO 8 2.00 2.00 2.00 50.75 50.45 50.51 198.72 198.49 198.84 20 12
Rata-rata 2.00 ± 0.03 50.57 ± 0.31 198.68 ± 0.09
CPO 9 1.00 1.00 1.00 50.40 50.25 50.96 199.07 198.64 198.28 20 12
Rata-rata 1.00 ± 0.06 50.54 ± 0.74 198.66 ± 0.20
CPO 10 1.00 1.00 1.00 51.07 51.08 50.84 198.72 200.40 198.79 20 12
Rata-rata 1.00 ± 0.06 51.00 ± 0.26 199.30 ± 0.48
90
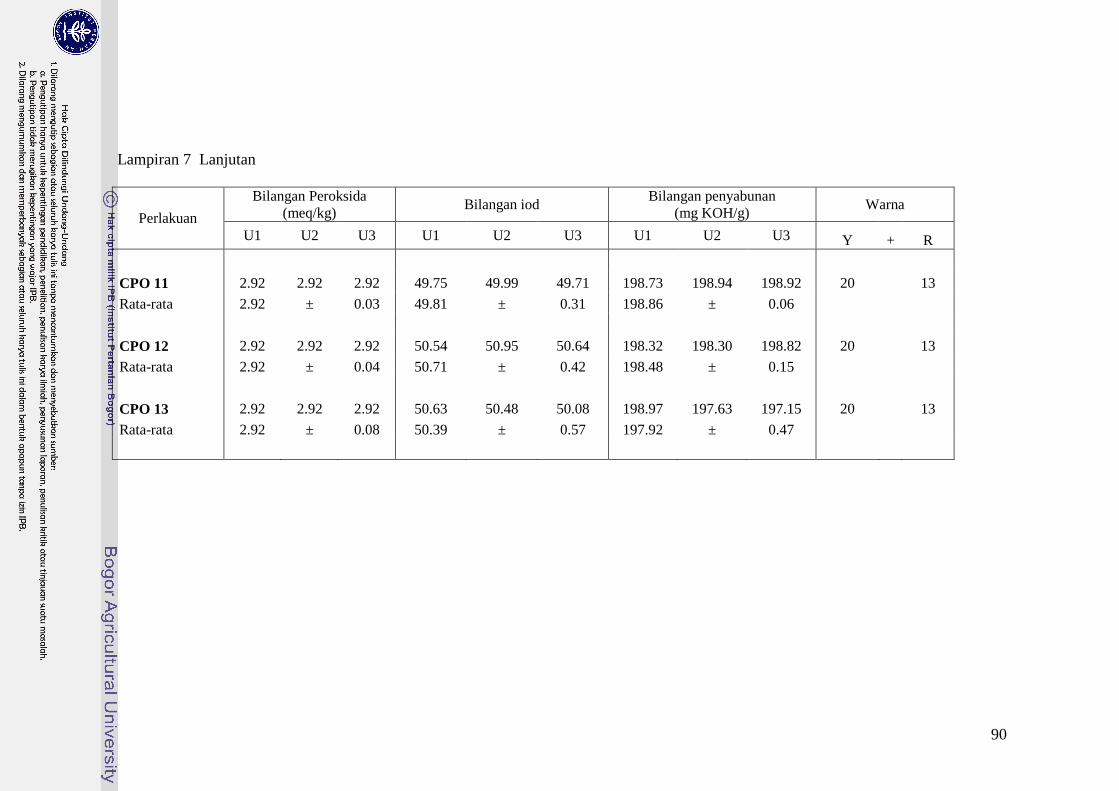
Lampiran 7 Lanjutan
Perlakuan
Bilangan Peroksida
(meq/kg) Bilangan iod
Bilangan penyabunan
(mg KOH/g) Warna
U1 U2 U3 U1 U2 U3 U1 U2 U3 Y + R
CPO 11 2.92 2.92 2.92 49.75 49.99 49.71 198.73 198.94 198.92 20 13
Rata-rata 2.92 ± 0.03 49.81 ± 0.31 198.86 ± 0.06
CPO 12 2.92 2.92 2.92 50.54 50.95 50.64 198.32 198.30 198.82 20 13
Rata-rata 2.92 ± 0.04 50.71 ± 0.42 198.48 ± 0.15
CPO 13 2.92 2.92 2.92 50.63 50.48 50.08 198.97 197.63 197.15 20 13
Rata-rata 2.92 ± 0.08 50.39 ± 0.57 197.92 ± 0.47

91
Lampiran 8 Perhitungan recovery karoten (%) tahap optimasi deasidifikasi minyak sawit merah
skala pilot plant
Perlakuan Suhu reaksi
(oC)
Waktu reaksi
(menit)
Berat CPO
(bk)
Berat NRPO
(bk)
Recovery
Karoten (%)
1 48 15 59.96 51.35 88.09
2 70 15 59.93 52.61 87.57
3 48 35 59.94 51.11 86.16
4 70 35 59.95 51.93 83.81
5 43 25 59.94 47.55 81.74
6 75 25 59.91 51.28 83.88
7 59 11 59.89 51.99 87.42
8 59 39 59.94 52.29 85.69
9 59 25 59.85 50.56 85.18
10 59 25 59.82 50.68 85.56
11 59 25 59.88 50.60 85.92
12 59 25 59.94 52.33 87.64
13 59 25 59.89 51.38 86.97

92
Lampiran 9 Perhitungan optimasi reduksi kadar asam lemak bebas (ALB) dengan perlakuan suhu dan waktu reaksi
Coding Coefficients for the Independent Variables
Factor Subtracted off Divided by
X1 59.000000 16.000000
X2 25.000000 14.000000
Response Surface for Variable Y: Reduksi ALB
Response Mean 95.985308
Root MSE 0.838274
R-Square 0.7703
Coef. of Variation 0.8733
Degrees
of Type I Sum
Regression Freedom of Squares R-Square F-Ratio Prob > F
Linear 2 2.635940 0.1231 1.876 0.2227
Quadratic 2 13.772291 0.6432 9.800 0.0094
Crossproduct 1 0.086436 0.0040 0.123 0.7361
Total Regress 5 16.494666 0.7703 4.695 0.0336
93
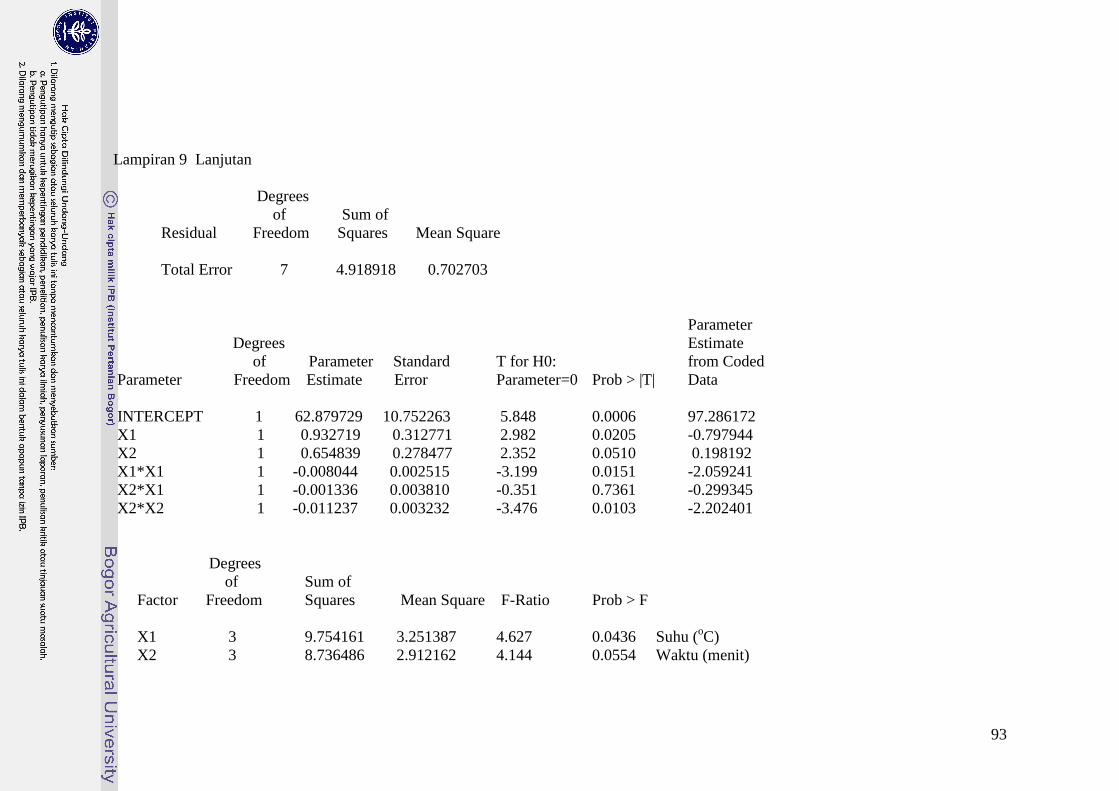
Lampiran 9 Lanjutan
Degrees
of Sum of
Residual Freedom Squares Mean Square
Total Error 7 4.918918 0.702703
Parameter
Degrees Estimate
of Parameter Standard T for H0: from Coded
Parameter Freedom Estimate Error Parameter=0 Prob > |T| Data
INTERCEPT 1 62.879729 10.752263 5.848 0.0006 97.286172
X1 1 0.932719 0.312771 2.982 0.0205 -0.797944
X2 1 0.654839 0.278477 2.352 0.0510 0.198192
X1*X1 1 -0.008044 0.002515 -3.199 0.0151 -2.059241
X2*X1 1 -0.001336 0.003810 -0.351 0.7361 -0.299345
X2*X2 1 -0.011237 0.003232 -3.476 0.0103 -2.202401
Degrees
of Sum of
Factor Freedom Squares Mean Square F-Ratio Prob > F
X1 3 9.754161 3.251387 4.627 0.0436 Suhu (oC)
X2 3 8.736486 2.912162 4.144 0.0554 Waktu (menit)
94
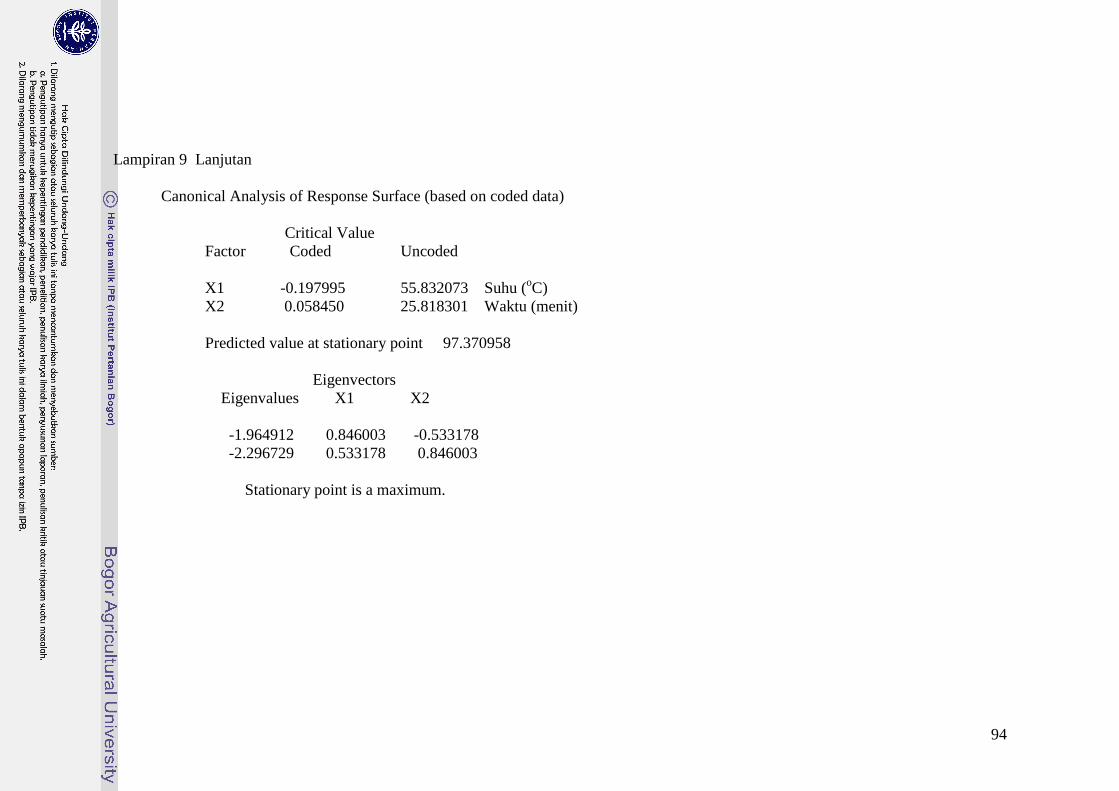
Lampiran 9 Lanjutan
Canonical Analysis of Response Surface (based on coded data)
Critical Value
Factor Coded Uncoded
X1 -0.197995 55.832073 Suhu (oC)
X2 0.058450 25.818301 Waktu (menit)
Predicted value at stationary point 97.370958
Eigenvectors
Eigenvalues X1 X2
-1.964912 0.846003 -0.533178
-2.296729 0.533178 0.846003
Stationary point is a maximum.
95
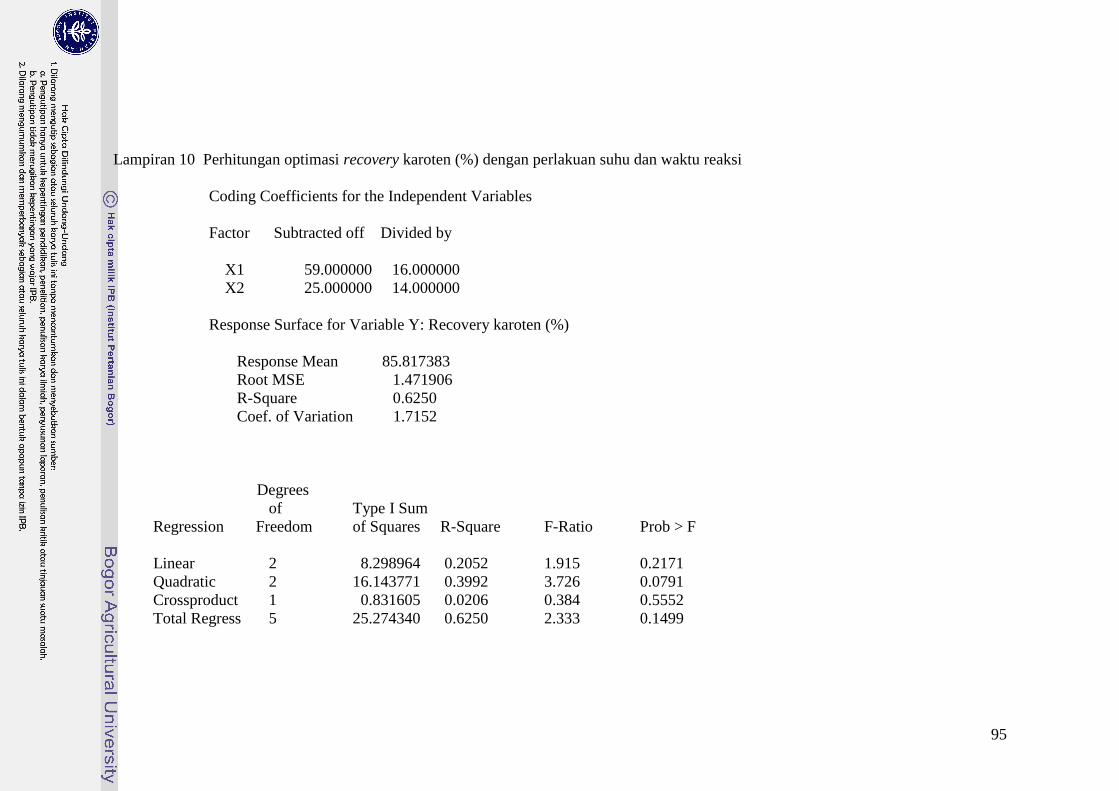
Lampiran 10 Perhitungan optimasi recovery karoten (%) dengan perlakuan suhu dan waktu reaksi
Coding Coefficients for the Independent Variables
Factor Subtracted off Divided by
X1 59.000000 16.000000
X2 25.000000 14.000000
Response Surface for Variable Y: Recovery karoten (%)
Response Mean 85.817383
Root MSE 1.471906
R-Square 0.6250
Coef. of Variation 1.7152
Degrees
of Type I Sum
Regression Freedom of Squares R-Square F-Ratio Prob > F
Linear 2 8.298964 0.2052 1.915 0.2171
Quadratic 2 16.143771 0.3992 3.726 0.0791
Crossproduct 1 0.831605 0.0206 0.384 0.5552
Total Regress 5 25.274340 0.6250 2.333 0.1499
96
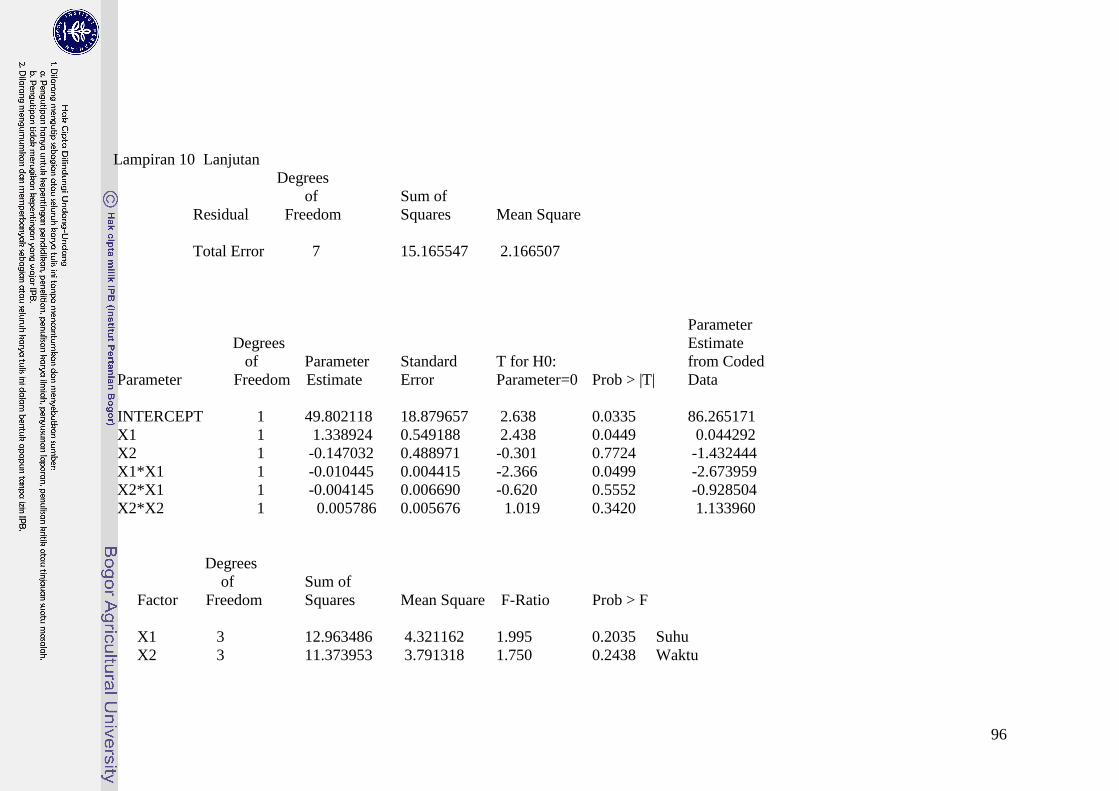
Lampiran 10 Lanjutan
Degrees
of Sum of
Residual Freedom Squares Mean Square
Total Error 7 15.165547 2.166507
Parameter
Degrees Estimate
of Parameter Standard T for H0: from Coded
Parameter Freedom Estimate Error Parameter=0 Prob > |T| Data
INTERCEPT 1 49.802118 18.879657 2.638 0.0335 86.265171
X1 1 1.338924 0.549188 2.438 0.0449 0.044292
X2 1 -0.147032 0.488971 -0.301 0.7724 -1.432444
X1*X1 1 -0.010445 0.004415 -2.366 0.0499 -2.673959
X2*X1 1 -0.004145 0.006690 -0.620 0.5552 -0.928504
X2*X2 1 0.005786 0.005676 1.019 0.3420 1.133960
Degrees
of Sum of
Factor Freedom Squares Mean Square F-Ratio Prob > F
X1 3 12.963486 4.321162 1.995 0.2035 Suhu
X2 3 11.373953 3.791318 1.750 0.2438 Waktu
97
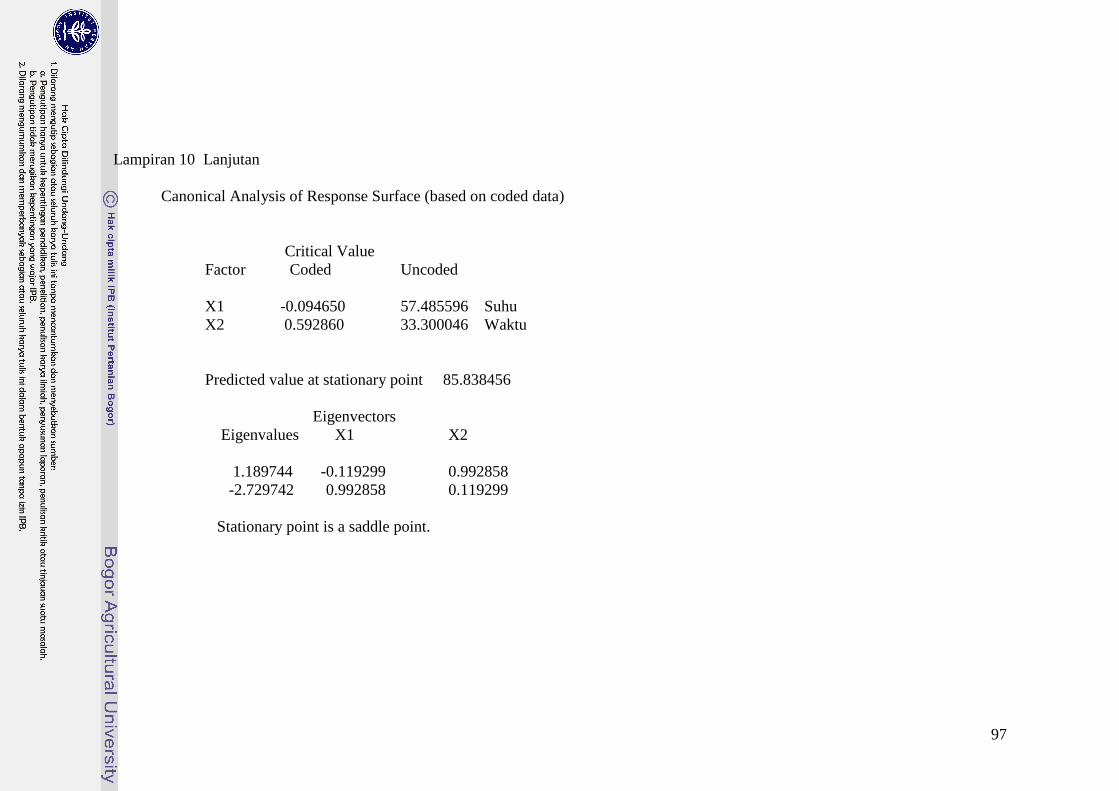
Lampiran 10 Lanjutan
Canonical Analysis of Response Surface (based on coded data)
Critical Value
Factor Coded Uncoded
X1 -0.094650 57.485596 Suhu
X2 0.592860 33.300046 Waktu
Predicted value at stationary point 85.838456
Eigenvectors
Eigenvalues X1 X2
1.189744 -0.119299 0.992858
-2.729742 0.992858 0.119299
Stationary point is a saddle point.
98
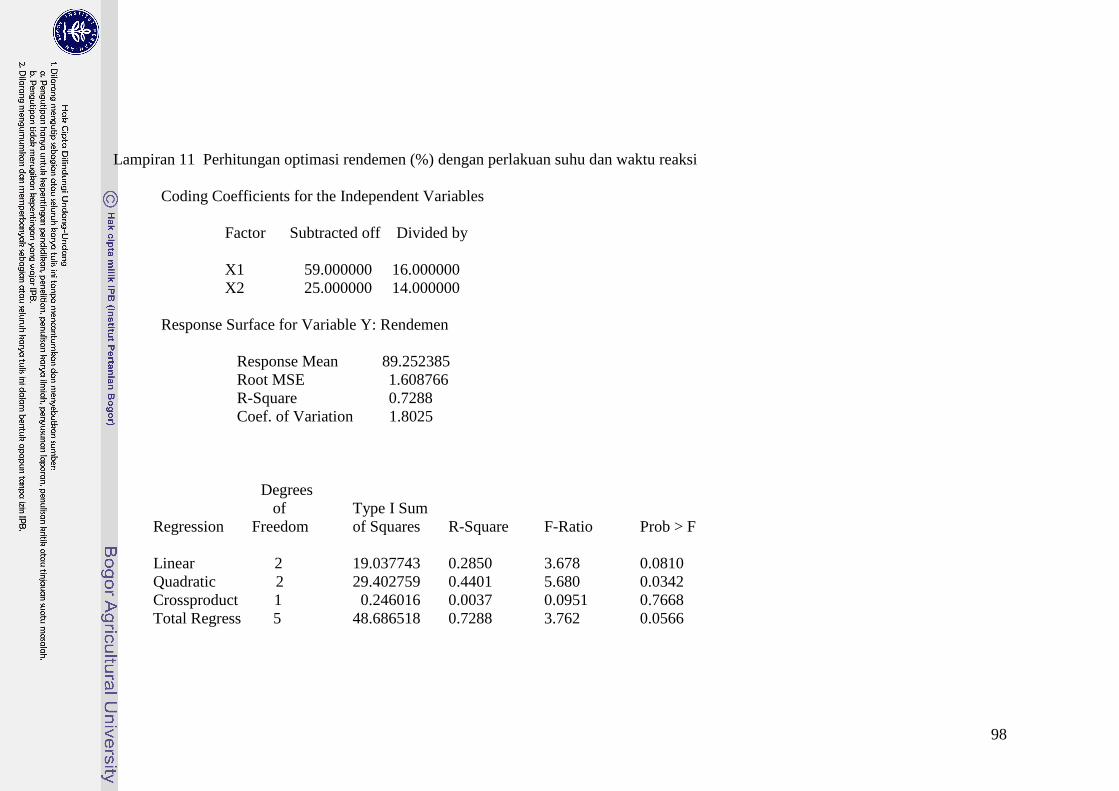
Lampiran 11 Perhitungan optimasi rendemen (%) dengan perlakuan suhu dan waktu reaksi
Coding Coefficients for the Independent Variables
Factor Subtracted off Divided by
X1 59.000000 16.000000
X2 25.000000 14.000000
Response Surface for Variable Y: Rendemen
Response Mean 89.252385
Root MSE 1.608766
R-Square 0.7288
Coef. of Variation 1.8025
Degrees
of Type I Sum
Regression Freedom of Squares R-Square F-Ratio Prob > F
Linear 2 19.037743 0.2850 3.678 0.0810
Quadratic 2 29.402759 0.4401 5.680 0.0342
Crossproduct 1 0.246016 0.0037 0.0951 0.7668
Total Regress 5 48.686518 0.7288 3.762 0.0566
99
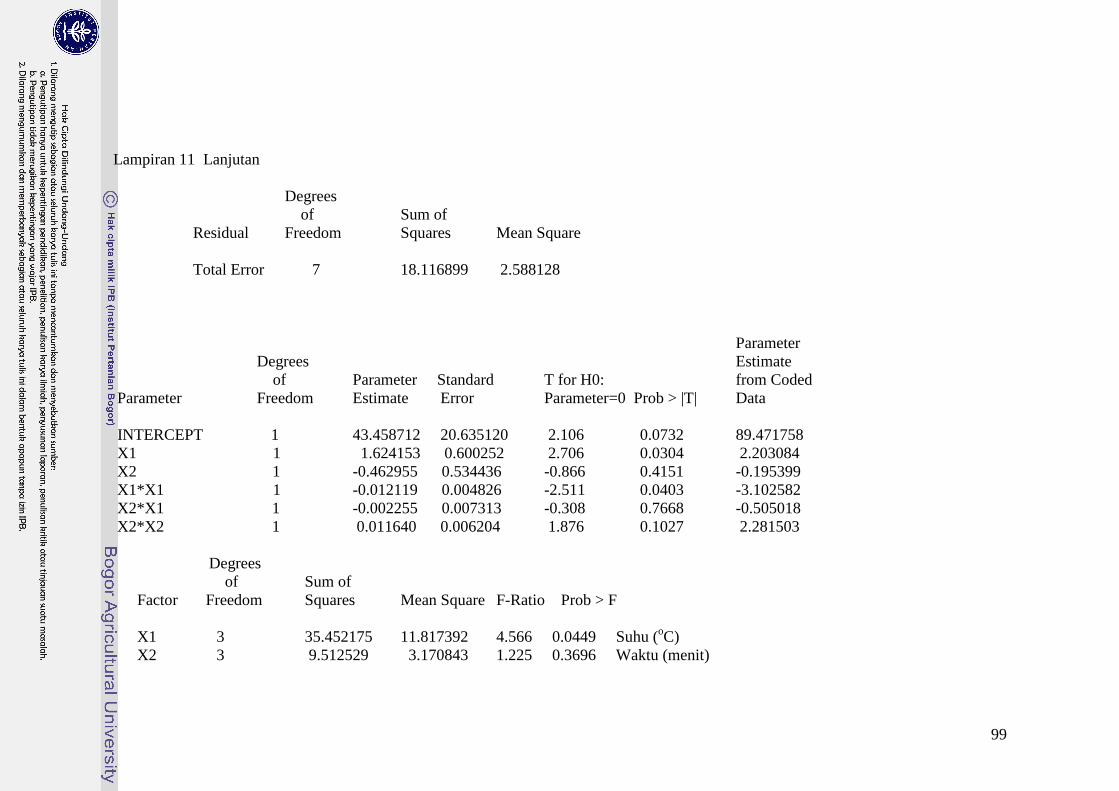
Lampiran 11 Lanjutan
Degrees
of Sum of
Residual Freedom Squares Mean Square
Total Error 7 18.116899 2.588128
Parameter
Degrees Estimate
of Parameter Standard T for H0: from Coded
Parameter Freedom Estimate Error Parameter=0 Prob > |T| Data
INTERCEPT 1 43.458712 20.635120 2.106 0.0732 89.471758
X1 1 1.624153 0.600252 2.706 0.0304 2.203084
X2 1 -0.462955 0.534436 -0.866 0.4151 -0.195399
X1*X1 1 -0.012119 0.004826 -2.511 0.0403 -3.102582
X2*X1 1 -0.002255 0.007313 -0.308 0.7668 -0.505018
X2*X2 1 0.011640 0.006204 1.876 0.1027 2.281503
Degrees
of Sum of
Factor Freedom Squares Mean Square F-Ratio Prob > F
X1 3 35.452175 11.817392 4.566 0.0449 Suhu (oC)
X2 3 9.512529 3.170843 1.225 0.3696 Waktu (menit)
100
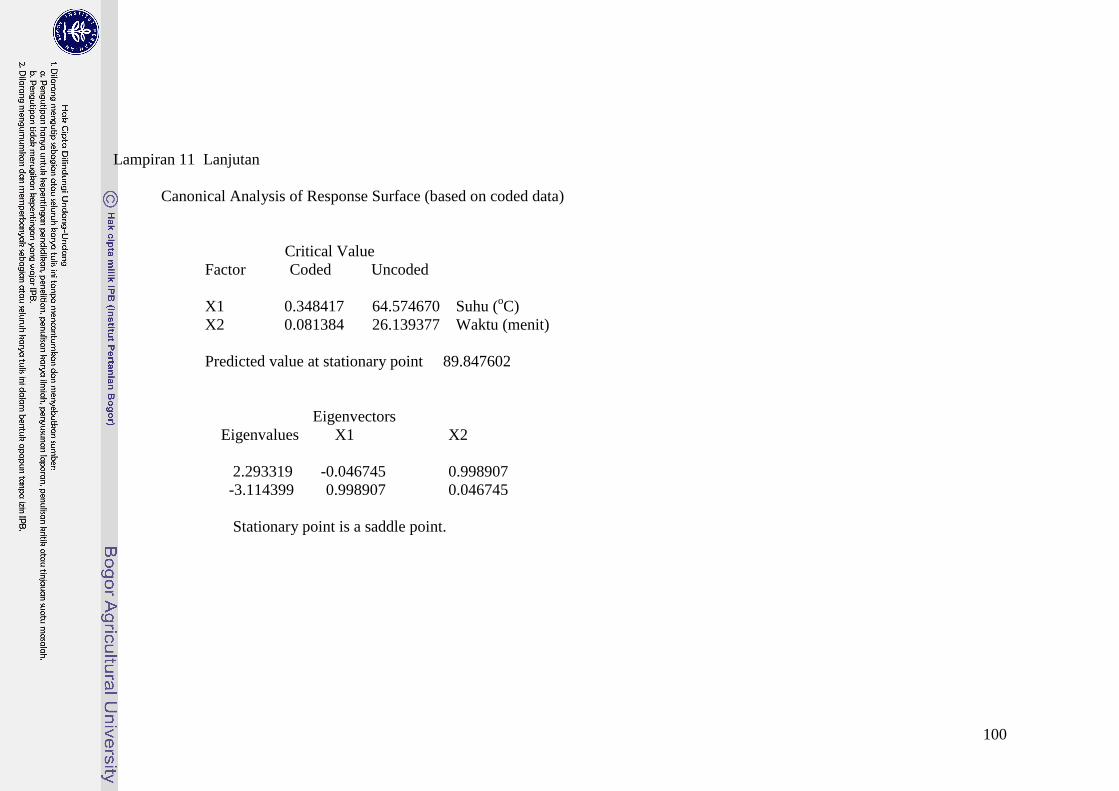
Lampiran 11 Lanjutan
Canonical Analysis of Response Surface (based on coded data)
Critical Value
Factor Coded Uncoded
X1 0.348417 64.574670 Suhu (oC)
X2 0.081384 26.139377 Waktu (menit)
Predicted value at stationary point 89.847602
Eigenvectors
Eigenvalues X1 X2
2.293319 -0.046745 0.998907
-3.114399 0.998907 0.046745
Stationary point is a saddle point.

101
Lampiran 12 Perhitungan suhu dan waktu optimum sebagai salah satu pertimbangan dalam penentuan kondisi untuk tahap validasi dengan
superimposed menggunakan SAS
Coding Coefficients for the Independent Variables
Factor Subtracted off Divided by
X1 59.000000 16.000000
X2 25.000000 14.000000
Response Surface for Variable Y: Respon optimum
Response Mean 271.055075
Root MSE 2.374494
R-Square 0.7709
Coef. of Variation 0.8760
Degrees
of Type I Sum
Regression Freedom of Squares R-Square F-Ratio Prob > F
Linear 2 16.432663 0.0954 1.457 0.2957
Quadratic 2 113.453428 0.6587 10.061 0.0087
Crossproduct 1 2.896545 0.0168 0.514 0.4967
Total Regress 5 132.782636 0.7709 4.710 0.0333

102
Lampiran 12 Lanjutan
Degrees
of Sum of
Residual Freedom Squares Mean Square
Total Error 7 39.467539 5.638220
Parameter
Degrees Estimate
of Parameter Standard T for H0: from Coded
Parameter Freedom Estimate Error Parameter=0 Prob > |T| Data
INTERCEPT 1 156.140560 30.456857 5.127 0.0014 273.023101
X1 1 3.895796 0.885956 4.397 0.0032 1.449432
X2 1 0.044852 0.788813 0.0569 0.9562 -1.429651
X1*X1 1 -0.030609 0.007123 -4.297 0.0036 -7.835782
X2*X1 1 -0.007736 0.010793 -0.717 0.4967 -1.732868
X2*X2 1 0.006189 0.009156 0.676 0.5208 1.213062
Degrees
of Sum of
Factor Freedom Squares Mean Square F-Ratio Prob > F
X1 3 115.184388 38.394796 6.810 0.0175 Suhu

103
X2 3 13.731594 4.577198 0.812 0.5266 Waktu
Lampiran 12 lanjutan
Canonical Analysis of Response Surface (based on coded data)
Critical Value
Factor Coded Uncoded
X1 0.025329 59.405268 Suhu
X2 0.607365 33.503110 Waktu
Predicted value at stationary point 272.607297
Eigenvectors
Eigenvalues X1 X2
1.295277 -0.094464 0.995528
-7.917996 0.995528 0.094464
Stationary point is a saddle point.

104
Lampiran 13 Hasil analisis sifat fisiko kimia CPO dan NRPO tahap validasi proses deasidifikasi minyak sawit merah skala pilot plant
Perlakuan Kadar ALB (%) Kadar Karoten (mg/kg) Kadar air (%) Rendemen
(%)
Refining
factor
Oil loss
(%) U1 U2 U3 U1 U1 U3 U1 U2 U3
CPO 1 3.49 3.49 3.53 455.36 458.27 455.91 0.12 0.13 0.13
Rata-rata 3.50 ± 0.74 456.51 ± 0.34 0.13 ± 3.67
Degumming 8.60 8.60 8.83 443.63 447.54 444.07 0.73 0.73 0.70
Rata-rata 8.68 ± 1.50 445.08 ± 0.48 0.72 ± 2.26
Deasidifikasi
61oC, 26 menit
0.12 0.12 0.12 470.60 447.48 455.27 0.70 0.69 0.68 90.16 3.71 13.00
Rata-rata 0.12 ± 0.00 457.78 ± 2.57 0.69 ± 1.54
CPO 2 3.58 3.58 3.58 458.18 451.60 454.81 0.16 0.16 0.15
Rata-rata 3.58 ± 0.04 454.86 ± 0.72 0.15 ± 4.19
Degumming 4.96 4.92 4.96 445.68 441.92 449.13 0.50 0.49 0.50
Rata-rata 4.95 ± 0.51 445.58 ± 0.81 0.50 ± 1.45
Deasidifikasi
61oC, 26 menit
0.14 0.15 0.15 463.92 470.15 470.60 0.49 0.51 0.50 90.92 3.45 12.33
Rata-rata 0.14 ± 4.84 468.23 ± 0.80 0.50 ± 2.12
105
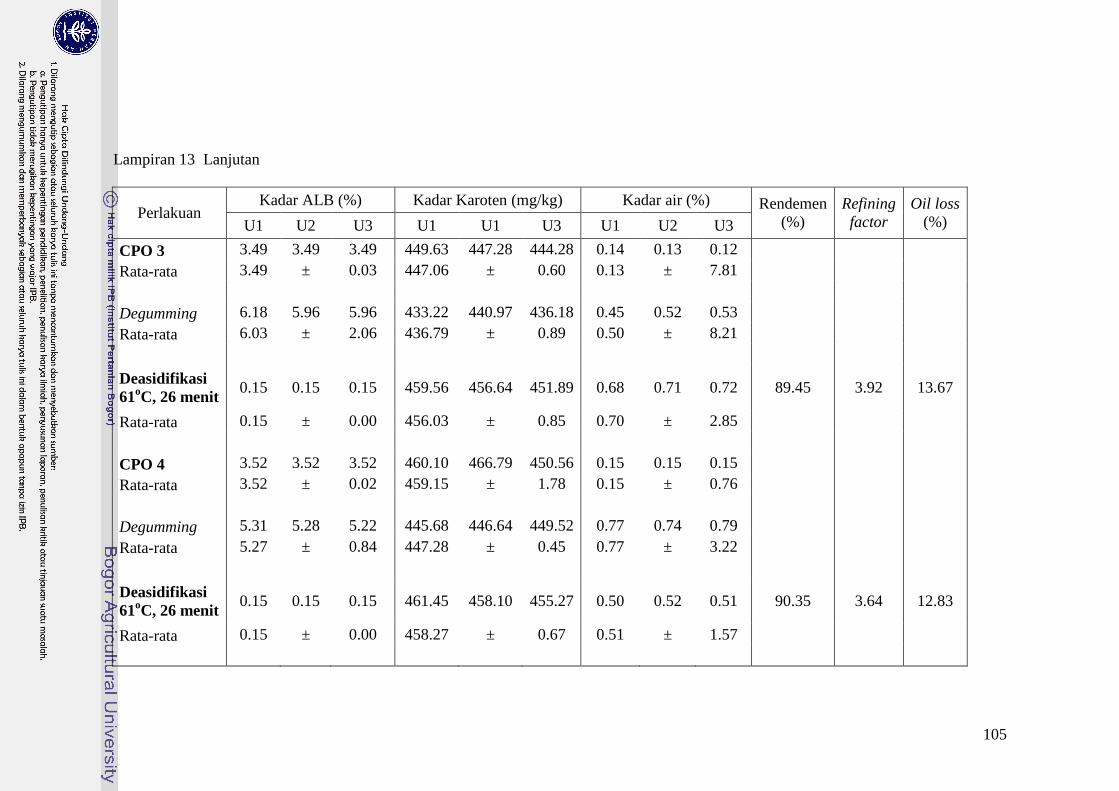
Lampiran 13 Lanjutan
Perlakuan Kadar ALB (%) Kadar Karoten (mg/kg) Kadar air (%) Rendemen
(%)
Refining
factor
Oil loss
(%) U1 U2 U3 U1 U1 U3 U1 U2 U3
CPO 3 3.49 3.49 3.49 449.63 447.28 444.28 0.14 0.13 0.12
Rata-rata 3.49 ± 0.03 447.06 ± 0.60 0.13 ± 7.81
Degumming 6.18 5.96 5.96 433.22 440.97 436.18 0.45 0.52 0.53
Rata-rata 6.03 ± 2.06 436.79 ± 0.89 0.50 ± 8.21
Deasidifikasi
61oC, 26 menit
0.15 0.15 0.15 459.56 456.64 451.89 0.68 0.71 0.72 89.45 3.92 13.67
Rata-rata 0.15 ± 0.00 456.03 ± 0.85 0.70 ± 2.85
CPO 4 3.52 3.52 3.52 460.10 466.79 450.56 0.15 0.15 0.15
Rata-rata 3.52 ± 0.02 459.15 ± 1.78 0.15 ± 0.76
Degumming 5.31 5.28 5.22 445.68 446.64 449.52 0.77 0.74 0.79
Rata-rata 5.27 ± 0.84 447.28 ± 0.45 0.77 ± 3.22
Deasidifikasi
61oC, 26 menit
0.15 0.15 0.15 461.45 458.10 455.27 0.50 0.52 0.51 90.35 3.64 12.83
Rata-rata 0.15 ± 0.00 458.27 ± 0.67 0.51 ± 1.57
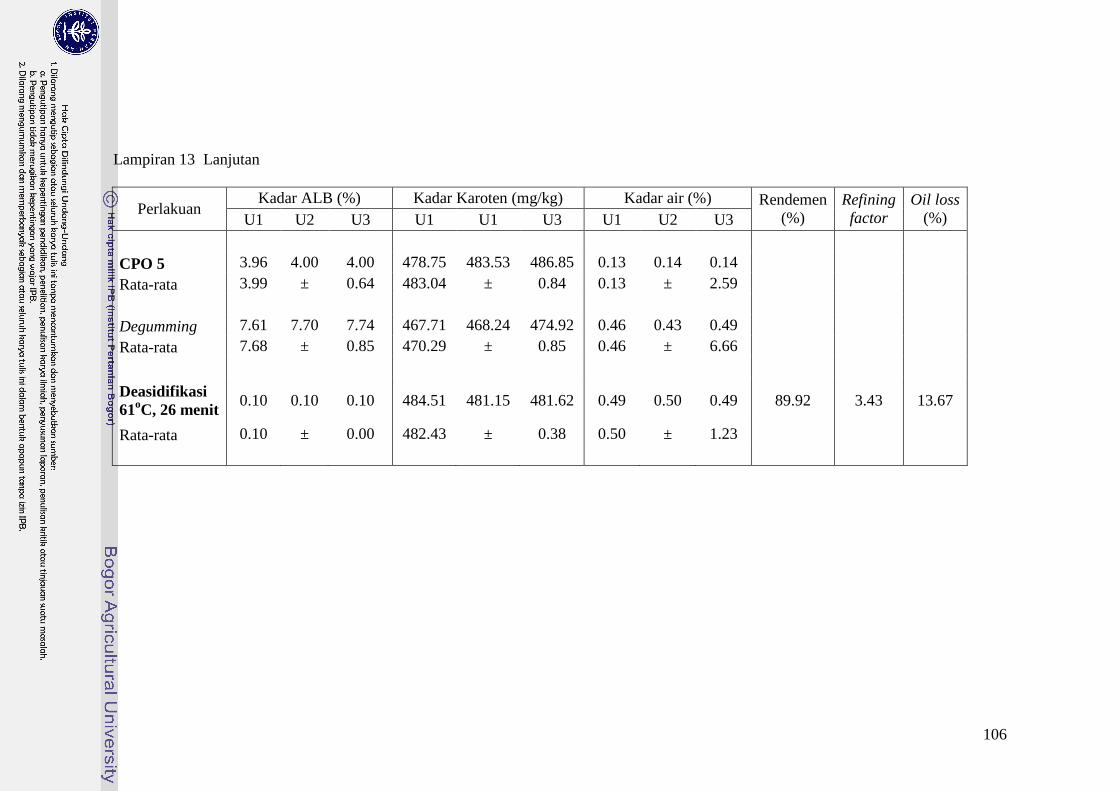
106
Lampiran 13 Lanjutan
Perlakuan Kadar ALB (%) Kadar Karoten (mg/kg) Kadar air (%) Rendemen
(%)
Refining
factor
Oil loss
(%) U1 U2 U3 U1 U1 U3 U1 U2 U3
CPO 5 3.96 4.00 4.00 478.75 483.53 486.85 0.13 0.14 0.14
Rata-rata 3.99 ± 0.64 483.04 ± 0.84 0.13 ± 2.59
Degumming 7.61 7.70 7.74 467.71 468.24 474.92 0.46 0.43 0.49
Rata-rata 7.68 ± 0.85 470.29 ± 0.85 0.46 ± 6.66
Deasidifikasi
61oC, 26 menit
0.10 0.10 0.10 484.51 481.15 481.62 0.49 0.50 0.49 89.92 3.43 13.67
Rata-rata 0.10 ± 0.00 482.43 ± 0.38 0.50 ± 1.23

107
Lampiran 13 Lanjutan
Perlakuan Bilangan Peroksida (meq/kg) Bilangan iod
Bilangan penyabunan
(mg KOH/g) Warna
U1 U2 U3 U1 U2 U3 U1 U2 U3 Y + R
CPO 1 3.00 3.00 3.00 52.36 52.07 52.54 197.66 197.23 197.41 30.00 11.00
Rata-rata 3.00 ± 0.04 52.32 ± 0.46 197.43 ± 0.11
Deasidifikasi
61oC, 26 menit
2.00 2.00 2.00 52.50 51.95 52.17 194.27 194.28 195.61 30.00 11.00
Rata-rata 2.00 ± 0.05 52.21 ± 0.53 194.72 ± 0.40
CPO 2 3.00 3.00 3.00 52.82 52.52 52.90 196.18 195.54 196.19 30.00 10.00
Rata-rata 3.00 ± 0.02 52.75 ± 0.39 195.97 ± 0.19
Deasidifikasi
61oC, 26 menit
2.00 2.00 2.00 52.45 53.25 52.68 192.86 191.89 193.06 30.00 11.00
Rata-rata 2.00 ± 0.05 52.80 ± 0.78 192.61 ± 0.32
CPO 3 2.00 2.00 2.00 53.03 52.84 52.82 194.84 194.15 194.63 30.00 10.30
Rata-rata 2.00 ± 0.03 52.90 ± 0.22 194.54 ± 0.18
Deasidifikasi
61oC, 26 menit
2.00 2.00 2.00 52.17 52.25 52.70 197.29 197.65 197.55 30.20 10.30
Rata-rata 2.00 ± 0.00 52.37 ± 0.55 197.50 ± 0.09

108
Lampiran 13 Lanjutan
Perlakuan Bilangan Peroksida (meq/kg) Bilangan iod
Bilangan penyabunan (mg
KOH/g) Warna
U1 U2 U3 U1 U2 U3 U1 U2 U3 Y + R
CPO 4 2.00 2.00 2.00 52.07 52.23 52.06 195.75 196.13 196.12 30.00 10.40
Rata-rata 2.00 ± 0.00 52.12 ± 0.18 196.00 ± 0.11
Deasidifikasi
61oC, 26 menit
2.00 2.00 2.00 51.79 51.59 52.17 195.82 198.80 195.78 30.00 10.40
Rata-rata 2.00 ± 0.03 51.85 ± 0.57 196.80 ± 0.88
CPO 5 3.00 3.00 3.00 53.84 53.68 53.59 199.03 197.66 197.51 30.00 10.00
Rata-rata 3.00 ± 0.00 53.70 ± 0.23 198.07 ± 0.42
Deasidifikasi
61oC, 26 menit
3.00 3.00 3.00 53.51 53.53 53.66 194.69 196.14 195.87 30.00 11.00
Rata-rata 3.00 ± 0.04 53.57 ± 0.15 195.57 ± 0.40
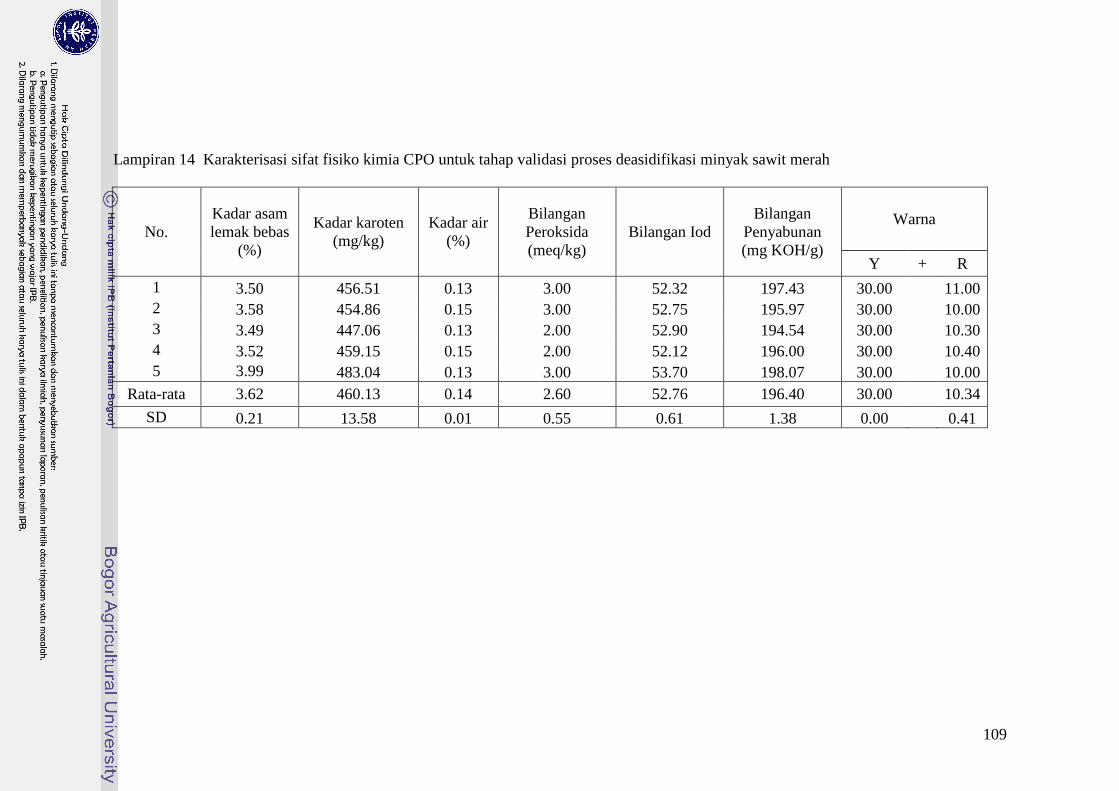
109
Lampiran 14 Karakterisasi sifat fisiko kimia CPO untuk tahap validasi proses deasidifikasi minyak sawit merah
No.
Kadar asam
lemak bebas
(%)
Kadar karoten
(mg/kg)
Kadar air
(%)
Bilangan
Peroksida
(meq/kg)
Bilangan Iod
Bilangan
Penyabunan
(mg KOH/g)
Warna
Y + R
1 3.50 456.51 0.13 3.00 52.32 197.43 30.00 11.00
2 3.58 454.86 0.15 3.00 52.75 195.97 30.00 10.00
3 3.49 447.06 0.13 2.00 52.90 194.54 30.00 10.30
4 3.52 459.15 0.15 2.00 52.12 196.00 30.00 10.40
5 3.99 483.04 0.13 3.00 53.70 198.07 30.00 10.00
Rata-rata 3.62 460.13 0.14 2.60 52.76 196.40 30.00 10.34
SD 0.21 13.58 0.01 0.55 0.61 1.38 0.00 0.41

110
Lampiran 15 Karakterisasi sifat fisiko kimia NRPO untuk tahap validasi proses deasidifikasi minyak sawit merah
No. Produk
(kg)
Kadar asam
lemak
bebas (%)
Kadar
karoten
(mg/kg)
Kadar air
(%)
Bilangan
Peroksida
(meq/kg)
Bilangan
Iod
Bilangan
Penyabunan
(mg KOH/g)
Warna
Y + R
1 52.20 0.12 457.78 0.69 2.00 52.21 194.72 30.00 11.00
2 52.60 0.14 468.23 0.50 2.00 52.80 192.61 30.00 11.00
3 51.80 0.15 456.03 0.70 2.00 52.37 197.50 30.20 10.30
4 52.30 0.15 458.27 0.51 2.00 51.85 196.80 30.00 10.40
5 51.80 0.10 484.51 0.50 3.00 53.57 195.57 30.00 11.00
Rata-rata 52.14 0.13 464.96 0.58 2.20 52.56 195.44 30.04 10.74
SD 0.34 0.02 11.92 0.11 0.45 0.66 1.91 0.09 0.36
111
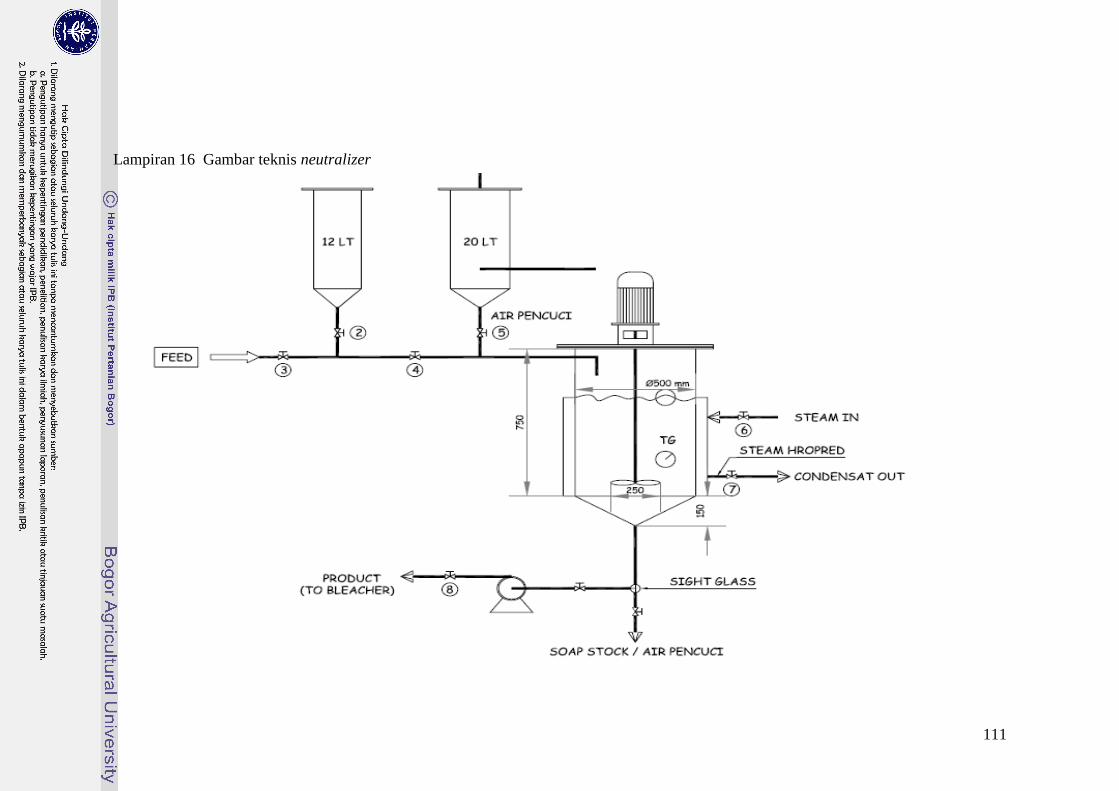
Lampiran 16 Gambar teknis neutralizer
112
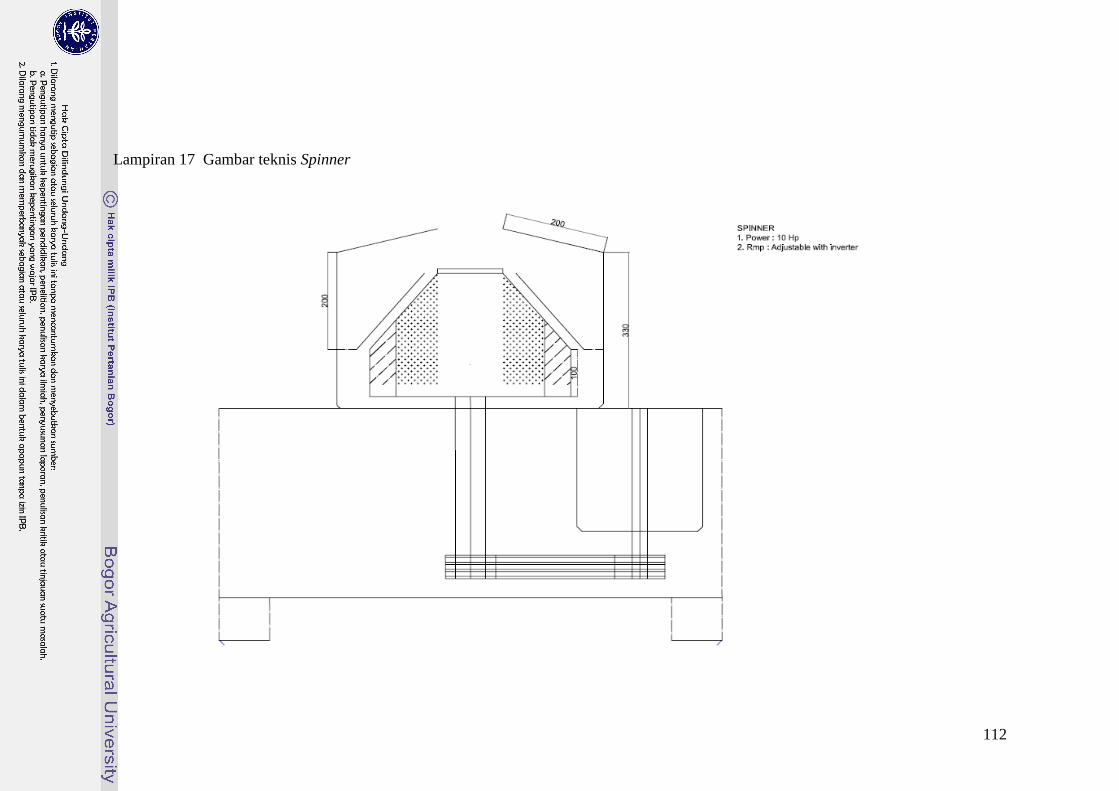
Lampiran 17 Gambar teknis Spinner


![[FDD 2016] Mateusz Stasch - Architektura, która pomaga!](https://img.pdfslide.net/doc/110x75/58cedd081a28abd4098b6735/fdd-2016-mateusz-stasch-architektura-ktora-pomaga.jpg)