Embed Size (px)
Citation preview

JAPAN REAL ESTATE MARKET REPORT March 2014
【M i C diti 】
Hot TopicHot TopicContents
http://www.kenedix.com/
【Macroeconomic Conditions】A succession of downward revisions to the projected economic growth rate
The real GDP growth rate for October-December 2013 (secondpreliminary figures), announced March 10, 2014, was an annualizedrate of 0.7% (QoQ, seasonally adjusted). Since this was lower thanprevious expectations, a succession of research institutions haverevised downward their projected GDP growth rates for 2013 and
1. Hot Topic
Macro Economy・・・・・・・・・・・・・・1
Global Commercial Real Estate Market Outlook ・・・・・・・・・・・・・3
Outlook for Commercial RealEstate Investment Markets in revised downward their projected GDP growth rates for 2013 and
2014.A look at contributors to real GDP in October-December shows thatwhile domestic demand largely met expectations with growth of+0.7%, foreign demand showed negative growth, as it had in July-September, at -0.5%. As had been expected, domestic demand showedan improving trend. For example, capital investment by private firmsgrew by +5.3% (QoQ, annualized rate) and private final consumptione pendit re b +2 0% (QoQ ann ali ed rate)
Estate Investment Markets inJapan・・・・・・・・・・・・・・・・・・・・・・・2
2. Market View
Hallmarks of the J-REIT ・・・・・・6
expenditure by +2.0% (QoQ, annualized rate).An unexpected component of this quarter’s figures was the weaknessof foreign demand. Although exports of goods and services reboundedto show positive growth at +1.7%, they were lacking in terms ofstrength, and in contrast imports grew substantially at +14.7%. Despitethe fact that the downward trend in the yen has continued for aboutone year, there are concerns about the weak growth in exports.Possible reasons for this include (i) the slow pace of economic
3. Real EstateInvestment Market・・・・・・・・・8
4. J-REIT Market・・・・・・・・・・・・・9
5. Office Market: Tokyo・・・・・・・10
6. Residential Market・・・・・・・・・11
7 L i ti F ilit recovery overseas, (ii) the possibility of decreased sensitivity of exportvolumes to exchange rates as the shift of production facilities overseasadvances, (iii) the possibility that companies are not lowering exportprices despite the growing devaluation of the yen, and (iv) increasingtrade deficits in some sectors, such as electrical machinery.
【Fig.1】Real GDP Growth Rate and TOPIX
7. Logistics Facility/Retail Facility Market・・・・・12
1 9006 0 (%)
1,100
1,300
1,500
1,700
1,900
-2.0
0.0
2.0
4.0
6.0 ( )
1Note: Outlook come from Bloomberg consensusSource: The Cabinet Office, Bloomberg
500
700
900
-8.0
-6.0
-4.0
00 01 02 03 04 05 06 07 08 09 10 11 12 13 14
Real GDP Growth Rate (LHS) TOPIX (RHS)
Hot Topic
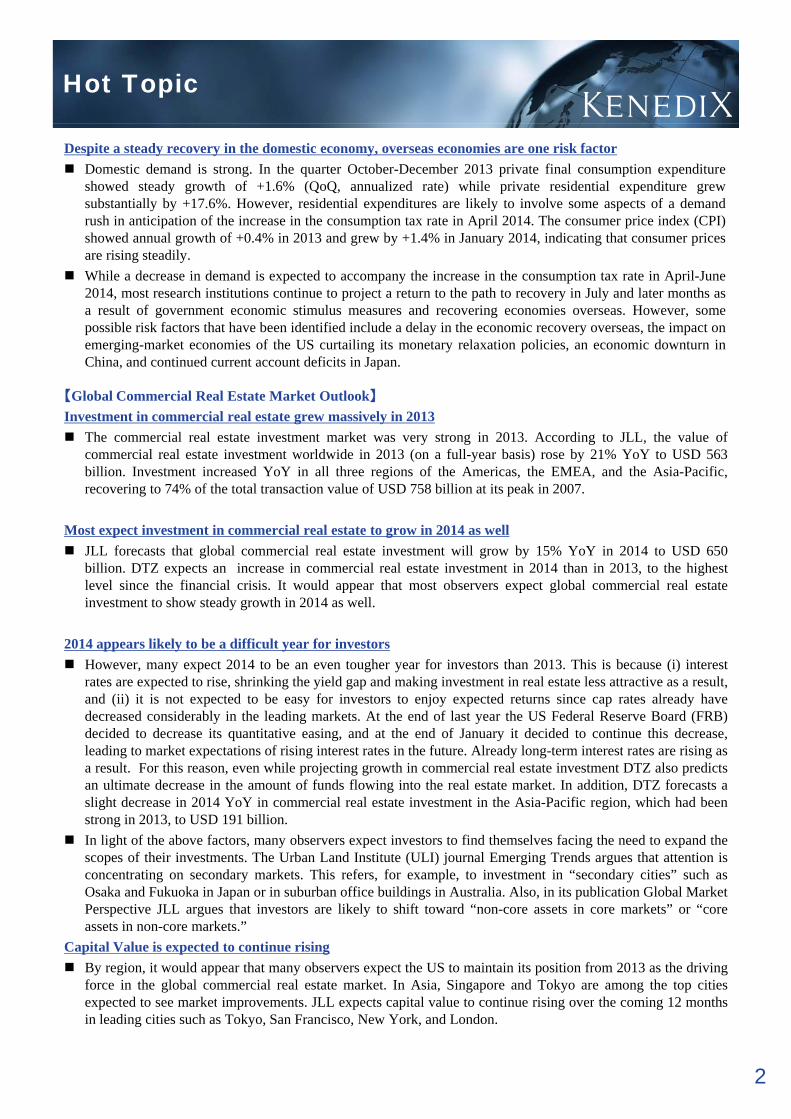
Despite a steady recovery in the domestic economy, overseas economies are one risk factorDomestic demand is strong. In the quarter October-December 2013 private final consumption expenditureshowed steady growth of +1.6% (QoQ, annualized rate) while private residential expenditure grewsubstantially by +17.6%. However, residential expenditures are likely to involve some aspects of a demandrush in anticipation of the increase in the consumption tax rate in April 2014. The consumer price index (CPI)showed annual growth of +0.4% in 2013 and grew by +1.4% in January 2014, indicating that consumer pricesare rising steadily.While a decrease in demand is expected to accompany the increase in the consumption tax rate in April-June2014, most research institutions continue to project a return to the path to recovery in July and later months asa result of government economic stimulus measures and recovering economies overseas. However, somepossible risk factors that have been identified include a delay in the economic recovery overseas, the impact onemerging-market economies of the US curtailing its monetary relaxation policies, an economic downturn inChina, and continued current account deficits in Japan.
【Global Commercial Real Estate Market Outlook】Investment in commercial real estate grew massively in 2013
The commercial real estate investment market was very strong in 2013. According to JLL, the value ofcommercial real estate investment worldwide in 2013 (on a full-year basis) rose by 21% YoY to USD 563billion. Investment increased YoY in all three regions of the Americas, the EMEA, and the Asia-Pacific,recovering to 74% of the total transaction value of USD 758 billion at its peak in 2007.
Most expect investment in commercial real estate to grow in 2014 as wellJLL forecasts that global commercial real estate investment will grow by 15% YoY in 2014 to USD 650billion. DTZ expects an increase in commercial real estate investment in 2014 than in 2013, to the highestlevel since the financial crisis. It would appear that most observers expect global commercial real estateinvestment to show steady growth in 2014 as well.
2014 appears likely to be a difficult year for investorsHowever, many expect 2014 to be an even tougher year for investors than 2013. This is because (i) interestrates are expected to rise, shrinking the yield gap and making investment in real estate less attractive as a result,and (ii) it is not expected to be easy for investors to enjoy expected returns since cap rates already havedecreased considerably in the leading markets. At the end of last year the US Federal Reserve Board (FRB)decided to decrease its quantitative easing, and at the end of January it decided to continue this decrease,l di k i f i i i i h f Al d l i i ileading to market expectations of rising interest rates in the future. Already long-term interest rates are rising asa result. For this reason, even while projecting growth in commercial real estate investment DTZ also predictsan ultimate decrease in the amount of funds flowing into the real estate market. In addition, DTZ forecasts aslight decrease in 2014 YoY in commercial real estate investment in the Asia-Pacific region, which had beenstrong in 2013, to USD 191 billion.In light of the above factors, many observers expect investors to find themselves facing the need to expand thescopes of their investments. The Urban Land Institute (ULI) journal Emerging Trends argues that attention is
i d k Thi f f l i i “ d i i ” hconcentrating on secondary markets. This refers, for example, to investment in “secondary cities” such asOsaka and Fukuoka in Japan or in suburban office buildings in Australia. Also, in its publication Global MarketPerspective JLL argues that investors are likely to shift toward “non-core assets in core markets” or “coreassets in non-core markets.”
Capital Value is expected to continue risingBy region, it would appear that many observers expect the US to maintain its position from 2013 as the drivingforce in the global commercial real estate market. In Asia, Singapore and Tokyo are among the top cities
2
expected to see market improvements. JLL expects capital value to continue rising over the coming 12 monthsin leading cities such as Tokyo, San Francisco, New York, and London.

Hot Topic
Capital value Sydney
New YorkSao Paulo
C it l
Hong KongSingapore, Chicago
Los Angeles
【Fig.2】Prime Office Projected Changesin Value, 2014
【Fig.3】Prime Office – Capital Value Clock, Q4 2013
Capital Values
+10 - 20 % Tokyo, New York, San Franciscopgrowth slowingSeoul
London
San Francisco
Tokyo
Capital
values falling
Capital values
bottoming out
Capital value growth
accelerating
+5 - 10% Dubai, London, Boston, Chicago,Los Angeles, Madrid, Mumbai
+0 - 5 %Moscow , Shanghai, Washington DC, Beijing,
Hong Kong, Seoul, Singapore, Sydney,Paris, Stockholm, Frankfurt
-0 - 5 % Brussels
Shanghai
Paris
BeijingSource:JLL Source: JLL
【Outlook for Commercial Real Estate Investment Markets in Japan】Many observers are bullish on Japan
According to JLL, in 2013 trading in commercial real estate in Japan rose by 63% YoY. The inflow of funds toJ ’ i l l t t k t i t d t ti i 2014 ll A 2014 f th A i
-5 - 10 % Sao Paulo
Japan’s commercial real estate market is expected to continue in 2014 as well. A 2014 survey of the Asia-Pacific region conducted by ULI showed that Tokyo was considered “the most promising target ofinvestment.” It had been five years since Tokyo last was in first place, in 2009. It would appear that real estatein Japan has become a more attractive investment due to the fact that the Abe Cabinet’s broad-rangingeconomic policies (so-called Abenomics) have earned a certain level of regard from the markets, the fact thatmonetary relaxation policies appear likely to continue as long as the government and the Bank of Japan keepaiming to end deflation, and the decreased value of the yen on international currency markets. However, itshould not be forgotten that investors are watching with great interest to see whether Abenomics can helpJ b k f f i l h i lJapan break free from its lengthy economic slump.
Funds continue flowing into J-REITs and private REITsJ-REITs can be described as having driven the commercial real estate investment market in Japan in 2013.Capital increases through public offering of shares by J-REITs reached their highest level ever, and the valueof properties purchased by J-REITs surpassed its level from 2006, the peak level prior to the financial crisis. Asuccession of new J-REIT listings and capital increases through public offering of shares by existing listedREITs has been announced since the start of 2014 as well and as of March 14th it was clear that capital
16400 (JPY in bm)
Value of Financing (LHS)
REITs has been announced since the start of 2014 as well, and as of March 14th it was clear that capitalincreases totaled JPY 187.8 billion (including some for which prices had not yet been determined). There isstrong appetite for raising funds among J-REITs, and, barring a collapse of the J-REIT market, high levels ofJ-REIT fund raising and property acquisitions can be expected in 2014 as well.
【Fig.4】Financing by J-REIT (IPO/PO)
Announce Name Vol me
【Fig.5】J-REITs Which were Financed in 2014
8
12
200
300
Value of Financing (LHS)Number of Financing (RHS)
Date Name Volume
Jan-14 Hulic REIT 66.7
Jan-14 Japan Excellent 10.4
Jan-14 Advance Residence 12.8
Jan-14 Comforia Residential REIT 23.7
& f
0
4
0
100
2006 2007 2008 2009 2010 2011 2012 2013 2014 3Source: Kenedix prepared based on Bloomberg
Jan-14 Industrial & Infrastructure Fund 7.1
Mar-14 Daiwa House REIT 19.2
Mar-14 Orix JREIT 33.1
Mar-14 Nippon Building Fund 14.8
Source: Kenedix Prepared based on J-REITs

Hot Topic
【Fig.6】AUM of Private REITsPrivate REITs expected to build on their balances
In addition, private REITs, which increased thebalance in their asset portfolios in 2013, areexpected to build on their asset balances as a resultof activity in both establishment of new trusts andcapital increases. As of the end of 2013 there weresix companies operating private REITs and their
500
600 (JPY in bn)
Daiwa residential Private Investment DREAM Private REITJapan Private REIT Mitsui Fudosan Private REITsix companies operating private REITs, and their
asset balances appeared to total more than JPY 500billion. The inflow of funds to private REITscontinues, chiefly from domestic pension funds andfinancial institutions. At the end of last year TokyuLand Capital Management Inc. and Kenedix RealEstate Fund Management, Inc. both establishednew investment corporations and announced plansto enter the private REIT market Other players
100
200
300
400 Nippon Open Ended Real Estate Investment Nomura Real Estate Private REIT
Source: Kenedix prepared based on Sumitomo Mitsui TrustResearch Institute Co., Ltd, News report
to enter the private REIT market. Other playersincluding SG Holdings plan to set up privateREITs, and the market is expected to continuegrowing steadily in the future.
A movement toward the start of healthcare REITsThe birth of the healthcare REIT market in Japan is expected to take place in 2014. In the Japan RevitalizationStrategy (June 14 2013 cabinet decision) the government aims for “establishment of guidelines on acquisition
0 Nov. 2010
Mar. 2011
Mar. 2012
Sep. 2012
Oct. 2012
Apr. 2013
Jul. 2013
Oct. 2013
Dec. 2013
Strategy (June 14, 2013 cabinet decision) the government aims for establishment of guidelines on acquisitionof and investment in properties such as senior housing along with promotion and awareness-raising activitiesand other efforts (during the next fiscal year) toward putting healthcare REITs to use to employ private-sectorfunds,” and progress is being made on the development of an environment conducive to the establishment ofhealthcare REITs. In February 2014 the Ministry of Land, Infrastructure, Transport and Tourism released theDraft Guidelines on the Use of Healthcare REITs (“draft” hereinafter). The final guidelines are expected to bedeveloped during fiscal 2014, based on this draft. Facilities to be acquired by healthcare REITs are specified asserviced senior housing and private nursing homes, while other facilities such as hospitals will be consideredseparately Thus it would appear that the first healthcare REITs will be those targeting investment in seniorseparately. Thus it would appear that the first healthcare REITs will be those targeting investment in seniorhealthcare.The draft’s content also includes (i) the organizational structure that should be developed in asset managementfirms and (ii) matters that should be given particular attention when trading in healthcare facilities. On the firstof these, the draft calls for measures such as assignment of key staff having a certain degree of experience orgetting advice from outside experts as well as assignment of outside experts to investment committees, so thatit appears that healthcare REITs are supposed to take steps such as concluding advisory contracts withspecialized consultants and other experts. On the second point, the draft calls for giving consideration to
d id i i h b ildi f l i f i h d i i hoperators and residents, mentioning the building of relations of trust with operators and ascertaining the statusof operations, collection and disclosure of information, and matters on which consideration should be given tousers.Regarding the collection and disclosure of information, readers are encouraged to refer to the interim summaryof the Business Committee on Use of REITs to Promote the Supply of Healthcare Facilities (total of four times,
【Fig.7】Contents of information disclosed from theoperators of health care facilities to REITs
“Business Committee” hereinafter), releasedlast year by the Association for Real EstateSecuritization This Business Committee p
1.Grasp, confirmation such as a right, the physical situation of target facilities
2.Cash Flow Analysis
ⅰ.Grasp of facilities composition, the offer service
ⅱ.Gasp of the income and expenditure situation
ⅲ.Grasp of the resident situation
3.Business evaluation
ⅰ.Grasp of marketing skill
Securitization. This Business Committeemainly ascertained the current state ofinformation disclosure, summarized relatedissues, and studied measures and other matters.The interim summary describes three flows ofinformation disclosure: disclosure ofinformation (i) from healthcare facilityoperators to REITs, (ii) from REITs toinvestors and (iii) from healthcare facility
4Source: Practitioner examination Committee about the good use
of REIT for health care facilities promotion
ⅱ.Grasp of the staff system
ⅲ.Grasp of the nursing care condition, compliance
ⅳ.Grasp of the f inancing situation of an operator,
the lease contract guarantorⅴ.Grasp of system for understanding of resident
opinion and the third party evaluation
investors, and (iii) from healthcare facilityoperators to residents. It discusses disclosureof information from operators to REITs inparticular detail (see Fig. 7). The reason forthis would appear to be because although asoperational assets the assessment of the

Hot Topic
business value of the healthcare facilities would account for a heavy weight in asset valuation, there are strongconcerns about disclosure of information from operators to REITs. The interim summary notes on this pointthat in some aspects healthcare REITs have a preexisting image that differs from reality, such as the beliefs thatoperators would face heavier disclosure burdens when using REITs and that their business expertise could beleaked externally. It argues for the importance of ensuring a thorough and widespread understanding of thebenefits of using REITs in addition to overcoming this image in order to encourage operators to use REITsbenefits of using REITs in addition to overcoming this image in order to encourage operators to use REITs.Japan, where the elderly population is increasing rapidly, suffers a constant shortage of senior health facilities.For this reason, the government is encouraging acceleration of the supply of senior health facilities, and thecreation of healthcare REITs probably can be described as a socially significant development. While they doinvolve many issues that result from their distinctive character as assets, with the backing of the governmentthese issues are in the process of being sorted out and it is expected that the first healthcare REITs finally willappear during 2014. With the birth of specialized healthcare REITs, healthcare facilities are likely to becomerecognized clearly as one criterion in REIT investment. This can be expected to result in developments such asi d li idi d i d fi i i ll Th bi h f h l h REIT l i lik lincreased liquidity and an improved financing environment as well. The birth of healthcare REITs also is likelyto be connected to subsequent market growth.
5

Market View
【Hallmarks of the J-REIT market】It would appear that J-REITs were the buyers in over 50% of commercial real estate transactions (by value) inJapan in 2013 As such trends in the J REIT market have considerable impact on trends in the Japan’s
MarketMarket ViewView
Japan in 2013. As such, trends in the J-REIT market have considerable impact on trends in the Japan scommercial real estate market. Accordingly, the following is a consideration of what affects the J-REITmarket, in examining the outlook for the J-REIT market, which today has become a very important part of thecommercial real estate market. It will look at relationships with trends in the stock market, trends in the USREIT market, and trends in long-term interest rates.
Strong correlation overall to Japanese stocksFigs.8 and 9 show the TSE REIT index, TOPIX, and 10-year JGB yields, along with the US REIT index. Whilein general the TSE REIT index and TOPIX move in similar ways, at times their correlation is weak. Forexample, in 2004 Japanese stock markets were sluggish while J-REITs were strong. In contrast, the stockmarket rose rapidly in 2005 while the J-REIT market remained at a standstill. Then, from H2 2006 through H12007 the J-REIT market rose rapidly while Japanese stock markets remained largely unchanged. Movements inthe J-REIT market in 2007 more closely resembled those in the US REIT market. In recent years, the J-REITmarket began to rise in mid-2012 but Japanese stocks only began to show signs of movement at the end of
0.00 3,000 (%)
TSE REIT IndexTOPIX
2012. In addition, the rapid rise and fall of the J-REIT market in H1 2013 more closely resembled themovements of long-term JGBs than Japanese stocks.
【Fig.8】TSE REIT Index and Key Asset indices
C ffi i tJ-REIT
J-REITJ-REIT
【Fig.9】Correlation Between J-REIT and Key Assets
0.50
1.00
1 501,000
1,500
2,000
2,500 TOPIX10-year JGB yield
CoefficientCorrelation
vs. Japanese
Equity
J REITvs.
US-REIT
vs. Long-termBond Yield
2003 0.57 0.79 0.42
2004 0.26 0.68 0.21
(RHS, inverse scale)
1.50
2.00 0
500 2005 0.27 0.78 -0.22
2006 0.20 0.74 -0.09
2007 0.82 0.68 0.48
2008 0.95 0.84 0.20 700
800
2 500
3,000
TSE REIT Index (LHS)
2009 0.84 0.50 0.13
2010 0.17 0.63 -0.06
2011 0.91 0.50 0.83
2012 0 27 0 64 -0 61300
400
500
600
700
500
1,000
1,500
2,000
2,500 US REIT Index (RHS)
6Source: Kenedix prepared based on Bloomberg
Note: J-REIT=TSE REIT Index, Japanese Equity=TOPIX, US-REIT=FTSE NAREIT Equity REIT Price Index,Long-term Bond Yield= JGB 10 years Yield
Source: Kenedix prepared based on Bloomberg
2012 0.27 0.64 -0.61
2013 0.59 0.37 -0.68 100
200
(500)
0

Market View
Reasons behind the weakening correlation to Japanese stocksA look at correlation coefficients between the J-REIT market and other markets shows that throughout the entire period (that of 10 years and 10 months from March 2003 through January 2014) the coefficient with Japanese stocks was 0.92, that with the US REIT market 0.68, and that with domestic long-term interest rates 0.49. Clearly the strongest correlation is with Japanese stocks. However, from 2003 through 2006 the correlation coefficient with Japanese stocks stayed within the range 0.20-0.57, and the J-REIT market showed a higher correlation with the US REIT market. (Over the four-year period 2003-2006 the correlation coefficient of the J-REIT market with Japanese stocks was 0.87, that with the US REIT market 0.95, and that with domestic long-term interest rates 0.63.) In addition, the correlation with long-term interest rates was positive at times and negative at others, so that overall that correlation coefficient was low.The J-REIT market showed strong correlation to Japanese stocks in the years 2007, 2008, 2009, and 2011. With the exception of 2007, these were years of falling markets, so that it would appear to be difficult for the J-REIT market alone to post increases while the stock market is sluggish. In contrast, the J-REIT market showed weak correlation to Japanese stocks in the years 2004, 2005, 2006, 2010, and 2012. In 2004, Japanese stocks remained largely unchanged while the J-REIT index rose. In H1 2005 the J-REIT index rose, while in H2 of that year Japanese stocks rose. It appears that the lowest correlation coefficient observed in 2010 resulted from the fact that Japanese stocks were falling while the J-REIT index was rising from summer through autumn of that year. During each of these periods, the J-REIT index and the US REIT index showed relatively high correlation, with correlation coefficients of 0.68 in 2004, 0.78 in 2005, 0.74 in 2006, 0.63 in 2010, and 0.64 in 2012. From the above review of correlation coefficients, one probably could describe the J-REIT market as b i l t d t th J t k k t i l b t h i t l ti t th US REITbeing correlated to the Japanese stock market in general but showing a stronger correlation to the US REIT market at times.It also should be noted that there was a clear negative correlation to long-term interest rates in 2012 and 2013. While the correlation between long-term interest rates and the J-REIT market is positive at some times and negative at others, it was negatively correlated in 2012 and 2013. During the previous real-estate market recovery, the correlation was negative in 2005 and 2006, and in 2007 the two markets showed a positive correlation of medium strength. This probably is because rising interest rates at the start of an economic
h th l t ti f i i NOI J REIT t ib t t i d t I thirecovery, when there are no clear expectations of rising NOI on J-REITs, contribute to increased costs. In this sense, whether 2014 performance will be impacted by trends in long-term interest rates or will be more strongly correlated to the stock market probably will depend on whether the market can expect rising NOI, or in other words whether it can factor in rising office rents.
7

Real Estate Investment Market
Commercial Property TransactionTrading volume remains at record highsTrading in commercial real estate in Q4 2013rose by 41% QoQ and 46% YoY toapproximately JPY 961 billion. Whiletransaction volume had decreased somewhat inQ3, it rebounded in Q4 to just under JPY 1trillion again J-REIT capital increases through 300%
400%
500%
800
1,000
1,200 (JPY in bn)
Transaction volume (LHS) % change YoY (RHS)
trillion again. J-REIT capital increases throughpublic offering of shares totaled 12 in numberand approximately JPY 270 billion in value,including the newly listed AEON REITInvestment Corporation (which raised JPY 95.8billion in funds), and the value of propertiespurchased increased again as well. The totalprice of properties purchased by J-REITsexceeded JPY 600 billion while the full year -100%
0%
100%
200%
0
200
400
600
Property Transaction by J-REITsSource: DTZ
exceeded JPY 600 billion, while the full-yearfigure for 2013 eclipsed the previous peak in2006 to set a record high at JPY 2.2 trillion.Transactions between sponsor firms and J-REITs stand outQ4 2013 saw a succession of large-scale deals.The largest was a transaction on trust beneficiaryinterests in the Times Square Building at the
-100%0
09Q
109
Q2
09Q
309
Q4
10Q
110
Q2
10Q
310
Q4
11Q
111
Q2
11Q
311
Q4
12Q
112
Q2
12Q
312
Q4
13Q
113
Q2
13Q
313
Q4
800(JPY in bn)
q gsouth entrance to Shinjuku Station. The seller ofthis property, Tokyu Land Corporation, has alsopurchased Ebisu Prime Square. Majordevelopers appear to be making some activemoves. In addition, there were a large number oftransactions between sponsor firms and J-REITs.It seems that the environment for fund-raising byJ-REITs is a good one and that sponsor firms too 200
400
600Aquisition Disposition
Significant Deals
Source: Prepared by Kenedix based on disclosed data by J-REITs
J REITs is a good one and that sponsor firms toohave strong demand for funds. This also mayreflect the fact that it is becoming more difficultto purchase properties from third parties otherthan sponsor firms, as competition to acquireproperties gradually appears to overheat.
0
200
Q1 Q2 Q3 Q4 Q1 Q2 Q3 Q4 Q1 Q2 Q3 Q4 Q1 Q2 Q3 Q4 Q1 Q2 Q3 Q4
2009 2010 2011 2012 2013
Name Asset Type Buyer Prefecture Price (¥bn) GFS
(sqm)Date
Times Square Retail Takashimaya Tokyo 1,050 101,855 Dec-13
Logi Port Nagareyama and other 5 properties Logistics Domestic Institutional investor
and TOSEI and others Chiba 740 161,771 Oct-13
Ebis Prime Square Office SPC made by Tokyu Land Tokyo 500 68 995 Dec-13
Significant Deals
Ebis Prime Square Office SPC made by Tokyu Land Tokyo 500 68,995 Dec 13
J Tower Office SIA REIT Tokyo 244 53,686 Oct-13
Yokohama Blue Avenue Office Merchant Capital K.K. Kanagawa 236 50,242 Dec-13
Kobe Kyu-Kyoryuchi 25 bankan Hotel Activia Properties inc. Hyogo 213 27,011 Nov-13
Aeon Late Town Mori Retail Aeon REIT Saitama 212 64,155 Nov-13
Prologis Park Osaka 4 Logistics Nippon Prologis REIT Osaka 210 120,562 Nov-13
Hyulic Kamiya-cho Bldg. Office Hulic REIT Tokyo 201 15,902 Feb-14y y g y ,
Quintets Nagoya Bldg. Office Towa Real Estate Aichi 184 27,152 Nov-13
GLP Urayasu Ⅲ Logistics GLP J-REIT Chiba 182 66,669 Mar-14
Aeon Mall Kurashiki Retail Aeon REIT Okayama 179 157,275 Nov-13
Queen's Tower A Office Japan Real Kanagawa 172 57,837 Jan-14
Aeon Mall Mitouchihara Retail Aeon REIT Ibaraki 165 159,997 Nov-13Source: Prepared by Kenedix based on Nikkei Real Estate Market Report, other news report
8

J-REIT Market
250
300
350 TOPIX TSE REIT TOPIX Real Estate index
J-REIT Index & Stock Market Index (2012=100)Marked underperformance of the TSE RealEstate Index since the start of 2014The TSE REIT Index rose by 15.8% fromSeptember 2013 to February 2014. Over thisperiod, TOPIX rose by 9.5% while the TSE RealEstate Index fell by 4.0%. A look at markets inthe period September-December 2013 shows
50
100
150
200
01/12 04/12 07/12 10/12 01/13 04/13 07/13 10/13 01/14Source: Bloomberg (As of 28th February 2013)
the period September December 2013 showsgenerally strong performance with the TSE RealEstate Index outperforming the others somewhat:the TSE REIT Index rose by 16.6%, TOPIX by17.7%, and the TSE Real Estate Index by 20.7%.However, since the start of 2014 some gaps havearisen between the movements of these indices.While the TSE REIT Index has remained largelyunchanged at 0 7% TOPIX fell by 7 0% and the
6
8 (%)
TSE REIT Dividend Yield JGB 10 Yeild Yield Gap
Sou ce oo be g ( s o 8t eb ua y 0 3)
Yield Spreadunchanged at -0.7%, TOPIX fell by 7.0% and theTSE Real Estate Index dropped substantially by20.5%.The yield spread has started to grow againWhile the yield gap had decreased by 18 bp inSeptember-December 2013, in January-February2014 it has increased by 35 bp. Over this period,the yield on 10-year JGBs generally showed a
0
2
4
01/12 05/12 09/12 01/13 05/13 09/13 01/14Source: Bloomberg (As of 28th February 2013)
y y g ydecreasing trend. At the same time, the yield onJ-REIT dividends fell by more than the yield on10-year JGBs in September-December, shrinkingthe yield spread. However, since the start of 2014dividend yields have increased amid soft shareprices, and the yield spread has increased.Strong Retail/logistics, and office indicesWhil h TSE REIT I d b 15 8% f
160
180
200
220REIT Office Index
REIT Residential Index
REIT Ret&Logi Index
J-REIT Index by Asset Class (Feb. 2012=100)g ( y )
While the TSE REIT Index rose by 15.8% fromSeptember 2013 to February 2014, share pricesfor retail and logistics facilities remained strong,with increases of 14.9% in the office index,12.6% in the residential index, and 18.7% in theretail/logistics index. Although all asset typesgenerally showed steady growth in September-December 2013 (with the office index up 16.9%,
80
100
120
140
02/12 05/12 08/12 11/12 02/13 05/13 08/13 11/13 02/14Source: Bloomberg (As of 28th February 2014)
the residential index up 14.3%, and theretail/logistics index up 17.2%), they have beensoft since the start of 2014. Still, the extent of thedecrease in the retail/logistics index is relativelysmall, and it has maintained positive performancein January-February.The strength of the UK and US markets standsout
110
120
130
140
150
160JPN US UK
AU Singapore
Key Country REIT Index (Jan. 2012=100)outThe REIT indices in leading markets show variedresults. The UK and US REIT indices generallyare strong, with the UK REIT index rising by25.3% and the US REIT index by 11.7% fromSeptember 2013 to February 2014. The JapanREIT index also showed strong performance,rising by 15.8%. At the same time, growth in theREIT i di i Si d A t li
60
70
80
90
100
110
01/11 05/11 09/11 01/12 05/12 09/12 01/13 05/13
9
REIT indices in Singapore and Australia wasweak, with the former rising by just 2.1% and thelatter by 1.3%.
Source: Bloomberg (As of 28th February 2014)

Office market : Tokyo
6
8
10
15
20
25 (%)(thousand yen / tsubo)
Vacancy Rate & Asking Rent RateAmid a scarcity of new supply, vacancies aredecreasing graduallyThe average vacancy rate in the five central wards ofTokyo at the end of February 2014 stood at 7.01%,down 0.17% points from the previous month (MikiShoji). Also at the end of February, vacancies haddropped below 500 000 tsubo and new demand can
0
2
4
0
5
10
02 03 04 05 06 07 08 09 10 11 12 13 14
Asking Rent Rate (LHS)
Vacancy Rate (RHS)
Note: Tokyo Business area (chiyoda-ku, chuo-ku, Minato-ku, Shinjuku-ku, Shibuya-ku)
dropped below 500,000 tsubo, and new demand canbe described as strong. The last time vacancies fellbelow 500,000 tsubo was four years and sevenmonths ago. The vacancy rate in new buildings is up5.23% point from the previous month to 19.65%.This appears mainly to be the result of buildingsoperating at full occupancy moving to the category ofexisting buildings at the point one year aftercompletion of their construction and the fact that
Vacancy Rate of Newly Built Bldg & Existing BldgSource: Miki Shoji Co., ltd. (Monthly, As of February 2013)completion of their construction and the fact that
some large-scale buildings were completed withvacancies remaining. However, while KyobashiTrust Tower (total floor space 15,730 sqm)completed in February still had some vacanciesremaining as of the end of February, it appears thatthe building is receiving numerous inquiries and thatabout 90% of its tenants have been decided oninformally (Nikkei Real Estate Market Report) On
6
8
10
30
40
50 (%)(%)Newly Built Bldg (LHS) Existing Bldg (RHS)
Note: Tokyo Business area (chiyoda-ku, chuo-ku, Minato-ku, Shinjuku-ku, Shibuya-ku)
informally (Nikkei Real Estate Market Report). Onthe other hand, the vacancy rate in existing buildingshas fallen by 0.24% points from the previous monthto the 6% level at 6.80%, as vacancies decreasesteadily in existing buildings as well.Contracted rents are in an increasing trendWhile the increase in average asking rents is small atjust 0.05% vs. the previous month, this is the second
0
2
4
0
10
20
02 03 04 05 06 07 08 09 10 11 12 13 14
8%
10%
12%
40
50
60 (thousand yen / tsubo)
Average Assumed Achievable Rent (LHS) Vacancy Rate (RHS)
Vacancy Rate & Asking Rent Rate for Grade A
y ( y j y )Source: Miki Shoji Co., ltd. (Monthly, As of February 2013)
just 0.05% vs. the previous month, this is the secondconsecutive month in which these rents haveincreased (Miki Shoji). On the other hand, averageasking rents in new buildings are up 1.0% from theprevious month, for six consecutive months ofincreases. While growth in contracted rents issomewhat sluggish following major increases in H12013, the upward trend continues. Contracted rents inclass-A buildings are up 4 2% from the previous
0%
2%
4%
6%
0
10
20
30
05 06 07 08 09 10 11 12 13Source: CBRE (Quarterly, As of December 2013)
class A buildings are up 4.2% from the previousquarter (up 15.8% YoY) to JPY 27,768 (per monthper tsubo) while those in large-scale buildings (withtypical floor areas of 200 tsubo or more) are up 1.5%from the previous quarter (up 16.9% YoY) (Q4 2013,Sanko Estate).The vacancy rate in grade-A office buildings fallsto the 5% level
120
140
160
A class
200 tsubo or more
100-200 tsubo
YoY % change for Actual Rent Rate by building sizeAfter peaking in Q2 2012, the average vacancy ratein grade-A office buildings has decreased steadily to5.5% in February 2014 (CBRE). Assumedachievable rent in grade-A office buildings in Q42013 rose by 0.2% from the previous quarter to JPY30,650, for the fourth consecutive quarter ofincreases.Vacancy rates are likely to continue decreasing
60
80
100
Note: Tokyo 23 wards, Source: CBRE (Quarterly, As of December 2013)
10
Vacancy rates are likely to continue decreasingAs was the case in 2013, the level of new supply isexpected to be relatively low in 2014 as well. Sincethere are signs of steady new demand amid limitedsupply, vacancy rates are expected to trenddownward in the future as well. In addition, there is apossibility of clear increases in rents occurring oncethe stock of vacancies falls to a certain level.

Residential Market
Population in Major Cities
Dec-12 Sep-13 Dec-14 QoQ YoY
Tokyo 13,228,912 13,283,225 13,296,019 0.10% 0.51%
Tokyo 23 ward 9,007,407 9,057,136 9,068,918 0.13% 0.68%
Central 5 wards 927 086 936 772 941 768 0 53% 1 58%
The population inflow into central Tokyo isacceleratingThe inflow of population into central Tokyo isaccelerating. In December 2013 the population ofthe five central wards was up 1.58% YoY to0.941 million (for an increase of 14,000). Thepopulation of Tokyo as a whole rose by 0.51%over the same period The inflow of population to
Occupancy Rate for Rental Apartment (Hold by J-REIT)
in Tokyo 927,086 936,772 941,768 0.53% 1.58%
Nagoya city 2,268,700 2,270,841 2,272,381 0.07% 0.16%
Osaka city 2,678,579 2,683,531 2,683,966 0.02% 0.20%
Fukuoka city 1,495,104 1,505,558 1,509,239 0.24% 0.95%Source: Respective city
over the same period. The inflow of population tothe city of Fukuoka also continues, as that city’spopulation in December 2013 was up 0.95% YoYto 1.509 million. The cities of Osaka and Nagoyaalso showed rates of population growth that weresomewhat high.The occupancy rate in rental apartments inthe greater Tokyo area remains highThe occupancy rate at rental apartments in theThe occupancy rate at rental apartments in thegreater Tokyo area held by major residentialJ-REIT was 95.9% as of the end of January 2014.This reflects an increase of 0.3% points YoY, andthe market can be said to be maintaining its highoccupancy level. In addition, many REITs aremaintaining occupancy rates of 96% or higher,and it is clear that occupancy rates in propertiesheld in J-REIT portfolios are strong overall. The 0.0
2.0
4.0
6.0
92
94
96
98 (%)(%)
Note: Occupancy rate=occupancy area / rentable area, in the greater Tokyo areaSource: Kenedix prepared based on data of major residential REIT (As of January 2014)
YoY % Change for Asking Rent Rate
occupancy rate can be expected to increasefurther with the approach of the period ofincreased demand at the end of the fiscal year.The start of a full-fledged upward trend inrents on rental residencesAsking rents on rental apartments in the greaterTokyo area in January 2014 rose by 0.3% YoY.This was the seventh consecutive month ofi l id i h
-4.0
-2.0
0 0
88
90
9
1/04 1/05 1/06 1/07 1/08 1/09 1/10 1/11 1/12 1/13 1/14
Occupancy Rate (LHS) YoY % change (RHS)
2.0%
4.0%
6.0%Tokyo metropolitan area (1R) Tokyo metropolitan area (FA)Kansai area (1R) Kansai (FA)
YoY % Change for Asking Rent Rate increases, as rents on rental residences in thegreater Tokyo area appear to have begun a full-fledged upward trend. However, while rents inthe 23 wards of Tokyo have shown increases over8 consecutive months, the figure for suburbanTokyo has fallen for 11 consecutive months.Rents also continue to fall in the Kanagawa andSaitama areas, so that the rise in rents on rentalresidences would appear to be centered on the 23
-4.0%
-2.0%
0.0%
1/09 7/09 1/10 7/10 1/11 7/11 1/12 7/12 1/13 7/13 1/14
ppwards of Tokyo. Asking rents on rentalresidences in the Kansai region have been in anincreasing trend for roughly two years or more.Asking rents in the five central wards of Tokyocan be said to be in an increasingly clearupward trendAsking rents on rental apartments in the fivecentral wards of Tokyo rose MoM in all areas of Source: Kenedix prepared based on K.K.IPD Japan “UPD/Recruit Residential
Index”Rent for Rental Apartment (Central 5 Ward in Tokyo) y
those wards. On a YoY basis, only ShinjukuWard saw rents fall. The increase was mostmarked in Shibuya, where asking rents were up4.1% YoY, while other wards showing relativelyhigh rates of increase over the same period wereChiyoda at 2.8%, Minato at 1.8%, and Chuo at1.4%. Asking rents on rental apartments haverisen for 13 consecutive months in ChiyodaWard 11 consecutive months in Minato Ward
Index
14
15
16 (thousand Yen)
11Note: Asking Rent Rate (As of December 2013) Source: Leasing Management Consulting
Ward, 11 consecutive months in Minato Ward,and 7 consecutive months in Chuo Ward, as theupward trend in rents appears to be growingincreasingly pronounced.
12
13
14
01/10 07/10 01/11 07/11 01/12 07/12 01/13 07/13
Chuo-ku Minato-ku Shibuya-kuShinjuku-ku Chiyoda-ku
Logistics / Retail
15%
20%
25%
5.0
6.0
7.0 Asking Rent Rate (LHS)Vacancy Rate for Existing Facility (RHS)Average Vacancy Rate (RHS)
(thousand yen)
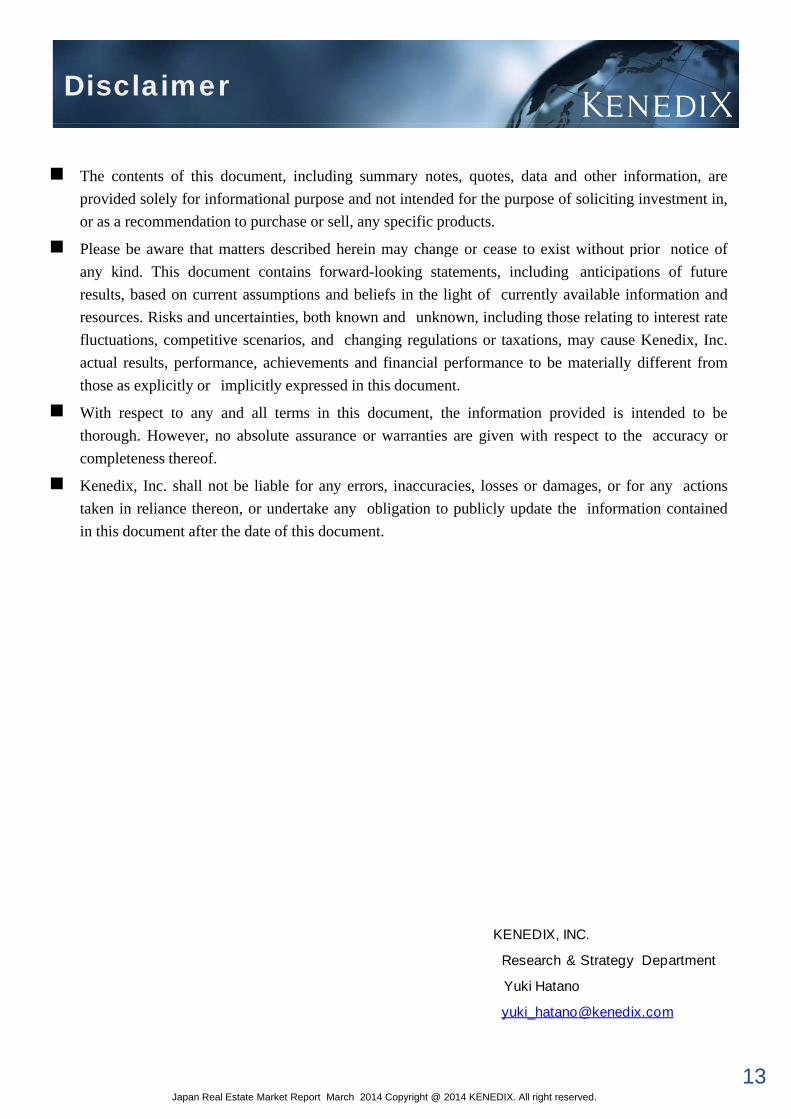
Asking Rent & Vacancy Rate for LogisticsBooming demand fails to result in rising rentsThe vacancy rate in large-scale, multi-tenantlogistic facilities in the greater Tokyo area fellagain by 0.3% points from the previous quarter to4.0% in Q4 2013 (CBRE). While new supply, at366,000 tsubo, has been high for threeconsecutive quarters, new demand is high too at353 000 t b (I hi R l E t t S i )
0%
5%
10%
2.0
3.0
4.0
05 06 07 08 09 10 11 12 13Source: CBRE (Quarterly for Vacancy Rate as of Q4 2013)
353,000 tsubo (Ichigo Real Estate Service).Construction was completed on three new large-scale, multi-tenant facilities, and each appears tobe operating at a high occupancy rate. Boomingdemand from 3PL firms appears to be driving themarket. However, it would appear that thisbooming demand does not result in raising rents.Apparently this is due to 3PL firms’ need to keeptheir costs down in order to secure contracts from Source: CBRE (Quarterly for Vacancy Rate, as of Q4 2013)
Supply-Demand Balance in Tokyo Area for Logisticsshippers (CBRE).Demand is stronger than expectationsNew supply in Q1 2014 is expected to reach arecord high (CBRE). However, since newproperties appear to be successful in securingconfirmed tenants, CBRE has revised downwardits projections for the vacancy rate to the 7%level from the 9% level in the projections made in 300
400
500 (thousand sqm)
New Supply New Demand
S I hi R l E t t S i C Ltd
p jQ3 2013.There is strong appetite for developmentof logistics facilities. For example, on March 10Sumitomo Corporation announced plans withKokyo Tatemono Co., Ltd. to develop logisticsproperties valued at approximately JPY 20 billionper year and form a major logistics fund. At thesame time, there appear to be some cases ofdelays in new development due to the effects ofrising construction costs
0
100
200
40
50
60(thousand yen)
Asking Rent Rate for Retail Property (ground floor)Source: Ichigo Real Estate Service Co, Ltd.rising construction costs.
Asking rents improve in the Ginza,Omotesando, and Shibuya areasA look at asking rents on first-floor retail storesin the leading commercial areas of Tokyo in Q32013 shows increases of more than 20% YoY inthe areas of Ginza (up 22.8% to JPY44,810/tsubo per month), Omotesando (up 24%
10
20
30
Ginza Omotesando ShinjukuShibuya Ikebukuro
Source: BAC Urban Project Co., Ltd. (Quarterly, As of Q3 2013)
to JPY 42,389/tsubo per month), and Shibuya (up38.4% to JPY 40,528/tsubo per month), each ofwhich now is able to maintain rents of JPY40,000 or higher. On the other hand, asking rentson first-floor retail stores plunged by 33.8% toJPY 26,753/tsubo per month in the Shinjuku areaand fell by 7.9% to 31,134/tsubo per month in theIkebukuro area.The effects of the consumption tax increase Source: BAC Urban Project Co., Ltd. (Quarterly, As of Q3 2013)
Retail Sales (YoY % change, 3 months average)The effects of the consumption tax increaseshould be monitoredRetail sales rose in January 2014 for the sixthconsecutive month, by 4.4% YoY. A look at salesby industry shows that sales of durable goods hada strong impact on this figure, with auto sales up21.4% and sales of machinery and appliances up7.5%. Viewed by type of retailer, sales were up2.9% at department stores and existing store 0
5
10 (%)Existing Shopping Center Department Store
Overall Retail Sales
Source: Japan Council of Shopping Centers, Japan Department Stores Association,The Ministry of Economy, Trade and Industry (As of January 2014)
12
2.9% at department stores and existing storesales up 0.4% at shopping centers, probably as aresult of a rush in demand for higher-endproducts before the increase in consumption tax.While consumption trends show improvingtendencies overall, the effects of the consumptiontax increase planned for April 1 should bewatched closely.
-10
-5
0
1/10 7/10 1/11 7/11 1/12 7/12 1/13 7/13 1/14
Disclaimer
The contents of this document, including summary notes, quotes, data and other information, areprovided solely for informational purpose and not intended for the purpose of soliciting investment in,or as a recommendation to purchase or sell, any specific products.
Please be aware that matters described herein may change or cease to exist without prior notice ofPlease be aware that matters described herein may change or cease to exist without prior notice ofany kind. This document contains forward-looking statements, including anticipations of futureresults, based on current assumptions and beliefs in the light of currently available information andresources. Risks and uncertainties, both known and unknown, including those relating to interest ratefluctuations, competitive scenarios, and changing regulations or taxations, may cause Kenedix, Inc.actual results, performance, achievements and financial performance to be materially different fromthose as explicitly or implicitly expressed in this document.
With respect to any and all terms in this document, the information provided is intended to bethorough. However, no absolute assurance or warranties are given with respect to the accuracy orcompleteness thereof.
Kenedix, Inc. shall not be liable for any errors, inaccuracies, losses or damages, or for any actionstaken in reliance thereon, or undertake any obligation to publicly update the information containedin this document after the date of this document.
KENEDIX, INC.
Research & Strategy Department
Yuki Hatano
13Japan Real Estate Market Report March 2014 Copyright @ 2014 KENEDIX. All right reserved.