Embed Size (px)
Citation preview
Kent Governors’ AssociationCounty Briefing 20 October 2014
Patrick Leeson
Corporate Director
Education and Young People’s Services
2014 Performance in Kent
• Improvements at EYFS, Key Stage 1 and 2 standards of education
• More volatile at GCSE and A Level• Above national average at EYFS, KS1 and GCSE
and in line at KS2 and A Level.• Most of Kent’s performance is improving as it
is nationally and for our statistical neighbours• Achievement gaps are narrowing
Early Years Foundation Stage
• Good Level of development in 2014 – 69%.
• This is a significant increase of 6% compared to 2013.
• FSM achievement gap reduced to 12 % from 18% in 2013
• Kent continues to be in the top 5% of LAs for EYFS performance
Key Stage 1• Level 2b+ Reading – 82%. This is above the National Average of
80.6% and is a 3% improvement on 2013
• Level 2b+ Writing – 70%. This is in line with the National Average of 70% and is a 3 % improvement on 2013
• Level 2b+ Maths – 82%. This is above the National Average of 80% and is a 3% improvement on 2013.
• Key Stage 1 is above or in line with National Average on every indicator
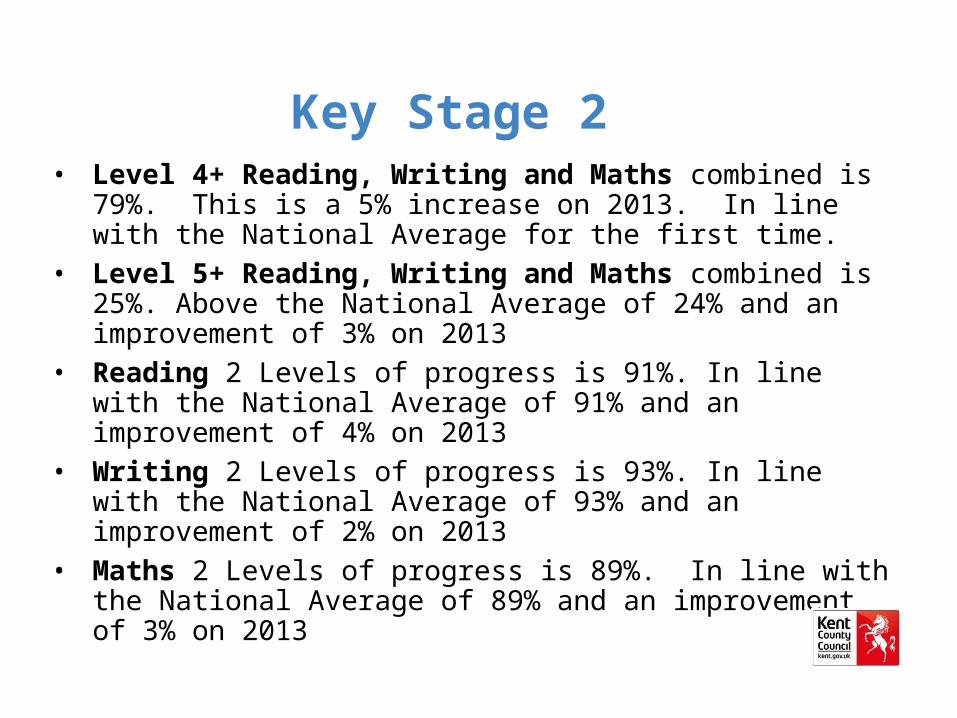
Key Stage 2• Level 4+ Reading, Writing and Maths combined is 79%. This
is a 5% increase on 2013. In line with the National Average for the first time.
• Level 5+ Reading, Writing and Maths combined is 25%. Above the National Average of 24% and an improvement of 3% on 2013
• Reading 2 Levels of progress is 91%. In line with the National Average of 91% and an improvement of 4% on 2013
• Writing 2 Levels of progress is 93%. In line with the National Average of 93% and an improvement of 2% on 2013
• Maths 2 Levels of progress is 89%. In line with the National Average of 89% and an improvement of 3% on 2013
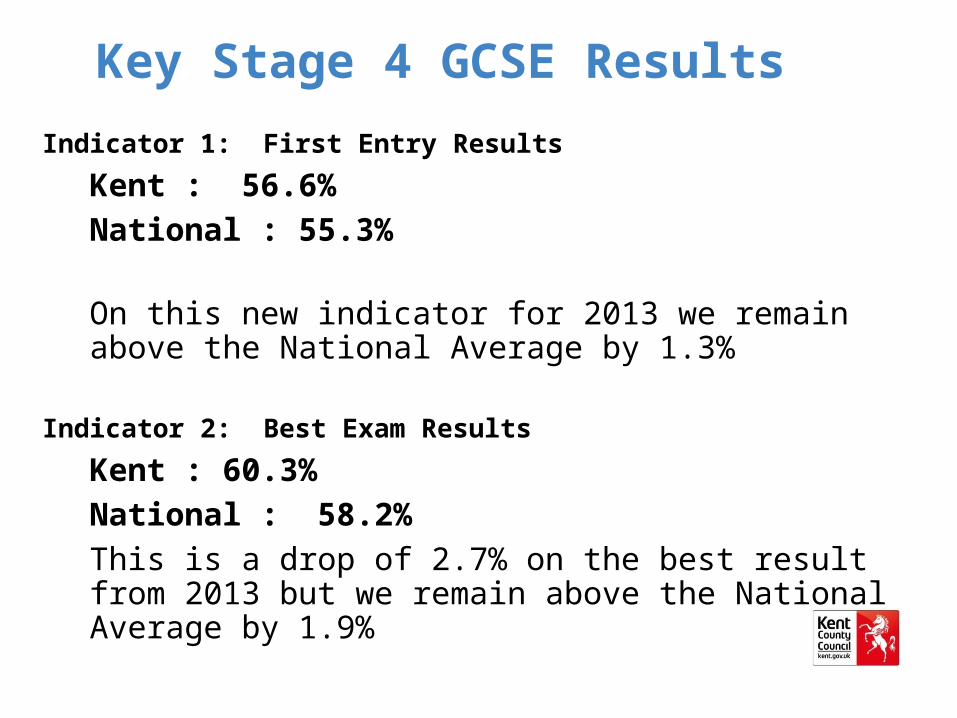
Key Stage 4 GCSE Results
Indicator 1: First Entry Results
Kent : 56.6%National : 55.3%
On this new indicator for 2013 we remain above the National Average by 1.3%
Indicator 2: Best Exam Results
Kent : 60.3%National : 58.2%This is a drop of 2.7% on the best result from 2013 but we remain above the National Average by 1.9%
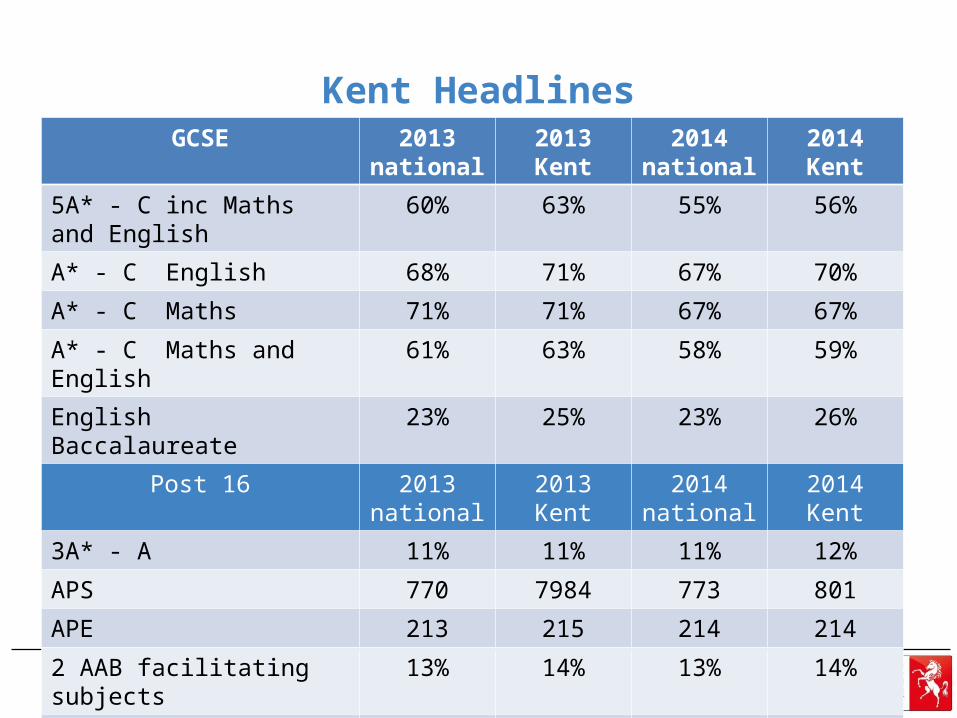
Kent HeadlinesGCSE 2013
national2013Kent
2014national
2014Kent
5A* - C inc Maths and English 60% 63% 55% 56%
A* - C English 68% 71% 67% 70%
A* - C Maths 71% 71% 67% 67%
A* - C Maths and English 61% 63% 58% 59%
English Baccalaureate 23% 25% 23% 26%
Post 16 2013national
2013Kent
2014national
2014Kent
3A* - A 11% 11% 11% 12%
APS 770 7984 773 801
APE 213 215 214 214
2 AAB facilitating subjects 13% 14% 13% 14%
3 AAB facilitating subjects 8% 8% 8% 8%
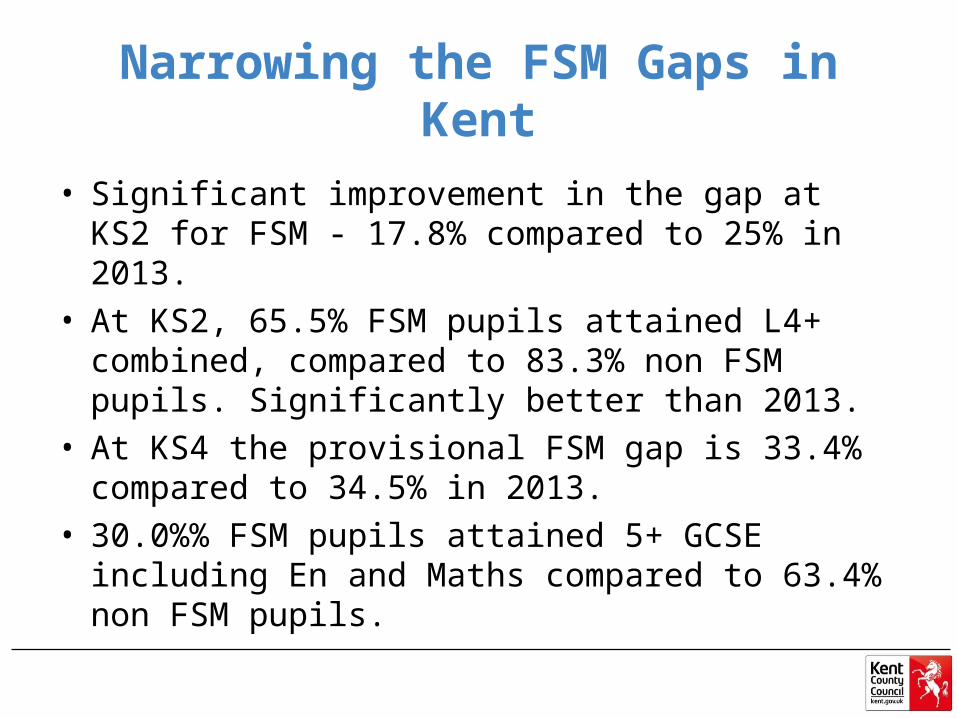
Narrowing the FSM Gaps in Kent
• Significant improvement in the gap at KS2 for FSM - 17.8% compared to 25% in 2013.
• At KS2, 65.5% FSM pupils attained L4+ combined, compared to 83.3% non FSM pupils. Significantly better than 2013.
• At KS4 the provisional FSM gap is 33.4% compared to 34.5% in 2013.
• 30.0%% FSM pupils attained 5+ GCSE including En and Maths compared to 63.4% non FSM pupils.
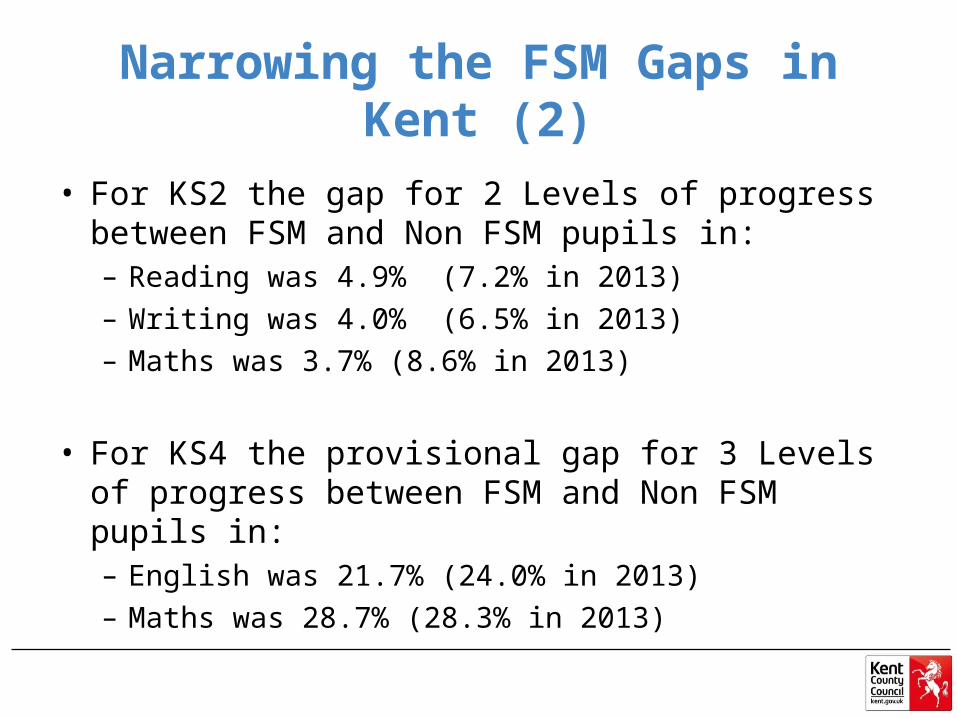
Narrowing the FSM Gaps in Kent (2)
• For KS2 the gap for 2 Levels of progress between FSM and Non FSM pupils in:– Reading was 4.9% (7.2% in 2013)– Writing was 4.0% (6.5% in 2013)– Maths was 3.7% (8.6% in 2013)
• For KS4 the provisional gap for 3 Levels of progress between FSM and Non FSM pupils in:– English was 21.7% (24.0% in 2013)– Maths was 28.7% (28.3% in 2013)
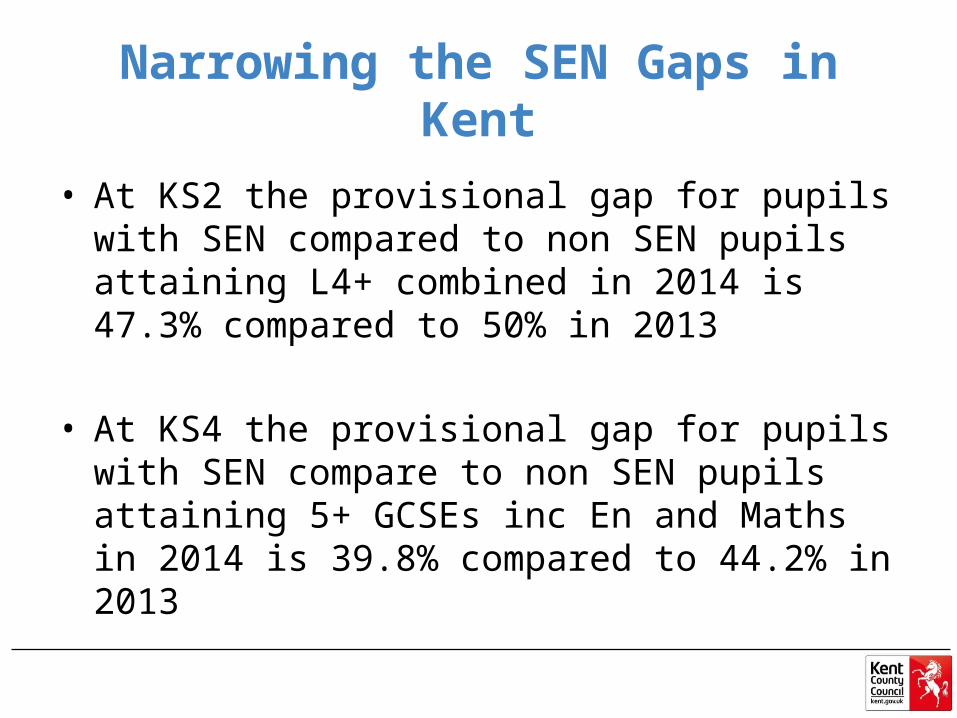
Narrowing the SEN Gaps in Kent
• At KS2 the provisional gap for pupils with SEN compared to non SEN pupils attaining L4+ combined in 2014 is 47.3% compared to 50% in 2013
• At KS4 the provisional gap for pupils with SEN compare to non SEN pupils attaining 5+ GCSEs inc En and Maths in 2014 is 39.8% compared to 44.2% in 2013
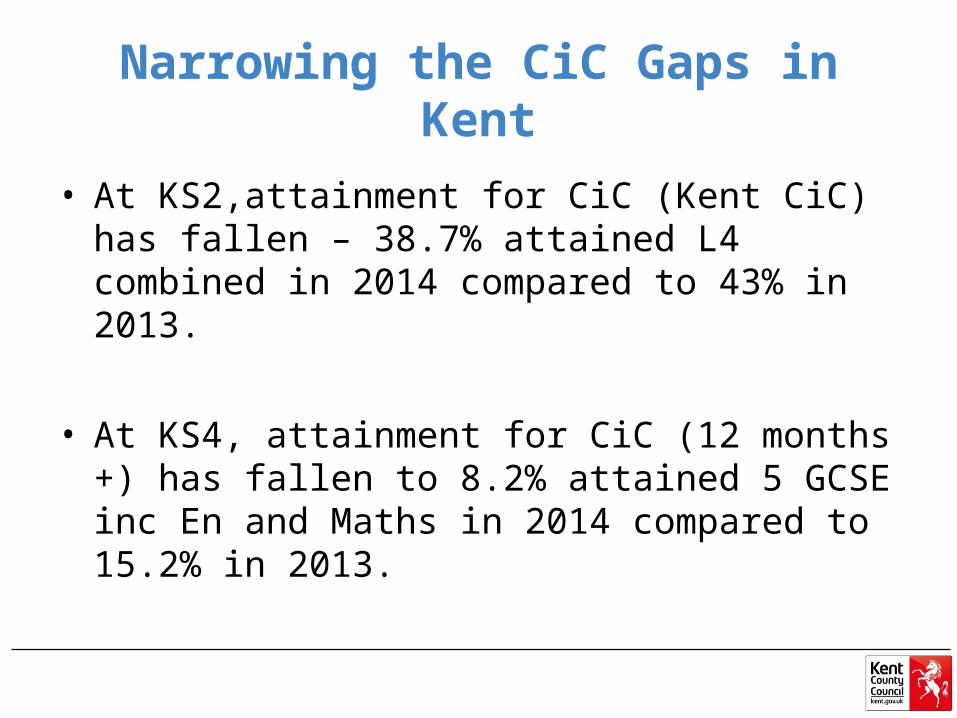
Narrowing the CiC Gaps in Kent
• At KS2,attainment for CiC (Kent CiC) has fallen – 38.7% attained L4 combined in 2014 compared to 43% in 2013.
• At KS4, attainment for CiC (12 months +) has fallen to 8.2% attained 5 GCSE inc En and Maths in 2014 compared to 15.2% in 2013.
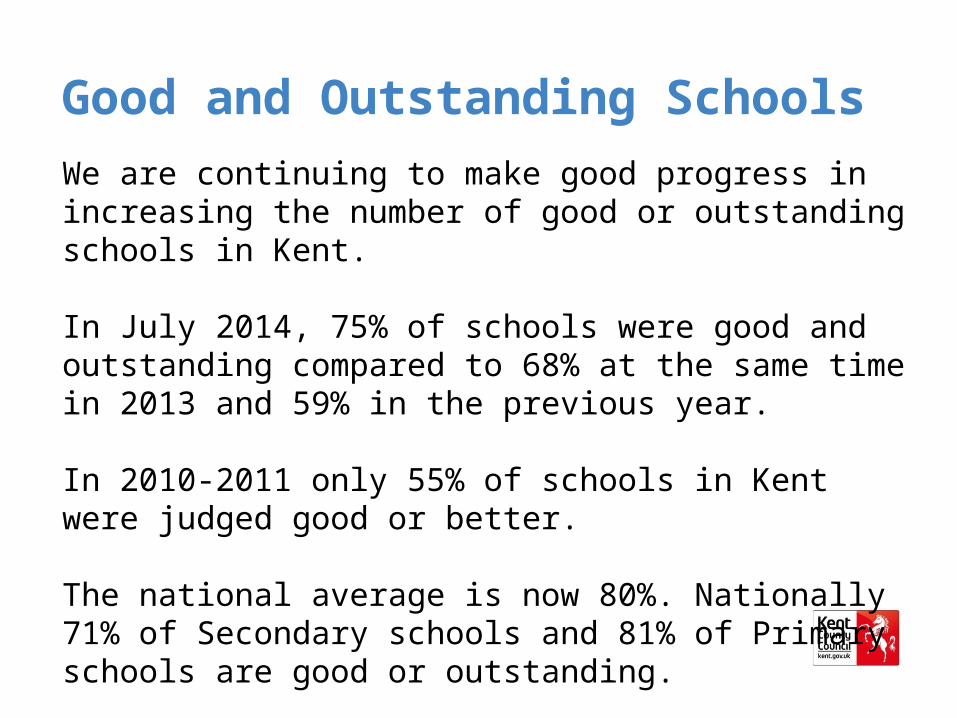
Good and Outstanding Schools
We are continuing to make good progress in increasing the number of good or outstanding schools in Kent.
In July 2014, 75% of schools were good and outstanding compared to 68% at the same time in 2013 and 59% in the previous year.
In 2010-2011 only 55% of schools in Kent were judged good or better.
The national average is now 80%. Nationally 71% of Secondary schools and 81% of Primary schools are good or outstanding.
Good and Outstanding Schools
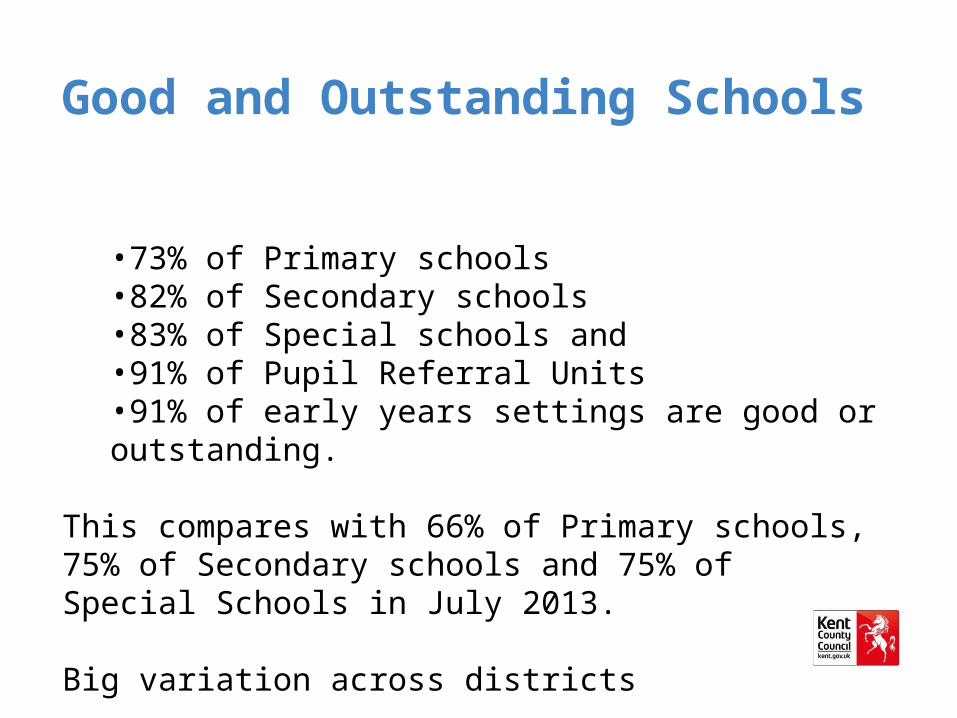
•73% of Primary schools •82% of Secondary schools•83% of Special schools and •91% of Pupil Referral Units•91% of early years settings are good or outstanding.
This compares with 66% of Primary schools, 75% of Secondary schools and 75% of Special Schools in July 2013.
Big variation across districts
Good and Outstanding Schools
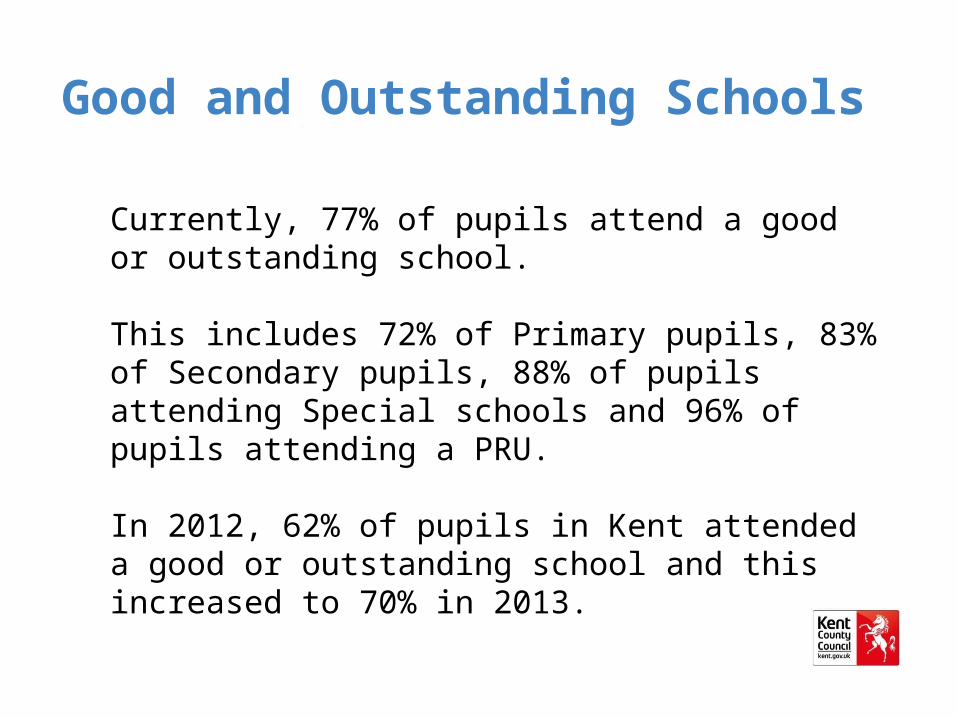
Currently, 77% of pupils attend a good or outstanding school.
This includes 72% of Primary pupils, 83% of Secondary pupils, 88% of pupils attending Special schools and 96% of pupils attending a PRU.
In 2012, 62% of pupils in Kent attended a good or outstanding school and this increased to 70% in 2013.
Good and Outstanding Schools
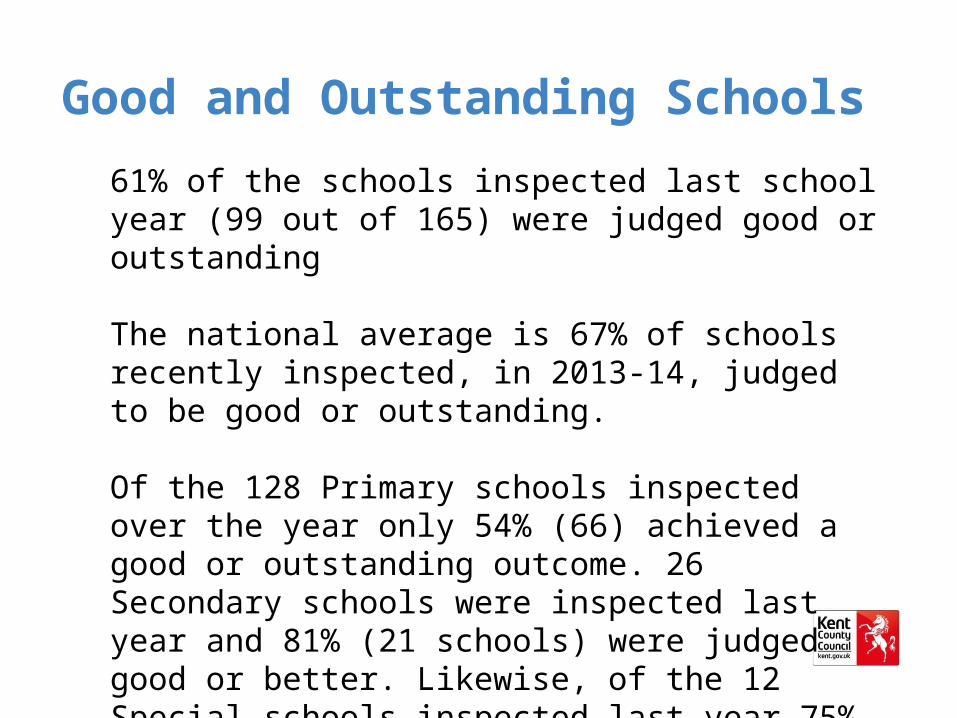
61% of the schools inspected last school year (99 out of 165) were judged good or outstanding
The national average is 67% of schools recently inspected, in 2013-14, judged to be good or outstanding.
Of the 128 Primary schools inspected over the year only 54% (66) achieved a good or outstanding outcome. 26 Secondary schools were inspected last year and 81% (21 schools) were judged good or better. Likewise, of the 12 Special schools inspected last year 75% (9 schools) got a good or outstanding judgement.
New Developments for School Collaborations
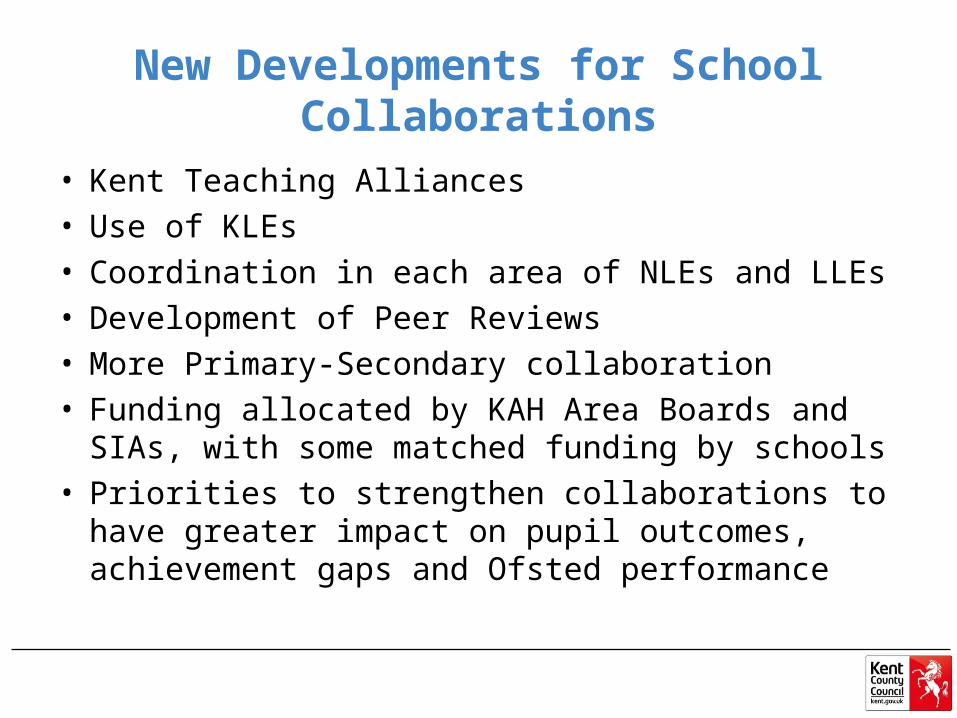
• Kent Teaching Alliances
• Use of KLEs
• Coordination in each area of NLEs and LLEs
• Development of Peer Reviews
• More Primary-Secondary collaboration
• Funding allocated by KAH Area Boards and SIAs, with some matched funding by schools
• Priorities to strengthen collaborations to have greater impact on pupil outcomes, achievement gaps and Ofsted performance
Priorities for the Year Ahead
• Implement and support SEND reforms, including further development of the LIFT process
• Support schools in delivering the new NC and assessment arrangements
• Develop closer working between Early Years settings, Children’s Centres and schools
• Continue to develop more coherent 14-19 offer including making best use of new qualifications and performance measures
• Deliver new Health Needs Service
Priorities for the Year Ahead
• Implement an effective Early Help and Preventative Service which supports schools, children and families and reduces levels of need
• Deliver 7 new Primary schools, 29 new forms of entry, 195 Reception places, 90 places in Years 1-5, and 60 new Year 7 places
• Work in more coordinated way with priority schools
• Continue to work with and support the development of the Kent Association of Headteachers