Embed Size (px)
DESCRIPTION
Kentucky and Transportation. Kentucky's infrastructure supports businesses by supporting transportation: Within the State Into the State From the State Through the State. Total Freight Transportation in Kentucky - 2008. Tons (in millions). Dollars (in millions). - PowerPoint PPT Presentation
Citation preview
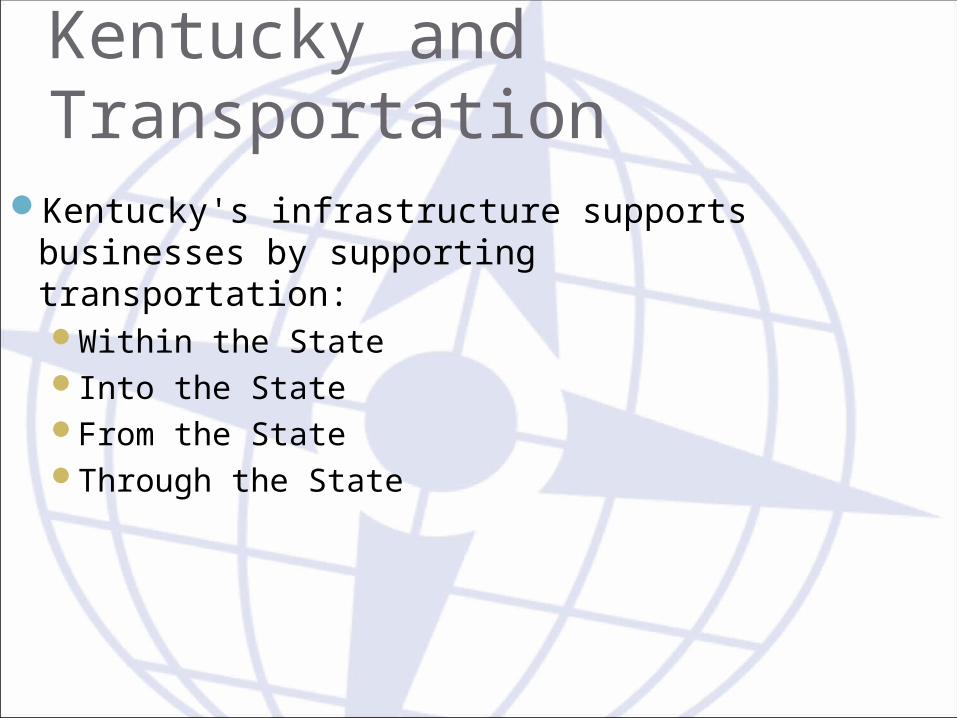
Kentucky and TransportationKentucky's infrastructure supports
businesses by supporting transportation:Within the StateInto the StateFrom the StateThrough the State
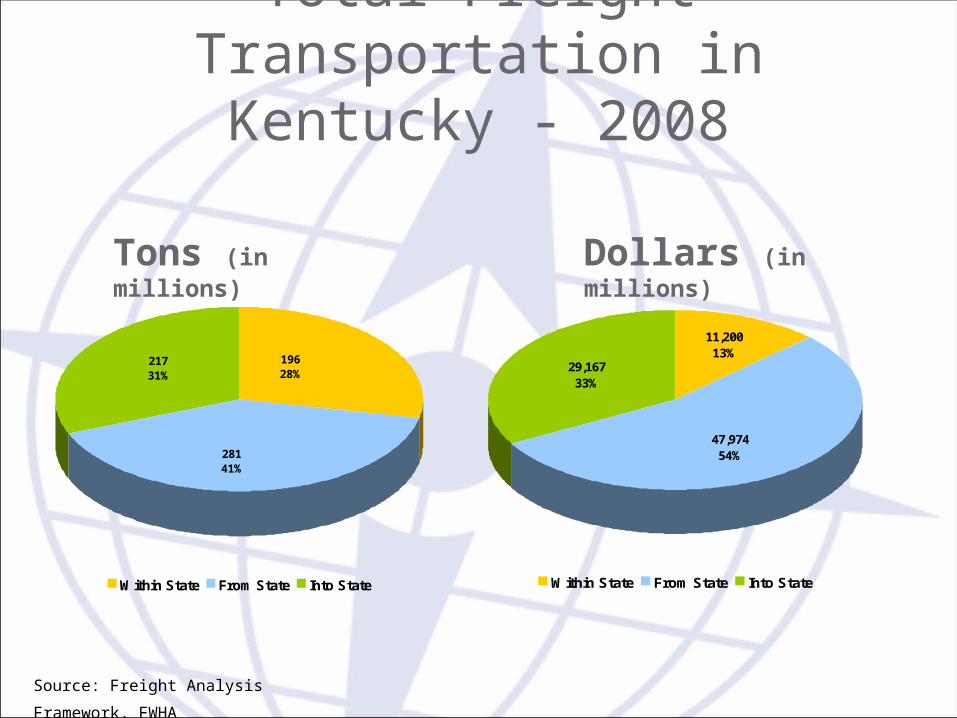
Tons (in millions) Dollars (in millions)
19628%
21731%
28141%
Within State From State Into State
29,16733%
47,97454%
11,20013%
Within State From State Into State
Source: Freight Analysis Framework, FWHA
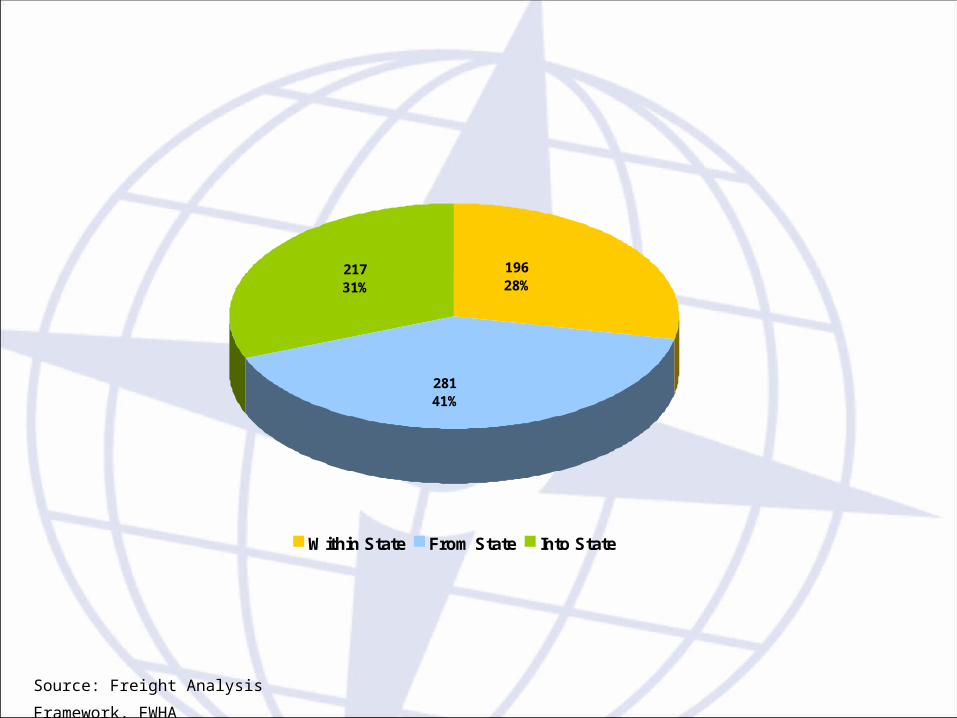
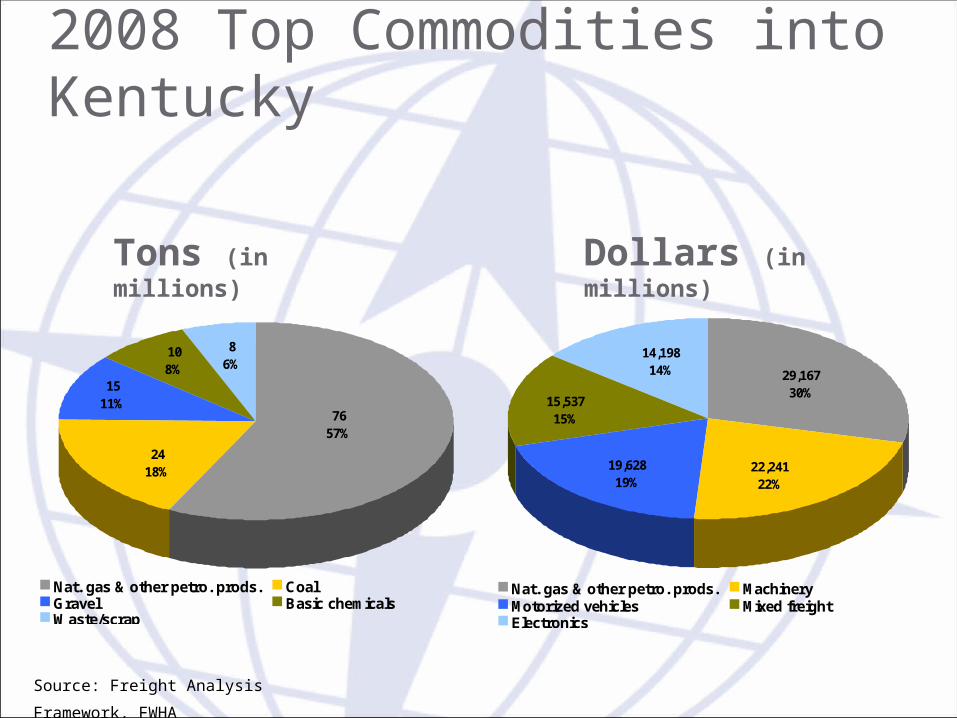
Total Freight Transportation in Kentucky - 2008
Source: Freight Analysis Framework, FWHA
19628%
21731%
28141%
Within State From State Into State
Total Freight Transportation in Kentucky (in Millions of Tons)
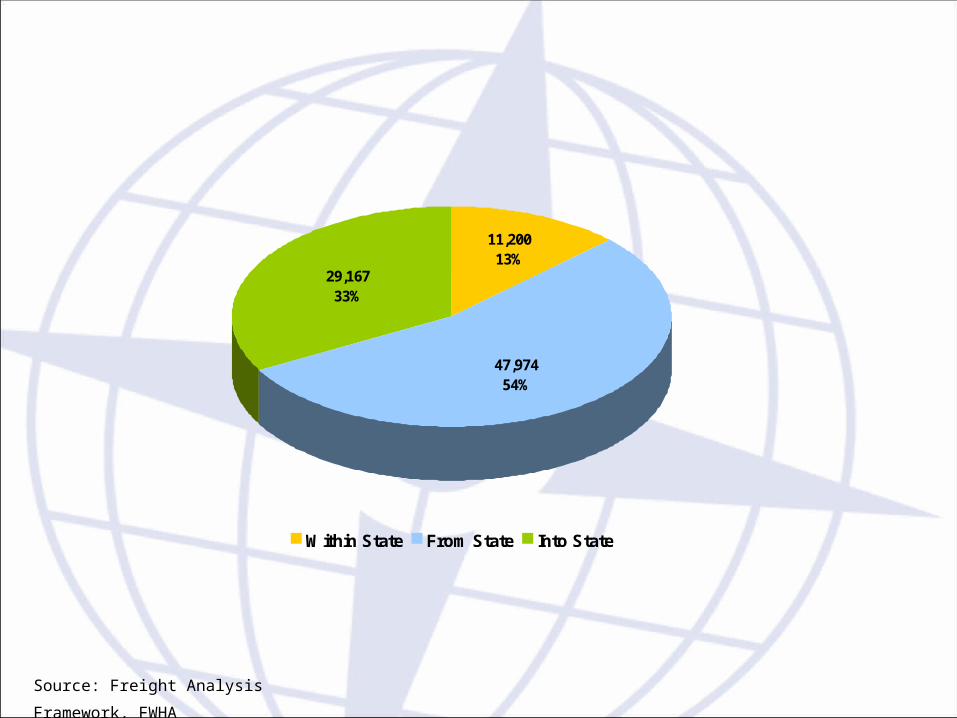
29,16733%
47,97454%
11,20013%
Within State From State Into State
Total Freight Transportation in Kentucky (in Millions of Dollars)
Source: Freight Analysis Framework, FWHA
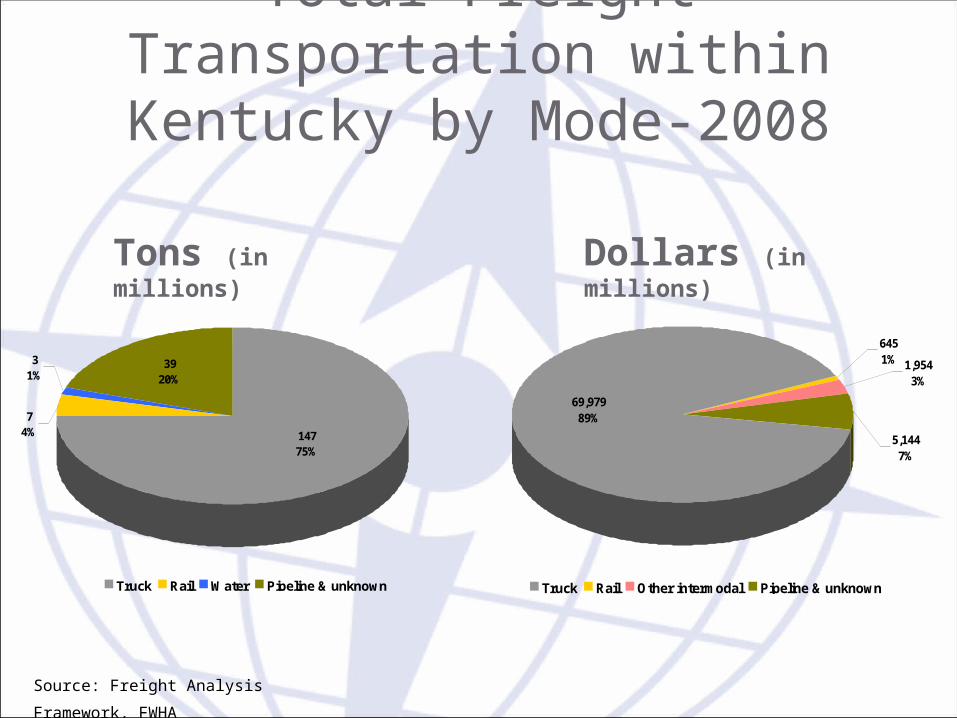
Tons (in millions) Dollars (in millions)
69,97989%
5,1447%
1,9543%
6451%
Truck Rail Other intermodal Pipeline & unknown
74% 147
75%
3920%
31%
Truck Rail Water Pipeline & unknown
Source: Freight Analysis Framework, FWHA
Total Freight Transportation within Kentucky by Mode-2008
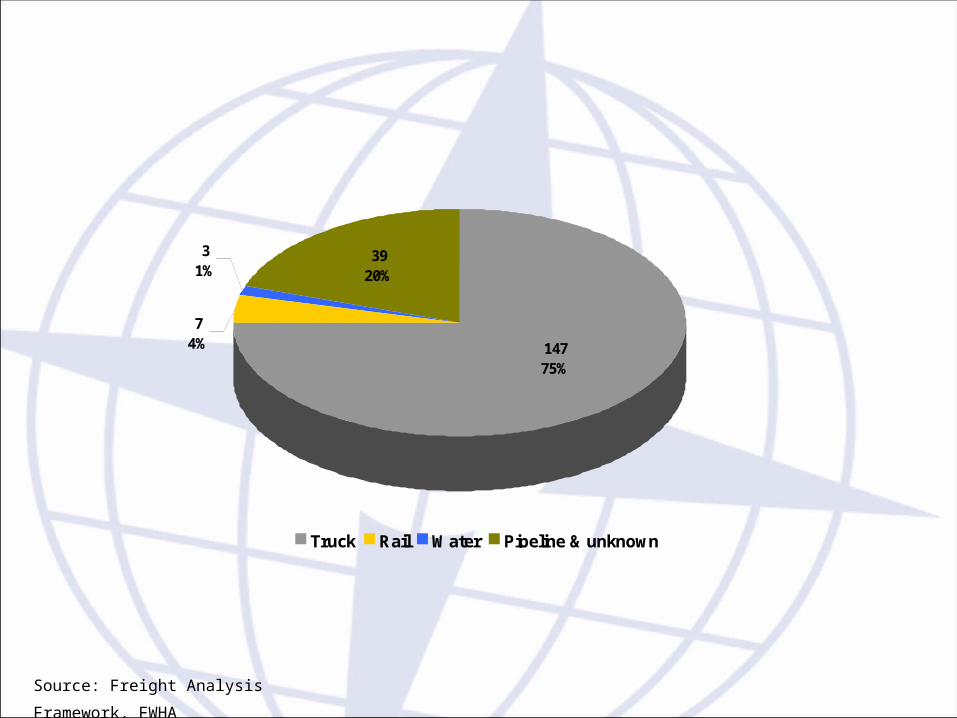
74% 147
75%
3920%
31%
Truck Rail Water Pipeline & unknown
2008 Modal Flows within Kentucky (in Millions of Tons)
Source: Freight Analysis Framework, FWHA
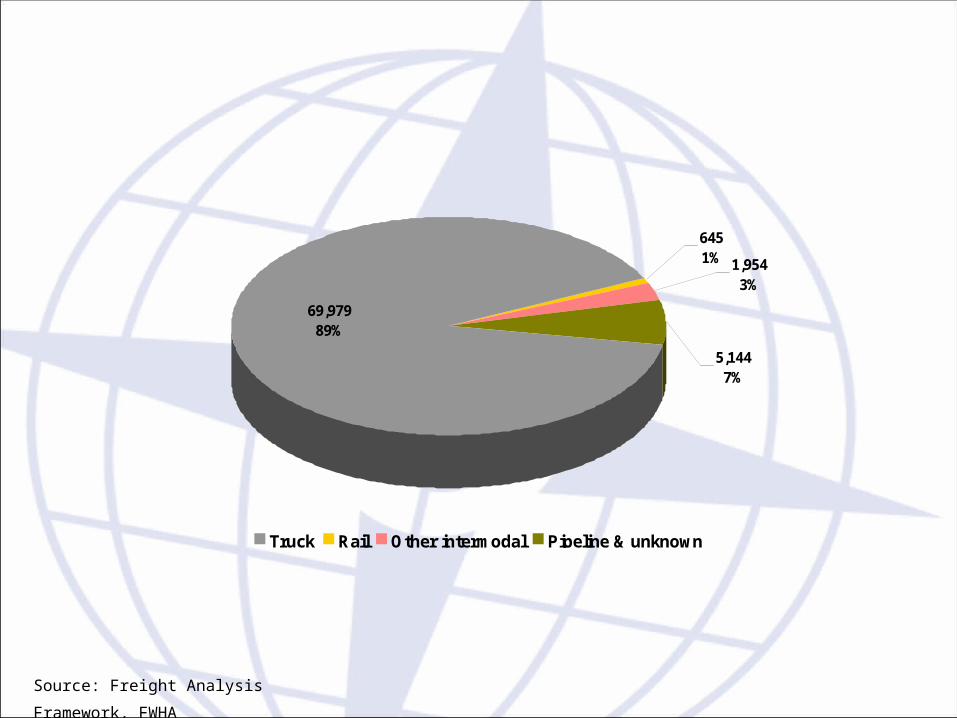
69,97989%
5,1447%
1,9543%
6451%
Truck Rail Other intermodal Pipeline & unknown
2008 Modal Flows within Kentucky (in Millions of Dollars)
Source: Freight Analysis Framework, FWHA
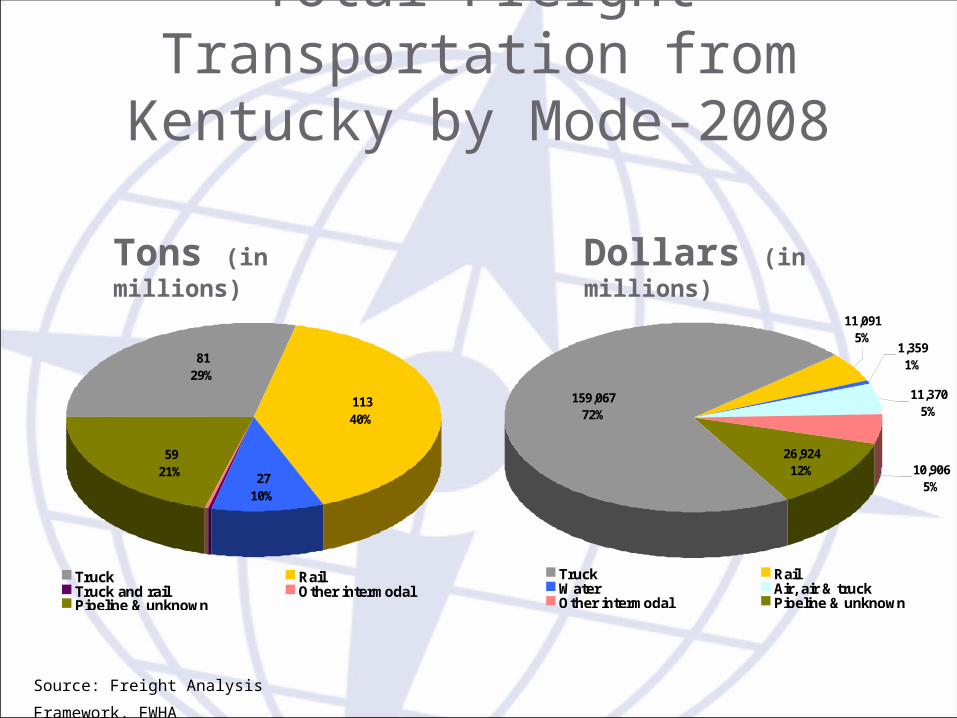
Tons (in millions) Dollars (in millions)
5921%
11340%
8129%
2710%
Truck RailTruck and rail Other intermodalPipeline & unknown
159,06772%
11,3705%
1,3591%
10,9065%
26,92412%
11,0915%
Truck RailWater Air, air & truckOther intermodal Pipeline & unknown
Source: Freight Analysis Framework, FWHA
Total Freight Transportation from Kentucky by Mode-2008
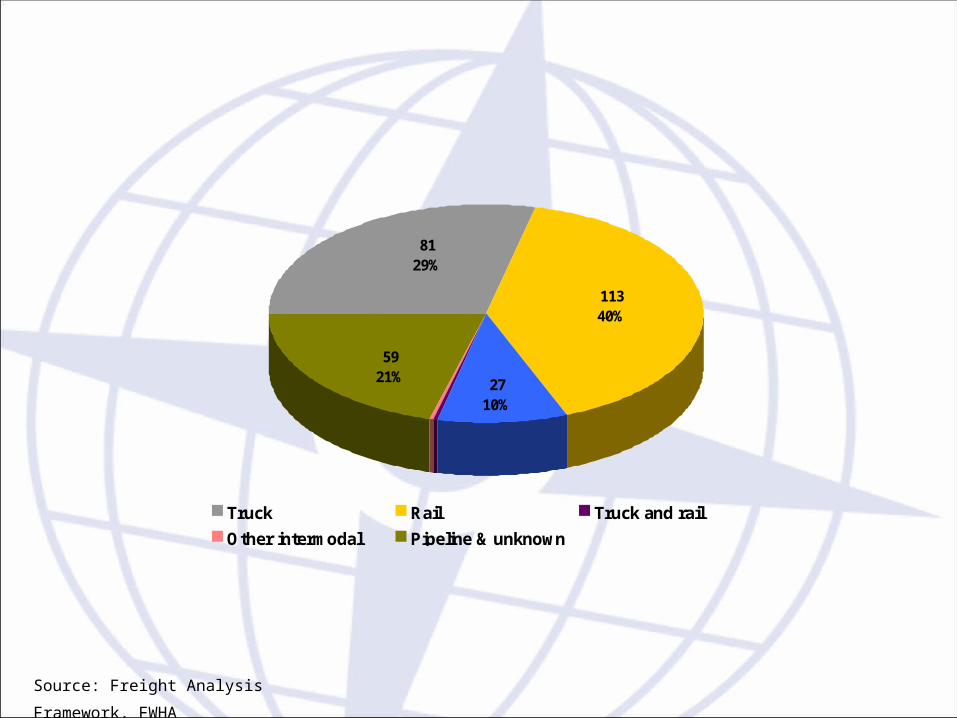
5921%
11340%
8129%
2710%
Truck Rail Truck and rail
Other intermodal Pipeline & unknown
2008 Modal Flows from Kentucky (in Millions of Tons)
Source: Freight Analysis Framework, FWHA
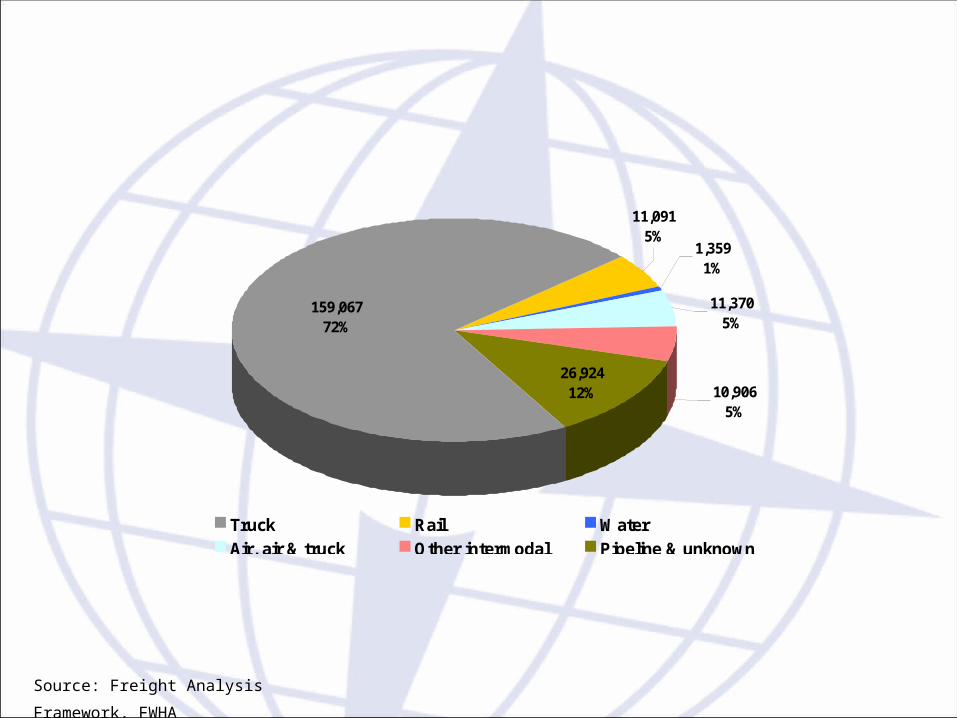
159,06772%
11,3705%
1,3591%
10,9065%
26,92412%
11,0915%
Truck Rail Water
Air, air & truck Other intermodal Pipeline & unknown
2008 Modal Flows from Kentucky (in Millions of Dollars)
Source: Freight Analysis Framework, FWHA
Tons (in millions) Dollars (in millions)
21%
8641%
7635%
2411% 27
12%
Truck Rail Water Other intermodal Pipeline & unknown
13,2077%
1,1711%
10,4175%
11,3836%
31,92316%
127,01865%
Truck RailWater Air, air & truckTruck and rail Other intermodalPipeline & unknown
Source: Freight Analysis Framework, FWHA
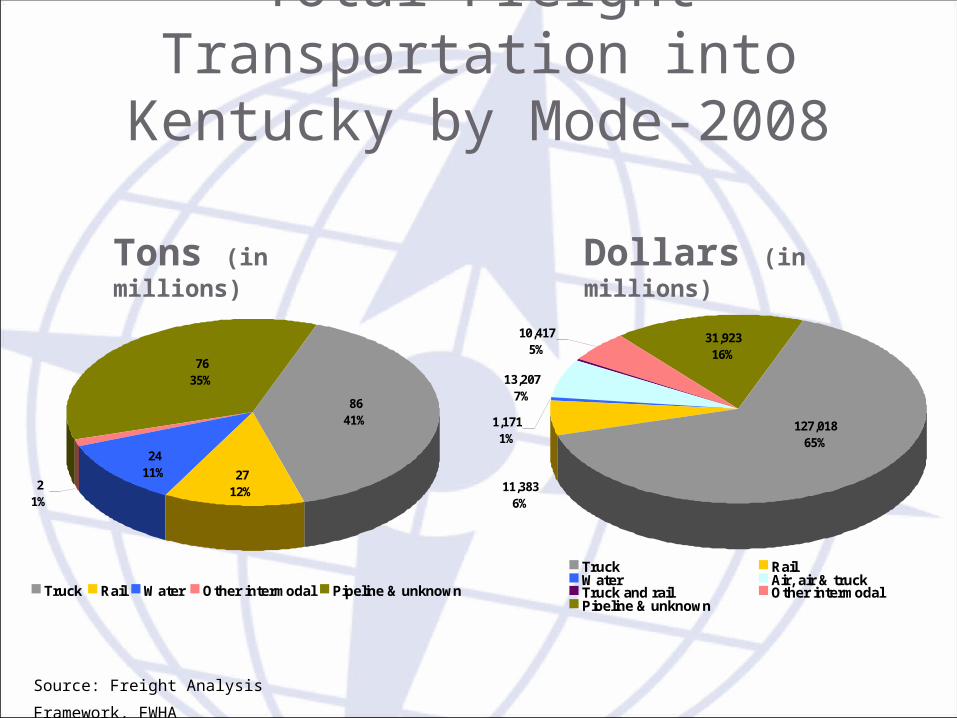
Total Freight Transportation into Kentucky by Mode-2008
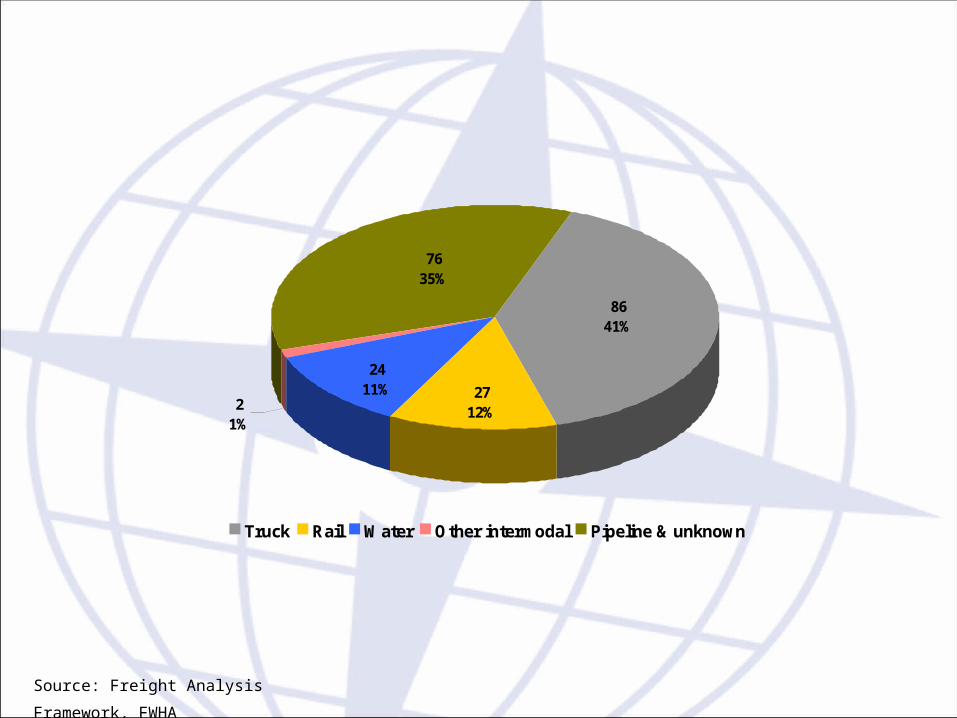
21%
8641%
7635%
2411% 27
12%
Truck Rail Water Other intermodal Pipeline & unknown
2008 Modal Flows into Kentucky (in Millions of Tons)
Source: Freight Analysis Framework, FWHA
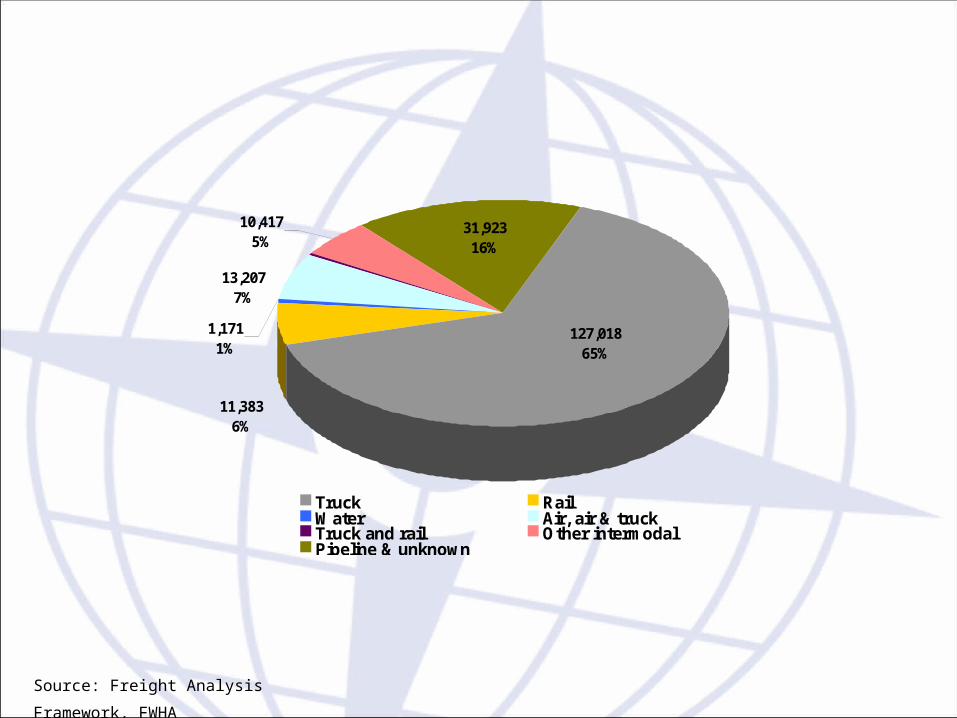
13,2077%
1,1711%
10,4175%
11,3836%
31,92316%
127,01865%
Truck RailWater Air, air & truckTruck and rail Other intermodalPipeline & unknown
2008 Modal Flows into Kentucky (in Millions of Dollars)
Source: Freight Analysis Framework, FWHA
Tons (in millions) Dollars (in millions)
399 57%
95 14%
89 13% 41
6% 35 5%
34 5%
Ohio Tennessee Indiana West Virginia Illinois Other
14,295 3%
24,834 5%
300,018 60% 44,176
9%
53,859 11%
57,219 12%
Ohio Tennessee Indiana Illionois Michigan Other
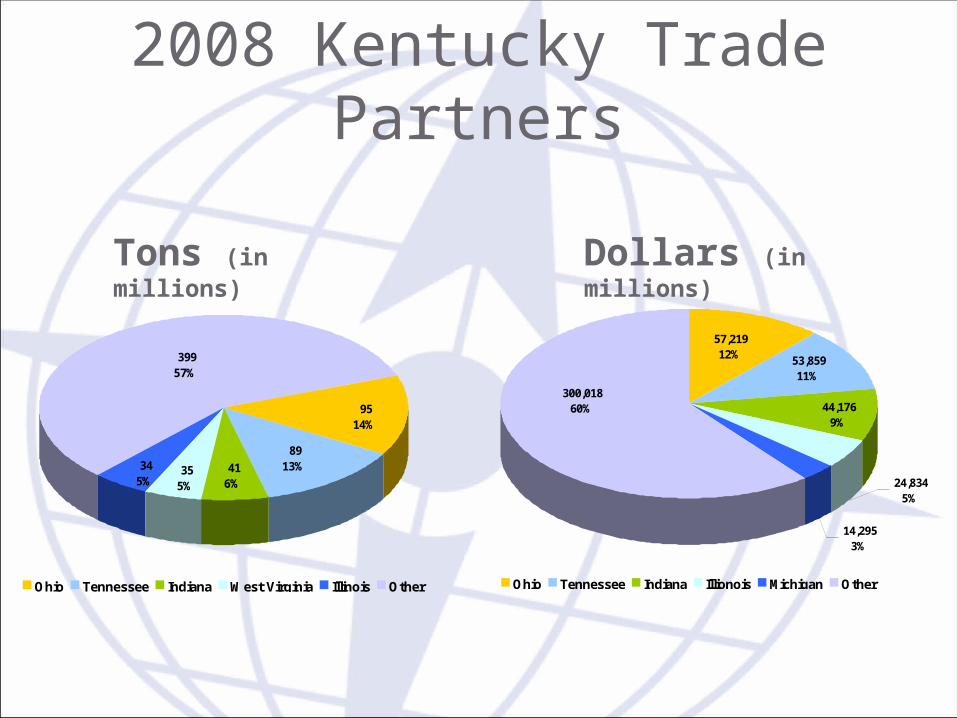
2008 Kentucky Trade Partners
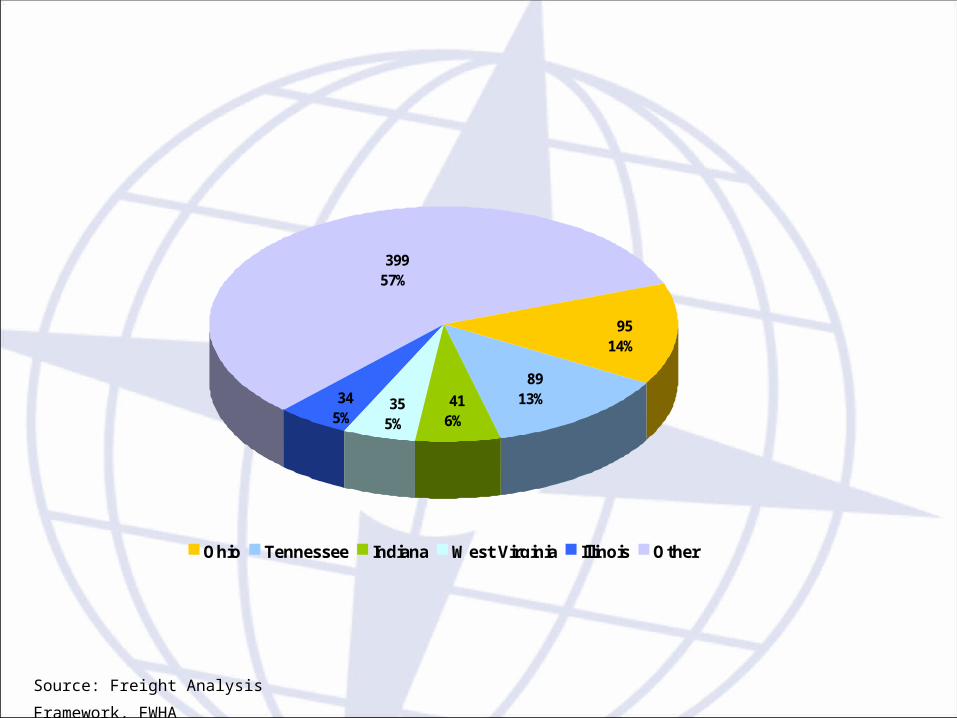
399 57%
95 14%
89 13% 41
6% 35 5%
34 5%
Ohio Tennessee Indiana West Virginia Illinois Other
Kentucky Trade Partners (in Millions of Tons)
Source: Freight Analysis Framework, FWHA
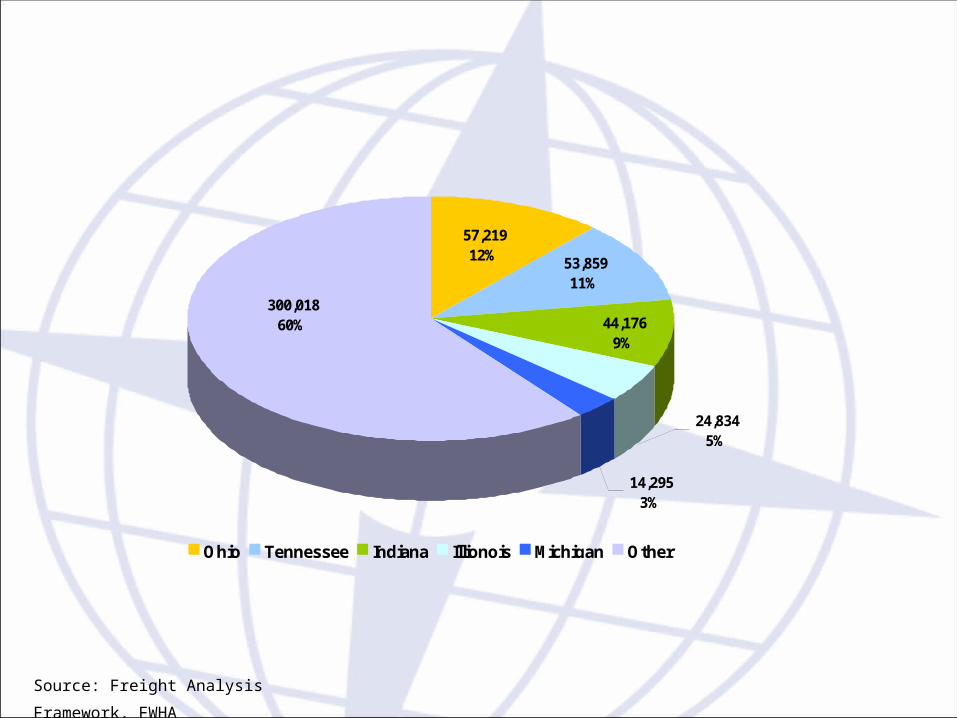
14,295 3%
24,834 5%
300,018 60% 44,176
9%
53,859 11%
57,219 12%
Ohio Tennessee Indiana Illionois Michigan Other
Kentucky Trade Partners (in Millions of Dollars)
Source: Freight Analysis Framework, FWHA
Tons (in millions) Dollars (in millions)
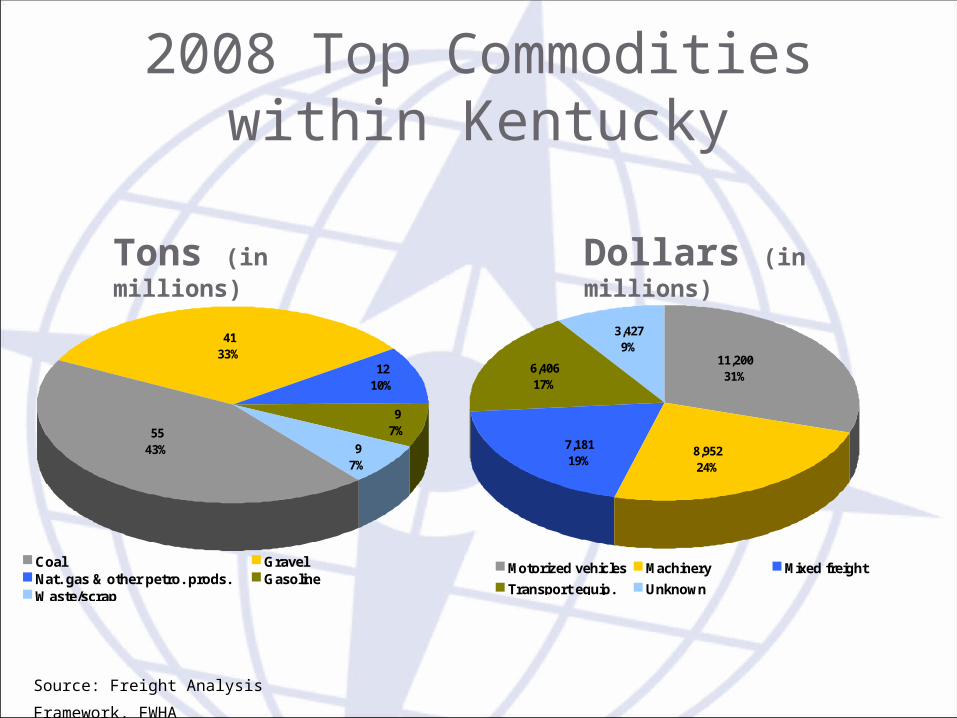
1210%
97%
97%
5543%
4133%
Coal GravelNat. gas & other petro. prods. GasolineWaste/scrap
8,95224%
7,18119%
6,40617%
3,4279%
11,20031%
Motorized vehicles Machinery Mixed freight
Transport equip. Unknown
Source: Freight Analysis Framework, FWHA
2008 Top Commodities within Kentucky
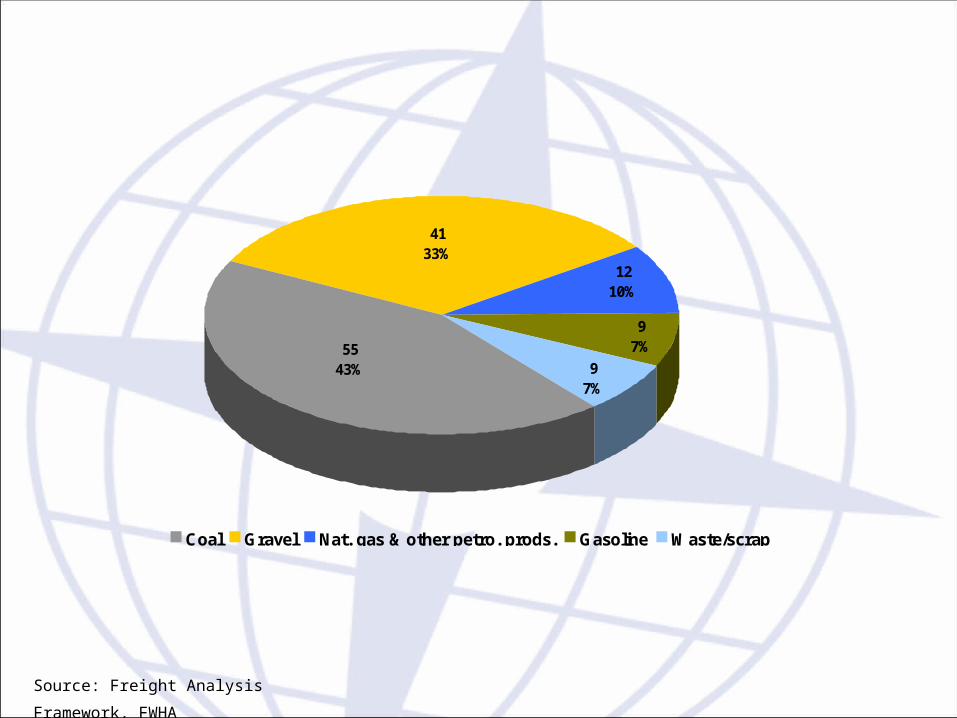
4133%
5543% 9
7%
97%
1210%
Coal Gravel Nat. gas & other petro. prods. Gasoline Waste/scrap
2008 Top Commodities within Kentucky (in Millions of Tons)
Source: Freight Analysis Framework, FWHA
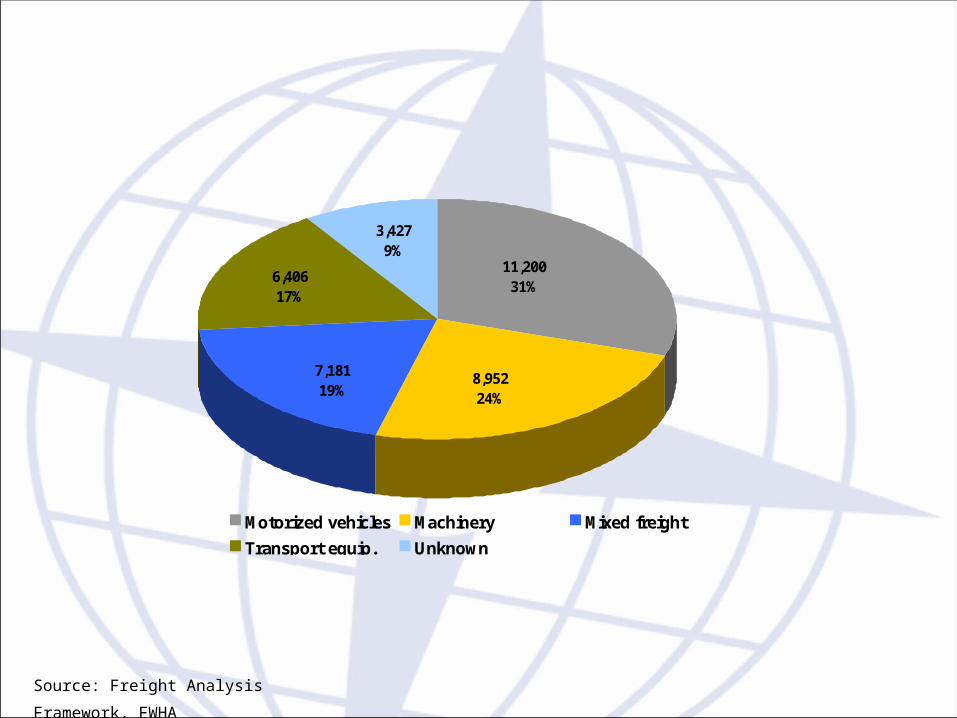
8,95224%
7,18119%
6,40617%
3,4279%
11,20031%
Motorized vehicles Machinery Mixed freight
Transport equip. Unknown
2008 Top Commodities within Kentucky (in Millions of Dollars)
Source: Freight Analysis Framework, FWHA
Tons (in millions) Dollars (in millions)
126%
94%
84%
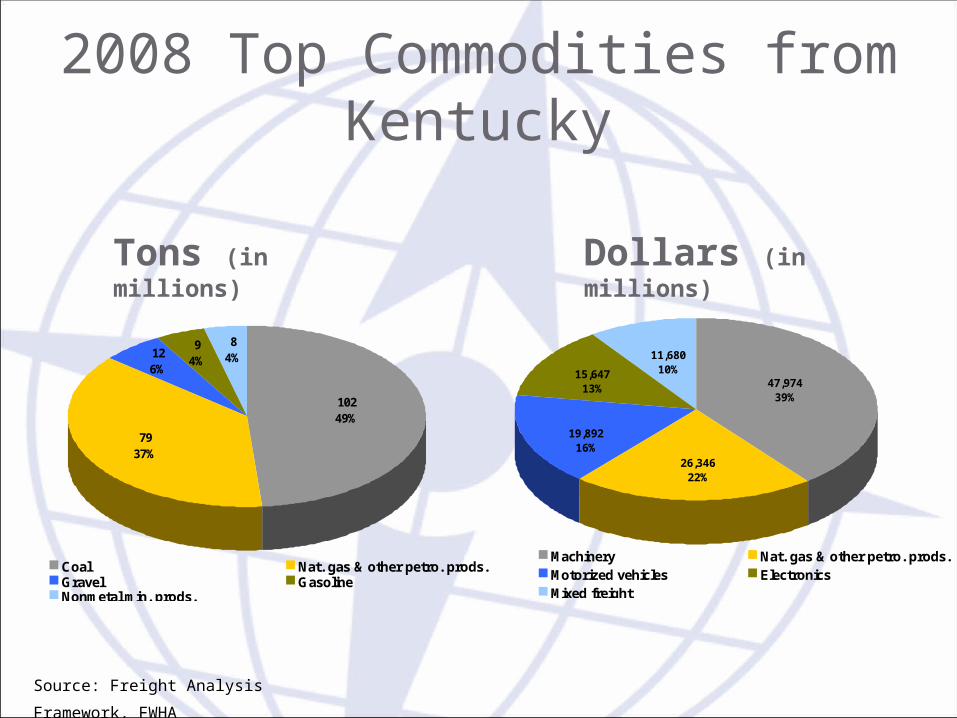
7937%
10249%
Coal Nat. gas & other petro. prods.Gravel GasolineNonmetal min. prods.
15,64713%
19,89216%
26,34622%
47,97439%
11,68010%
Machinery Nat. gas & other petro. prods.Motorized vehicles ElectronicsMixed freight
Source: Freight Analysis Framework, FWHA
2008 Top Commodities from Kentucky
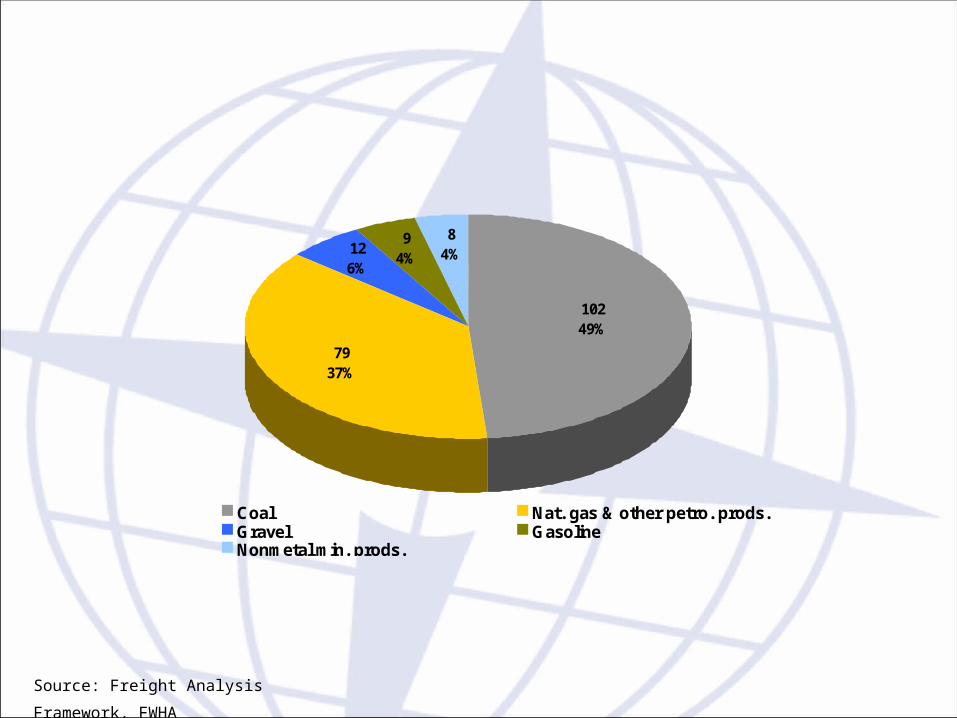
126%
94%
84%
7937%
10249%
Coal Nat. gas & other petro. prods.Gravel GasolineNonmetal min. prods.
2008 Top Commodities from Kentucky (in Millions of Tons)
Source: Freight Analysis Framework, FWHA
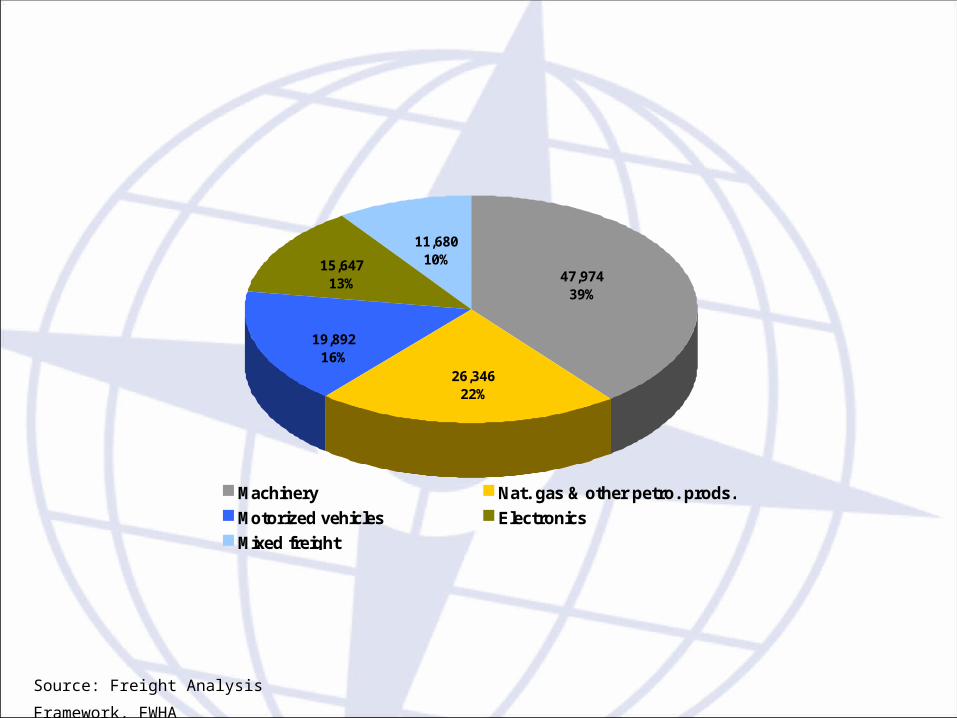
15,64713%
19,89216%
26,34622%
47,97439%
11,68010%
Machinery Nat. gas & other petro. prods.
Motorized vehicles Electronics
Mixed freight
2008 Top Commodities from Kentucky (in Millions of Dollars)
Source: Freight Analysis Framework, FWHA
Tons (in millions) Dollars (in millions)
2418%
1511%
108%
86%
7657%
Nat. gas & other petro. prods. CoalGravel Basic chemicalsWaste/scrap
14,19814%
15,53715%
19,62819%
22,24122%
29,16730%
Nat. gas & other petro. prods. MachineryMotorized vehicles Mixed freightElectronics
Source: Freight Analysis Framework, FWHA
2008 Top Commodities into Kentucky
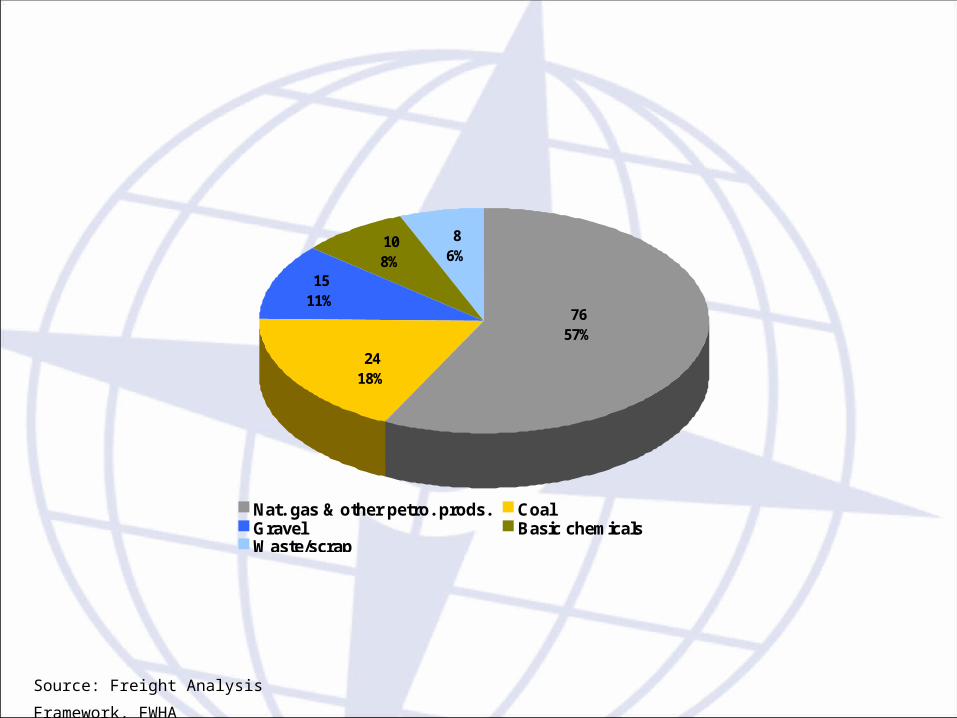
2418%
1511%
108%
86%
7657%
Nat. gas & other petro. prods. CoalGravel Basic chemicalsWaste/scrap
2008 Top Commodities into Kentucky (in Millions of Tons)
Source: Freight Analysis Framework, FWHA
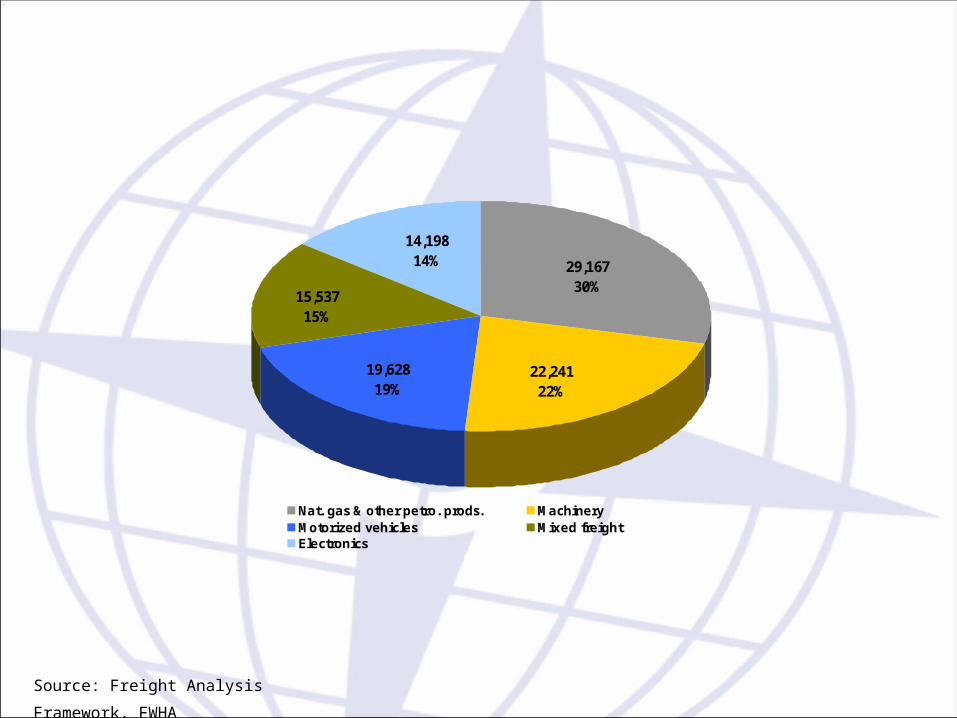
14,19814%
15,53715%
19,62819%
22,24122%
29,16730%
Nat. gas & other petro. prods. MachineryMotorized vehicles Mixed freightElectronics
2008 Top Commodities into Kentucky (in Millions of Dollars)
Source: Freight Analysis Framework, FWHA
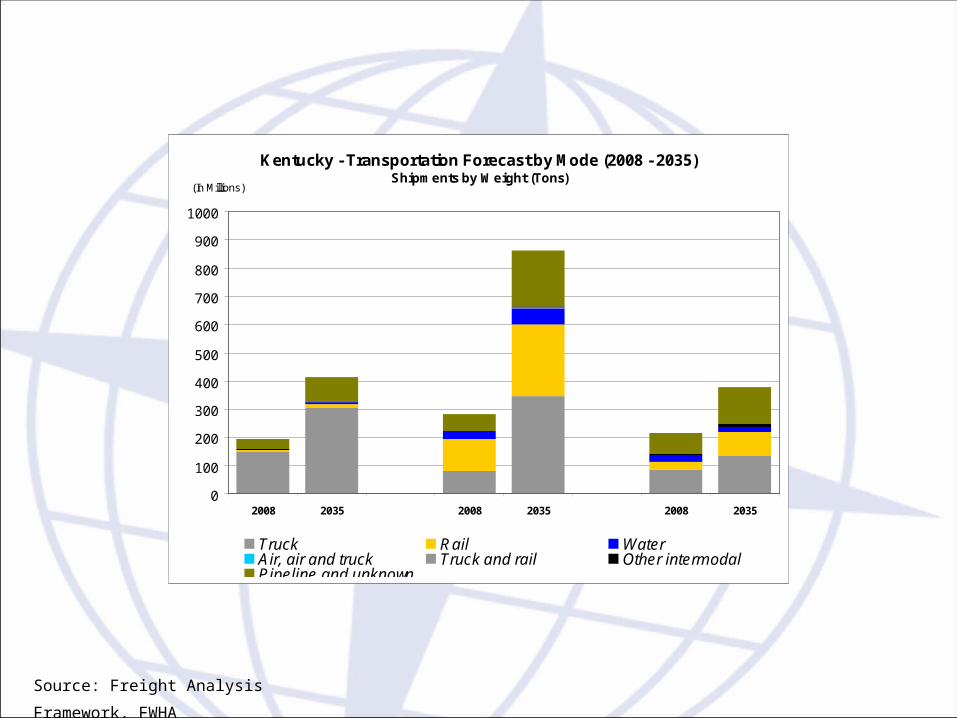
Source: Freight Analysis Framework, FWHA
Kentucky - Transportation Forecast by Mode (2008 - 2035)Shipments by Weight (Tons)
0
100
200
300
400
500
600
700
800
900
1000
2008 2035 2008 2035 2008 2035
(In Millions)
Truck Rail WaterAir, air and truck Truck and rail Other intermodalPipeline and unknown
Within State From State To State
Source: Freight Analysis Framework, FWHA
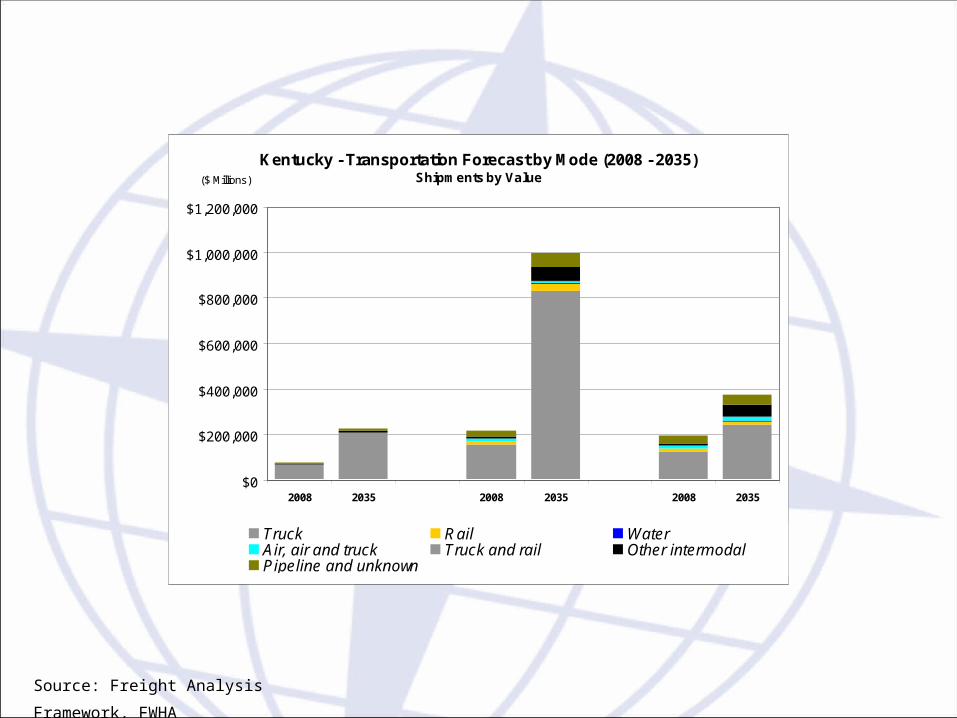
Kentucky - Transportation Forecast by Mode (2008 - 2035)Shipments by Value
$0
$200,000
$400,000
$600,000
$800,000
$1,000,000
$1,200,000
2008 2035 2008 2035 2008 2035
($ Millions)
Truck Rail WaterAir, air and truck Truck and rail Other intermodalPipeline and unknown
Within State From State To State