Embed Size (px)
Citation preview
Kentucky Coal Past, Present, and Future
Presentation to the
Northern Kentucky University Chase Law School
University of Cincinnati College of Law
Symposium on the Future of Coal
March 27th, 2014
Aron Patrick
Assistant Director
Kentucky Energy and Environment Cabinet
Department for Energy Development and Independence
502-564-7192
Twitter: @KYDEDI
Facebook: facebook.com/KentuckyDEDI
Website: energy.ky.gov
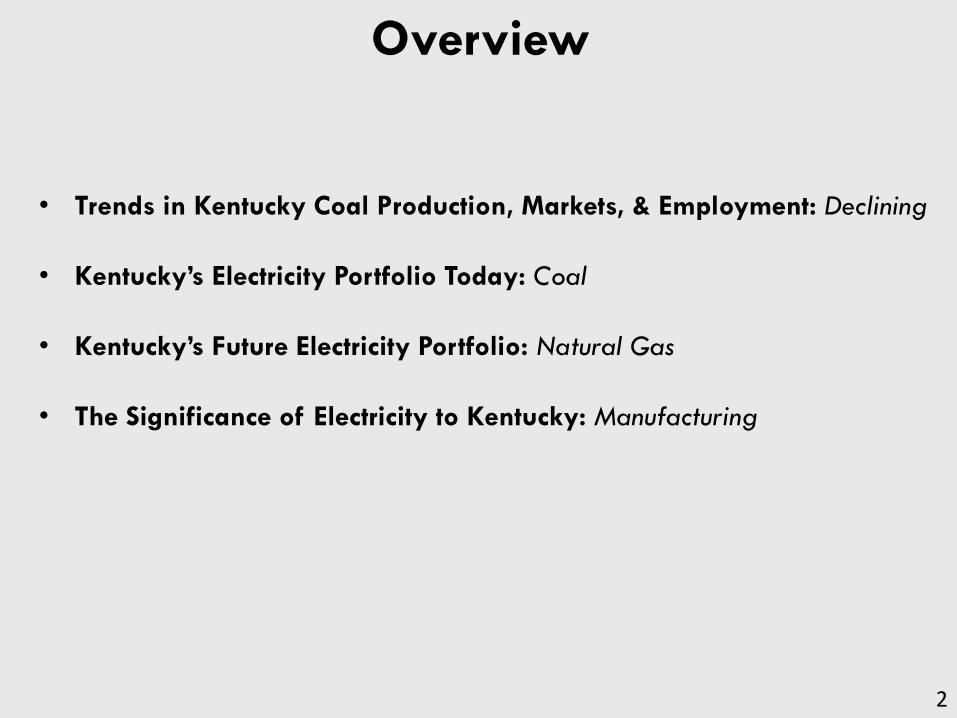
Overview
• Trends in Kentucky Coal Production, Markets, & Employment: Declining
• Kentucky’s Electricity Portfolio Today: Coal
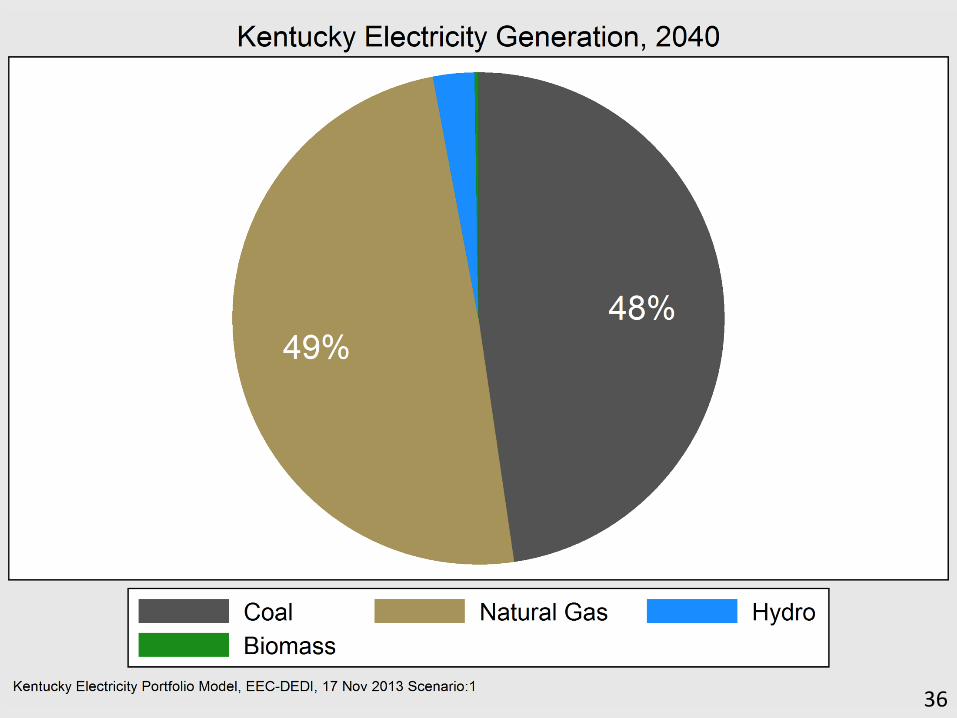
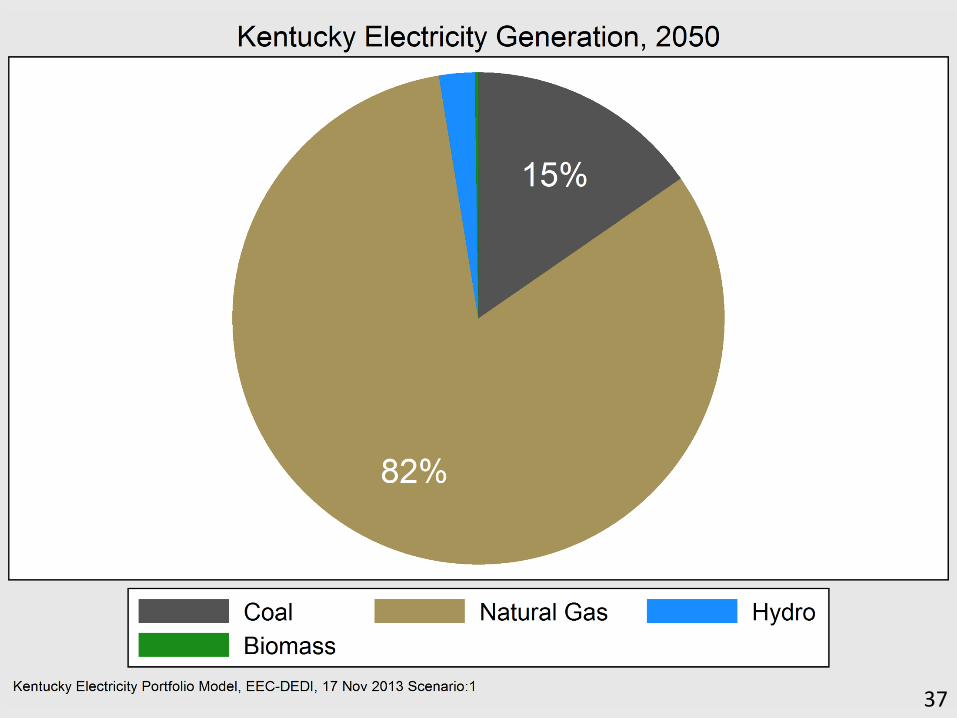
• Kentucky’s Future Electricity Portfolio: Natural Gas
• The Significance of Electricity to Kentucky: Manufacturing
2

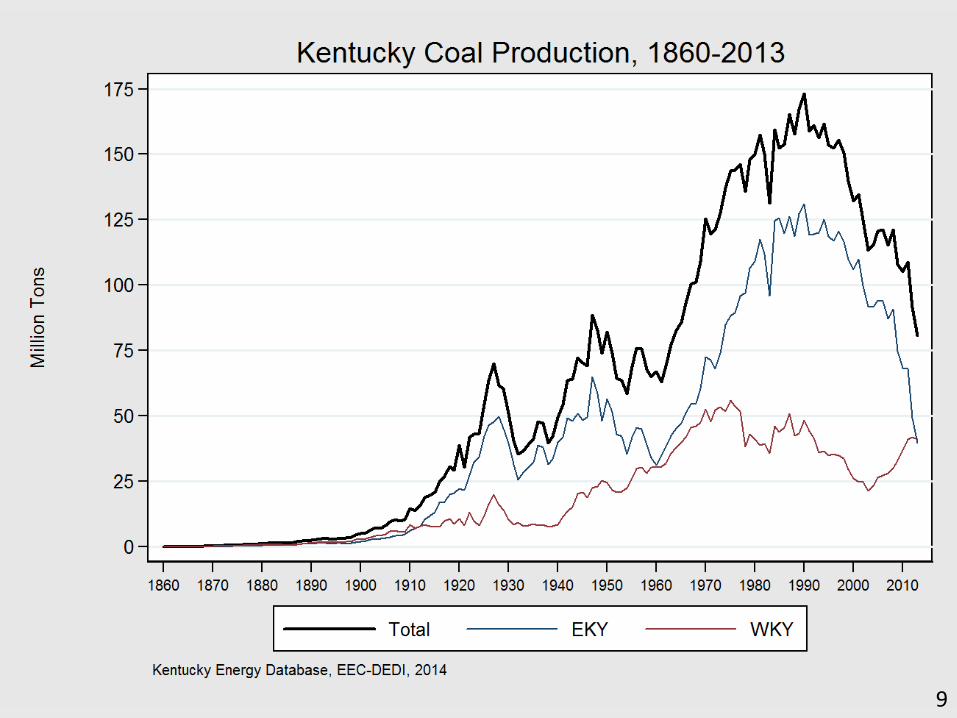
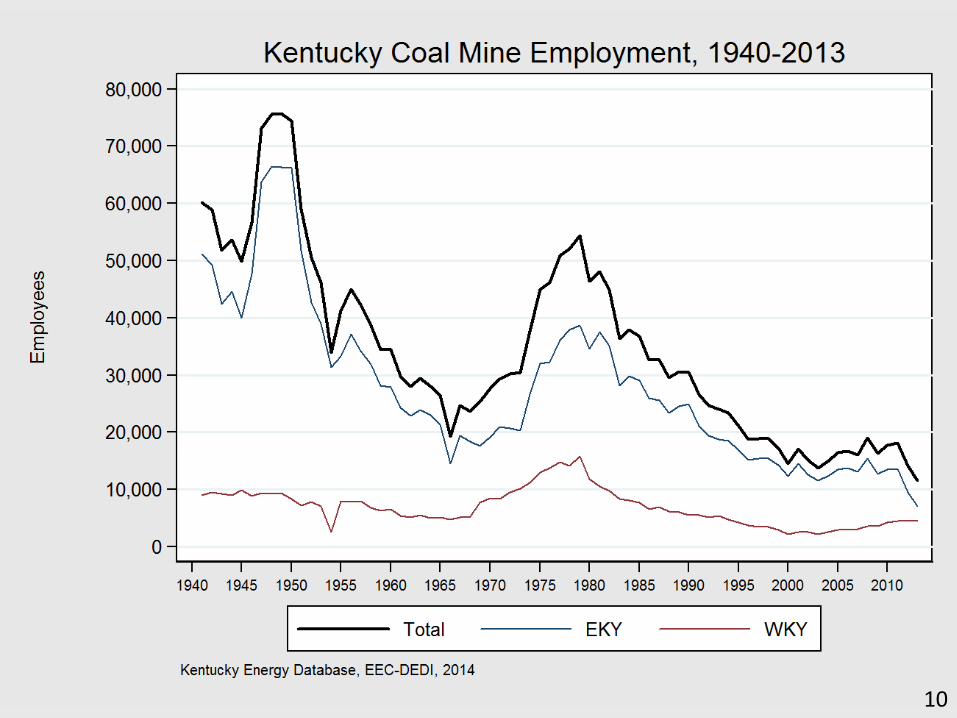
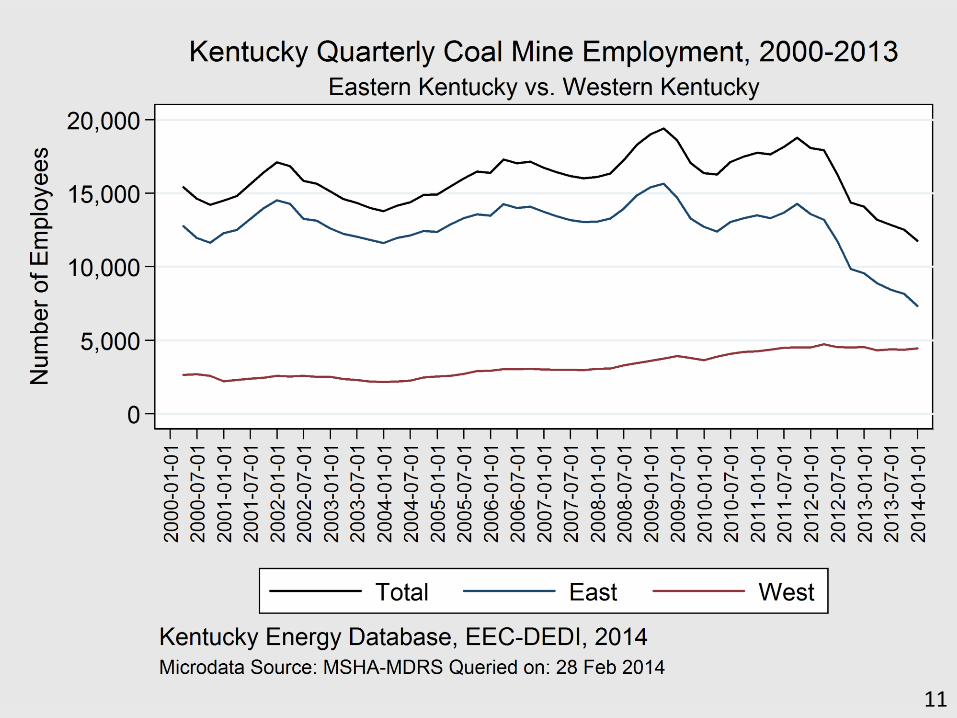
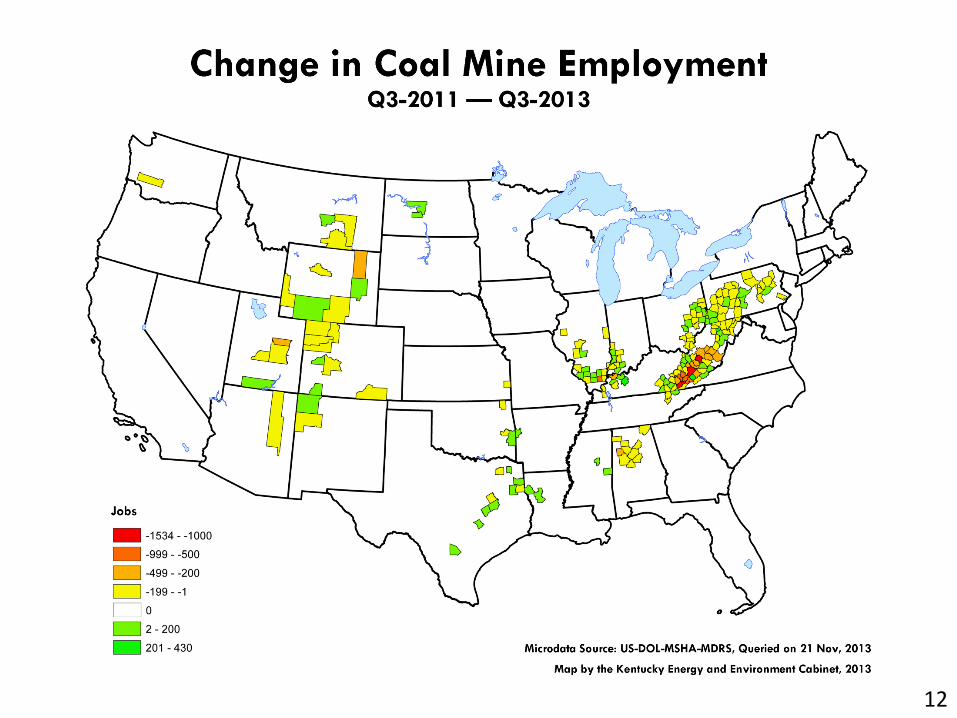
Kentucky Coal Production & Employment
3
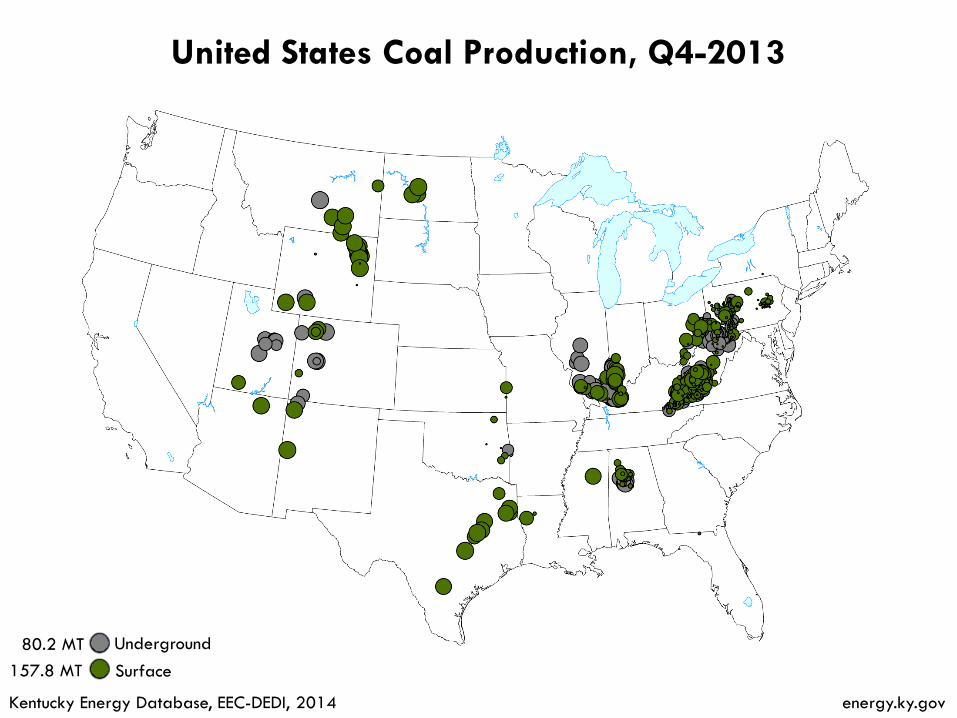
Underground
Surface
United States Coal Production, Q4-2013
80.2 MT
157.8 MT
Kentucky Energy Database, EEC-DEDI, 2014 energy.ky.gov
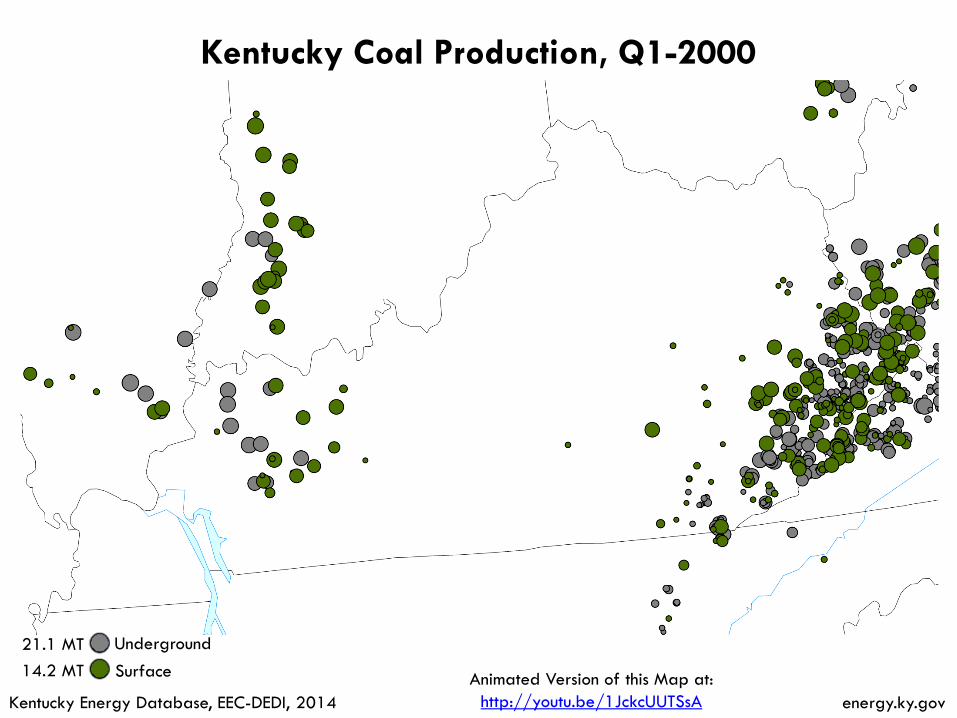
Kentucky Coal Production, Q1-2000
Kentucky Energy Database, EEC-DEDI, 2014 energy.ky.gov
21.1 MT
14.2 MT
Underground
Surface Animated Version of this Map at:
http://youtu.be/1JckcUUTSsA
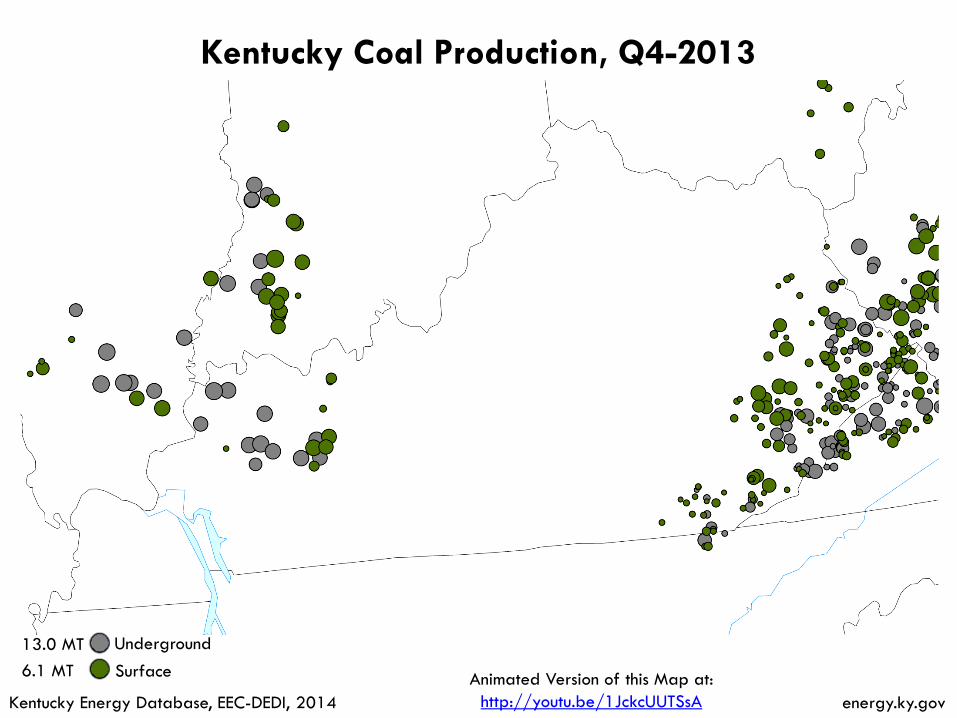
Kentucky Coal Production, Q4-2013
Kentucky Energy Database, EEC-DEDI, 2014 energy.ky.gov
13.0 MT
6.1 MT
Underground
Surface Animated Version of this Map at:
http://youtu.be/1JckcUUTSsA
7
8
9
10
11
12
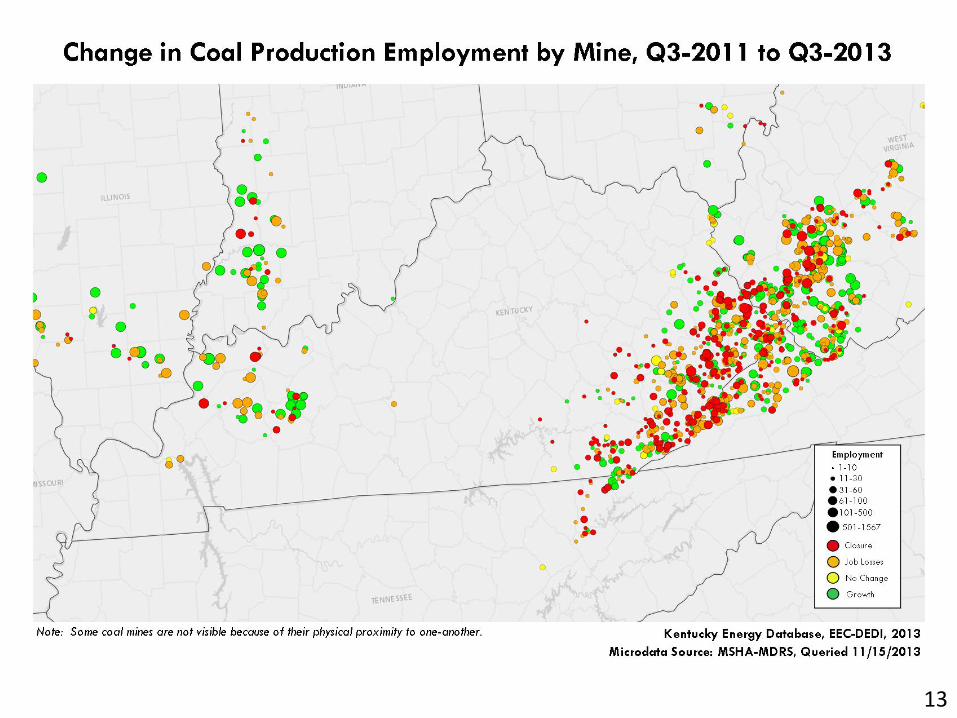
13
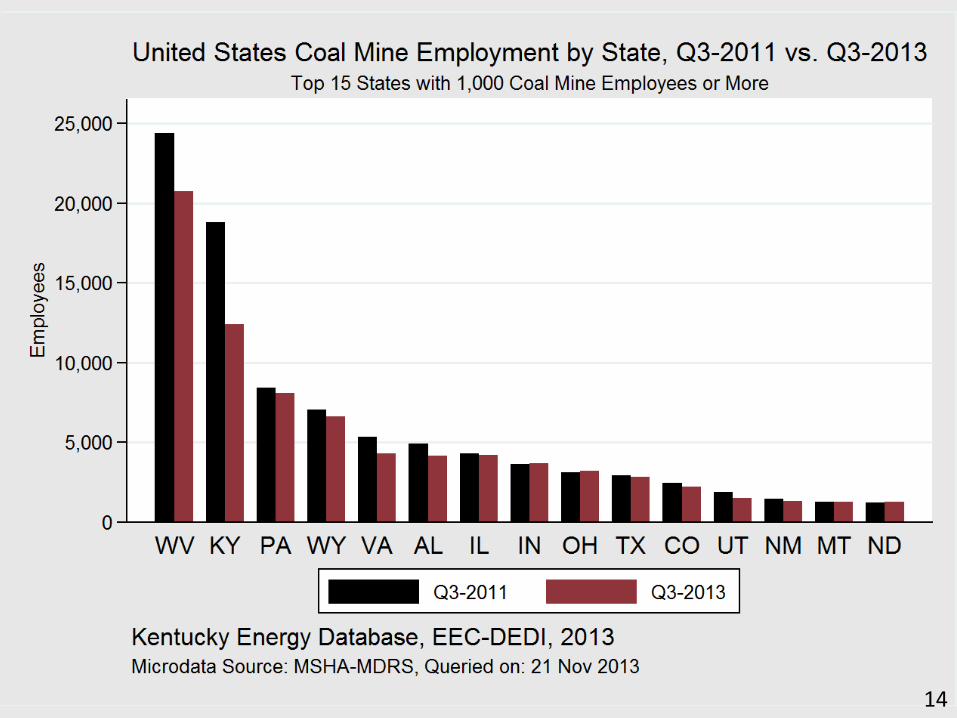
14

Kentucky Coal Markets
15
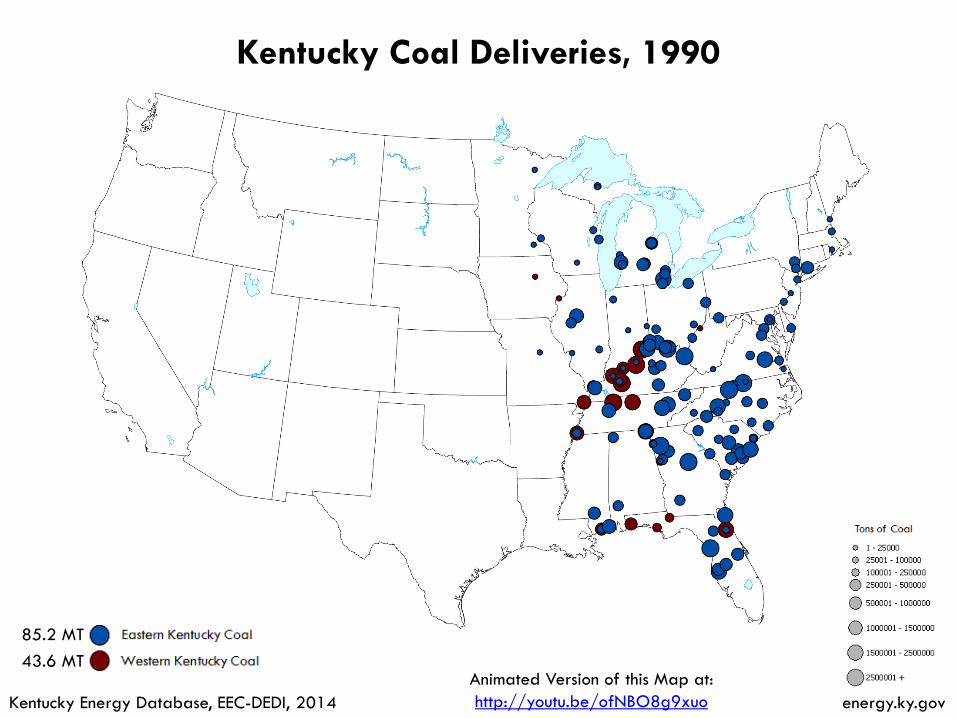
Kentucky Coal Deliveries, 1990
Kentucky Energy Database, EEC-DEDI, 2014 energy.ky.gov
85.2 MT
43.6 MT Animated Version of this Map at:
http://youtu.be/ofNBO8g9xuo
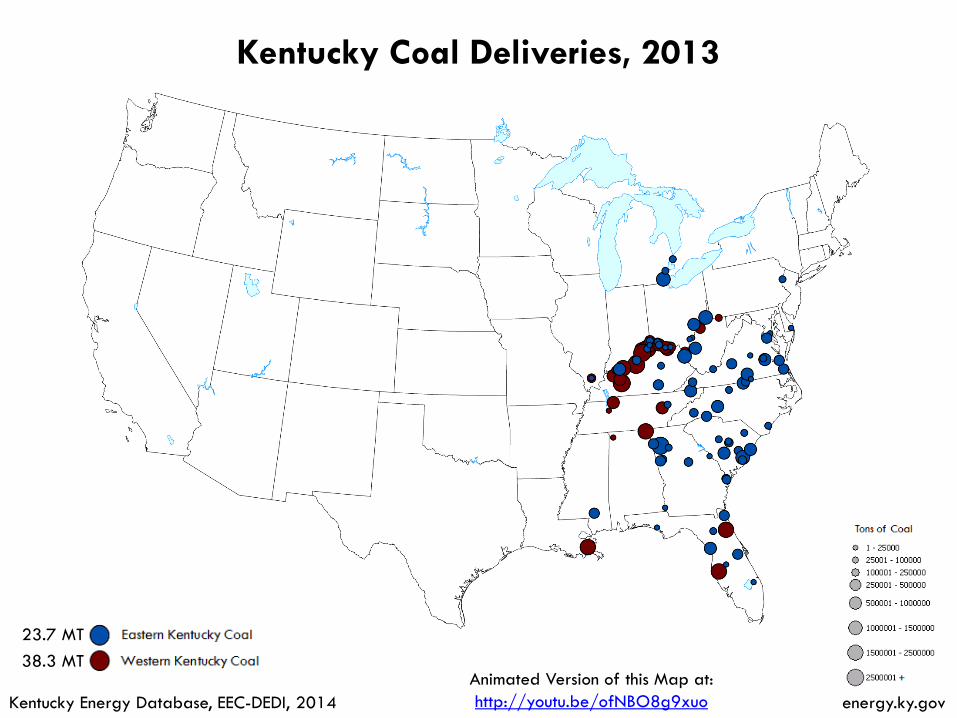
Kentucky Coal Deliveries, 2013
Kentucky Energy Database, EEC-DEDI, 2014 energy.ky.gov
23.7 MT
38.3 MT Animated Version of this Map at:
http://youtu.be/ofNBO8g9xuo
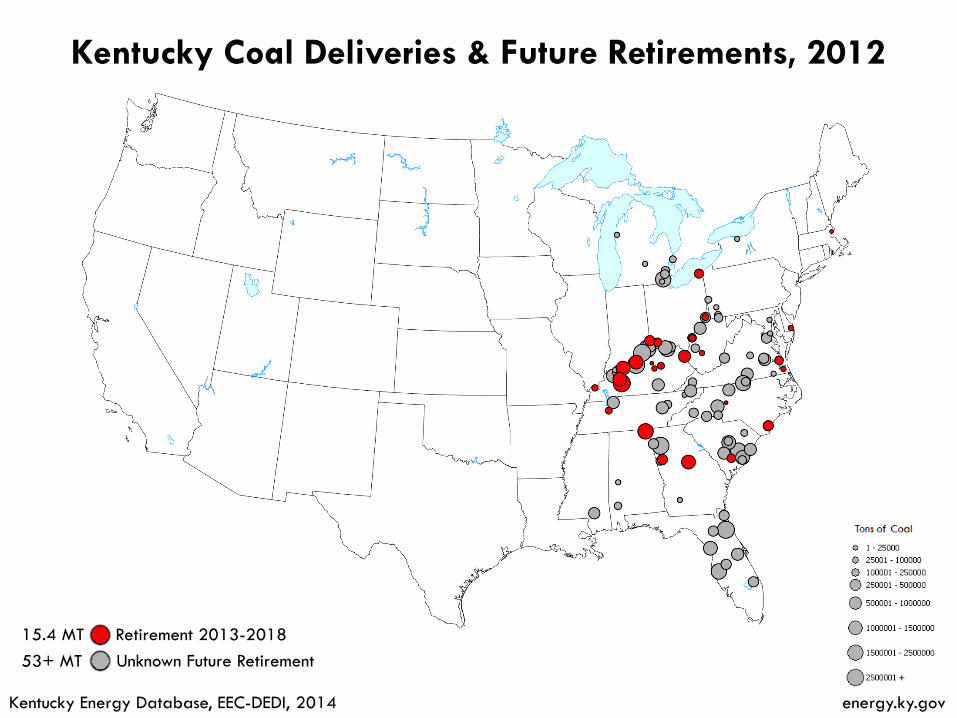
Kentucky Coal Deliveries & Future Retirements, 2012
Kentucky Energy Database, EEC-DEDI, 2014 energy.ky.gov
15.4 MT
53+ MT
Retirement 2013-2018
Unknown Future Retirement
Kentucky Energy Database, EEC-DEDI, 2014 energy.ky.gov
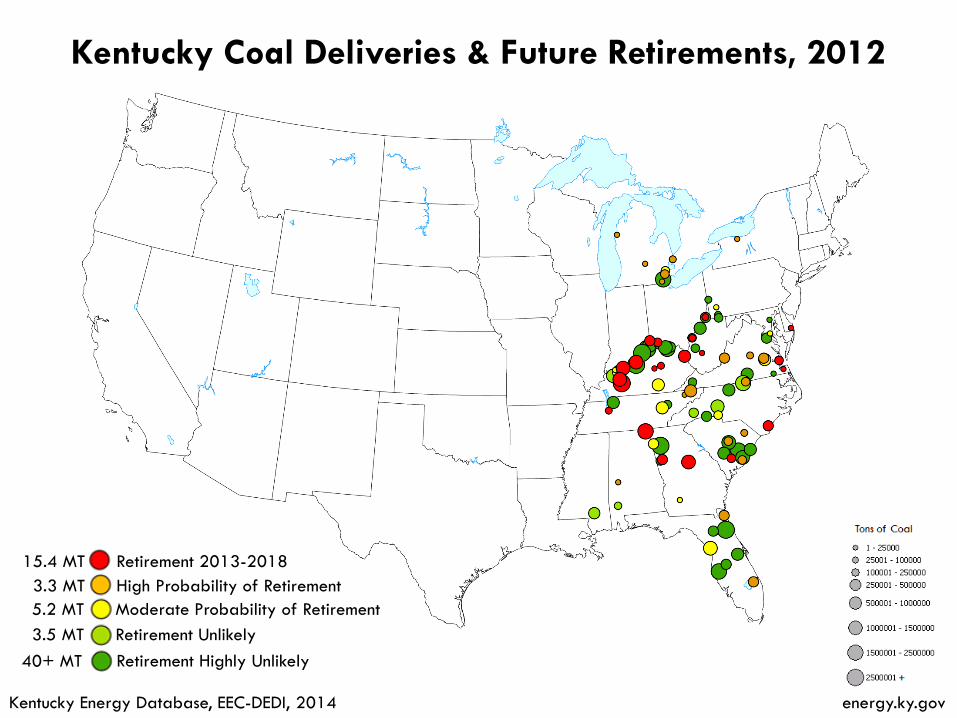
3.5 MT
40+ MT
Retirement Unlikely
Retirement Highly Unlikely
5.2 MT Moderate Probability of Retirement
3.3 MT High Probability of Retirement
15.4 MT Retirement 2013-2018
Kentucky Coal Deliveries & Future Retirements, 2012
Kentucky Energy Database, EEC-DEDI, 2014 energy.ky.gov
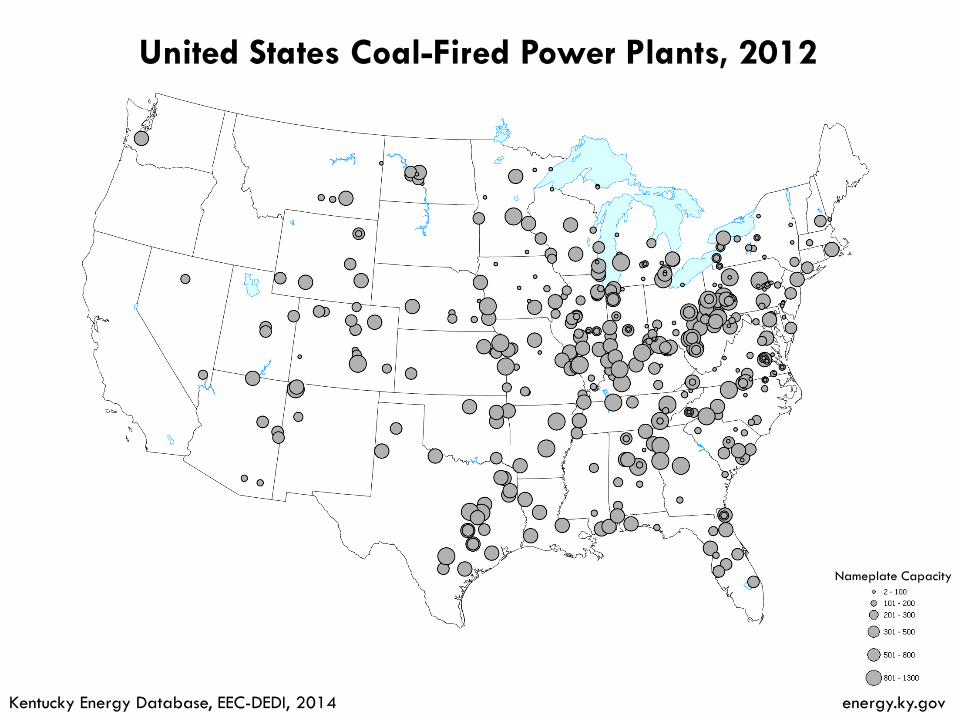
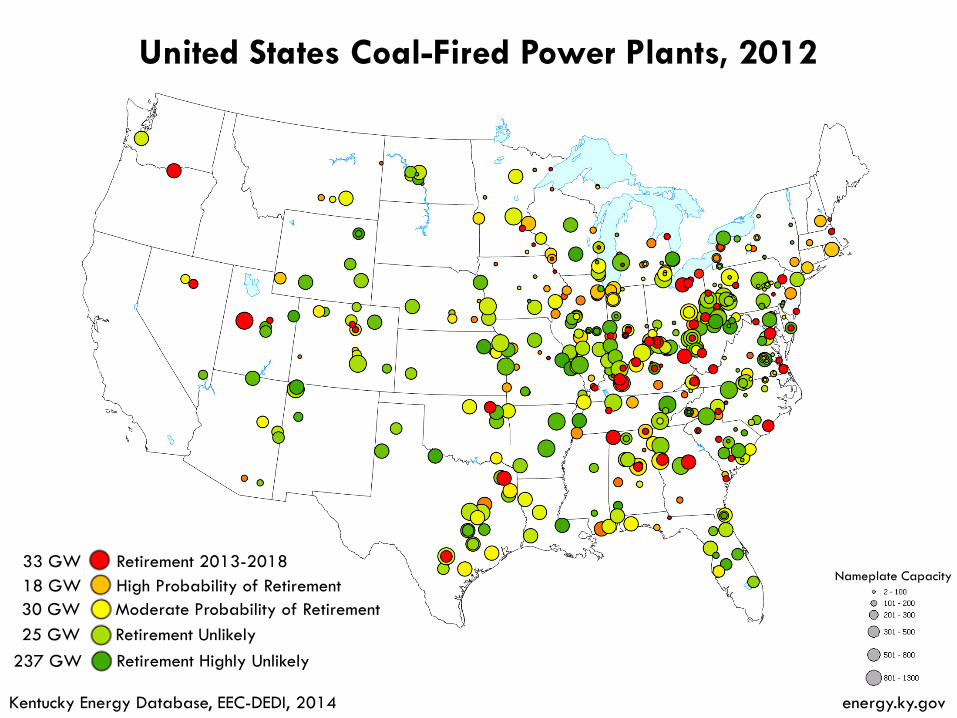
United States Coal-Fired Power Plants, 2012
Nameplate Capacity
Kentucky Energy Database, EEC-DEDI, 2014 energy.ky.gov
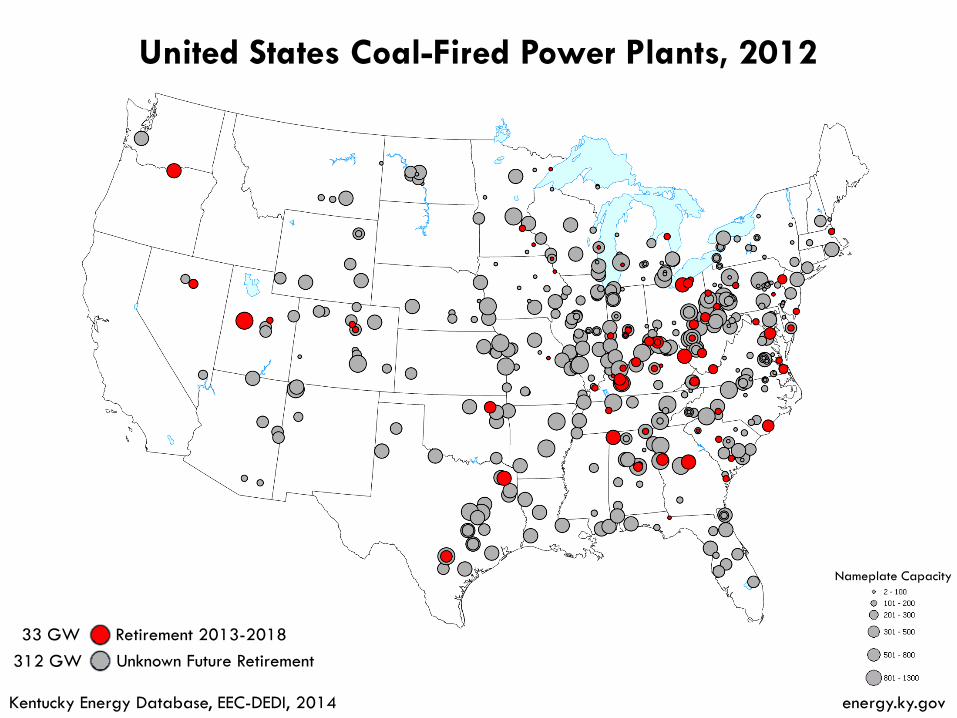
United States Coal-Fired Power Plants, 2012
33 GW
312 GW
Retirement 2013-2018
Unknown Future Retirement
Nameplate Capacity
Kentucky Energy Database, EEC-DEDI, 2014 energy.ky.gov
United States Coal-Fired Power Plants, 2012
25 GW
237 GW
Retirement Unlikely
Retirement Highly Unlikely
30 GW Moderate Probability of Retirement
18 GW High Probability of Retirement
33 GW Retirement 2013-2018 Nameplate Capacity

Kentucky’s Electricity Portfolio
23
A Quick Introduction to
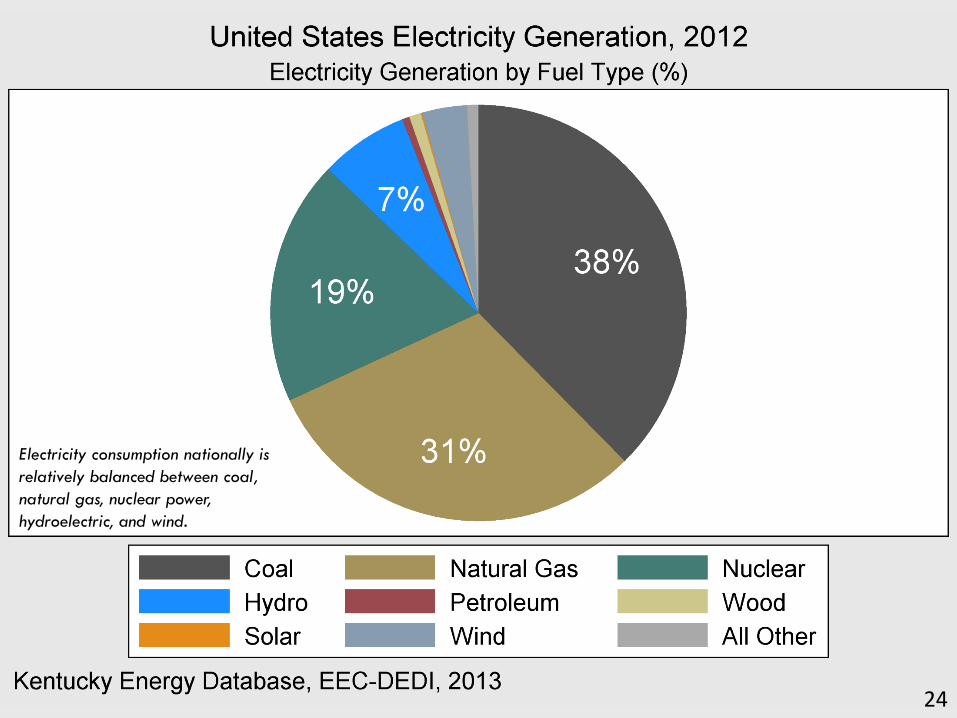
24
Electricity consumption nationally is
relatively balanced between coal,
natural gas, nuclear power,
hydroelectric, and wind.
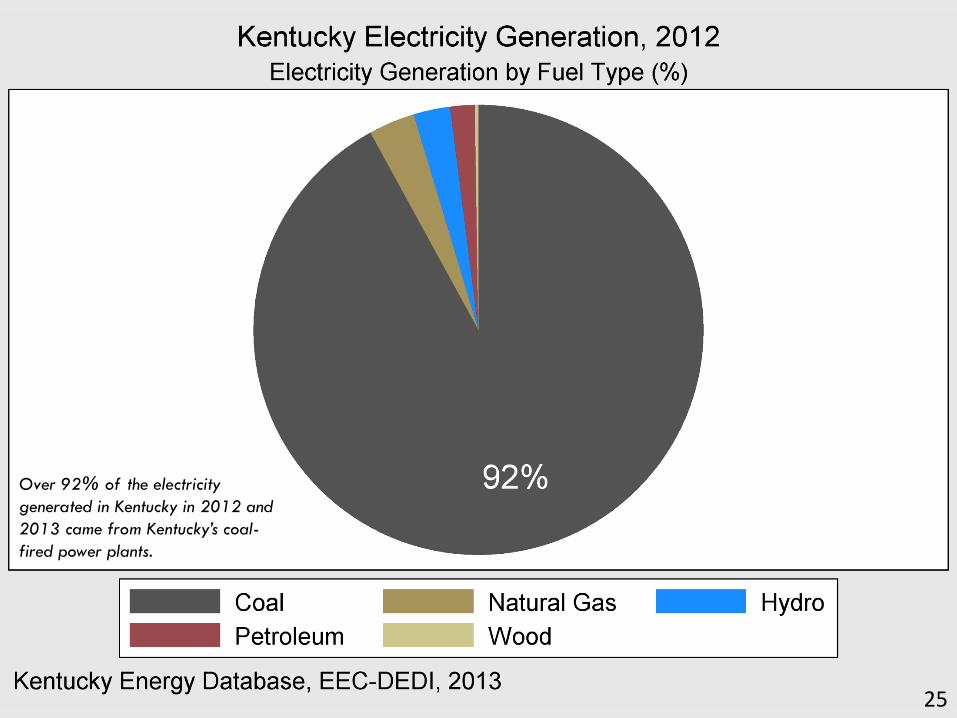
25
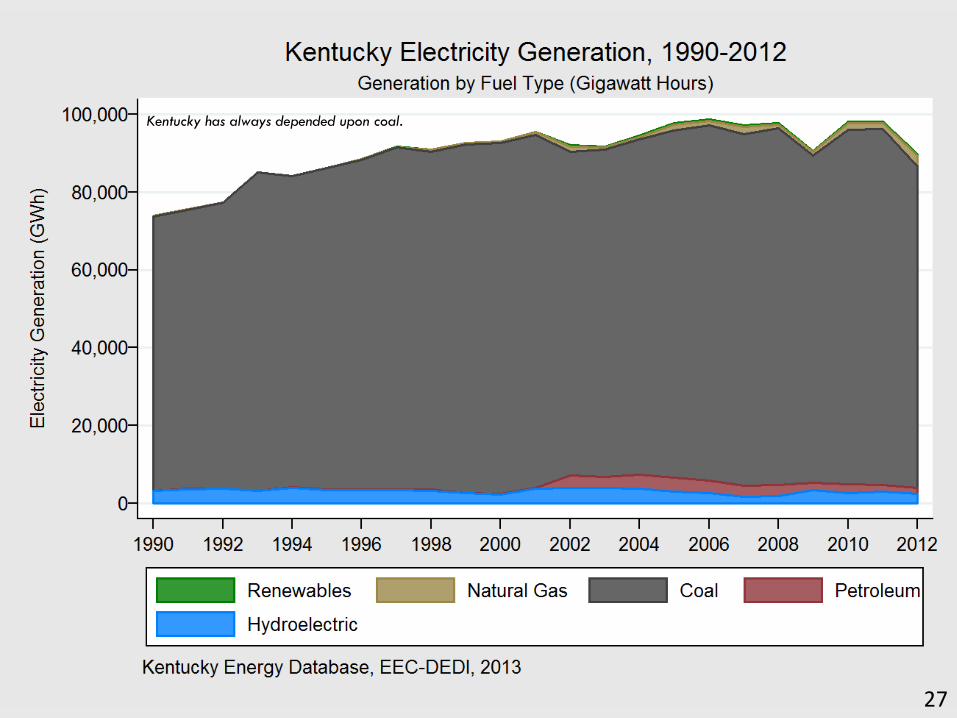
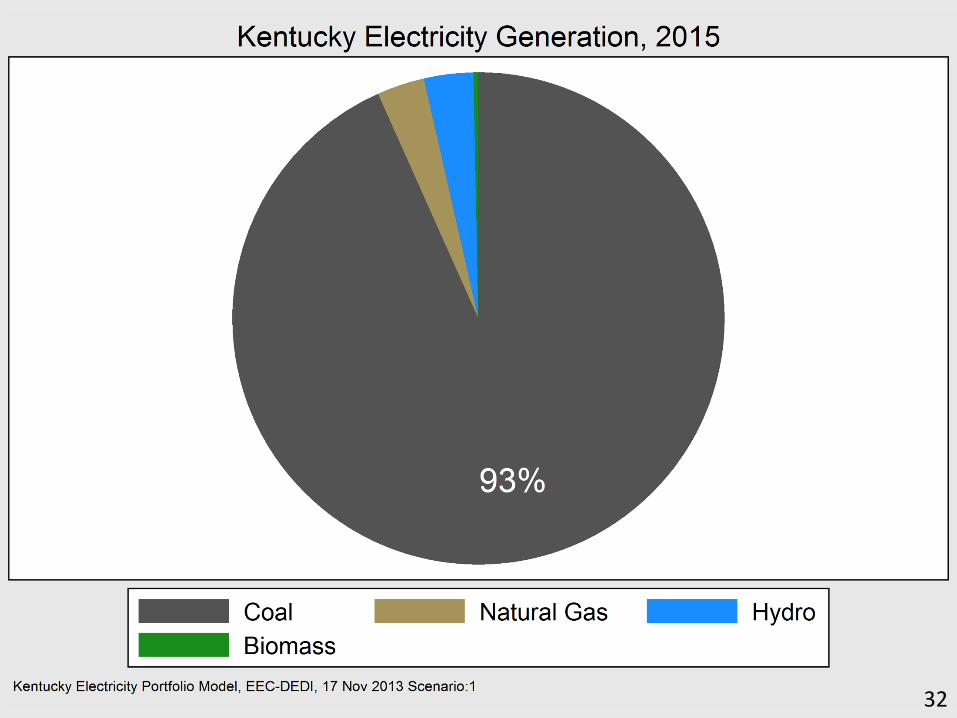
Over 92% of the electricity
generated in Kentucky in 2012 and
2013 came from Kentucky’s coal-
fired power plants.
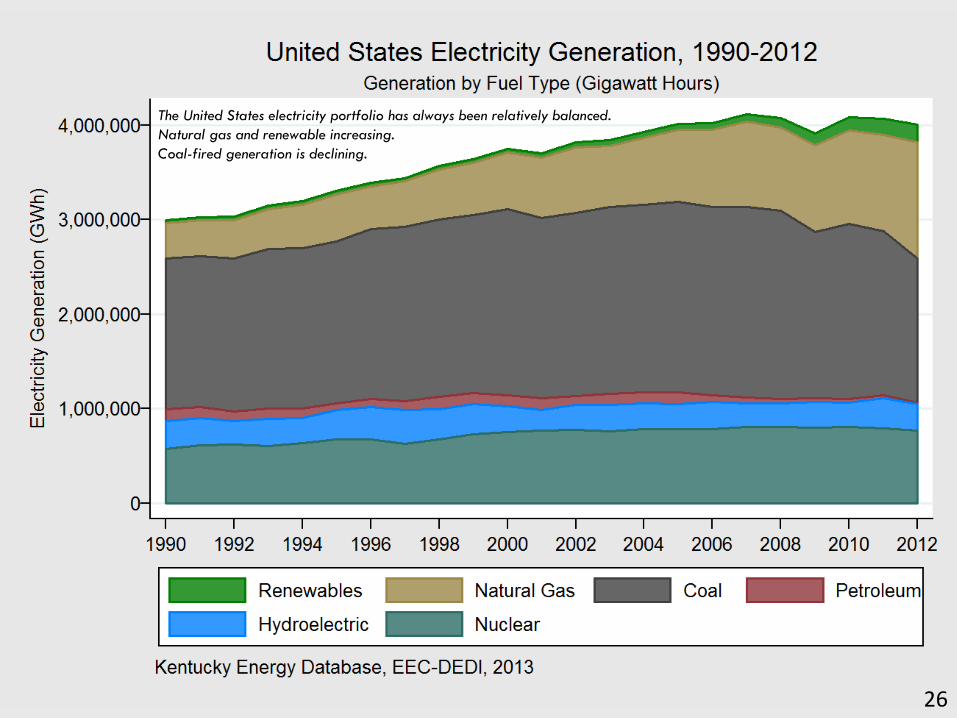
26
The United States electricity portfolio has always been relatively balanced.
Natural gas and renewable increasing.
Coal-fired generation is declining.
27
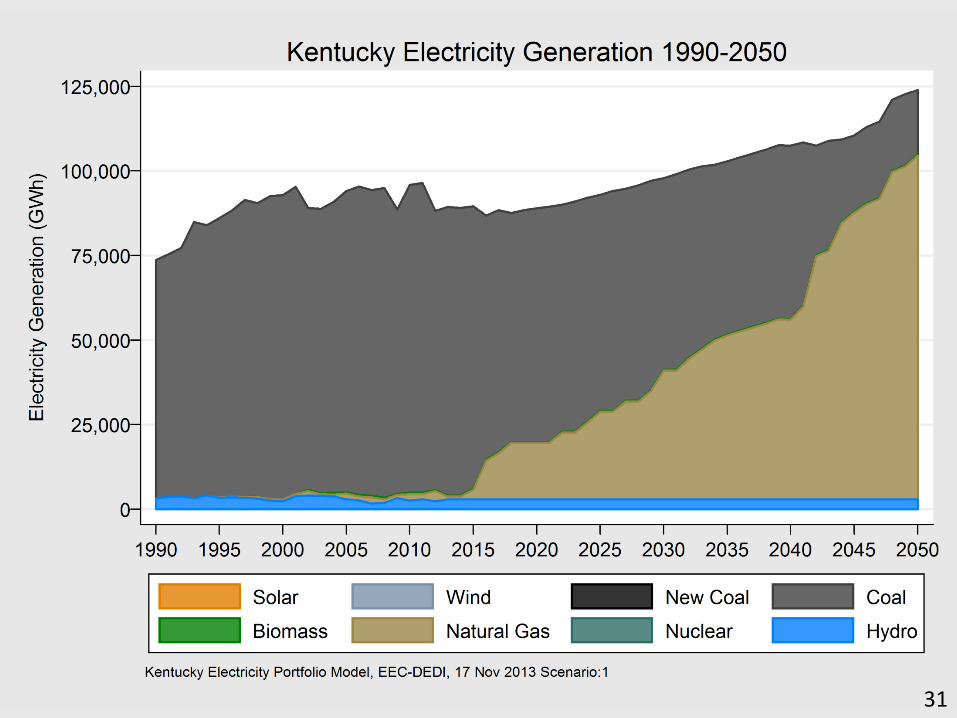
Kentucky has always depended upon coal.
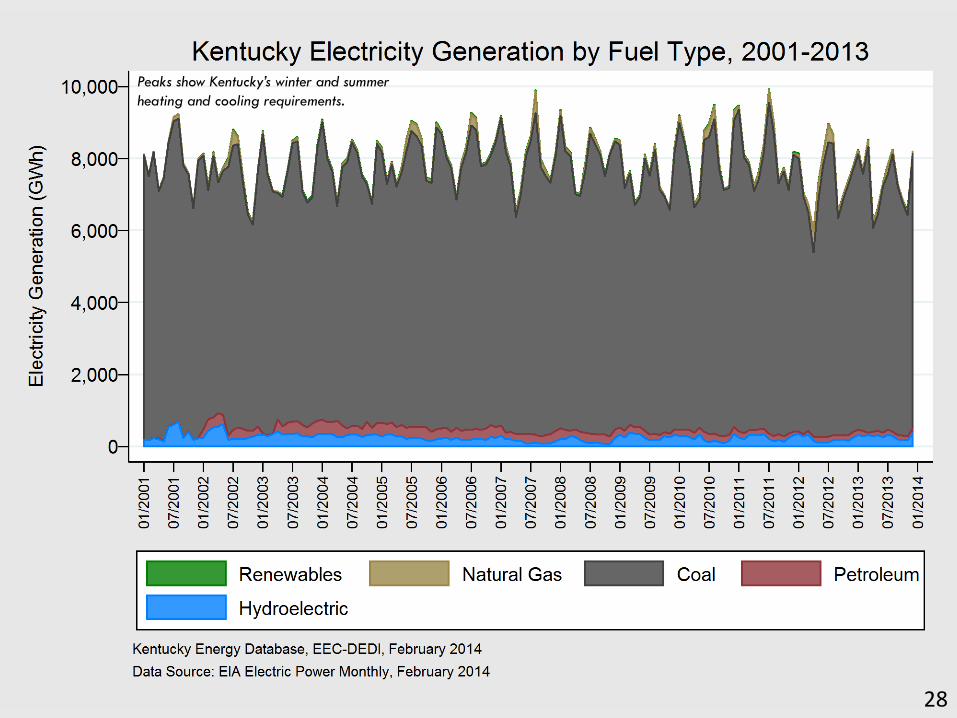
Peaks show Kentucky’s winter and summer
heating and cooling requirements.
28
Kentucky’s Future Electricity Portfolio
29
A Quick Introduction to
Download the Full Report “Economic Challenges Facing Kentucky’s Electricity Generation Under Greenhouse Gas Constraints”
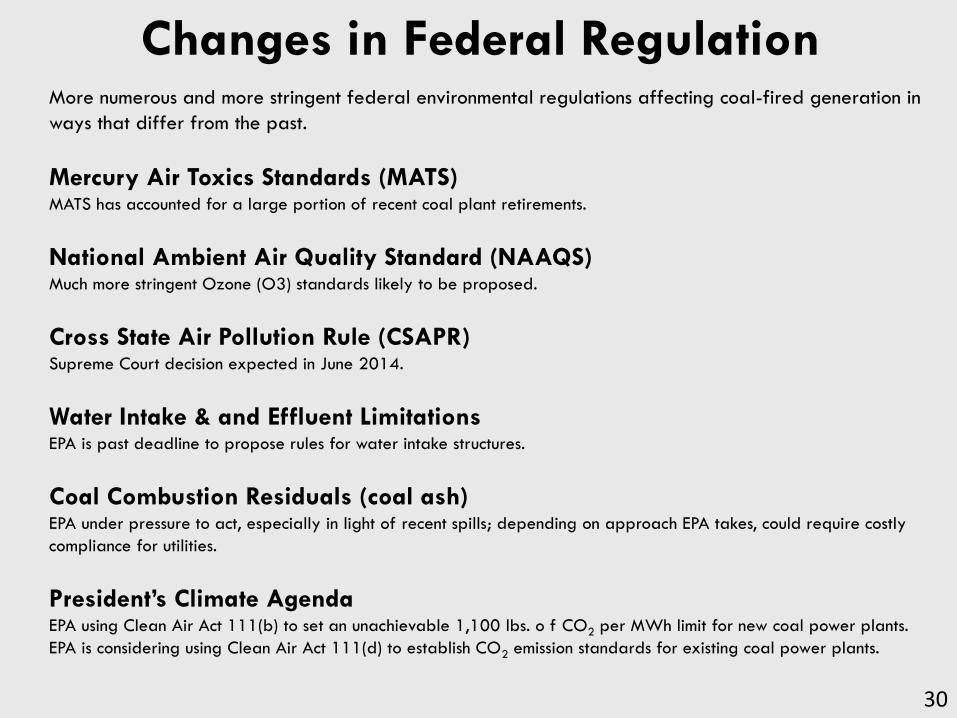
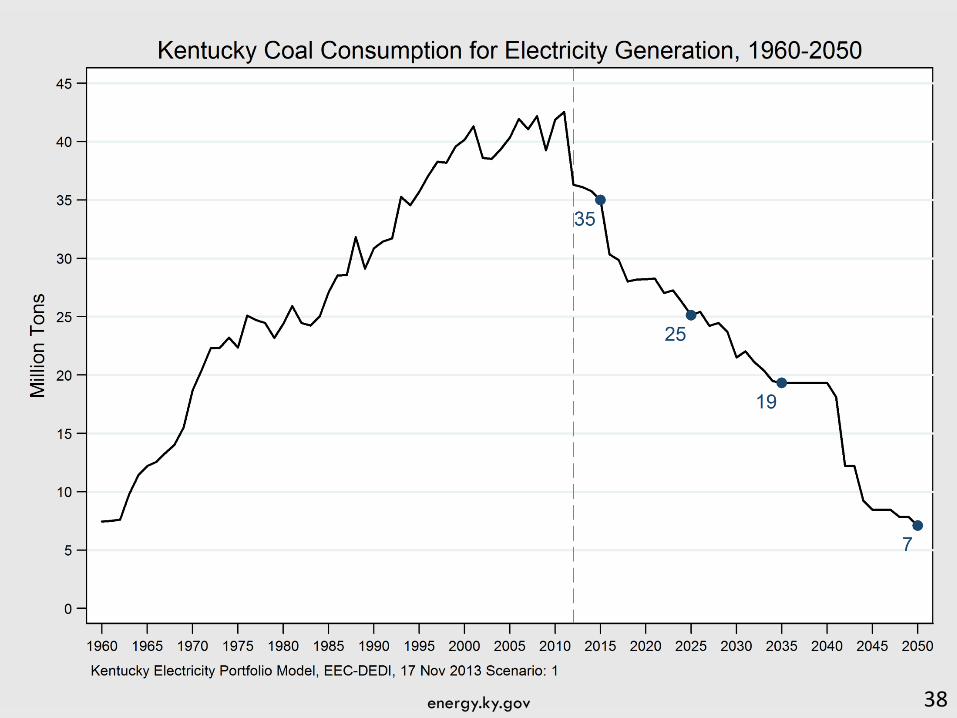
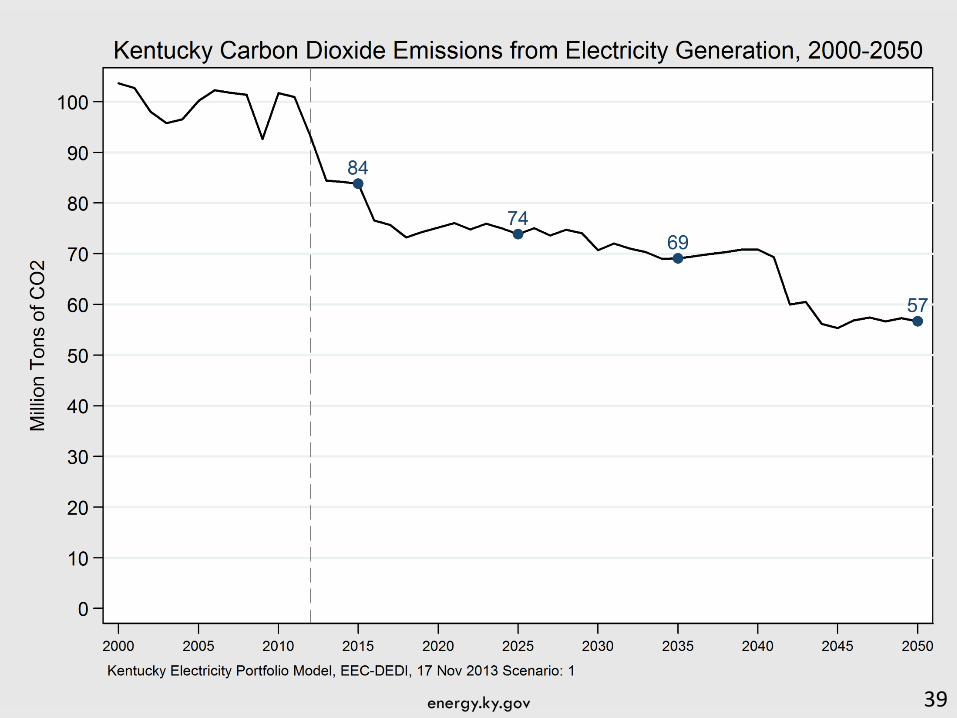
More numerous and more stringent federal environmental regulations affecting coal-fired generation in
ways that differ from the past.
Mercury Air Toxics Standards (MATS) MATS has accounted for a large portion of recent coal plant retirements.
National Ambient Air Quality Standard (NAAQS) Much more stringent Ozone (O3) standards likely to be proposed.
Cross State Air Pollution Rule (CSAPR) Supreme Court decision expected in June 2014.
Water Intake & and Effluent Limitations EPA is past deadline to propose rules for water intake structures.
Coal Combustion Residuals (coal ash) EPA under pressure to act, especially in light of recent spills; depending on approach EPA takes, could require costly
compliance for utilities.
President’s Climate Agenda EPA using Clean Air Act 111(b) to set an unachievable 1,100 lbs. o f CO2 per MWh limit for new coal power plants.
EPA is considering using Clean Air Act 111(d) to establish CO2 emission standards for existing coal power plants.
Changes in Federal Regulation
30
31
32
33

34
35
36
37
energy.ky.gov 38
energy.ky.gov 39
Significance of Electricity to Kentucky
40
Download the Full Report
“The Vulnerability of Kentucky’s Manufacturing Economy to Increasing Electricity Prices”
energy.ky.gov 41
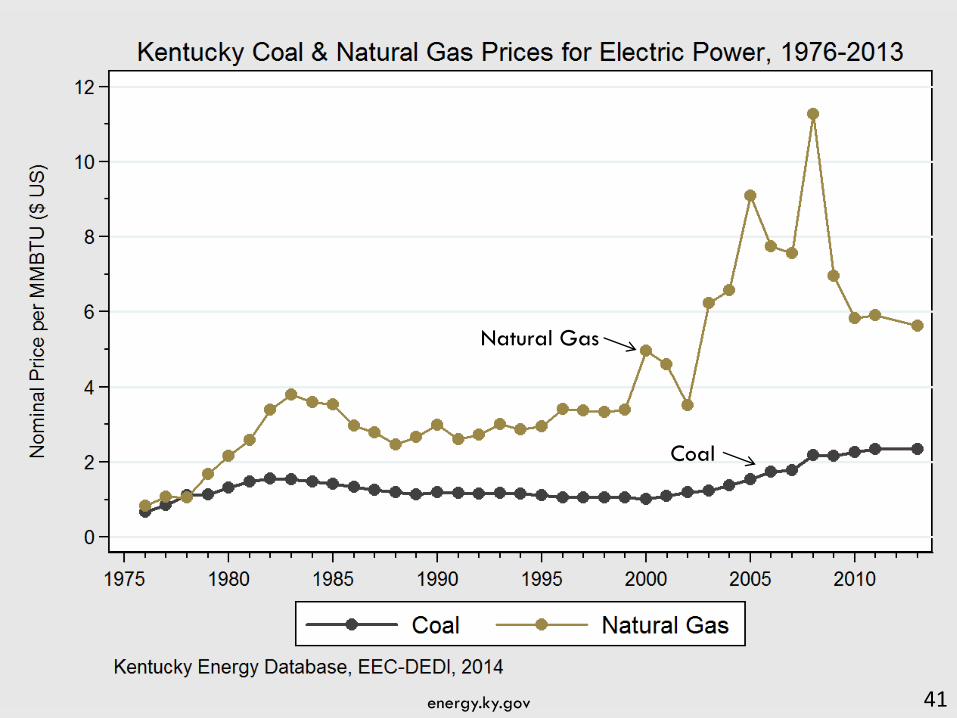
Natural Gas
Coal
energy.ky.gov 42
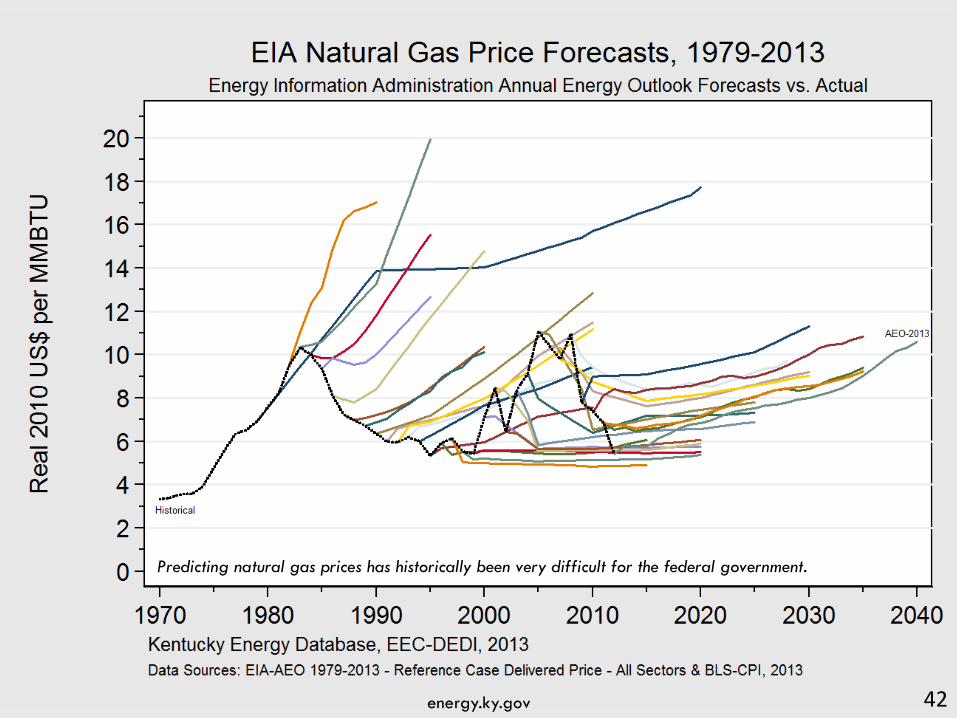
Predicting natural gas prices has historically been very difficult for the federal government.
43
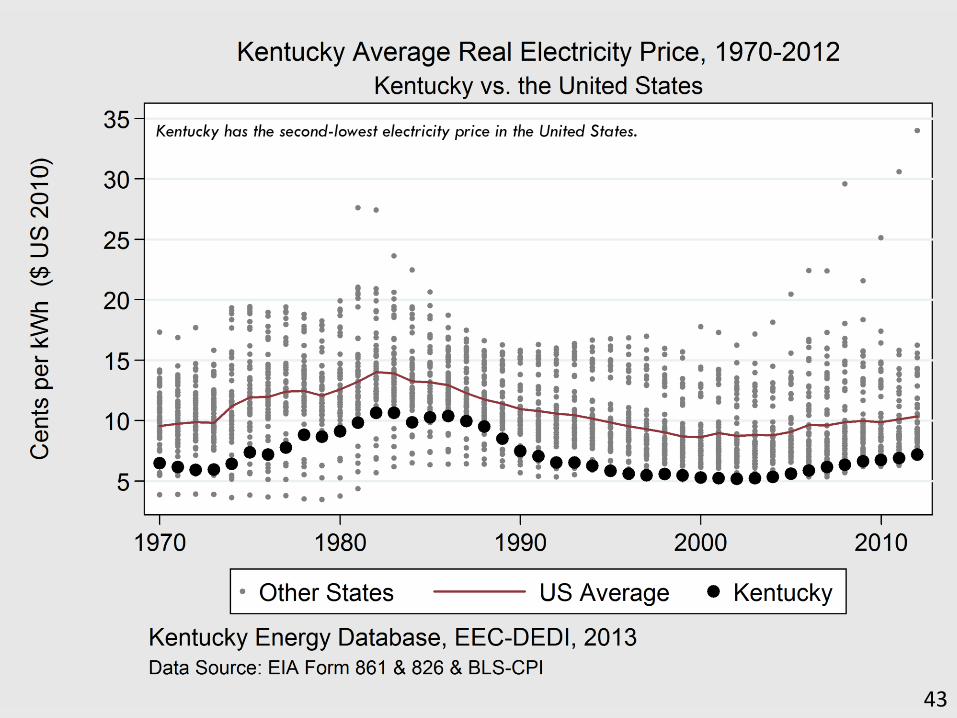
Kentucky has the second-lowest electricity price in the United States.
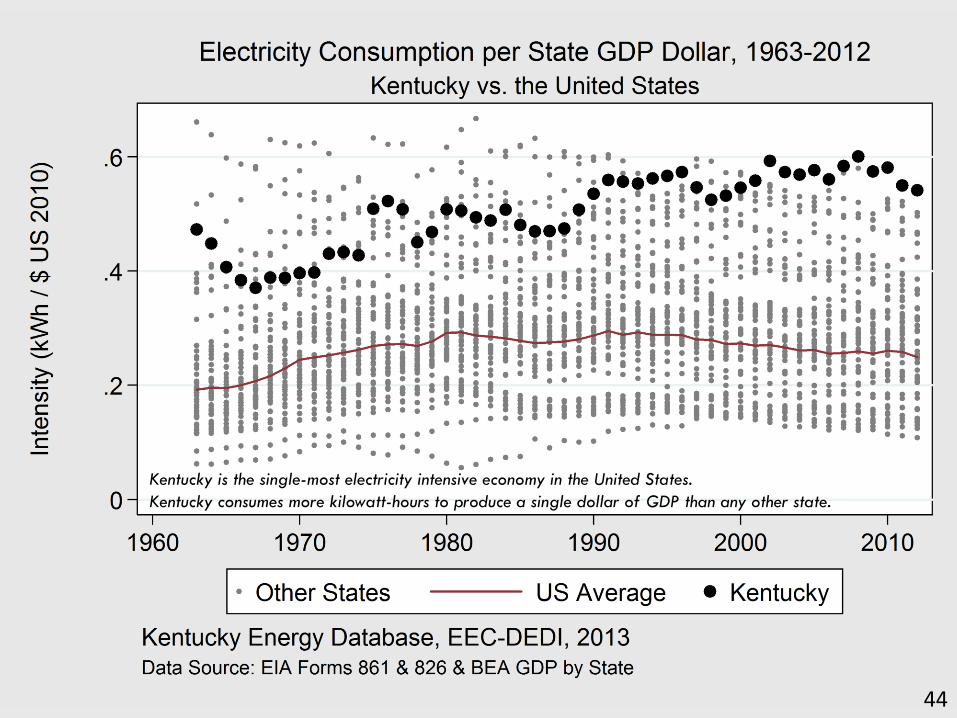
44
Kentucky is the single-most electricity intensive economy in the United States.
Kentucky consumes more kilowatt-hours to produce a single dollar of GDP than any other state.
45
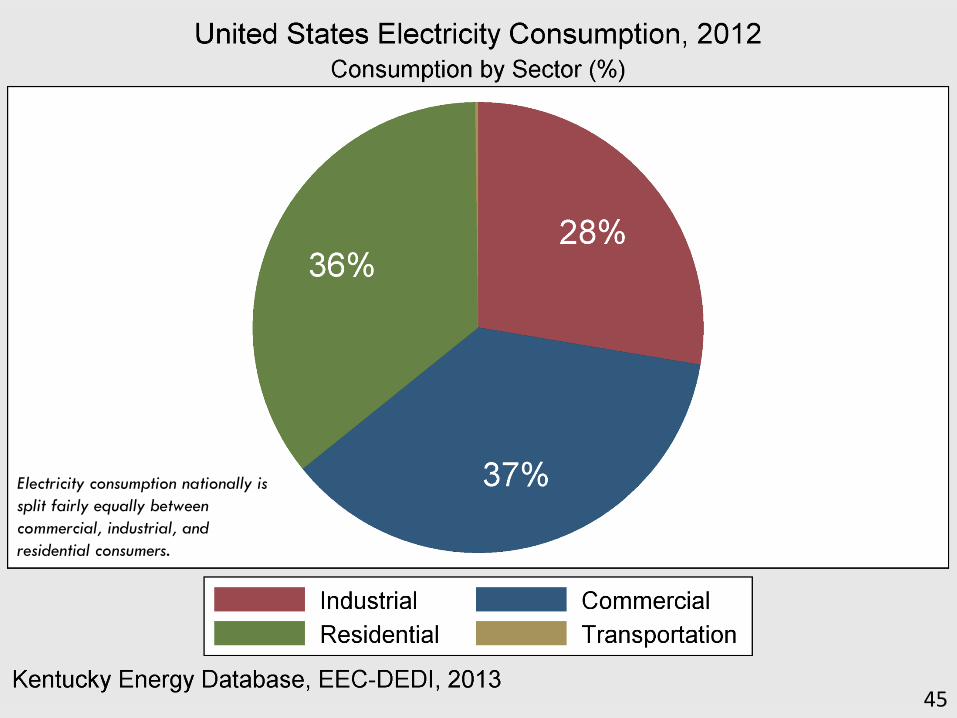
Electricity consumption nationally is
split fairly equally between
commercial, industrial, and
residential consumers.
46
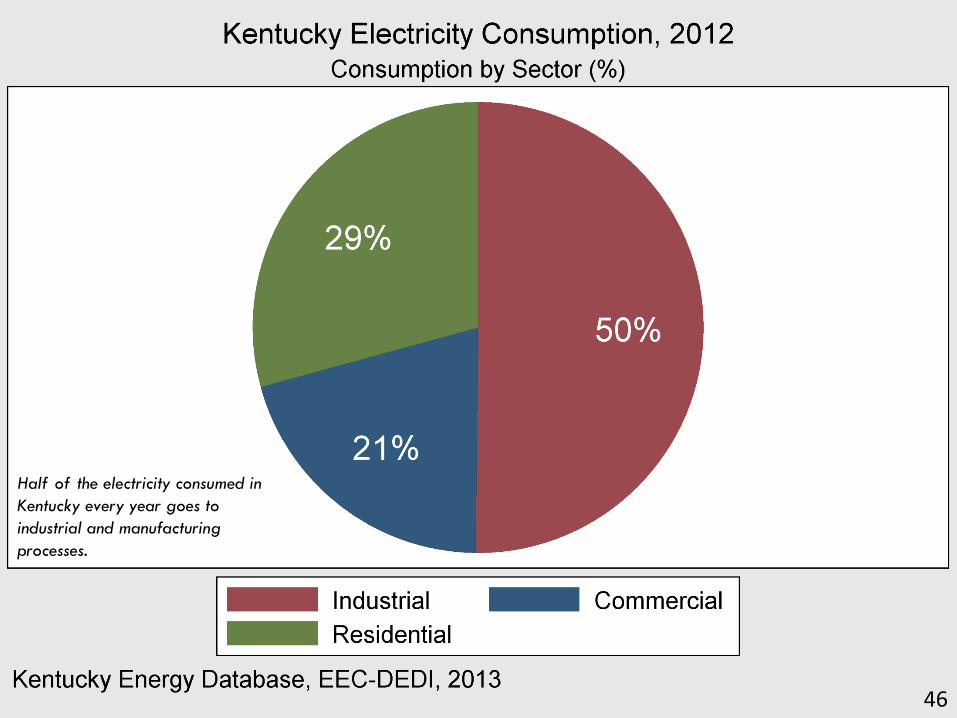
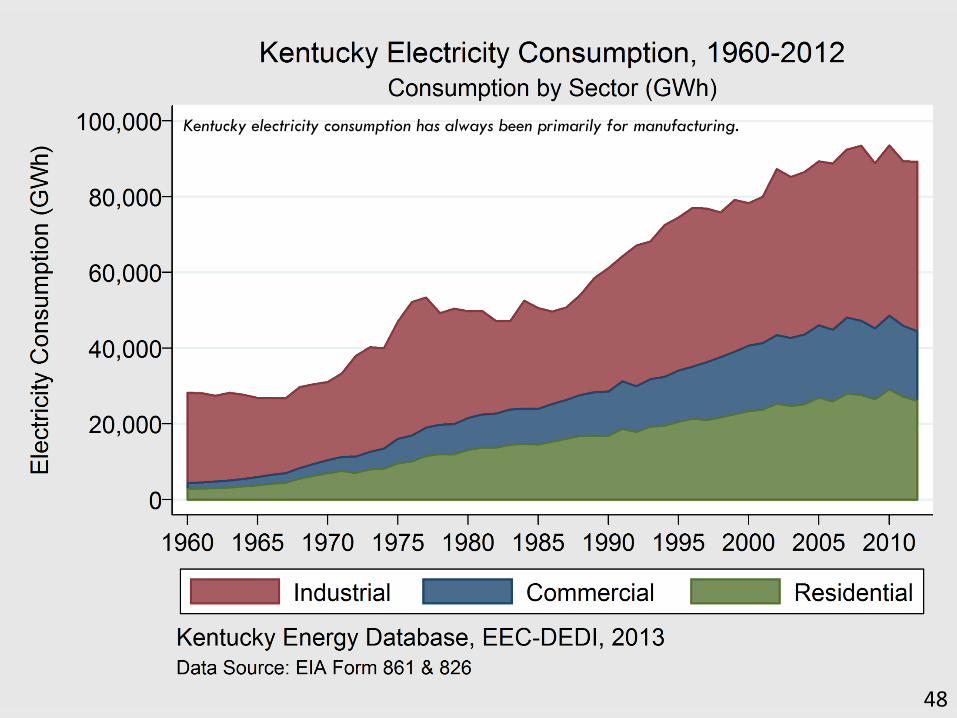
Half of the electricity consumed in
Kentucky every year goes to
industrial and manufacturing
processes.
47
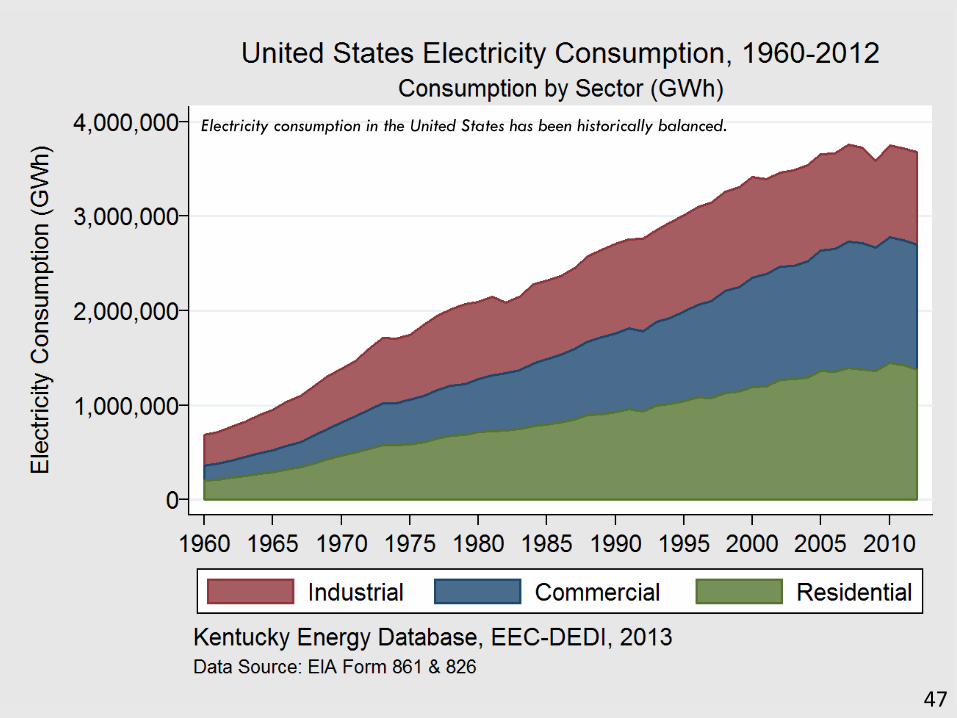
Electricity consumption in the United States has been historically balanced.
48
Kentucky electricity consumption has always been primarily for manufacturing.
Kentucky Electricity Portfolio & Employment
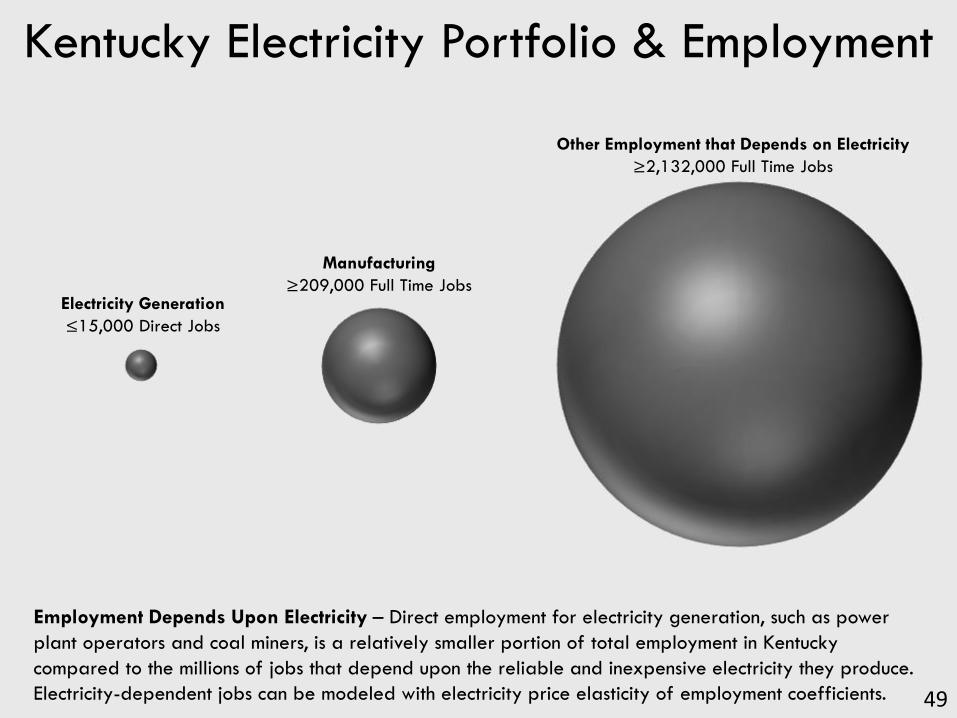
Other Employment that Depends on Electricity
≥2,132,000 Full Time Jobs
Electricity Generation
≤15,000 Direct Jobs
Employment Depends Upon Electricity – Direct employment for electricity generation, such as power
plant operators and coal miners, is a relatively smaller portion of total employment in Kentucky
compared to the millions of jobs that depend upon the reliable and inexpensive electricity they produce.
Electricity-dependent jobs can be modeled with electricity price elasticity of employment coefficients.
Manufacturing
≥209,000 Full Time Jobs
49
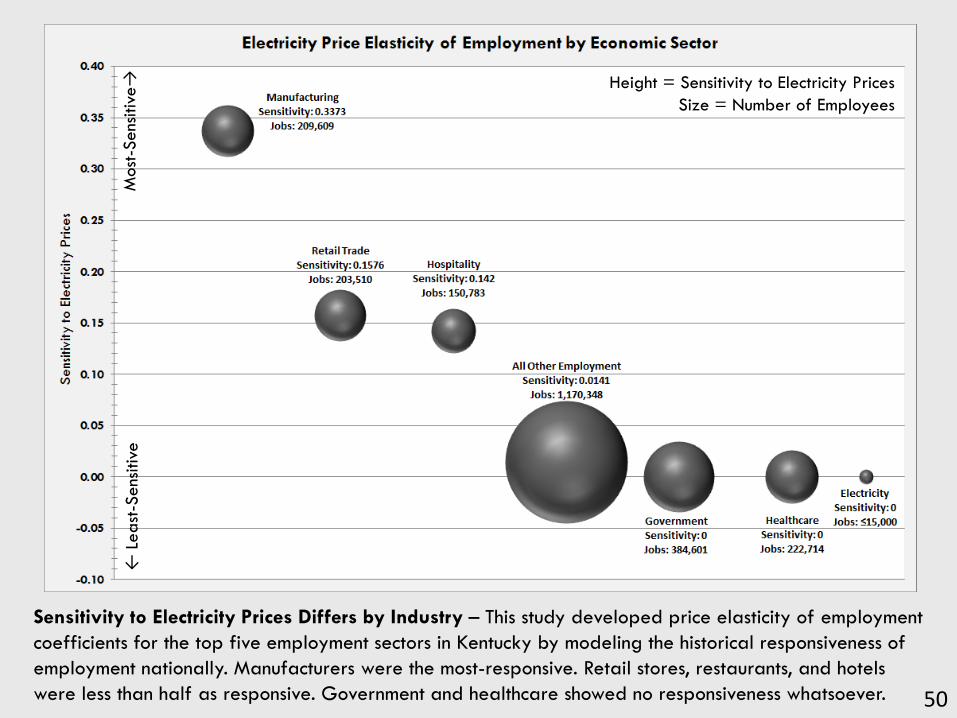
Sensitivity to Electricity Prices Differs by Industry – This study developed price elasticity of employment
coefficients for the top five employment sectors in Kentucky by modeling the historical responsiveness of
employment nationally. Manufacturers were the most-responsive. Retail stores, restaurants, and hotels
were less than half as responsive. Government and healthcare showed no responsiveness whatsoever.
Height = Sensitivity to Electricity Prices
Size = Number of Employees
Most
-Sens
itiv
e→
←
Least
-Sens
itiv
e
50
51
Intensity
Rank Manufacturing Sector
Kilowatt-hours
per $ of Product
Kentucky Electricity
Cost
per $ of Product
Percentage
of Production
Costs
Kentucky
Workers
1 Aluminum Smelting 4.37313 $0.236 23.6% 3,482
2 Iron & Steel Mills 1.5764 $0.085 8.5% 2,954
4 Basic Chemical 0.71269 $0.039 3.9% 3,043
5 Glass Manufacturing 0.60508 $0.033 3.3% 2,015
24 Motor Vehicle Parts 0.14747 $0.008 0.8% 16,660
52 Motor Vehicle Assembly 0.03654 $0.002 0.2% 11,384
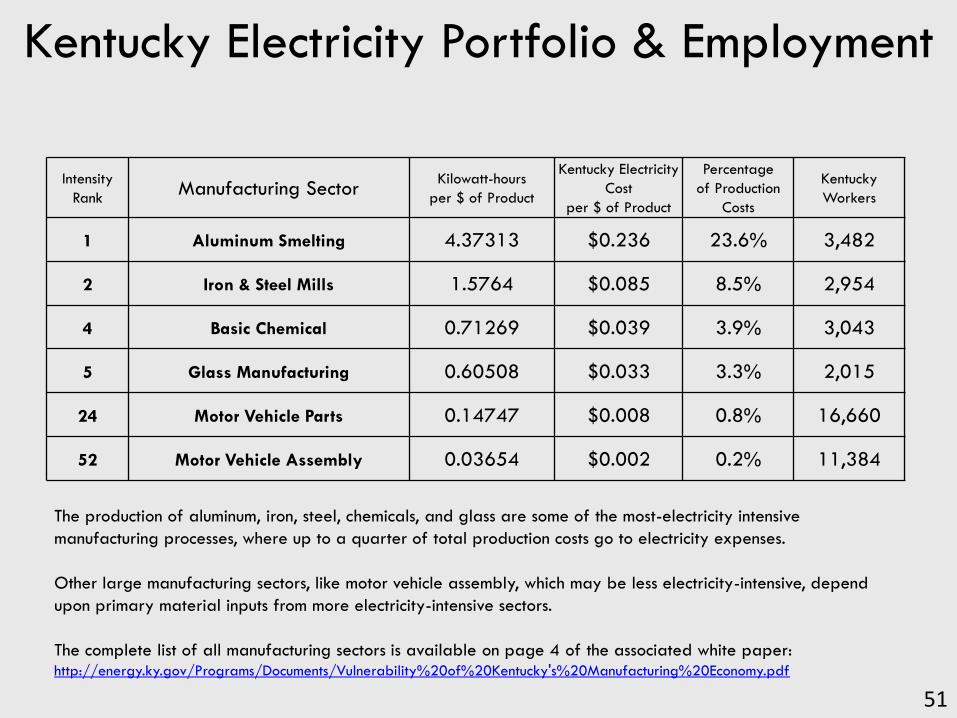
The production of aluminum, iron, steel, chemicals, and glass are some of the most-electricity intensive
manufacturing processes, where up to a quarter of total production costs go to electricity expenses.
Other large manufacturing sectors, like motor vehicle assembly, which may be less electricity-intensive, depend
upon primary material inputs from more electricity-intensive sectors.
The complete list of all manufacturing sectors is available on page 4 of the associated white paper: http://energy.ky.gov/Programs/Documents/Vulnerability%20of%20Kentucky's%20Manufacturing%20Economy.pdf
Kentucky Electricity Portfolio & Employment
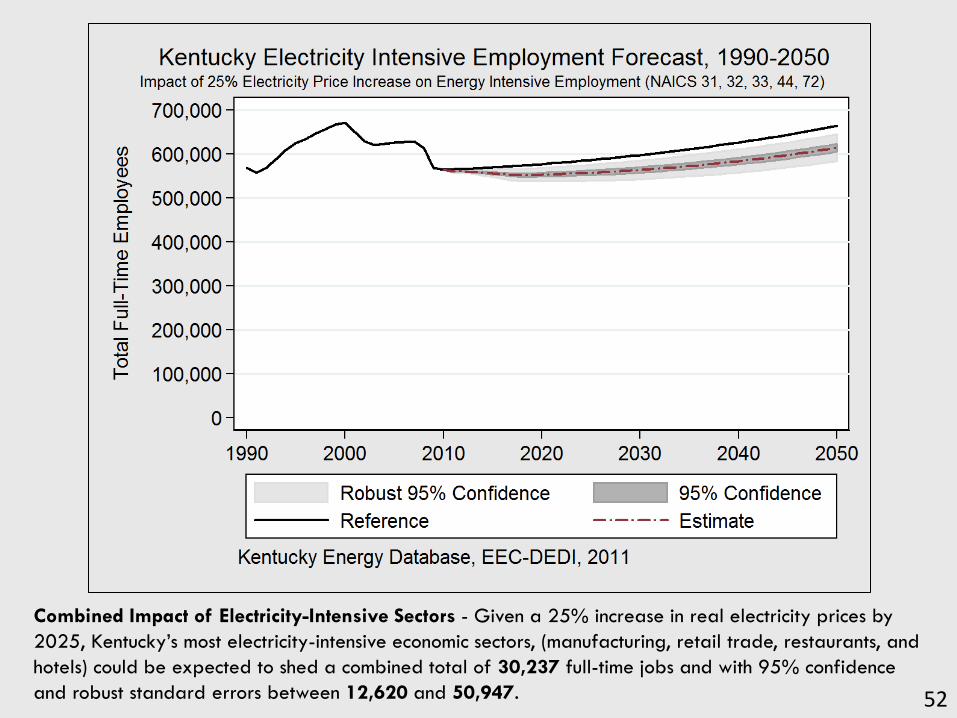
Combined Impact of Electricity-Intensive Sectors - Given a 25% increase in real electricity prices by
2025, Kentucky’s most electricity-intensive economic sectors, (manufacturing, retail trade, restaurants, and
hotels) could be expected to shed a combined total of 30,237 full-time jobs and with 95% confidence
and robust standard errors between 12,620 and 50,947. 52

Contact Information
Aron Patrick
Assistant Director
Kentucky Energy and Environment Cabinet
Department for Energy Development & Independence
502-564-7192
Twitter: @KYDEDI
Facebook: facebook.com/KentuckyDEDI
Website: energy.ky.gov
53