Embed Size (px)
Citation preview
Kentucky Water Resources Research InstituteAnnual Technical Report
FY 2007
Kentucky Water Resources Research Institute Annual Technical Report FY 2007 1

Introduction
The 2007 Annual Technical Report for Kentucky consolidates reporting requirements of the Section 104(b)base grant award into a single document that includes: 1) a synopsis of each student research enhancementproject conducted during the period, 2) citations for related publications, reports, and presentations, 3) adescription of information transfer activities, 4) a summary of student support during the reporting period, and5) notable awards and achievements during the year.
Introduction 1
Research Program Introduction
The activities supported by the Secton 104(b) program funds and required matching are interwoven into thetotal program of the Kentucky Water Resources Research Institute. Additional research, service, andtechnology transfer activities were funded through a variety of other sponsors. Memoranda of Agreementprojects with the Kentucky Division of Water included TMDL development for several Kentucky streams.Three projects were funded by the Kentucky Cabinet for Health and Family Services (related to technicalissues involving radiation and other contaminants at the Maxey Flats Nuclear Disposal Site and the PaducahGaseous Diffusion Plant). The Kentucky River Authority supported watershed management services for theKentucky River basin. The National Institute of Environmental Health Sciences supported research translationactivities through the Superfund Public Outreach Program. The Metropolitan Sewer District funded activitiesaddressing Beargrass Creek combined sewer overflows in Louisville. The Kentucky Department forEnvironmental Protection also supported 5 students through an Environmental Protection ScholarshipProgram coordinated by the Institute.
The Kentucky Consortium for Energy and the Environment, led by Lindell Ormsbee (Director of KWRRI),continued as a collaborative program integrating faculty and students from the University of Kentucky, theUniversity of Louisville, and Murray State University. The consortium was funded through the Department ofEnergy to assist with efforts supporting a variety of environmental assessment and cleanup activities at thePaducah Gasous Diffusion Plant. Over 20 technical projects supported through the consortium presentedresults during 2007 at a special technical symposium.
Nine student research enhancement projects received support through 104(b) FY2007 funding. Projects wereconducted at the University of Kentucky (5), Eastern Kentucky University (1), Murray State University (1),Northern Kentucky University (1), and Morehead State University (1). Projects represented a variety ofdiscipline areas: civil engineering (3), geology (2), biology (2), forestry (1), and geography (1). The goal ofthis approach is to support a number of small student−based efforts representing a variety of discipline areasat numerous institutions. Many state agencies are currently experiencing a significant loss of personnelthrough retirement and it is critical that undergraduate and graduate students are well trained and available tohelp fill this void. Project completion synopses for the nine projects follow. Each project presented theirresults at the Kentucky Water Resources Annual Symposium on March 17, 2008.
Research Program Introduction 1
Assessment of Pathogen Trends in the Upper Forks of theKentucky River Basin
Basic Information
Title:Assessment of Pathogen Trends in the Upper Forks of the Kentucky RiverBasin
Project Number: 2007KY103B
Start Date: 3/1/2007
End Date: 2/29/2008
Funding Source:104B
Congressional District:KY 5th and 6th
Research Category:Water Quality
Focus Category:Water Quality, Surface Water, Non Point Pollution
Descriptors: fecal coliform bacteria
Principal Investigators: Chandramouli Viswanathan
Publication
Viswanathan, Chandramouli, 2008, Assessment of Water Qaulity Trends in the Upper Forks of theKentucky River Basin: Focus on Pathogen Impairment, in Proceedings of the Kentucky WaterResources Annual Symposium, Kentucky Water Resources Research Institute, Lexington, Kentucky,p 59−60.
1.
Assessment of Pathogen Trends in the Upper Forks of the Kentucky River Basin 1
Problem and Research Objectives This project consisted of analyzing existing water quality data for streams in the North Fork of the Kentucky River Basin with a focus on pathogen trends. According to the most recent 303(d) list of Kentucky waters, the majority of stream segments assessed in the North Fork are impaired for primary contact recreation as a result of pathogens. The state pathogen standard for primary contact recreation is expressed in a dual form which specifies that the 30-day geometric mean of fecal coliform counts not exceed 200 colonies per 100 mL (on a minimum of five samples) and not more than 20 percent of samples should exceed 400 colonies per 100 mL (401 KAR5:031, 2002). Historical monitoring data were utilized to assess fecal coliform concentrations and to evaluate the level of success of previous and ongoing water quality projects in the basin. These projects are being funded and implemented through Section 319(h) of the EPA Clean Water Act, Eastern Kentucky PRIDE, the US Army Corps of Engineers 531 wastewater program, and the Kentucky Wastewater Program to reduce the level of pathogens in the basin. The assessment utilized monitoring data obtained from four different sources: 1) the Kentucky Division of Water (KYDOW) ambient water quality network, 2) the KYDOW focused sampling network, 3) the Kentucky Watershed Watch network (citizen volunteer sampling), and 4) a supplemental University of Kentucky monitoring network. The evaluation involved analysis of the combined data sets using standard statistical measures to assess pathogen trends and project impacts.
Methodology A data assessment framework developed in the initial stages of the study included deterministic and stochastic (statistical) approaches to evaluate conditions at four spatial levels (Figure 1). Principal Findings and Significance
Geometric means of fecal concentrations calculated as aggregate annual values for all of the regional data show a general decrease over the past 10 years. Maximum annual concentrations for the region show a more variable pattern with some higher levels in recent years. Long-term (1994-1998 versus 1999-2006) and short-term (2000-2003 versus 2004-2006) cumulative density function (CDF) comparisons suggest that fecal coliform concentrations have generally decreased on a regional basis. The probabilities of concentrations less than 200 counts/100 mL and less than 400 counts/100 mL have increased over the last five years indicating improvement in water quality (Figures 2 and 3).
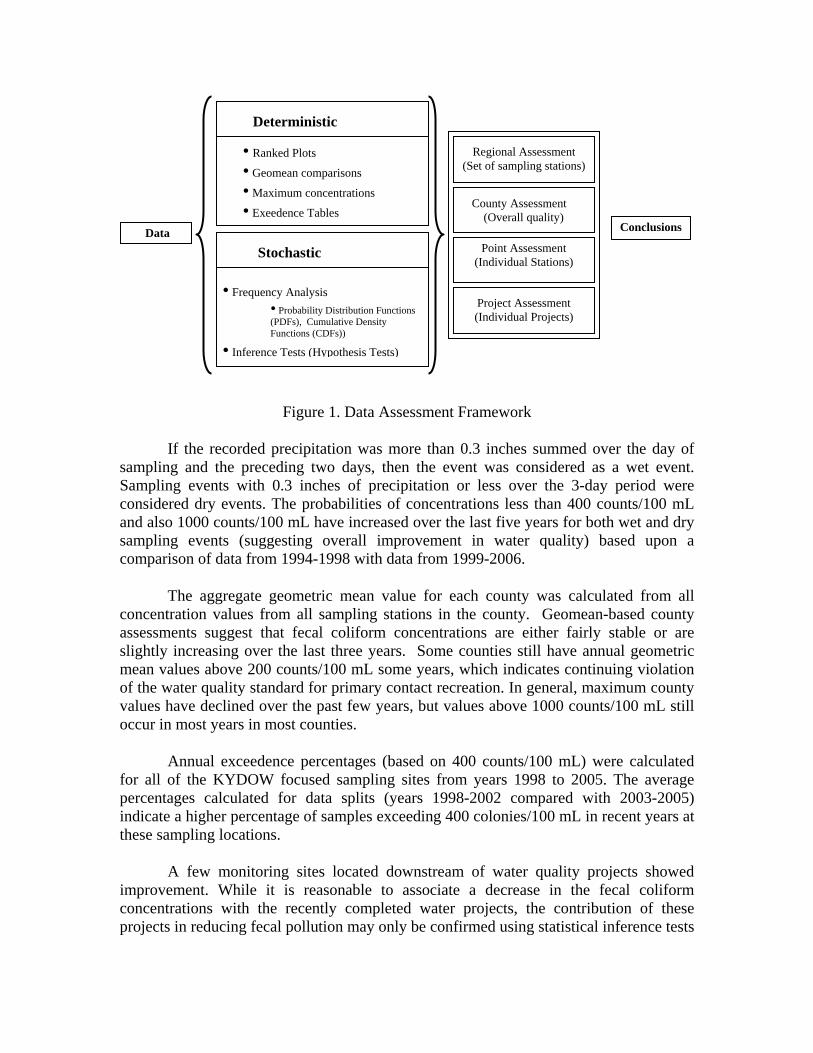
Figure 1. Data Assessment Framework If the recorded precipitation was more than 0.3 inches summed over the day of sampling and the preceding two days, then the event was considered as a wet event. Sampling events with 0.3 inches of precipitation or less over the 3-day period were considered dry events. The probabilities of concentrations less than 400 counts/100 mL and also 1000 counts/100 mL have increased over the last five years for both wet and dry sampling events (suggesting overall improvement in water quality) based upon a comparison of data from 1994-1998 with data from 1999-2006.
The aggregate geometric mean value for each county was calculated from all concentration values from all sampling stations in the county. Geomean-based county assessments suggest that fecal coliform concentrations are either fairly stable or are slightly increasing over the last three years. Some counties still have annual geometric mean values above 200 counts/100 mL some years, which indicates continuing violation of the water quality standard for primary contact recreation. In general, maximum county values have declined over the past few years, but values above 1000 counts/100 mL still occur in most years in most counties.
Annual exceedence percentages (based on 400 counts/100 mL) were calculated for all of the KYDOW focused sampling sites from years 1998 to 2005. The average percentages calculated for data splits (years 1998-2002 compared with 2003-2005) indicate a higher percentage of samples exceeding 400 colonies/100 mL in recent years at these sampling locations.
A few monitoring sites located downstream of water quality projects showed improvement. While it is reasonable to associate a decrease in the fecal coliform concentrations with the recently completed water projects, the contribution of these projects in reducing fecal pollution may only be confirmed using statistical inference tests
Point Assessment (Individual Stations)
Regional Assessment (Set of sampling stations)
County Assessment (Overall quality)
Project Assessment (Individual Projects)
Conclusions Data
Deterministic
Stochastic
• Ranked Plots
• Geomean comparisons
• Maximum concentrations
• Exeedence Tables
• Frequency Analysis • Probability Distribution Functions (PDFs), Cumulative Density Functions (CDFs))
• Inference Tests (Hypothesis Tests)
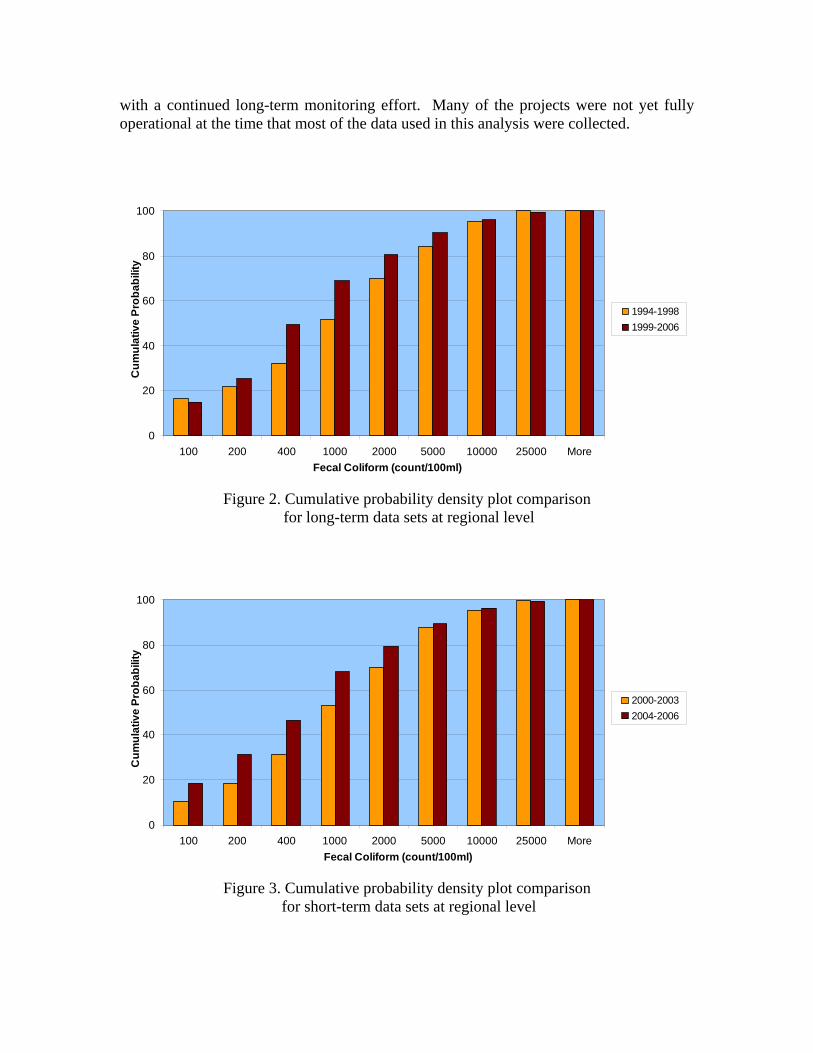
with a continued long-term monitoring effort. Many of the projects were not yet fully operational at the time that most of the data used in this analysis were collected.
0
20
40
60
80
100
100 200 400 1000 2000 5000 10000 25000 MoreFecal Coliform (count/100ml)
Cum
ulat
ive
Prob
abili
ty
1994-19981999-2006
Figure 2. Cumulative probability density plot comparison
for long-term data sets at regional level
0
20
40
60
80
100
100 200 400 1000 2000 5000 10000 25000 MoreFecal Coliform (count/100ml)
Cum
ulat
ive
Prob
abili
ty
2000-20032004-2006
Figure 3. Cumulative probability density plot comparison
for short-term data sets at regional level
Effectiveness of Improved Skid Trail Ephemeral ChannelCrossings
Basic Information
Title: Effectiveness of Improved Skid Trail Ephemeral Channel Crossings
Project Number: 2007KY87B
Start Date: 3/1/2007
End Date: 2/29/2008
Funding Source:104B
Congressional District:KY 6th
Research Category:Water Quality
Focus Category:Hydrology, Sediments, Non Point Pollution
Descriptors: sediment, stream crossings, logging best management practices
Principal Investigators: Jeffrey W Stringer
Publication
Stringer, Jeffrey, and Christopher Reeves, 2008, Effectiveness of Improved Skid Trail HeadwaterStream Crossings, in Proceedings of the Kentucky Water Resources Annual Symposium, KentuckyWater Resources Research Institute, Lexington, Kentucky, p 21.
1.
Effectiveness of Improved Skid Trail Ephemeral Channel Crossings 1
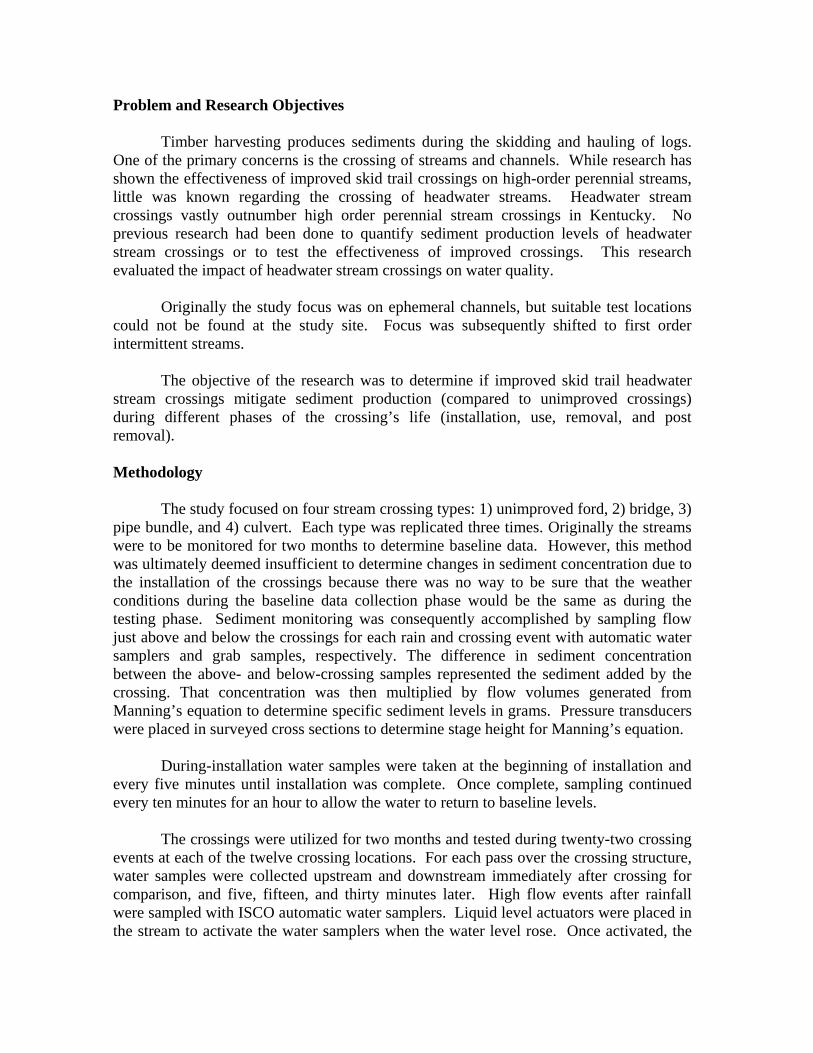
Problem and Research Objectives
Timber harvesting produces sediments during the skidding and hauling of logs. One of the primary concerns is the crossing of streams and channels. While research has shown the effectiveness of improved skid trail crossings on high-order perennial streams, little was known regarding the crossing of headwater streams. Headwater stream crossings vastly outnumber high order perennial stream crossings in Kentucky. No previous research had been done to quantify sediment production levels of headwater stream crossings or to test the effectiveness of improved crossings. This research evaluated the impact of headwater stream crossings on water quality.
Originally the study focus was on ephemeral channels, but suitable test locations
could not be found at the study site. Focus was subsequently shifted to first order intermittent streams.
The objective of the research was to determine if improved skid trail headwater
stream crossings mitigate sediment production (compared to unimproved crossings) during different phases of the crossing’s life (installation, use, removal, and post removal). Methodology The study focused on four stream crossing types: 1) unimproved ford, 2) bridge, 3) pipe bundle, and 4) culvert. Each type was replicated three times. Originally the streams were to be monitored for two months to determine baseline data. However, this method was ultimately deemed insufficient to determine changes in sediment concentration due to the installation of the crossings because there was no way to be sure that the weather conditions during the baseline data collection phase would be the same as during the testing phase. Sediment monitoring was consequently accomplished by sampling flow just above and below the crossings for each rain and crossing event with automatic water samplers and grab samples, respectively. The difference in sediment concentration between the above- and below-crossing samples represented the sediment added by the crossing. That concentration was then multiplied by flow volumes generated from Manning’s equation to determine specific sediment levels in grams. Pressure transducers were placed in surveyed cross sections to determine stage height for Manning’s equation.
During-installation water samples were taken at the beginning of installation and
every five minutes until installation was complete. Once complete, sampling continued every ten minutes for an hour to allow the water to return to baseline levels.
The crossings were utilized for two months and tested during twenty-two crossing
events at each of the twelve crossing locations. For each pass over the crossing structure, water samples were collected upstream and downstream immediately after crossing for comparison, and five, fifteen, and thirty minutes later. High flow events after rainfall were sampled with ISCO automatic water samplers. Liquid level actuators were placed in the stream to activate the water samplers when the water level rose. Once activated, the
samplers took a water sample every ten minutes until the water levels subsided. Once completed, a composite sample for the entire rain event was taken from the samplers and concentration levels were determined.
Removal measurements were combined with the post removal measurements
because during removal there were no flows at all because of the drought. It was assumed that all sediment generated from removal would be caught in rain events after the crossing structures were removed. Rain events were monitored for three months after crossing removal.
ANOVA analyses were used to determine significant differences in sediment
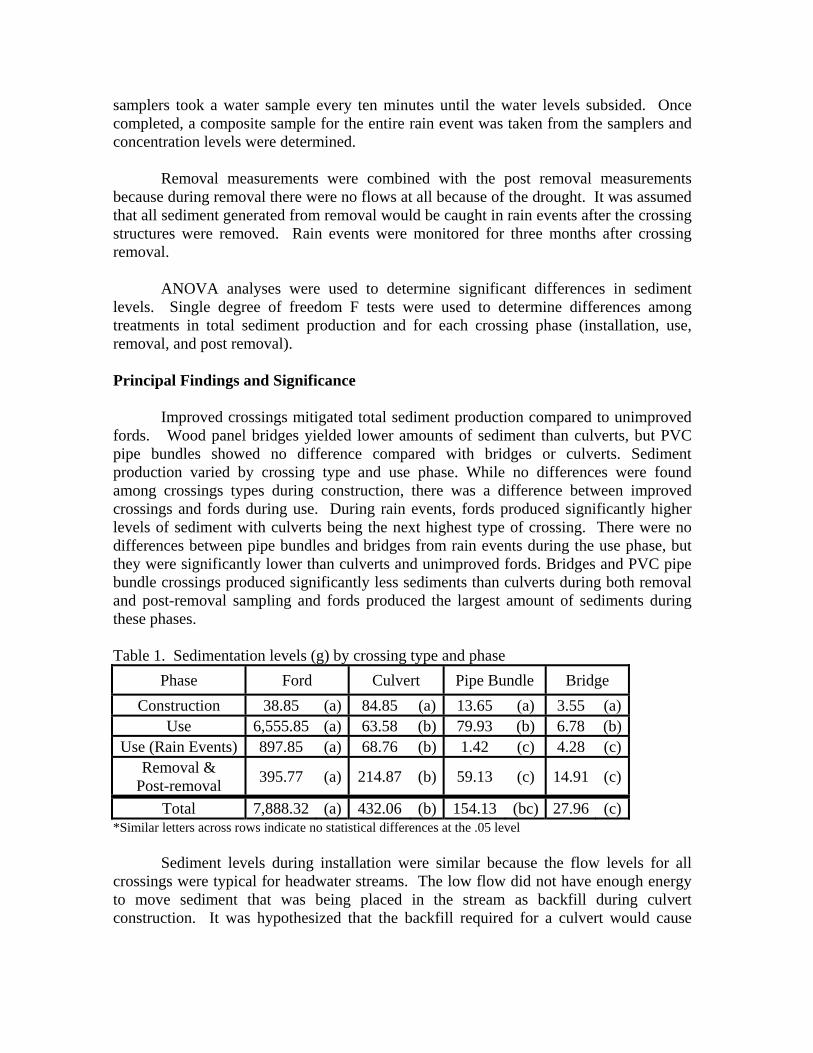
levels. Single degree of freedom F tests were used to determine differences among treatments in total sediment production and for each crossing phase (installation, use, removal, and post removal). Principal Findings and Significance Improved crossings mitigated total sediment production compared to unimproved fords. Wood panel bridges yielded lower amounts of sediment than culverts, but PVC pipe bundles showed no difference compared with bridges or culverts. Sediment production varied by crossing type and use phase. While no differences were found among crossings types during construction, there was a difference between improved crossings and fords during use. During rain events, fords produced significantly higher levels of sediment with culverts being the next highest type of crossing. There were no differences between pipe bundles and bridges from rain events during the use phase, but they were significantly lower than culverts and unimproved fords. Bridges and PVC pipe bundle crossings produced significantly less sediments than culverts during both removal and post-removal sampling and fords produced the largest amount of sediments during these phases. Table 1. Sedimentation levels (g) by crossing type and phase
Phase Ford Culvert Pipe Bundle Bridge Construction 38.85 (a) 84.85 (a) 13.65 (a) 3.55 (a)
Use 6,555.85 (a) 63.58 (b) 79.93 (b) 6.78 (b) Use (Rain Events) 897.85 (a) 68.76 (b) 1.42 (c) 4.28 (c)
Removal & Post-removal 395.77 (a) 214.87 (b) 59.13 (c) 14.91 (c)
Total 7,888.32 (a) 432.06 (b) 154.13 (bc) 27.96 (c) *Similar letters across rows indicate no statistical differences at the .05 level Sediment levels during installation were similar because the flow levels for all crossings were typical for headwater streams. The low flow did not have enough energy to move sediment that was being placed in the stream as backfill during culvert construction. It was hypothesized that the backfill required for a culvert would cause
significantly higher sediment levels than the other crossing types during installation, but this was not observed.
During the use phase, significantly higher levels of sedimentation were caused by
the skid trail passing directly through the stream fords. Even with low flows, having the skid trail go through the stream drastically impaired water quality. For rain events while the crossings were still in use, the sediment entering the stream from fords was high because any previously dislodged sediment that was not moved by the low energy flow of headwater streams was moved into the stream when high flows eventually did come. Culverts produced significantly lower sediment levels than fords, but higher than pipe bundles and bridges because of the backfill around the pipe. Higher flows during rain events dislodged some of the backfill around the culvert moving sediment into the hydrologic system. Pipe bundles and bridges did not have the backfill in the stream that culverts required. There was backfill for the pipe bundles, but it was generally above the stream level and did not hamper the flow of water though the structure. A geotextile mat between the pipe bundle and the backfill prevented dirt from entering the stream, but allowed water to pass through the mat.
Even though there was no further disturbance occurring after removal of
unimproved fords, they continued to add significant amounts of sediment to streams. Culverts contributed significantly lower amounts of sediment than fords, but higher than pipe bundles and bridges because of the sediment remaining in streams after the culverts were removed. Heavy equipment (bulldozers) attempted to clean out as much backfill as possible from the stream, but with the size limitations of headwater streams, the equipment operators could not fully remove sediment from the channel. Some sediment was always remaining after the backfill was removed and it eventually washed out during a subsequent high flow event.
These findings were presented to the Kentucky Best Management Practices Board that provides recommendations regarding timber harvesting in Kentucky. The board is considering an increased level of scrutiny for protection of headwater streams. The data have also been incorporated in the Master Logger Program. All harvest operations in Kentucky must have an employee who has gone through Master Logger training. This program transferred the information to workers in the field who could apply it immediately to help protect water quality in headwater streams.
Determination of Nutrient Sources in a Eutrophic LakeImpacted by Human Activity
Basic Information
Title:Determination of Nutrient Sources in a Eutrophic Lake Impacted by HumanActivity
Project Number: 2007KY88B
Start Date: 3/1/2007
End Date: 2/29/2008
Funding Source:104B
Congressional District:KY 6th
Research Category:Water Quality
Focus Category:Non Point Pollution, Nutrients, Surface Water
Descriptors: septic systems, cattle pastures, nitrogen sources, Bacteroides
PrincipalInvestigators:
Walter S. Borowski
Publication
Borowski, Walter, and Theresa Aguiar, 2008, Using Nitrogen Isotopes to Trace Nutrient Inputs to aEutrophic Lake, Wilgreen Lake, Madison County, Kentucky, in Proceedings of the Kentucky WaterResources Annual Symposium, Kentucky Water Resources Research Institute, Lexington, Kentucky,p 49.
1.
Aguiar, Theresa, Walter Borowski, Alice Layton, and Larry McKay, 2008, Using MicrobialDistribution and Abundance in a Eutrophic Lake as a Tracer for Nutrient Inputs, Wilgreen Lake,Madison County, Kentucky, in Proceedings of the Kentucky Water Resources Annual Symposium,Kentucky Water Resources Research Institute, Lexington, Kentucky, p 51−52.
2.
Aguiar, Theresa, Walter Borowski, Alice Layton, and Larry McKay, 2008, Using E. coli andBacteroides Distribution and Abundance in a Eutrophic Lake as a Tracer for Nutrient Inputs,Wilgreen Lake, Madison County, Kentucky, in Geological Society of America Abstracts withPrograms, 40(5).
3.
Borowski, Walter, and Theresa Aguiar, 2008, Tracing Nutrient Inputs Into a Eutrophic Lake UsingNitrogen Isotopes, Wilgreen Lake, Madison County, Kentucky, in Geological Society of AmericaAbstracts with Programs, 40(5).
4.
Aguiar, Theresa, and Walter Borowski, 2007, Fecal Microbe Distribution and Abundance Used as aPossible Proxy for Nutrient Source Identification in Eutrophic Wilgreen Lake, Madison County,Kentucky, in Proceedings of Kentucky Academy of Sciences, November 2007.
5.
Determination of Nutrient Sources in a Eutrophic Lake Impacted by Human Activity 1
Problem and Research Objectives
Wilgreen Lake is a eutrophic system formed by damming Taylor Fork, which ultimately feeds Silver Creek and the Kentucky River in Madison County, Kentucky. The lake is designated as “impaired” by the Kentucky Division of Water. Preliminary evidence suggests that the lake is subject to nutrient loading by livestock production, runoff from developed areas, and septic systems. We suspected that much of the excess nutrients entered the lake as a result of septic systems at rural residential homes on half-acre lots lying over karst substrates. Nitrogen isotopes and standard microbial counts were used in concert with microbial quantitative Real Time Polymerase Chain Reaction (qRT-PCR) techniques to identify sources of nutrient input. Objectives of the study were to:
(1) assay microbial populations within lake waters using both conventional (most probable number) and non-conventional (PCR) techniques, and (2) identify the relative proportion of the sources of nutrient input in order to identify potentially effective policies to deter continued nutrient loading. Methodology
Fecal microbe abundance and distribution were used as proxies for nutrient inputs into the lake and to characterize the organic matter of nutrient sources and sinks. Standard microbial counts of Total Coliform and Escherichia coli were performed using IDEXX methods. Lake-wide assays were conducted by sampling at 24 stations (Figure 1), taking particular care to sample more intensively near presumed septic tank sources in the shallow branch of Taylor Fork. The lake was sampled 4 times during summer 2007: 26 June, 17 July, 1 August, and 15 August. We collaborated with Drs. Alice Layton and Larry McKay (University of Tennessee) to perform quantitative Real Time Polymerase Chain Reaction (qRT-PCR) on selected samples in order to measure the proportion of human versus bovine fecal material entering the lake. The technique magnifies DNA from an intestinal microbe, Bacteroides, within water samples. Various strains of Bacteroides are specific to their mammalian host, and DNA libraries were used to recognize these strains during qRT-PCR. Selected samples taken on 26 June 2007 were used for qRT-PCR. To trace nutrients entering the lake, organic matter was measured in sources and sinks using carbon-to-nitrogen (C:N) ratio, carbon isotopic composition (δ13C) and nitrogen isotopic composition (δ15N). Potential anthropogenic sources included fertilizer and human and bovine fecal material. Potential nitrogen sinks within the lake included organic matter residing in sediment, plankton, and macroalgae. Samples were analyzed using an Elemental Analyzer-Gas Chromatograph-Mass Spectrometer operated by Dr. George Kipphut at the Hancock Biological Station (Murray State University).
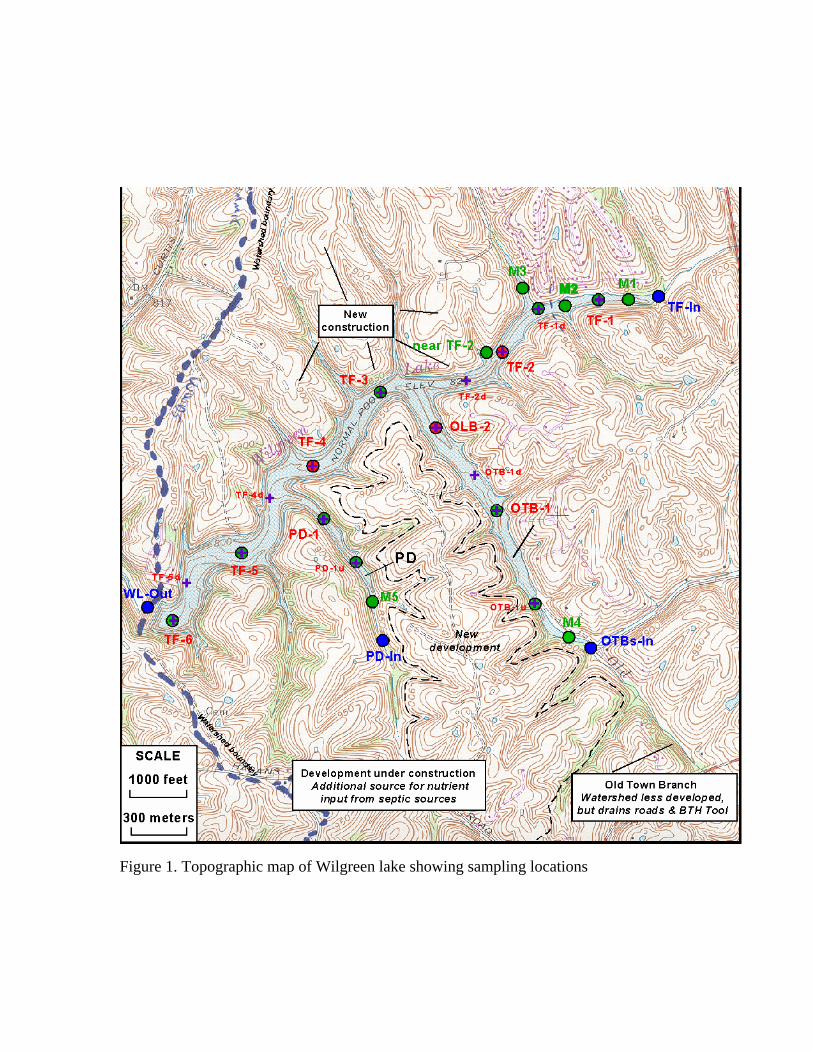
Figure 1. Topographic map of Wilgreen lake showing sampling locations
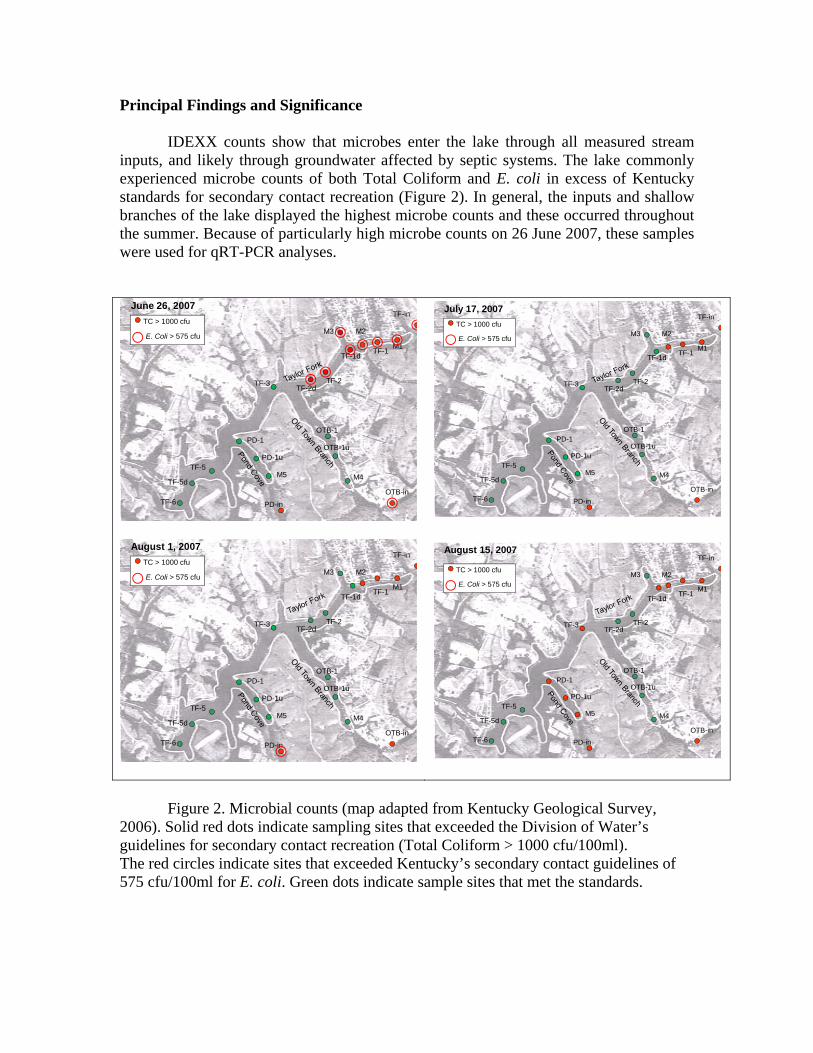
Principal Findings and Significance IDEXX counts show that microbes enter the lake through all measured stream inputs, and likely through groundwater affected by septic systems. The lake commonly experienced microbe counts of both Total Coliform and E. coli in excess of Kentucky standards for secondary contact recreation (Figure 2). In general, the inputs and shallow branches of the lake displayed the highest microbe counts and these occurred throughout the summer. Because of particularly high microbe counts on 26 June 2007, these samples were used for qRT-PCR analyses.
June 26, 2007
TF-6
TF-5d
TF-5
TF-3TF-2d
TF-2
TF-1dTF-1
M3 M2
M1
TF-in
PD-1
PD-1u
PD-in
M5
OTB-in
OTB-1u
M4
OTB-1
TC > 1000 cfu
E. Coli > 575 cfu
July 17, 2007
TF-6
TF-5d
TF-5
TF-3TF-2d
TF-2
TF-1dTF-1
M3 M2
M1
TF-in
PD-1
PD-1u
PD-in
M5
OTB-in
OTB-1u
M4
OTB-1
TC > 1000 cfu
E. Coli > 575 cfu
August 1, 2007
TF-6
TF-5d
TF-5
TF-3TF-2d
TF-2
TF-1dTF-1
M3 M2
M1
TF-in
PD-1
PD-1u
PD-in
M5
OTB-in
OTB-1u
M4
OTB-1
TC > 1000 cfu
E. Coli > 575 cfu
August 15, 2007
TF-6
TF-5d
TF-5
TF-3TF-2d
TF-2
TF-1dTF-1
M3 M2
M1
TF-in
PD-1
PD-1u
PD-in
M5
OTB-in
OTB-1u
M4
OTB-1
TC > 1000 cfu
E. Coli > 575 cfu
Figure 2. Microbial counts (map adapted from Kentucky Geological Survey, 2006). Solid red dots indicate sampling sites that exceeded the Division of Water’s guidelines for secondary contact recreation (Total Coliform > 1000 cfu/100ml). The red circles indicate sites that exceeded Kentucky’s secondary contact guidelines of 575 cfu/100ml for E. coli. Green dots indicate sample sites that met the standards.
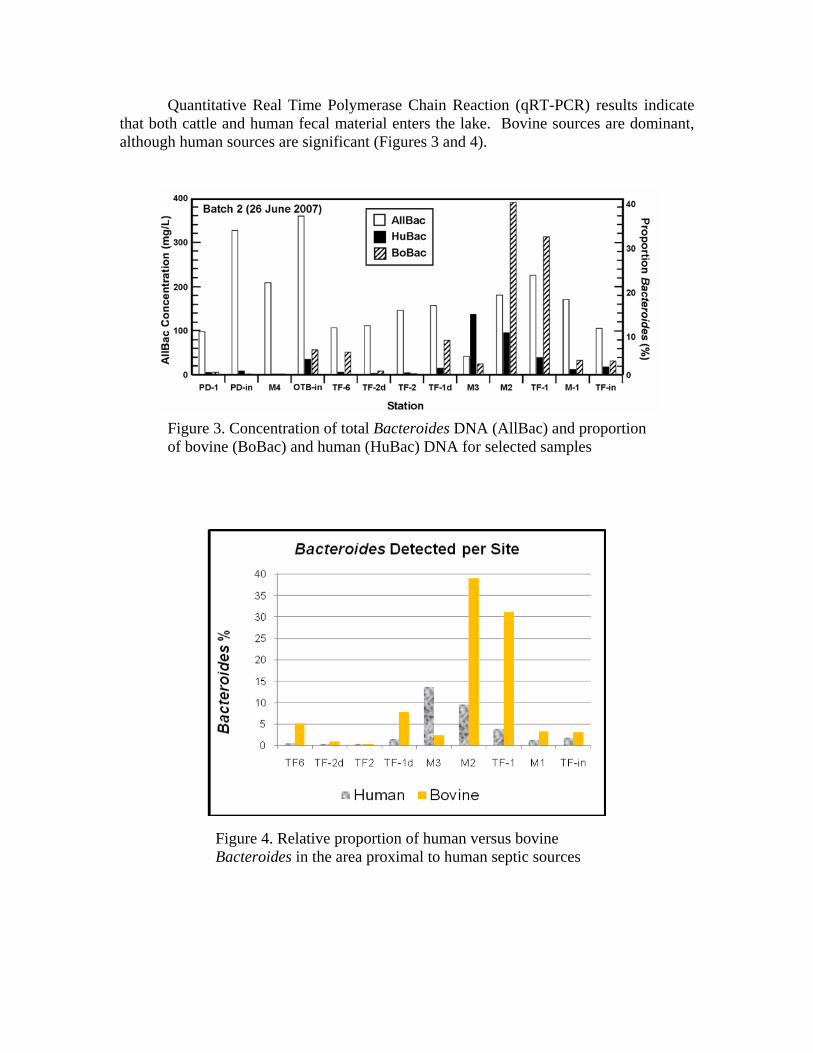
Quantitative Real Time Polymerase Chain Reaction (qRT-PCR) results indicate that both cattle and human fecal material enters the lake. Bovine sources are dominant, although human sources are significant (Figures 3 and 4).
Figure 3. Concentration of total Bacteroides DNA (AllBac) and proportion of bovine (BoBac) and human (HuBac) DNA for selected samples
Figure 4. Relative proportion of human versus bovine Bacteroides in the area proximal to human septic sources
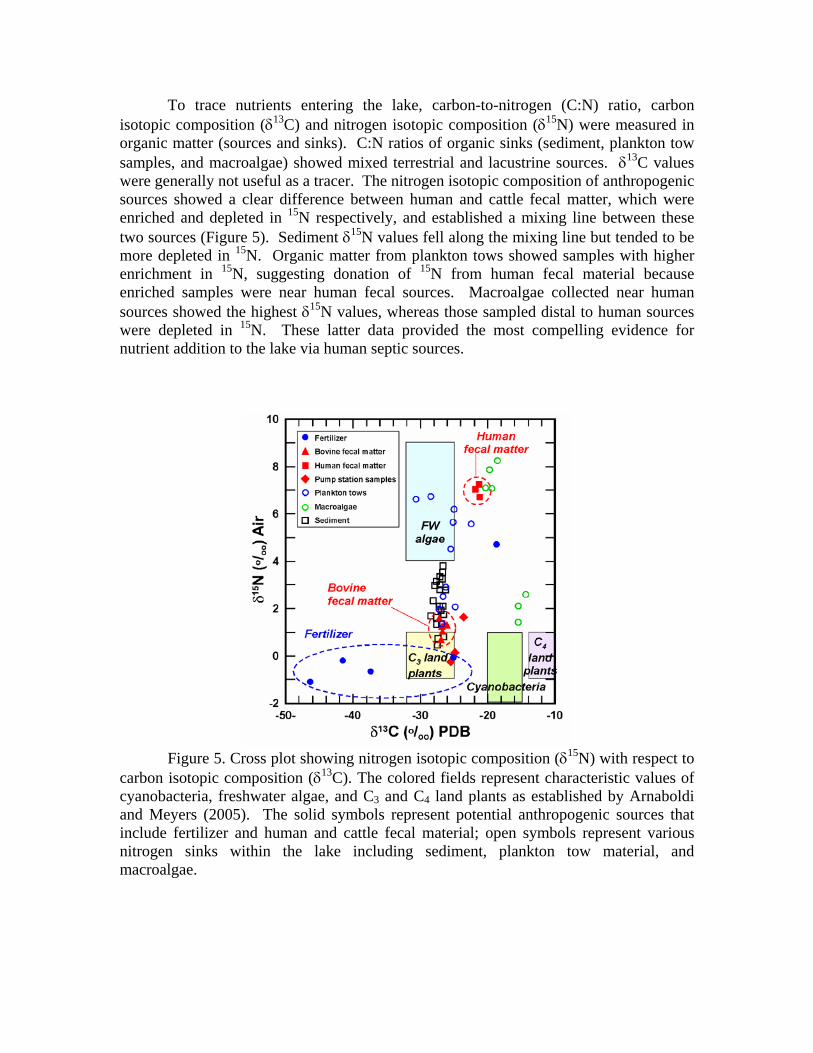
To trace nutrients entering the lake, carbon-to-nitrogen (C:N) ratio, carbon isotopic composition (δ13C) and nitrogen isotopic composition (δ15N) were measured in organic matter (sources and sinks). C:N ratios of organic sinks (sediment, plankton tow samples, and macroalgae) showed mixed terrestrial and lacustrine sources. δ13C values were generally not useful as a tracer. The nitrogen isotopic composition of anthropogenic sources showed a clear difference between human and cattle fecal matter, which were enriched and depleted in 15N respectively, and established a mixing line between these two sources (Figure 5). Sediment δ15N values fell along the mixing line but tended to be more depleted in 15N. Organic matter from plankton tows showed samples with higher enrichment in 15N, suggesting donation of 15N from human fecal material because enriched samples were near human fecal sources. Macroalgae collected near human sources showed the highest δ15N values, whereas those sampled distal to human sources were depleted in 15N. These latter data provided the most compelling evidence for nutrient addition to the lake via human septic sources.
Figure 5. Cross plot showing nitrogen isotopic composition (δ15N) with respect to carbon isotopic composition (δ13C). The colored fields represent characteristic values of cyanobacteria, freshwater algae, and C3 and C4 land plants as established by Arnaboldi and Meyers (2005). The solid symbols represent potential anthropogenic sources that include fertilizer and human and cattle fecal material; open symbols represent various nitrogen sinks within the lake including sediment, plankton tow material, and macroalgae.

Our collective findings suggest that both cattle and human fecal material are major nutrient sources to Wilgreen Lake. Recommendations to the Madison County Fiscal Court are: (1) to prevent cattle from entering the lake or its feeder streams; (2) to create buffer zones around lake and stream margins to minimize runoff from pasture lands; (3) to closely monitor new and existing septic systems in housing developments ringing the lake and in the lake watershed; (4) to seek funding for extending city sewage collection and treatment to existing and new housing developments; and (5) to periodically sample in the future to monitor changes in water quality.
Diatom Colonization Patterns in Freshwater Springs inRelation to Underlying Geology
Basic Information
Title:Diatom Colonization Patterns in Freshwater Springs in Relation to UnderlyingGeology
Project Number: 2007KY89B
Start Date: 3/1/2007
End Date: 2/29/2008
Funding Source:104B
Congressional District:KY 1st
Research Category:Biological Sciences
Focus Category:Ecology, Groundwater, Hydrogeochemistry
Descriptors: water quality
PrincipalInvestigators:
Susan P. Hendricks
Publication
Snapp, Courtney, 2008, Diatom Species Assemblages and Community Dynamics in Four Springs ofDiffering Geologic Origin, Land−Between−the−Lakes, Western Kentucky and Tennessee, MS Thesis,Water Sciences Program, Murray State University, Murray, Kentucky, 76 pages.
1.
Snapp, Courtney, and Susan Hendricks, 2008, Diatom Colonization Patterns and Carbon StableIsotope Ratios in Developing Periphyton in Springs of Differing Geologic Origin,Land−Between−the−Lakes National Recreation Area, Western Kentucky and Tennessee, inProceedings of the Kentucky Water Resources Annual Symposium, Kentucky Water ResourcesResearch Institute, Lexington, Kentucky, p 65−66.
2.
Snapp, Courtney, and Susan Hendricks, 2007, Diatom Colonization Patterns in Freshwater Springs,Land−Between−the−Lakes National Recreation Area, in Relation to Underlying Geology, in 12thSymposium on the Natural History of the Lower Tennessee and Cumberland River Valleys, BrandonSprings, Tennessee.
3.
Snapp, Courtney, and Susan Hendricks, 2007, Diatom Colonization Patterns and Carbon StableIsotopic Ratios in Developing Periphyton in Springs of Differing Geologic Origin,Land−Between−the−Lakes National Recreation Area, Western Kentucky and Tennessee, 19th NorthAmerican Diatom Symposium, University of Michigan Biological Station, Douglas Lake, Michigan.
4.
Snapp, Courtney, and Susan Hendricks, 2007, Diatom Colonization Patterns in Freshwater Springs,Land−Between−the−Lakes National Recreation Area, in Relation to Underlying Geology, KentuckyAcademy of Science, Louisville, Kentucky.
5.
Diatom Colonization Patterns in Freshwater Springs in Relation to Underlying Geology 1
Problem and Research Objectives
Parent geology determines conductivity, alkalinity, pH and nutrient concentrations in spring discharge and groundwaters that seep into and provide baseflow to streams. Previous studies have shown that spring water chemical factors may influence species composition of periphyton colonizing stream substrates. For example, some studies have shown that a number of freshwater diatoms can be characterized as preferring calcium-rich or calcium-poor waters. Other studies have shown that some of the same species that have high optimal conductivity requirements also have optimal tolerances to high pH levels. The extent to which variation in algal 13C reflects differences in inorganic carbon sources is largely unknown. Changes in carbon stable isotope ratios during periphyton development could be important indicators of limiting nutrients in a stream.
The objective of this study was to determine if springs with different geologies and
different water chemistries would have different diatom community compositions. Periphyton community development was also examined to test the hypothesis that 13C stable isotopic ratios increase as periphyton biomass increases over time. Methodology Field Methods Four springs were selected for study. Panther and Mint springs were located in the southern part of Land-Between-the-Lakes (LBL) in Tennessee and were characterized by underlying carbonate/limestone geology. Brown and Barrett springs were located in the northern part of LBL and were characterized by underlying siliceous and argillaceous geology. During October 2006, unglazed quarry tiles were placed at each spring. Tiles were deployed and collected every 4 weeks until February 2007 and analyzed for species composition. Tiles were deployed and collected every 2 weeks from February until July, 2007 and carbon stable isotopic composition, biomass, and chlorophyll a of the developing periphyton were determined. Water temperature, pH, conductivity, dissolved oxygen, and turbidity were measured at each site using a YSI multiprobe meter. Discharge at each spring was determined using a Marsh-McBirney flow meter. Laboratory Analyses Water samples from each site were analyzed for NH4, NO3+NO2, SiO2, soluble reactive phosphate (SRP), Cl, SO4, and alkalinity. Diatoms were cleared with a mixture of 30% hydrogen peroxide followed by potassium dichromate digestion. Permanent slides were mounted using Naphrax and diatoms were examined and identified under a Zeiss light microscope at 1000X. Periphyton samples were filtered and chl-a and ash free
dry mass were determined for biomass analysis. Periphyton samples were filtered and analyzed using a mass spectrometer (Finnigan Delta Plus XP) to determine the 13C composition of the periphyton. Principal Findings and Significance
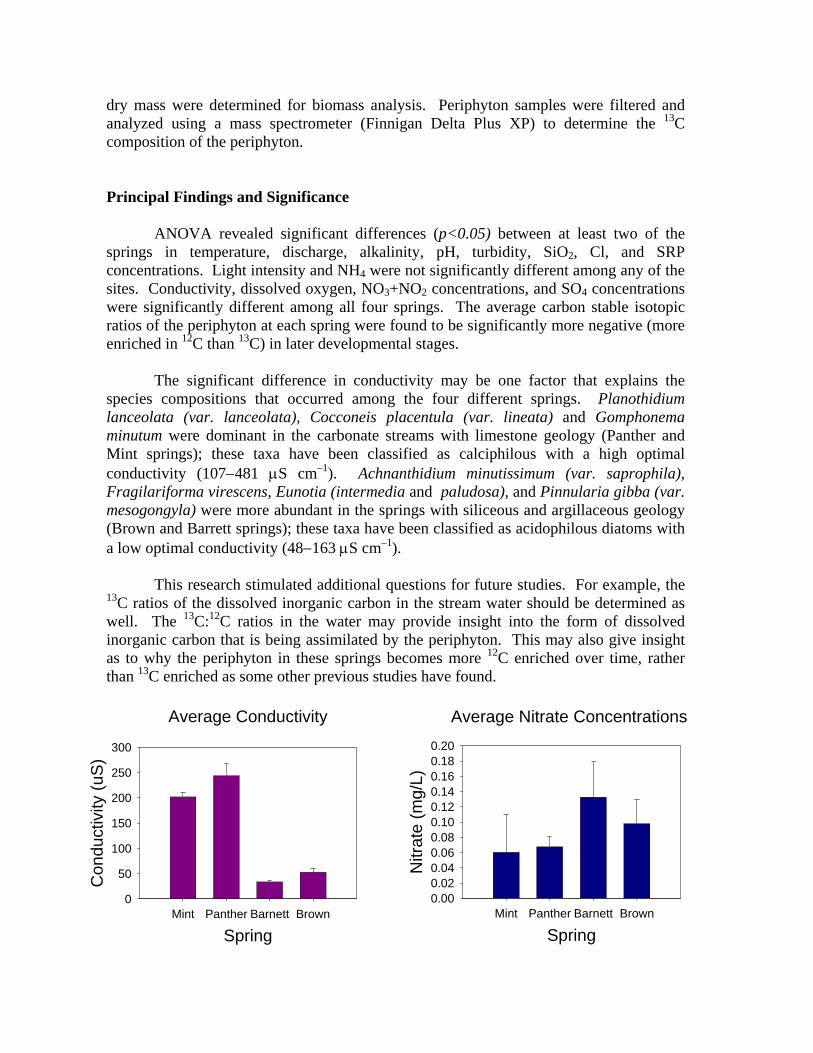
ANOVA revealed significant differences (p<0.05) between at least two of the
springs in temperature, discharge, alkalinity, pH, turbidity, SiO2, Cl, and SRP concentrations. Light intensity and NH4 were not significantly different among any of the sites. Conductivity, dissolved oxygen, NO3+NO2 concentrations, and SO4 concentrations were significantly different among all four springs. The average carbon stable isotopic ratios of the periphyton at each spring were found to be significantly more negative (more enriched in 12C than 13C) in later developmental stages.
The significant difference in conductivity may be one factor that explains the
species compositions that occurred among the four different springs. Planothidium lanceolata (var. lanceolata), Cocconeis placentula (var. lineata) and Gomphonema minutum were dominant in the carbonate streams with limestone geology (Panther and Mint springs); these taxa have been classified as calciphilous with a high optimal conductivity (107−481 µS cm–1). Achnanthidium minutissimum (var. saprophila), Fragilariforma virescens, Eunotia (intermedia and paludosa), and Pinnularia gibba (var. mesogongyla) were more abundant in the springs with siliceous and argillaceous geology (Brown and Barrett springs); these taxa have been classified as acidophilous diatoms with a low optimal conductivity (48−163 µS cm–1).
This research stimulated additional questions for future studies. For example, the
13C ratios of the dissolved inorganic carbon in the stream water should be determined as well. The 13C:12C ratios in the water may provide insight into the form of dissolved inorganic carbon that is being assimilated by the periphyton. This may also give insight as to why the periphyton in these springs becomes more 12C enriched over time, rather than 13C enriched as some other previous studies have found. Average Nitrate Concentrations
SpringMint Panther Barnett Brown
Nitr
ate
(mg/
L)
0.000.020.040.060.080.100.120.140.160.180.20
Average Conductivity
SpringMint Panther Barnett Brown
Con
duct
ivity
(uS
)
0
50
100
150
200
250
300
Chemical Evolution of Groundwater in the Wilcox Aquifer ofthe Mississippi Embayment
Basic Information
Title:Chemical Evolution of Groundwater in the Wilcox Aquifer of the MississippiEmbayment
Project Number: 2007KY90B
Start Date: 3/1/2007
End Date: 2/29/2008
Funding Source:104B
CongressionalDistrict:
KY 6th
Research Category:Ground−water Flow and Transport
Focus Category:Geochemical Processes, Groundwater, Hydrogeochemistry
Descriptors: groundwater, geochemistry
PrincipalInvestigators:
Alan Fryar
Publication
Haile, Estifanos, and Alan Fryar, 2008, Regional−Scale Chemical Evolution of Groundwater in theWilcox Aquifer, Northern Mississippi Embayment, in Abstracts of the 2008 Ground Water Summit,National Ground Water Association, Westerville, Ohio, p 128.
1.
Haile, Estifanos, and Alan Fryar, 2008, Chemical Evolution of Groundwater in the Wilcox Aquifer ofthe Mississippi Embayment, in Proceedings of the Kentucky Water Resources Annual Symposium,Kentucky Water Resources Research Institute, Lexington, Kentucky, p 17.
2.
Haile, Estifanos, and Alan Fryar, 2007 Recharge and Regional−Scale Chemical Evolution ofGroundwater in the Wilcox Aquifer, Northern Mississippi Embayment, USA, in Geological Societyof America Abstracts with Programs 39(6), p 267.
3.
Chemical Evolution of Groundwater in the Wilcox Aquifer of the Mississippi Embayment 1
Problem and Research Objectives This study focused on use of solute analyses to evaluate hydrochemical evolution within the semi-confined to confined Wilcox aquifer of the northern Gulf Coastal Plain. It was conducted along a broad regional groundwater flow path extending ~ 325 km from the outcrop region of the Wilcox Group in southeastern Missouri to the farthest downgradient municipal wells in eastern Arkansas. The objectives of this work were (1) to identify mechanisms that regulate water quality and (2) to determine constraints on groundwater residence times. In the northern Gulf Coastal Plain (Kentucky, Missouri, Arkansas, Tennessee, and Mississippi), deep clastic aquifers contain fresh waters (low in total dissolved solids) that are used for municipal and industrial water supplies. However, these aquifers also contain zones of elevated iron (Fe), manganese (Mn) and hydrogen sulfide (H2S), which are undesirable because of aesthetic concerns including taste, odor, and staining. As water levels decline in overlying aquifers, such as the surficial Mississippi River Valley alluvial aquifer (Czarnecki, 2006), increased exploitation of the deep aquifers in the region is likely. Thus the need for rigorous, mechanistic studies of the controls on water quality and recharge in the deep clastic aquifers has arisen. We hypothesized that the following processes combine to drive chemical evolution in the Wilcox aquifer of the northern Gulf Coastal Plain: (1) dissolution of CO2 and carbonate minerals in the unsaturated zone; (2) weathering of feldspars to form clay minerals; (3) cation exchange; (4) bacterial oxidation of sedimentary organic matter coupled to sequential reduction of dissolved oxygen (O2), nitrate (NO3
), Mn(IV), Fe(III), and sulfate (SO4
2-) along the flow path; and (5) mixing with saline groundwater downgradient. Furthermore, we hypothesized that cross-formational flow could contribute to downgradient recharge of the Wilcox aquifer. Methodology We sampled 21 wells in the Wilcox aquifer, six wells in the overlying Claiborne aquifer, and one well in the underlying McNairy-Nacatoch aquifer, with depths ranging from 116 to 518 meters. Water samples were analyzed for field parameters, major ions, trace metals, dissolved organic carbon (DOC), stable isotopes (18O and 2H of H2O; 13C of DIC), and dissolved methane (CH4). Field measurements included temperature, electrical conductivity (EC), pH, alkalinity (as HCO3
-), oxidation-reduction (redox) potential (Eh), O2, and other indicators of the oxidation state of groundwater (NO3
, ammonium [NH4+],
Fe2+, and H2S). Temperature, EC, pH, and Eh were monitored by electrodes in an in-line flow cell, with stable values taken as representative of in-situ conditions. Samples were taken after flow-cell measurements had stabilized and water had passed through 0.45-µm filters. We collected eight samples for 36Cl groundwater dating and model calibration; results of those analyses are still pending and are not discussed in this report.
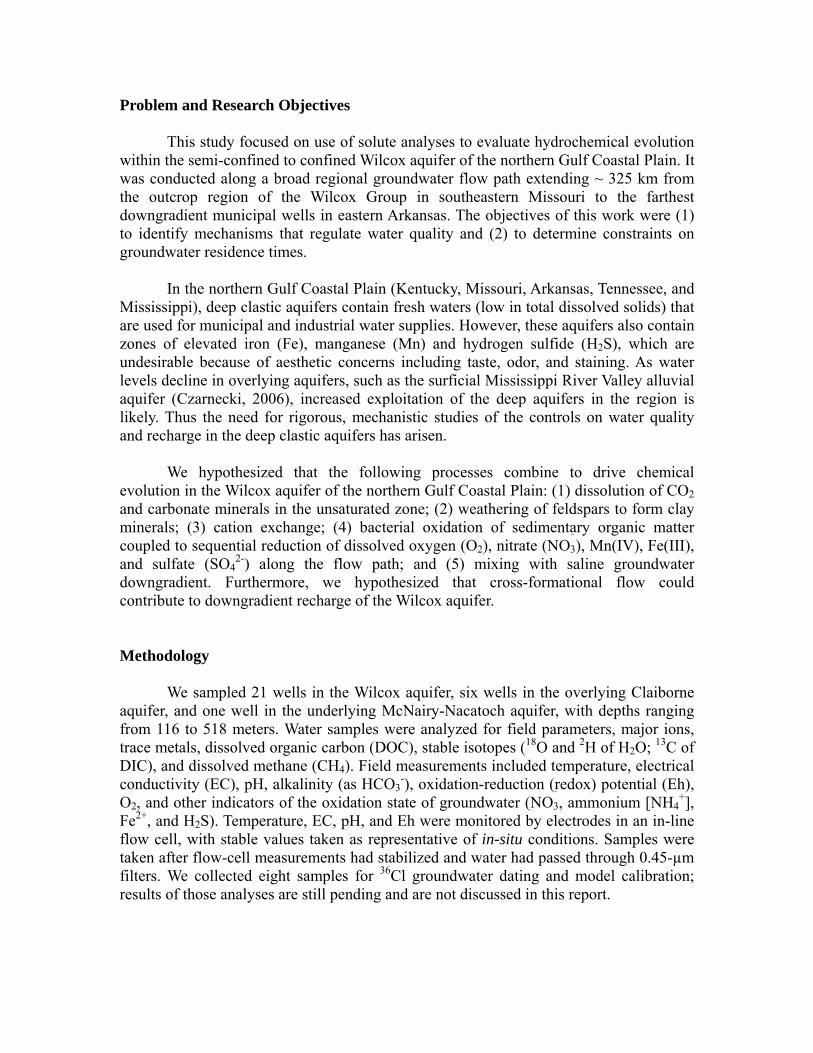
Findings and Significance Along the regional flow path, we observed increases in temperature (consistent with increasing depth), pH, and CH4; decreases in Mn; a prevalence of Fe (18 wells > 0.3 mg/L); and a lack of O2 (27 wells ≤ 1.0 mg/L) and NO3
- (undetectable in 23 wells). Major ion compositions of the groundwater were dominated by Ca and HCO3
- for the semi-confined section in southeastern Missouri. Waters in the confined section of the Wilcox and the Claiborne aquifer in southeastern Missouri and eastern Arkansas were dominated by Na and HCO3
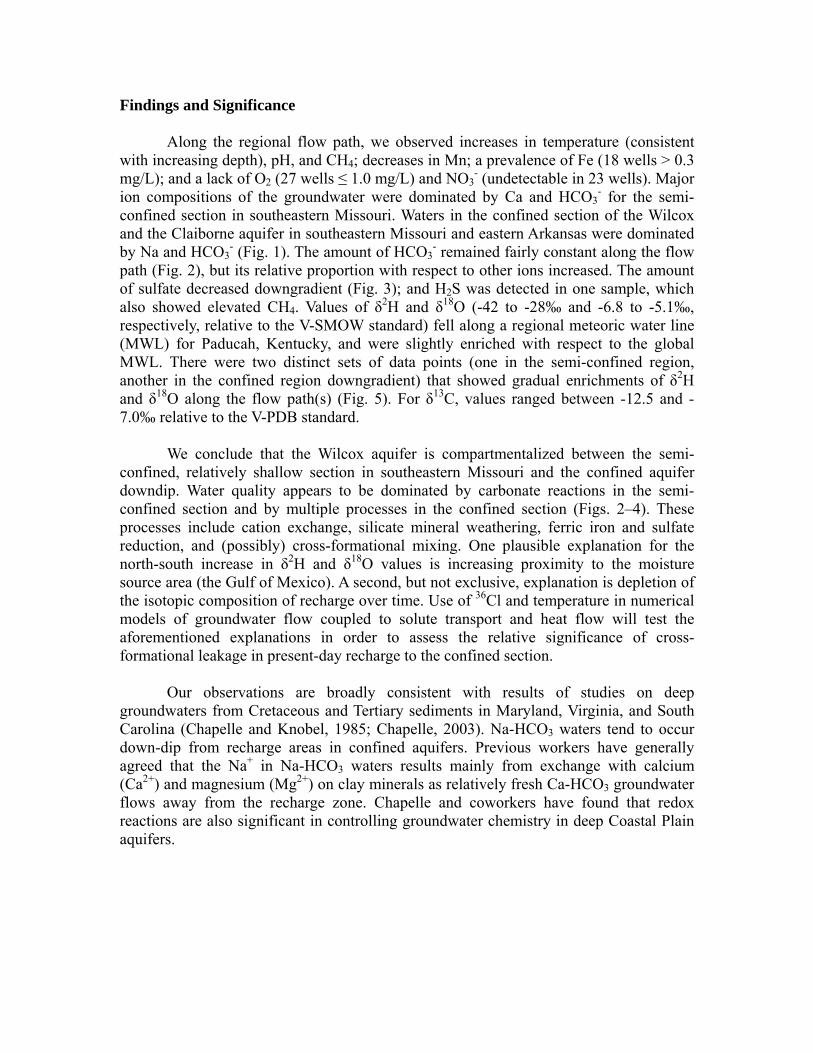
- (Fig. 1). The amount of HCO3- remained fairly constant along the flow
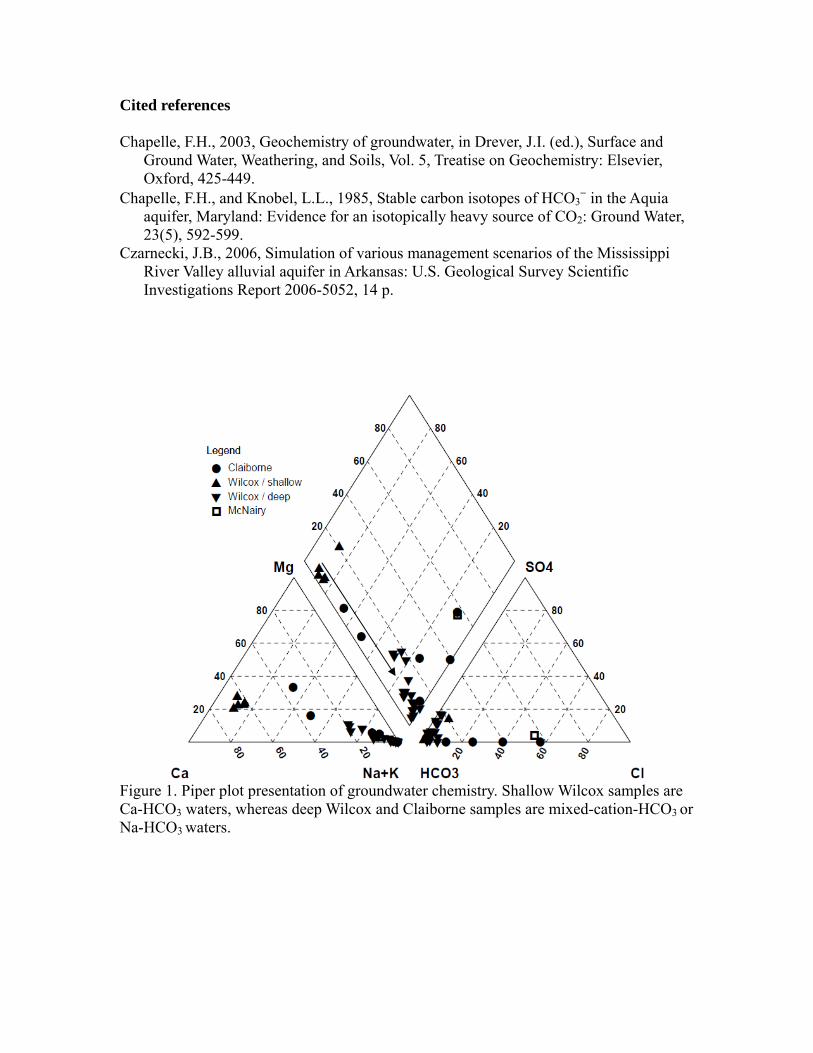
path (Fig. 2), but its relative proportion with respect to other ions increased. The amount of sulfate decreased downgradient (Fig. 3); and H2S was detected in one sample, which also showed elevated CH4. Values of δ2H and δ18O (-42 to -28‰ and -6.8 to -5.1‰, respectively, relative to the V-SMOW standard) fell along a regional meteoric water line (MWL) for Paducah, Kentucky, and were slightly enriched with respect to the global MWL. There were two distinct sets of data points (one in the semi-confined region, another in the confined region downgradient) that showed gradual enrichments of δ2H and δ18O along the flow path(s) (Fig. 5). For δ13C, values ranged between -12.5 and -7.0‰ relative to the V-PDB standard. We conclude that the Wilcox aquifer is compartmentalized between the semi-confined, relatively shallow section in southeastern Missouri and the confined aquifer downdip. Water quality appears to be dominated by carbonate reactions in the semi-confined section and by multiple processes in the confined section (Figs. 2–4). These processes include cation exchange, silicate mineral weathering, ferric iron and sulfate reduction, and (possibly) cross-formational mixing. One plausible explanation for the north-south increase in δ2H and δ18O values is increasing proximity to the moisture source area (the Gulf of Mexico). A second, but not exclusive, explanation is depletion of the isotopic composition of recharge over time. Use of 36Cl and temperature in numerical models of groundwater flow coupled to solute transport and heat flow will test the aforementioned explanations in order to assess the relative significance of cross-formational leakage in present-day recharge to the confined section. Our observations are broadly consistent with results of studies on deep groundwaters from Cretaceous and Tertiary sediments in Maryland, Virginia, and South Carolina (Chapelle and Knobel, 1985; Chapelle, 2003). Na-HCO3 waters tend to occur down-dip from recharge areas in confined aquifers. Previous workers have generally agreed that the Na+ in Na-HCO3 waters results mainly from exchange with calcium (Ca2+) and magnesium (Mg2+) on clay minerals as relatively fresh Ca-HCO3 groundwater flows away from the recharge zone. Chapelle and coworkers have found that redox reactions are also significant in controlling groundwater chemistry in deep Coastal Plain aquifers.
Cited references Chapelle, F.H., 2003, Geochemistry of groundwater, in Drever, J.I. (ed.), Surface and
Ground Water, Weathering, and Soils, Vol. 5, Treatise on Geochemistry: Elsevier, Oxford, 425-449.
Chapelle, F.H., and Knobel, L.L., 1985, Stable carbon isotopes of HCO3− in the Aquia
aquifer, Maryland: Evidence for an isotopically heavy source of CO2: Ground Water, 23(5), 592-599.
Czarnecki, J.B., 2006, Simulation of various management scenarios of the Mississippi River Valley alluvial aquifer in Arkansas: U.S. Geological Survey Scientific Investigations Report 2006-5052, 14 p.
Figure 1. Piper plot presentation of groundwater chemistry. Shallow Wilcox samples are Ca-HCO3 waters, whereas deep Wilcox and Claiborne samples are mixed-cation-HCO3
or Na-HCO3
waters.
Figure 2. Plot of divalent cations vs. mixed-cation-HCO3 in Wilcox wells. Ca + Mg appears to decrease with HCO3 in shallow wells (consistent with calcite precipitation), but decreases without a notable change in HCO3 in deep wells (consistent with adsorption of divalent cations and desorption of Na+).
Figure 3. Sulfate plotted as a function of latitude (equivalent to distance along the flow path) indicates progressive sulfate reduction in the confined Wilcox and Claiborne aquifers.
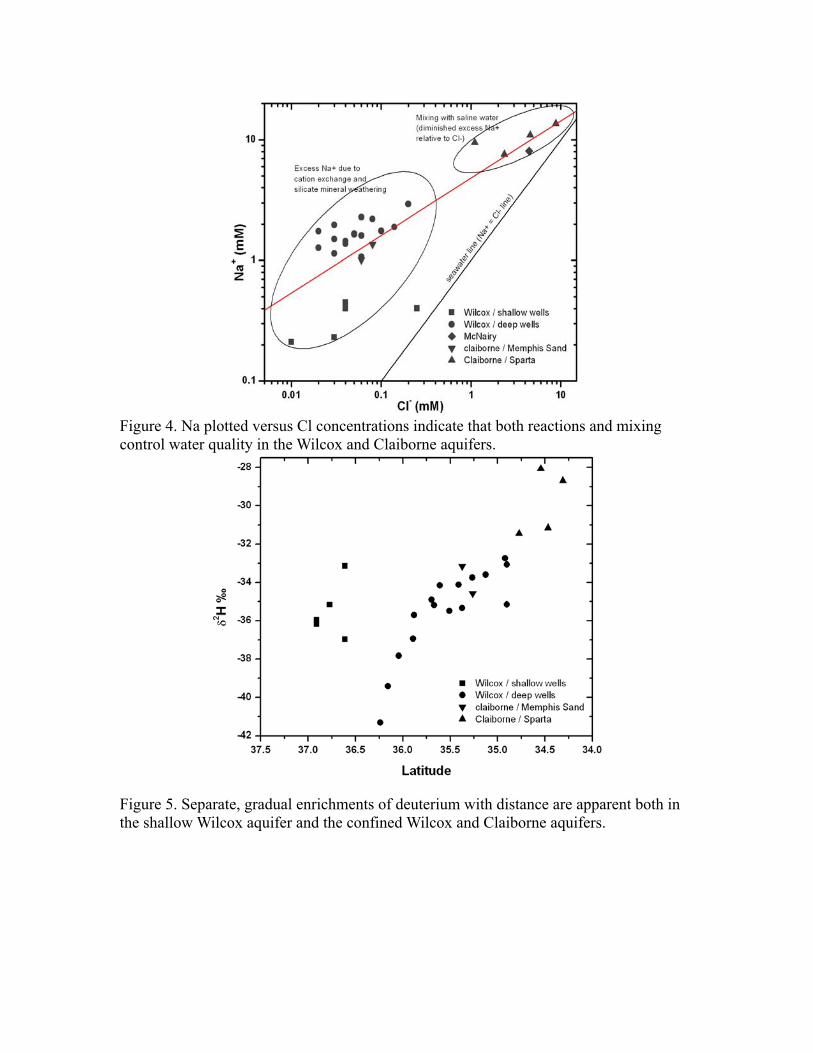
Figure 4. Na plotted versus Cl concentrations indicate that both reactions and mixing control water quality in the Wilcox and Claiborne aquifers.
Figure 5. Separate, gradual enrichments of deuterium with distance are apparent both in the shallow Wilcox aquifer and the confined Wilcox and Claiborne aquifers.
The Link Between Metal Tolerance and AntibioticResistance in Fecal Coliforms
Basic Information
Title:The Link Between Metal Tolerance and Antibiotic Resistance in FecalColiforms
Project Number: 2007KY92B
Start Date: 3/1/2007
End Date: 2/29/2008
Funding Source:104B
Congressional District:KY 4th
Research Category:Water Quality
Focus Category:Hydrogeochemistry, Water Quality, Surface Water
Descriptors: industrial effluents, trace metals, sources of contamination
Principal Investigators: Rebecca Evans
Publication
Evans−Kelley, Rebecca, and Alicia Sullivan, Trace Metals and Antibiotic Resistant Bacteria in theOhio River, in Proceedings of the Kentucky Water Resources Annual Symposium, Kentucky WaterResources Research Institute, Lexington, Kentucky, p 75.
1.
The Link Between Metal Tolerance and Antibiotic Resistance in Fecal Coliforms 1
Problem and Research Objectives
The antibiotic resistant profile of disease-causing fecal coliforms is often used as an indicator of source of fecal contamination in surface waters (Harwood et al., 2000; Krumperman, 1983; Parveen, et al., 1997). In the Ohio River and its major tributaries, however, antibiotic resistant coliforms were not obviously associated with either human sewage or domestic livestock (Charles Somerville, pers. comm.). Some research suggests that trace metal exposure from sources such as industrial effluents can influence antibiotic resistance and make identifying the source of fecal contamination difficult (Calomiris, et al., 1984; McArthur and Tuckfield, 2000). Industrial effluents are released to the Ohio River from major cities such as Pittsburgh, Cincinnati and Louisville. Hence, analyzing trace metal concentrations in Ohio River samples collected in conjunction with fecal coliform sampling could facilitate locating prominent sources of fecal contamination.
There were three main objectives to this study. First, to compare trace metal concentrations with the distribution of antibiotic resistant fecal coliforms. Second, to determine, through statistical analysis, the relationship between trace metal concentrations and antibiotic resistant fecal coliforms in Ohio River water. Third, to use the relationship between trace metals and antibiotic resistance to determine source(s) of fecal coliform contamination.
Methodology
Water samples were collected every 25 miles along the mainstem of the Ohio River and from navigable tributaries, filtered through a 0.45 µm membrane filter and acidified to a pH of ≤ 2.0 with trace metal grade nitric acid. Trace metals were analyzed using a graphite furnace (APHA, 2005).
Antibiotic resistance of total coliforms and E. coli was determined using colilert© packets treated with 100 ml of river water and either ciprofloxacin [4 µg/ml], tetracycline [12.5 µg/ml], or virginiamycin [8 µg/ml]. After a 24 hour incubation period, the presence of resistant colonies was recorded (Somerville, personal communication). Data were reported as the sum of cells that showed resistance to one or more antibiotics.
Findings and Significance
We analyzed Al, Cd, Cr, Cu, Ni, Zn and Se using a graphite furnace. Cd and Cr concentrations were non-detectable whereas Zn concentrations were too high for accurate analysis with the graphite furnace.
Trace metal concentrations were generally highest near industrialized areas: Pittsburgh, Hockingport, Huntington, Cincinnati, Louisville, and upstream of Cairo. The pattern of trace metals does not explain the occurrence of antibiotic resistant coliforms or E. coli using linear regression analysis of transformed data (p > .05). The occurrence of
antibiotic resistance was not directly related to land use and could not be used to identify the source of fecal coliform contamination as either human or agricultural (Somerville, personal communication).
The distribution of trace metals in the Ohio River is clearly associated with industrial regions of the basin. However, the distribution of antibiotic resistant coliforms and E. coli is not as clear and is not well predicted by the trace metal patterns detected in this study. These results do not definitively elucidate trace metals as a driver of antibiotic resistance nor do they eliminate an association between trace metals and antibiotic resistance. We propose a collaborative study that assesses the trace metal resistance of coliforms and E. coli along with antibiotic resistance and trace metal analysis of river water samples. This proposed study could be conducted as early as the summer of 2008. LITERTURE CITED APHA, 2005. Standard methods for the examination of water and wastewater. 21st ed.
Chapter 3 (metals). American Public Health Association, American Water Works Association, Water Environment Federation.
Calomiris, Joh J., John L. Armstrong, and Ramon J. Seidler. 1984. Association of metal tolerance with multiple antibiotic resistance of bacteria isolated from drinking water. Applied and Environmental Microbiology, 47(6): 1238-1242.
Harwood, Valerie J., John Whitlock and Victoria Withington. 2000. Classification of anmtibiotic resistance patterns of indicator bacteria by discriminant analysis: Use in predicting the source of fecal contamination in subtropical waters. Applied and Environmental Microbiology, 66(9): 3698-3704
Krumperman, Paul H. 1983. Multiple antibiotic resistance indexing of Escherichia coli to identify high-risk sources of fecal contamination of foods. Applied and Environmental Microbiology, 46(1): 165-170.
McArthur, J. Vaun and R. Cary Tuckfield. 2000. Spatial patterns in antibiotic resistance among stream bacteria: effects of industrial pollution. Applied and Environmental Microbiology, 66(9): 3722-3726.
Parveen, Salina, Rhendi L. Murphree, Lee Edmiston, Charles W. Kaspar, Kenneth M. Porter, Mark L. Tamplin. 1997. Association of multiple-antibiotic-resistance profiles with point and nonpoint sources of Escherichia coli in Apalachicola Bay. Applied and Environmental Microbiology, 63(7): 2607-2612.
Somerville, Charles. 2006. Personal Communication regarding the lack of source identification in antibiotic resistant bacteria collected in the Ohio River basin. Marshall University, Huntington, W. Va. Phone: (304) 696-2424; email: [email protected]
A Three Dimensional Computational Fluid Dynamic Codefor Simulation of Pump Stations
Basic Information
Title:A Three Dimensional Computational Fluid Dynamic Code for Simulation ofPump Stations
Project Number: 2007KY93B
Start Date: 3/1/2007
End Date: 2/29/2008
Funding Source:104B
Congressional District:KY 6th
Research Category:Engineering
Focus Category:Models, Hydrology, Methods
Descriptors: large eddy simulation, pump station design
Principal Investigators: Scott Yost
Publication
Yee, Tien, and Scott Yost, 2007, A Novel Approach to Air Bubble Transport Modeling Using theScalar Transport Equation, in Proceedings of the 18th Engineering Mechanics Division Conference ofthe American Society of Civil Engineers, Blacksburg, Virginia.
1.
Yee, Tien, and Scott Yost, 2008, A 3−D Computational Fluid Dynamics Code for Simulation ofPump Stations with Vertical Plunging Jet and Air Bubble Transport, in Proceedings of the KentuckyWater Resources Annual Symposium, Kentucky Water Resources Research Institute, Lexington,Kentucky, p 15.
2.
A Three Dimensional Computational Fluid Dynamic Code for Simulation of Pump Stations 1
Problem and Research Objectives
Redesigning pump stations requires testing to ensure the workability of the new modifications before the actual construction or changes take place. Pump stations can be tested either with physical models or numerical simulation. The former method has historically been used in a traditional laboratory setting. A scaled replica model of the pump station is constructed and all tests are carried out using dimensional analysis. Results obtained from the physical model are then extrapolated back to the prototype. Although straightforward, this approach is costly and time consuming. In addition, the extrapolation of results from model to prototype can sometimes be erroneous. An alternate approach utilizes numerical techniques to solve for the governing equations of fluids using computers. This approach is better known as Computational Fluid Dynamics (CFD). Numerical simulation can be used to solve for pump stations of different sizes, geometries and configurations. Air bubbles can directly hinder the efficiency of operating pumps and therefore a model that combines hydrodynamics and air bubble transport is needed to simulate such problems. This project sought to create a computer model capable of solving for hydrodynamics as well as air bubble migration.
The objectives of this research were as follows: 1. Develop a CFD code that could be used to simulate a plunging jet phenomenon,
for academic and industrial applications. 2. Investigate a different approach to simulate air bubble transport as an alternative
to the computationally demanding Lagrangian tracking scheme typically used for academic purposes.
The scope of this research included the following: • Preparing a 3-dimensional CFD code that included a Large Eddy Simulation
(LES) turbulent model and an air transport model. • Performing simple numerical simulation of a plunging jet environment in a
pumping station. • Testing and verification of the code with available literature.
Methodology
The first objective listed above was achieved by solving the governing equations
of fluid flow and transport numerically. The 3-D Navier Stokes equations, continuity equation and the transport equation were the governing equations used in this study. Finite volume was employed to discretize the equations in a staggered grid system. Large Eddy Simulation decomposition was performed on the governing equations. In solving for the diffusion terms, the central differencing scheme was used, while the upwind biased scheme was used for the flux terms. Pressure and free surface terms were solved implicitly using the preconditioned biconjugate gradient method. The theta method with predictor-corrector steps was employed for time integration. For further details of the numerical methods used in this study, see Bradford and Katopodes (1999) and Yee, Yost & Bradford (2007).
Turbulence modeling involved use of a dynamic procedure for the subgrid scale model. This ensured that the turbulent variables were computed utilizing local information. Air bubble modeling utilized the simple transport equation. The forces exerted by the air bubbles to the flow field were modeled as source terms in the Navier Stokes equations. A simple modification to the transport equation was needed to model the uprising velocities of the bubbles. In doing this, the concentration of air bubbles could be modeled using the transport equation. The benefit of modeling air bubbles in this form was that computation could be done more efficiently compared with the usual two-phase flow Lagrangian tracking scheme. The Lagragian tracking scheme tracks each bubble individually and thus is memory intensive and computationally demanding.
Treatment of air bubbles was embedded into the LES decomposed momentum
equation and the scalar transport equation. In this study, the vertical momentum due to buoyancy was added to the LES momentum equation as a source term, while the migration of the air bubble concentration was tracked using the scalar transport equation. Therefore, minor modification to the vertical velocity in the transport equation was needed. This method of incorporating air bubble simulation was simple and yet robust enough that additional computation to track air bubbles was not overwhelming. Such a modification can be done to any existing Navier Stokes solver. Details of the implementation of the air bubble dynamics can be obtained in Yee, Yost, & Bradford (2006, 2007).
This study was conducted in an office environment with the aid of University of
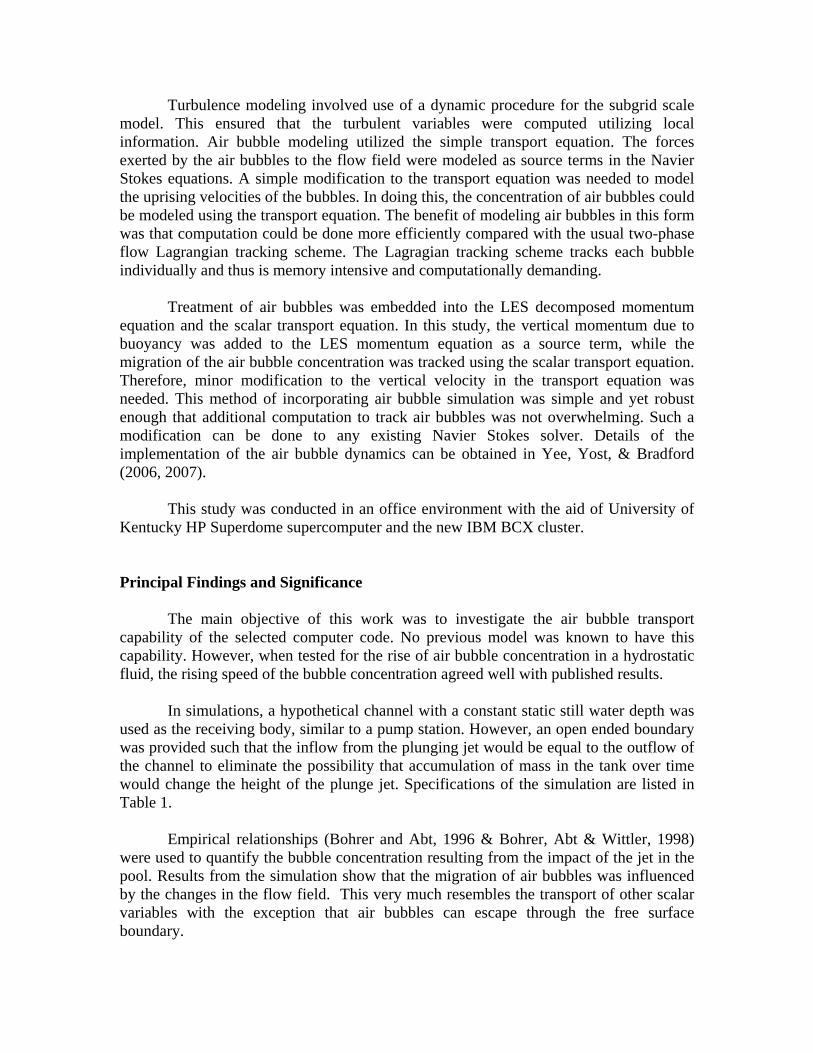
Kentucky HP Superdome supercomputer and the new IBM BCX cluster. Principal Findings and Significance The main objective of this work was to investigate the air bubble transport capability of the selected computer code. No previous model was known to have this capability. However, when tested for the rise of air bubble concentration in a hydrostatic fluid, the rising speed of the bubble concentration agreed well with published results. In simulations, a hypothetical channel with a constant static still water depth was used as the receiving body, similar to a pump station. However, an open ended boundary was provided such that the inflow from the plunging jet would be equal to the outflow of the channel to eliminate the possibility that accumulation of mass in the tank over time would change the height of the plunge jet. Specifications of the simulation are listed in Table 1.
Empirical relationships (Bohrer and Abt, 1996 & Bohrer, Abt & Wittler, 1998) were used to quantify the bubble concentration resulting from the impact of the jet in the pool. Results from the simulation show that the migration of air bubbles was influenced by the changes in the flow field. This very much resembles the transport of other scalar variables with the exception that air bubbles can escape through the free surface boundary.
Initial pool depth 1.6 m Pool width 1.4 m Pool length 4 m
Upstream jet flow 0.03 m3/s Upstream channel width 0.7 m Vertical plunge height 2.3 m
Bubble diameter 1 mm ∆x 0.1 m ∆y 0.093 m ∆z 0.064 m ∆t 1.667 x 10⁻³ sec
Table 1: Simulation details As the simulation progressed, the impact of the jet increased the vertical velocity
in the pool and at the same time generated air bubbles in the plunge section. Air bubbles were “pulled” downwards by the vertical momentum, forming a column of concentrated bubbles. Lateral movement of air bubbles began after the vertical velocity reached the bottom of the channel, thus transporting the air bubbles towards the side walls before rising to the free surface. Air bubbles were clustered near the impact section and did not migrate much toward the end of the pool even with the presence of strong horizontal velocities at the bottom of the channel. The results are encouraging for application of the model to engineering problems of a similar nature, although additional verification is still needed.
Like any model, this model has some limitations. The current code only has the
capability to track bubbles with a specified fixed diameter. Therefore, it is recommended to simulate small bubbles because they have a higher residence time in the pool and can travel for a greater distance. Future work will include determination of the statistical distribution of bubble sizes in the plunging section and simulation of the transport of a spectrum of different bubble sizes. Other future considerations and additions may include simulation of the jet and impact effect (i.e. profile of the jet and surface wave generation), better boundary conditions and improved grid generation techniques.
Numerical simulation can be done to visualize air bubble migration as well as
other hydrodynamics to determine potential problems with pump stations for practical engineering purposes. This study demonstrated that numerical modeling of pump stations with air bubbles can be done using computers. The developed CFD code offers another option for investigating pump station designs, which is more cost and time efficient than physical scale models. The information obtained from this study will be beneficial for academic and industrial applications.
References: 1. Bohrer, J.G. & Abt, S.R. 1996. Plunge Pool Velocity Decay of Rectangular Free
Falling Jets. Dam Foundation Erosion. Phase II . Clear Water Experiments, 1:3 Scale Model Facility. Bureau of Reclamation, Denver.
2. Bohrer, J.G.; Abt, S.R. & Wittler, R.J. 1998. “Predicting plunge pool velocity decay of free falling, rectangular jets”. Journal of Hydraulic Engineering, ASCE, Vol. 124, No. HY10, 1043-1048.
3. Bradford, S.F. and Katopodes, N.D.(1999) “Monotonicity Preserving Model for Free Surface Flow with Sharp Density Fronts”, In Proceedings of the sixth International Conference on Estuarine, Coastal and Ocean Modeling, Nov. 3-5, New Orleans, LA.
4. Yee, Tien Mun., Scott A. Yost, Scott F. Bradford, 2006, “Development of A 3-Dimensional Navier Stokes Equation Model to Solve for Plunging Water Phenomena”, Proceedings of the 7th International Conference on Hydroscience and Engineering, Philadelphia, USA, September 10-13, 2006.
5. Yee, Tien Mun., Scott A. Yost, Scott F. Bradford, 2007, “A Novel Approach to Air Bubble Transport Modeling Using the Scalar Transport Equation”, Proceedings of the 18th Engineering Mechanics Division Conference of ASCE, Blacksburg, Virginia, June 3-6, 2007.
Impacts of Disturbance on Streamflow and Sediment Yieldin the Licking River Basin
Basic Information
Title:Impacts of Disturbance on Streamflow and Sediment Yield in the Licking RiverBasin
Project Number: 2007KY94B
Start Date: 3/1/2007
End Date: 2/29/2008
Funding Source:104B
Congressional District:KY 5th
Research Category:Water Quality
Focus Category:Non Point Pollution, Sediments, Hydrology
Descriptors: ice storm, logging, erosion
PrincipalInvestigators:
Christine E. McMichael
Publication
McMichael, Christine, and Grant York, 2008, Impacts of Disturbance on Streamflow and SedimentYield in the Licking River Basin, in Proceedings of the Kentucky Water Resources AnnualSymposium, Kentucky Water Resources Research Institute, Lexington, Kentucky, p 71−72.
1.
Impacts of Disturbance on Streamflow and Sediment Yield in the Licking River Basin 1
Problem and Research Objectives Natural and human-induced disturbances have been shown to modify streamflow and sedimentation regimes in forested watersheds. A plan for removing trees damaged during the February 2003 ice storm in portions of the Daniel Boone National Forest (DBNF) recently received final approval, and it is anticipated that commercial logging operations will commence in the near future (lasting up to six years). Those charged with managing regional water resources are expected to benefit from research efforts aimed at understanding the impacts of both the recent, natural disturbance and the forthcoming, human-induced disturbance on streamflow and sediment regimes in this area. The primary objective of this study was to improve our understanding of the impacts of the recent ice storm on streamflow and sediment yield in forested sub-basins of the Licking River Basin (within the DBNF) near Morehead, Kentucky – an area which experienced particularly heavy storm damage. Data collected during this study is being used to establish pre-logging (baseline) streamflow and sediment conditions in these sub-basins as a first step towards monitoring the impacts of future logging activities. Methodology A paired-basin approach was utilized to examine the relationships between streamflow and sediment measurements for a ‘disturbed’ sub-basin (i.e., one that experienced extensive ice storm damage) compared with an ‘undisturbed’ sub-basin. The undisturbed, or control, sub-basin was selected to: a) contain minimal development (roads, buildings, etc.) or prior disturbance and b) comprise similar vegetation, morphologic, geologic and climatic characteristics as the disturbed, or treatment, sub-basin. Selection of the treatment (Moore’s Branch) and control (Clear Creek) sub-basins was made using a combination of local expertise, a thorough analysis of relevant digital spatial data layers (e.g., a digital elevation model, soil type, land cover/use, geology, and climate) within a Geographic Information Systems (GIS) database, and site visits. Field-based streamflow and sediment measurements were collected using both an ISCO autosampler and manual sampling techniques. It was decided that flows in the main stream above and below the selected sub-basin outlets may, in fact, overwhelm the sub-basin signals (sediment and flow). Thus, one set of equipment for each sub-basin was placed near its outlet, permitting only event-based measurements for streamflow and sediment in each sub-basin. Only two field campaigns were carried out over the study period, one in early winter and one in late winter/early spring, due to the drought conditions that persisted during much of the remainder of the project period. Principal Findings and Significance The principal findings from this project based on autosampler-collected data are: (1) there was no clear association between velocity and Total Suspended Sediments (TSS) in either watershed; (2) TSS was always greater in the Clear Creek (control) watershed, while streamflow velocities were always higher in Moore’s Branch (treatment) watershed. The main findings of this project based on the manually-collected
data are: (1) there was no clear association between discharge and TSS in either watershed; (2) there was a fairly strong relationship (R2=0.69) between discharge calculated for Clear Creek and Moore’s Branch watersheds, with higher values for Moore’s Branch (treatment) watershed. The lack of clear relationships between velocity and discharge and TSS in both watersheds may be a result of the limited dataset (primarily due to very dry weather conditions, coupled with some equipment problems) and/or sampling errors. The moderately strong discharge relationship between the control (Clear Creek) and treatment (Moore’s Branch) watersheds (augmented with additional pre-logging data collections) will be used in post-logging studies to help determine the effects of logging on flow conditions in the treatment watershed; additional pre-logging sediment data will also be collected to help establish baseline conditions in Moore’s Branch.
Development and Application of a New SedimentFingerprinting Methodology
Basic Information
Title:Development and Application of a New Sediment FingerprintingMethodology
Project Number: 2007KY95B
Start Date: 3/1/2007
End Date: 2/29/2008
Funding Source:104B
Congressional District:KY 6th
Research Category:Water Quality
Focus Category:Sediments, Methods, Non Point Pollution
Descriptors: erosion, sediment source, physical process models, organic matter
Principal Investigators: James F. Fox
Publication
Davis, Charles, and Jimmy Fox, 2008, Sediment Organic Matter Degradation within Storage ZonesDeposited In−Stream, in Proceedings of the Kentucky Water Resources Annual Symposium,Kentucky Water Resources Research Institute, Lexington, Kentucky, p 19−20.
1.
Davis, Charles, and James Fox, 2008, Study of Sediment Source and Fate Processes Using IsotopicTracers in the Bluegrass, in the Proceedings of the World Environmental &Water ResourcesCongress, American Society of Civil Engineers Environmental and Water Resources Institute,Honolulu, Hawai'i.
2.
Development and Application of a New Sediment Fingerprinting Methodology 1
Problem and Research Objectives Suspended sediment derived from upland and streambank erosion represents one of the predominant pollution sources impacting surface waters in the Kentucky River Basin (KRB). Severe problems can result from sedimentation within the KRB including increased turbidity and the addition of hazardous chemicals adsorbed onto eroded soil particles. These sediments can cause degraded water quality, degraded aquatic ecosystem health, and an aesthetically displeasing river for recreational use. The goal of this research was the development and application of a field-based monitoring technique, referred to as sediment fingerprinting, for measuring the sediment production from multiple soil erosion sources, e.g. mining sites or agricultural fields, in a watershed. Once fingerprinting is advanced, it is expected that watershed managers will apply the technology in order to find dominant sediment sources and thereafter remediate sediment problems.
An in-depth literature review showed that five limitations existed for applying fingerprinting studies to Kentucky’s watersheds. These limitations included: (1) a succinct, general sediment fingerprinting method had not been compiled for physio-geographic regions similar to Kentucky; (2) the tracer selection process relied on a trial-and-error approach; (3) in-stream processes impacting fingerprinting, including tracer degradation and sediment particle aggregation/disaggregation, had not been incorporated in previous studies; (4) in-stream collection methods required improvements based on state-of-the-art technology for accurate representation of suspended sediment in Kentucky’s waterways; and (5) current un-mixing models did not incorporate physical process models into the un-mixing calculations.
The overall objective of this project was to work towards the development of a succinct methodology for sediment fingerprinting applicable to sedimentation studies within Kentucky that overcame these limitations. The developed methodology addressed in-stream storage, a common process occurring in Kentucky streams due to the many low order, low gradient streams in the Commonwealth. This methodology was applied to the South Elkhorn Watershed. In order to meet the stated objectives, the following scope was executed:
1. Preparation of a literature review of fingerprinting methods currently utilized; 2. Development of a succinct step-by-step methodology of fingerprinting to enhance
the practicality of the approach for Kentucky’s watersheds; 3. Improvement of sediment sample collection methods for Kentucky’s waterways
based on state-of-the-art technology; 4. Incorporation of physical process models including in-stream storage into the current
un-mixing models; 5. Collection and preliminary analysis of sediment organic tracer signature variability
throughout the sampling routine; and, 6. Application of the improved fingerprinting method for Kentucky to the South
Elkhorn Watershed.
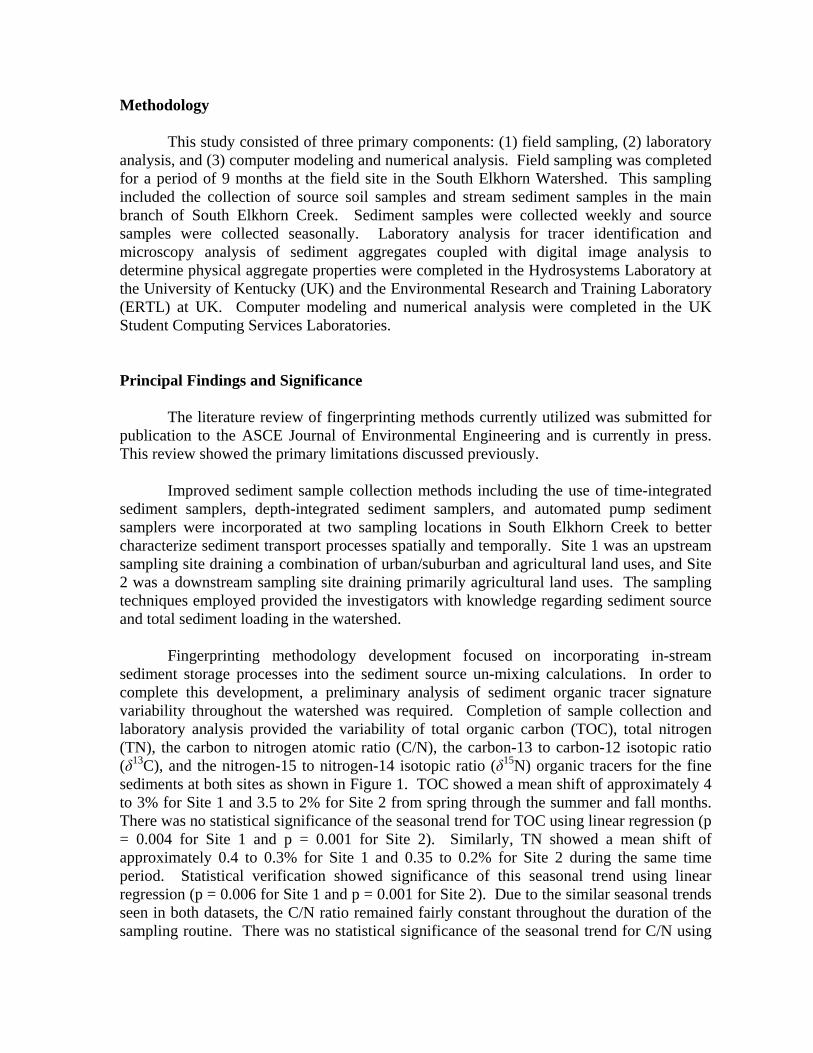
Methodology This study consisted of three primary components: (1) field sampling, (2) laboratory analysis, and (3) computer modeling and numerical analysis. Field sampling was completed for a period of 9 months at the field site in the South Elkhorn Watershed. This sampling included the collection of source soil samples and stream sediment samples in the main branch of South Elkhorn Creek. Sediment samples were collected weekly and source samples were collected seasonally. Laboratory analysis for tracer identification and microscopy analysis of sediment aggregates coupled with digital image analysis to determine physical aggregate properties were completed in the Hydrosystems Laboratory at the University of Kentucky (UK) and the Environmental Research and Training Laboratory (ERTL) at UK. Computer modeling and numerical analysis were completed in the UK Student Computing Services Laboratories. Principal Findings and Significance The literature review of fingerprinting methods currently utilized was submitted for publication to the ASCE Journal of Environmental Engineering and is currently in press. This review showed the primary limitations discussed previously. Improved sediment sample collection methods including the use of time-integrated sediment samplers, depth-integrated sediment samplers, and automated pump sediment samplers were incorporated at two sampling locations in South Elkhorn Creek to better characterize sediment transport processes spatially and temporally. Site 1 was an upstream sampling site draining a combination of urban/suburban and agricultural land uses, and Site 2 was a downstream sampling site draining primarily agricultural land uses. The sampling techniques employed provided the investigators with knowledge regarding sediment source and total sediment loading in the watershed. Fingerprinting methodology development focused on incorporating in-stream sediment storage processes into the sediment source un-mixing calculations. In order to complete this development, a preliminary analysis of sediment organic tracer signature variability throughout the watershed was required. Completion of sample collection and laboratory analysis provided the variability of total organic carbon (TOC), total nitrogen (TN), the carbon to nitrogen atomic ratio (C/N), the carbon-13 to carbon-12 isotopic ratio (δ13C), and the nitrogen-15 to nitrogen-14 isotopic ratio (δ15N) organic tracers for the fine sediments at both sites as shown in Figure 1. TOC showed a mean shift of approximately 4 to 3% for Site 1 and 3.5 to 2% for Site 2 from spring through the summer and fall months. There was no statistical significance of the seasonal trend for TOC using linear regression (p = 0.004 for Site 1 and p = 0.001 for Site 2). Similarly, TN showed a mean shift of approximately 0.4 to 0.3% for Site 1 and 0.35 to 0.2% for Site 2 during the same time period. Statistical verification showed significance of this seasonal trend using linear regression (p = 0.006 for Site 1 and p = 0.001 for Site 2). Due to the similar seasonal trends seen in both datasets, the C/N ratio remained fairly constant throughout the duration of the sampling routine. There was no statistical significance of the seasonal trend for C/N using
linear regression (p > 0.05 for both Site 1 and Site 2). Visually, δ13C and δ15N showed an increase, i.e. become more enriched, from early spring through the late summer and fall months, opposite of the trend shown for TOC and TN. Site 1 showed similar values and less data variability when comparing events for δ13C; but lower values and more data variability for δ15N. Seasonal variability of both δ13C and δ15N was pronounced for the two locations, increasing from the spring through the summer months and either stabilizing (seen for δ13C) or dropping slightly (seen for δ15N) during the fall months. δ13C showed a mean shift of approximately -26.8 to -26.0‰ from the spring months through the summer/fall for both sites. Statistical verification showed significance of the seasonal trend for δ13C using linear regression (p = 3.6 x 10⁻⁵ for Site 1 and p = 0.0002 for Site 2). δ15N showed a mean shift of approximately 4.8 to 5.3‰ from the spring months through the summer/fall for Site 1 and approximately 5.4 to 5.6‰ during the same time period for Site 2. Statistical verification showed significance of the seasonal trend for δ15N using quadratic regression (p = 3.8 x 10⁻⁵ for Site 1 and p = 6.2 x 10⁻⁵ for Site 2). Variability was investigated by removing seasonal trends from the datasets to analyze the influence of hydrologic and seasonal temperature variability on organic tracer signature. The TOC and TN signatures for Site 1 showed a statistically significant correlation to peak flow rate. The correlations were not statistically significant for any other tracers (showing a disconnect between hydrologic and tracer variability for C/N, δ13C, and δ15N at Site 1 and all tracers at Site 2). TOC, TN, δ13C, and δ15N showed statistically significant seasonal trends. TOC and TN both showed decreasing trends from the early spring through the summer and fall months, while the δ13C and δ15N signatures showed increasing trends for the same time period. It is hypothesized that these trends can be attributed to the increased breakdown of organic matter via heterotrophic microbial decomposition within temporary in-stream storage deposits in the summer/fall months (as opposed to winter/spring). This seasonal cycling occurs because temperature is one of the most important environmental factors affecting microorganism growth and survival (Gaudy and Gaudy 1980). Heterotrophic aquatic bacteria have been reported to be responsible for much of the decomposition of organic matter in river sediments (Suberkropp 1998). The tracers showed agreement with water temperature from March to August (higher water temperatures agree with increased microbial degradation of in-stream storage deposit signature (decrease in TOC and TN and enrichment of δ13C and δ15N)). In addition to temporal variability, statistically significant spatial variability (higher TOC and TN for Site 1 than Site 2 and enriched δ15N for Site 1 compared to Site 2) was reflective of a more degraded signature at Site 2. The degraded signature is indicative of higher sediment storage in deposition zones of the channel when moving from the headwaters of the watershed to the watershed outlet. The higher in-stream storage lower in the watershed was identified visually during stream survey and is consistent with the geomorphologic template of streams in this lowland region where the energy gradient of the river, fluid shearing and sediment transport carrying capacity of the flow decreases when moving from the headwaters of the watershed to the watershed outlet.
δ13C, δ15N, C/N, TOC and TN measurements in the South Elkhorn Watershed showed the persistence of streambank erosion, temporary in-stream sediment storage where organic tracers experience microbial decomposition, as well as a stepwise sediment transport process between ex situ and in situ sediment sources. The tracers showed significant change over the study duration and spatial extent suggesting the need for including the fate of the tracers into sediment fingerprinting estimation of sediment transport processes at the watershed scale.
A quantitative sediment source and fate un-mixing model is currently being developed to deduce information regarding sediment residence time within in-stream storage zones, streambank and surface erosion rates. The linkage between sediment processes and isotopic signatures will provide a better understanding of watershed-scale sediment budgets. References Gaudy, A.F., Jr., and Gaudy, E.T. (1980). Microbiology for Environmental Scientists and
Engineers. McGraw-Hill: New York. Suberkropp, K.F. (1998). “Microorganisms and organic matter decomposition.” Eds:Naiman, R.J., Bilby, R.E. River Ecology and Management. Springer Publishing, New York.
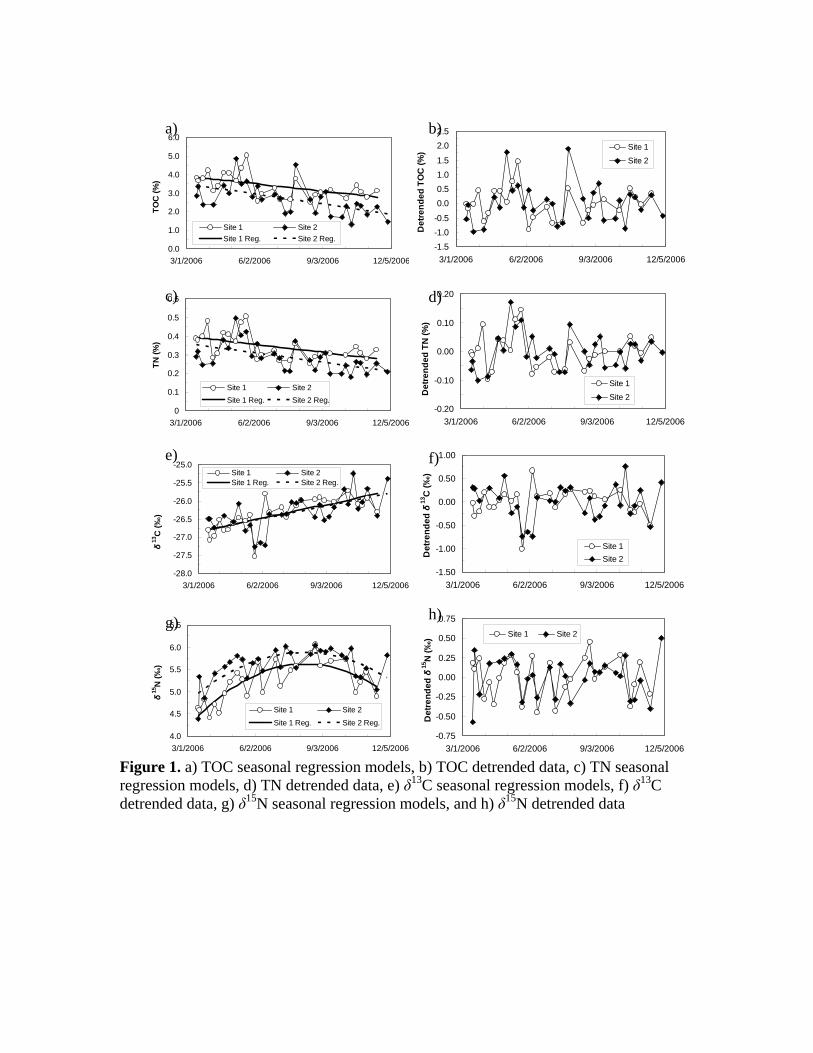
0.0
1.0
2.0
3.0
4.0
5.0
6.0
3/1/2006 6/2/2006 9/3/2006 12/5/2006
TOC
(%)
Site 1 Site 2Site 1 Reg. Site 2 Reg.
-1.5-1.0-0.5
0.00.51.01.5
2.02.5
3/1/2006 6/2/2006 9/3/2006 12/5/2006
Det
rend
ed T
OC
(%) Site 1
Site 2
0
0.1
0.2
0.3
0.4
0.5
0.6
3/1/2006 6/2/2006 9/3/2006 12/5/2006
TN (%
)
Site 1 Site 2Site 1 Reg. Site 2 Reg.
-0.20
-0.10
0.00
0.10
0.20
3/1/2006 6/2/2006 9/3/2006 12/5/2006D
etre
nded
TN
(%)
Site 1
Site 2
-28.0
-27.5
-27.0
-26.5
-26.0
-25.5
-25.0
3/1/2006 6/2/2006 9/3/2006 12/5/2006
δ13
C (‰
)
Site 1 Site 2Site 1 Reg. Site 2 Reg.
-1.50
-1.00
-0.50
0.00
0.50
1.00
3/1/2006 6/2/2006 9/3/2006 12/5/2006
Det
rend
ed δ
13C
(‰)
Site 1Site 2
4.0
4.5
5.0
5.5
6.0
6.5
3/1/2006 6/2/2006 9/3/2006 12/5/2006
δ15
N (‰
)
Site 1 Site 2
Site 1 Reg. Site 2 Reg.
-0.75
-0.50
-0.25
0.00
0.25
0.50
0.75
3/1/2006 6/2/2006 9/3/2006 12/5/2006
Det
rend
ed δ
15N
(‰) Site 1 Site 2
Figure 1. a) TOC seasonal regression models, b) TOC detrended data, c) TN seasonal regression models, d) TN detrended data, e) δ13C seasonal regression models, f) δ13C detrended data, g) δ15N seasonal regression models, and h) δ15N detrended data
a) b)
d)c)
f) e)
h)g)
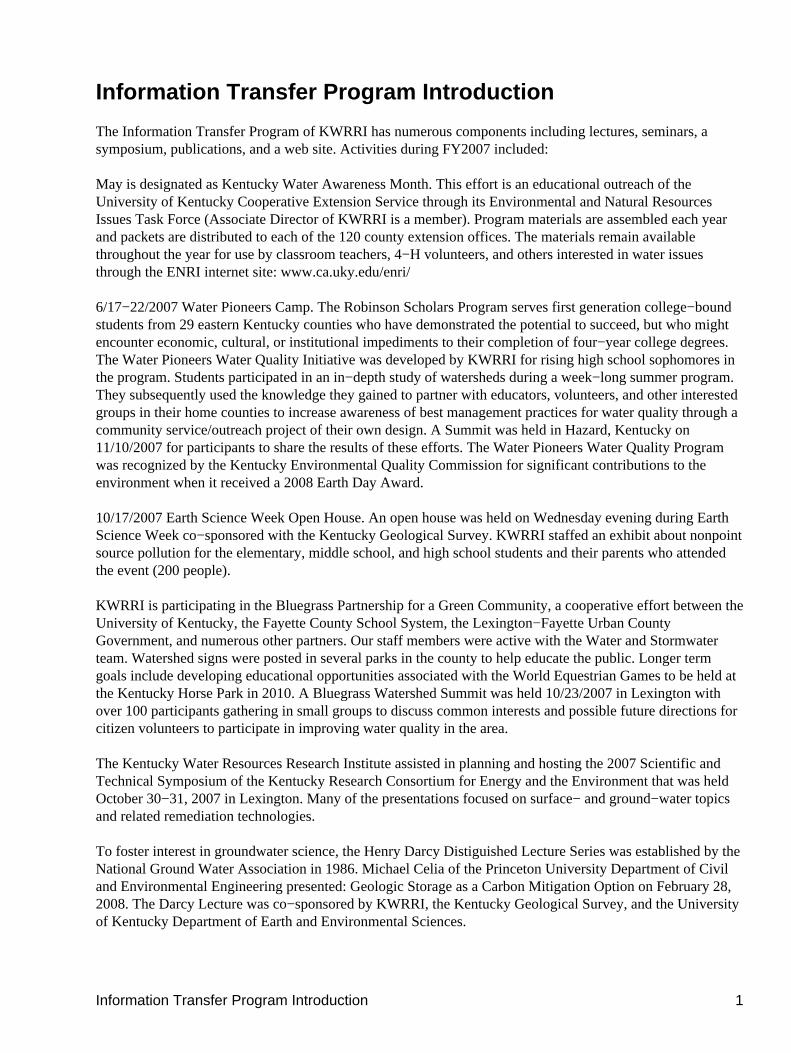
Information Transfer Program Introduction
The Information Transfer Program of KWRRI has numerous components including lectures, seminars, asymposium, publications, and a web site. Activities during FY2007 included:
May is designated as Kentucky Water Awareness Month. This effort is an educational outreach of theUniversity of Kentucky Cooperative Extension Service through its Environmental and Natural ResourcesIssues Task Force (Associate Director of KWRRI is a member). Program materials are assembled each yearand packets are distributed to each of the 120 county extension offices. The materials remain availablethroughout the year for use by classroom teachers, 4−H volunteers, and others interested in water issuesthrough the ENRI internet site: www.ca.uky.edu/enri/
6/17−22/2007 Water Pioneers Camp. The Robinson Scholars Program serves first generation college−boundstudents from 29 eastern Kentucky counties who have demonstrated the potential to succeed, but who mightencounter economic, cultural, or institutional impediments to their completion of four−year college degrees.The Water Pioneers Water Quality Initiative was developed by KWRRI for rising high school sophomores inthe program. Students participated in an in−depth study of watersheds during a week−long summer program.They subsequently used the knowledge they gained to partner with educators, volunteers, and other interestedgroups in their home counties to increase awareness of best management practices for water quality through acommunity service/outreach project of their own design. A Summit was held in Hazard, Kentucky on11/10/2007 for participants to share the results of these efforts. The Water Pioneers Water Quality Programwas recognized by the Kentucky Environmental Quality Commission for significant contributions to theenvironment when it received a 2008 Earth Day Award.
10/17/2007 Earth Science Week Open House. An open house was held on Wednesday evening during EarthScience Week co−sponsored with the Kentucky Geological Survey. KWRRI staffed an exhibit about nonpointsource pollution for the elementary, middle school, and high school students and their parents who attendedthe event (200 people).
KWRRI is participating in the Bluegrass Partnership for a Green Community, a cooperative effort between theUniversity of Kentucky, the Fayette County School System, the Lexington−Fayette Urban CountyGovernment, and numerous other partners. Our staff members were active with the Water and Stormwaterteam. Watershed signs were posted in several parks in the county to help educate the public. Longer termgoals include developing educational opportunities associated with the World Equestrian Games to be held atthe Kentucky Horse Park in 2010. A Bluegrass Watershed Summit was held 10/23/2007 in Lexington withover 100 participants gathering in small groups to discuss common interests and possible future directions forcitizen volunteers to participate in improving water quality in the area.
The Kentucky Water Resources Research Institute assisted in planning and hosting the 2007 Scientific andTechnical Symposium of the Kentucky Research Consortium for Energy and the Environment that was heldOctober 30−31, 2007 in Lexington. Many of the presentations focused on surface− and ground−water topicsand related remediation technologies.
To foster interest in groundwater science, the Henry Darcy Distiguished Lecture Series was established by theNational Ground Water Association in 1986. Michael Celia of the Princeton University Department of Civiland Environmental Engineering presented: Geologic Storage as a Carbon Mitigation Option on February 28,2008. The Darcy Lecture was co−sponsored by KWRRI, the Kentucky Geological Survey, and the Universityof Kentucky Department of Earth and Environmental Sciences.
Information Transfer Program Introduction 1

Cyberseminars provided through the Consortium for the Advancement of Hydrologic Sciences, Inc. weremade available by the KWRRI on the Uniersity of Kentucky campus for interested faculty, staff, students, andlocal professionals.
The Kentucky Water Resources Annual Symposium was held on March 17, 2008. Although the date of thesymposium fell outside of FY2007, most of the planning and preparation occurred during the fiscal year. Twoconcurrent sessions provided time slots for 30 platform presentations. Eighteen posters were also presentedduring a separate poster session. The 9 student research enhancement projects funded in FY2007 by the104(b) program presented their results (6 platform and 3 posters). In many cases, this was the first opportunityfor the students to present research results at a professional meeting. Over 110 people attended the meeting.Abstracts for all of the presentations were distributed to participants on the day of the meeting: Proceedings ofthe Kentucky Water Resources Annual Symposium, 2008, Kentucky Water Resources Research Institute,Lexington, Kentucky, 96 p. The full proceedings document is also available online through a link on theInstitute's web site: www.uky.edu/WaterResources/
The Institute's newsletter WATERWORKS was transitioned to electronic distribution in order to reduceprinting and postage costs. Copies of current and past issues are available continuously through a link on theweb site.
Information Transfer Program Introduction 2

Student Support
Student Support
CategorySection 104 Base
GrantSection 104 NCGP
AwardNIWR−USGS
InternshipSupplemental
AwardsTotal
Undergraduate 3 0 0 0 3
Masters 5 0 0 0 5
Ph.D. 2 0 0 0 2
Post−Doc. 1 0 0 0 1
Total 11 0 0 0 11
Student Support 1

Notable Awards and Achievements
Project 2007KY87B − Christopher Reeves was the recipient of the University of Kentucky Department ofForestry Graduate Student Recognition for Excellence in Research, Academic Performance, and Service inApril 2008.
Project 2007KY88B − Theresa Aquiar won the first place award in Geology at the Kentucky Academy ofSciences meeting in November 2007 for her presentation titled: Fecal Microbe Distribution and Abundanceused as a Possible Proxy for Nutrient Source Identification in Eutrophic Wilgreen Lake, Madison County,Kentucky.
Notable Awards and Achievements 1