Embed Size (px)
Citation preview

[email protected] 2014 1
Kenneth C. Waterman, Ph.D.Jon Swanson, Ph.D.
FreeThink Technologies, Inc.
A Scientific and Statistical Analysis of Accelerated Aging for Pharmaceuticals:
Accuracy and Precision of Fitting Methods

[email protected] 2014 2
•Accuracy in accelerated aging
•Point estimates
• Linear estimates
• Isoconversion
•Uncertainty in predictions
• Isoconversion methods
•Arrhenius • Distributions (MC vs. extrema isoconversion)
• Linear vs. non-linear
• Low degradant
•Conclusions
Outline

[email protected] 2014 3
Accuracy in Accelerated Aging• Statistics must be based on accurate models• Most shelf-life today determined by degradant
growth not potency loss• >50% Drug products show complex kinetics: do
not show linear behavior• Heterogeneous systems• Secondary degradation• Autocatalysis• Inhibitors• Diffusion controlled

[email protected] 2014 4
0 7 14 21 280
0.1
0.2
0.3
0.4
0.5
0.6
0.7
0.8
0.9
1
Time (days)
%D
egra
dant
Complex Kinetics—Example Drug → primary degradant → secondary degradant

[email protected] 2014 5
0 1 2 3 4 5 6 7 8 9 100
0.05
0.1
0.15
0.2
0.25
0.3
0.35
0.4
0.45
Time (days)
%D
egra
dant
50°C
60°C
Accelerated Aging Complex Kinetics
70°C
Fixed time accelerated stability

[email protected] 2014 6
0.0029 0.00295 0.003 0.00305 0.0031 0.00315 0.0032 0.00325 0.0033-4
-3.8
-3.6
-3.4
-3.2
-3
-2.8
1/T
ln k 50°C
60°C
30°C?
70°C More unstable
Accelerated Aging Complex Kinetics
• Appears very non-Arrhenius• Impossible to predict shelf-life
from high T results
[email protected] 2014
0.00280 0.00290 0.00300 0.00310 0.00320 0.00330-7
-6
-5
-4
-3
-2
-1
0
1/T
ln k
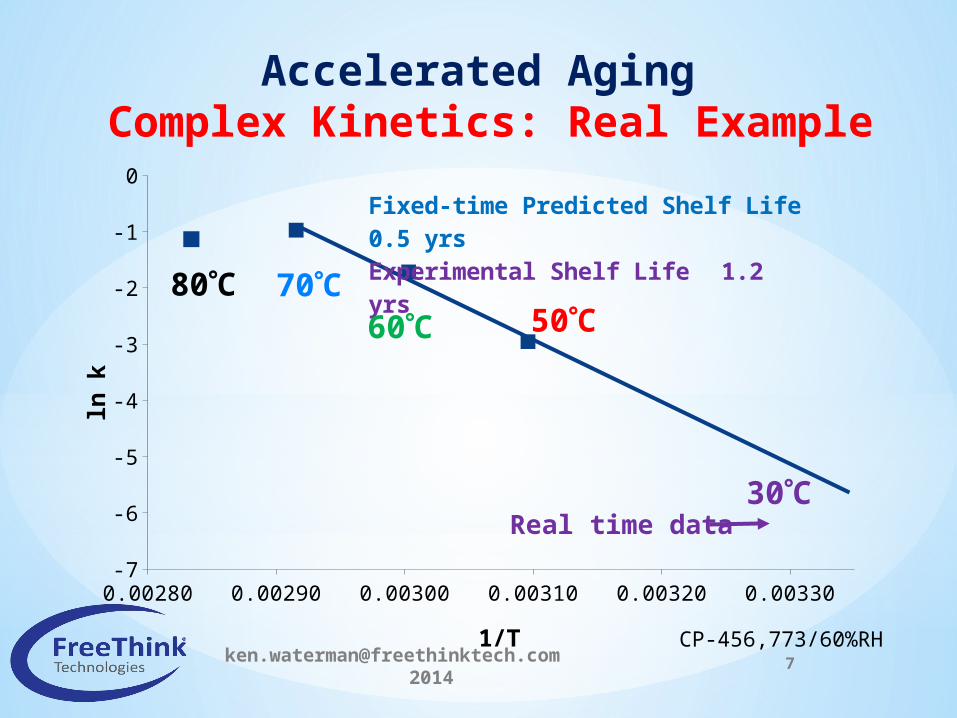
Fixed-time Predicted Shelf Life 0.5 yrs Experimental Shelf Life 1.2 yrs
7
30C
70C60C 50C
80C
CP-456,773/60%RH
Real time data
Accelerated Aging Complex Kinetics: Real Example

[email protected] 2014 8
0 1 2 3 4 5 6 70
0.05
0.1
0.15
0.2
0.25
0.3
Time (days)
%D
egra
dant
50°C
60°C70°C
Accelerated Aging—Isoconversion Approach
0.2% specification limit
Isoconversion: %degradant fixed at specification limit, time adjusted

[email protected] 2014 9
0.0029 0.00295 0.003 0.00305 0.0031 0.00315 0.0032 0.00325 0.0033
-7
-6
-5
-4
-3
-2
-1
1/T
ln k
Using 0.5% isoconversion
50°C60°C
30°C
70°CUsing 0.2% isoconversion
Accelerated Aging—Isoconversion Approach Complex Kinetics

[email protected] 2014 10
0.00280 0.00290 0.00300 0.00310 0.00320 0.00330 0.00340-8
-7
-6
-5
-4
-3
-2
-1
0
1
2
1/T (K)
ln(k
)
30C
70C
60C50C
80C
CP-456,773/60%RH
Real time data
ASAPprime Shelf Life 1.2 yrsExperimental Shelf Life 1.2 yrs
Accelerated Aging—Isoconversion Approach Complex Kinetics—Real Example

[email protected] 2014 11
More Detailed Example
• Time points @ 0, 3, 7, 14 and 28 days• Shelf-life @25°C using 50, 60 and 70°C
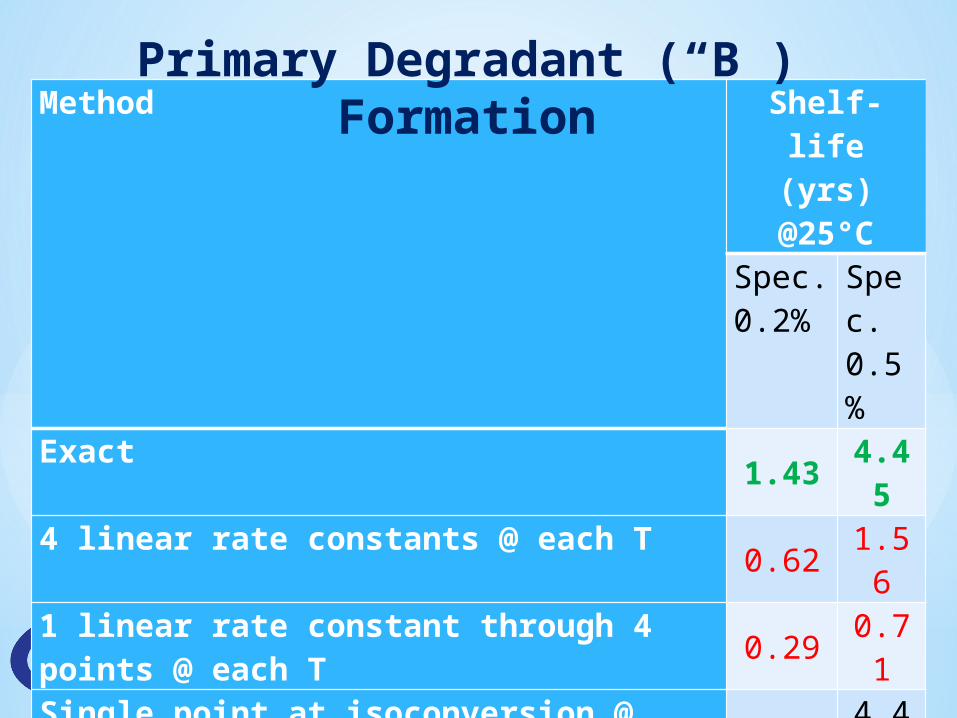
• k1 = 0.000113%/d k2 = 0.01125%/d @50°C for “B” example (25 kcal/mol)
• k1 = 0.000112%/d k2 = 0.09%/d @50°C for “C” example (25 kcal/mol)
A B Ck1 k2
[email protected] 2014 12
Method Shelf-life (yrs) @25°C
Spec. 0.2%
Spec. 0.5%
Exact 1.43 4.454 linear rate constants @ each T 0.62 1.561 linear rate constant through 4 points @ each T 0.29 0.71Single point at isoconversion @ each T 1.43 4.45Linear fitting of 4 points @ each T to determine intersection with specification 12.35 1.40Determining intersection with specification using 2 points closest to specification @ each T (or extrapolating from last 2 points, when necessary)
1.36 3.19
Primary Degradant (“B”) Formation
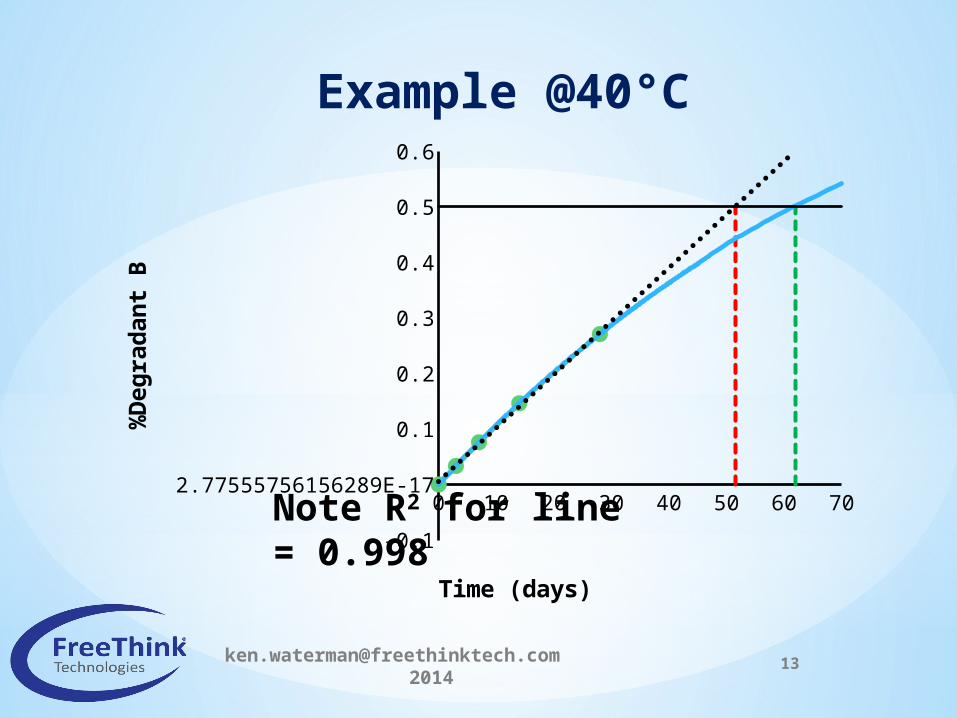
[email protected] 2014 13
0 10 20 30 40 50 60 70
-0.1
2.77555756156289E-17
0.1
0.2
0.3
0.4
0.5
0.6
Time (days)
%D
egra
dant
BExample @40°C
Note R2 for line = 0.998

[email protected] 2014 14
Method Shelf-life (yrs) @25°C
Spec. 0.2%
Spec. 0.5%
Exact 2.02 4.014 linear rate constants @ each T 16.64 41.611 linear rate constant through 4 points @ each T 3.29 8.21Single point at isoconversion @ each T 2.02 4.01Linear fitting of 4 points @ each T to determine intersection with specification 2.75 7.56Determining intersection with specification using 2 points closest to specification @ each T (or extrapolating from last 2 points, when necessary)
2.06 4.78
Secondary Degradant (“C”) Formation

[email protected] 2014 15
Accuracy
• Both isoconversion and rate constant methods accurate when behavior is simple• Only isoconversion is accurate when
degradant formation is complex• Carrying out degradation to bracket
specification limit at each condition will increase reliability of modeling

[email protected] 2014 16
Estimating Uncertainty
• Need to use isoconversion for accuracy: defines a 2-step process• Estimating uncertainty in isoconversion from
degradant vs. time data• Propagating to ambient using Arrhenius equation
• Error bars for degradant formation are not uniform• Constant relative standard deviation (RSD)• Minimum error of limit of detection (LOD)

[email protected] 2014 17
Isoconversion Uncertainty Methods• Confidence Interval:• Regression Interval:• Stochastic: Monte-Carlo distribution • Non-stochastic: 2n permutations of ±1σ• Extrema: 2n permutations of ±1σ; normalize using zero-
error isoconversion - minimum time (maximum degradant) of distribution

[email protected] 2014 18
0 5 10 15 20 25 30 35 40 450
0.2
0.4
0.6
0.8
1
1.2
1.4
1.6
1.8
Time (days)
%D
egra
dant
Test Calculations: Model System

[email protected] 2014 19
Calculation Method 5 Days (Interpolation)
40-Days (Extrapolation)
Regression Interval 0.023% 0.102%
Confidence Interval 0.012% 0.100%
Stochastic 0.012% 0.099%
Non-Stochastic 0.012% 0.100%
Extrema 0.020% 0.147%
Fixed SD = 0.02%
Calculations Where Formulae Exist

[email protected] 2014 20
• CI too narrow in interpolation regions (< experimental σ); also does not take into account error of fit
• RI better represents error for predictions• RI and CI converge with extrapolation• Extrema mimics RI in interpolation; more
conservative in extrapolation• Note: scientifically less confident in
isoconversion extrapolations (model fit)
Isoconversion Uncertainty

[email protected] 2014 21
Calculation Method
5 Days (Interpolation)
40-Days (Extrapolation)
Stochastic 0.016% 0.166%Non-Stochastic 0.016% 0.166%
Extrema 0.027% 0.223%
Fixed RSD = 10% with minimum error of 0.02% (LOD)
Calculations Where Formulae Do Not Exist

[email protected] 2014 22
Arrhenius Fitting Uncertainty
• Can use full isoconversion distribution from Monte-Carlo calculation
• Can use extrema calculation• Normalized about time (x-axis, degradant set by
specification limit)• Normalized about degradant (y-axis, time set by
zero-error intercept with specification limit)

[email protected] 2014 23
Monte Carlo IsoconversionMonte Carlo Arrhenius
25°C Projected Rate Distributions60, 70, 80°C measurements @10 days; RSD=10%, LOD=0.02%; 25 kcal/mol
Extrema IsoconversionMonte Carlo Arrhenius
84.1%1.42 X 10⁻⁴%/d
50%2.34 X 10⁻⁴%/d
50%2.38 X 10⁻⁴%/d
84.1%1.43 X 10⁻⁴%/d
15.9%3.83 X 10⁻⁴%/d
15.9%4.05 X 10⁻⁴%/d
Rate from CI (RSD/LOD, 0.2%)
rate
frequency
0e+00 2e-04 4e-04 6e-04 8e-04
0200
400
600
800
Rate from Deg Extrema (RSD/LOD, 0.2%)
ratefrequency
0e+00 2e-04 4e-04 6e-04 8e-04
0200
400
600
800

[email protected] 2014 24
Arrhenius Fitting Uncertainty
• Distribution of ambient rates from Monte-Carlo or extrema calculations very similar• In both cases, rate is not normally distributed • Probabilities need to use a cumulative
distribution function

[email protected] 2014 25
Arrhenius Fitting Uncertainty
• Can be solved in logarithmic (linear) or exponential (non-linear) form
• With perfect data, point estimates of rate (shelf-life) will be identical
• A distribution at each point will generate imperfect fits• Least squares will minimize difference between actual and
calculated points • Non-linear will weight high T more heavily• Constant RSD means that higher rates will have greater
errors

[email protected] 2014 26
Extrapolated Shelf-life (years) at 25°C84.1% Median 15.9% Mean
Linear 3.86
2.31
1.43
2.70
Non-linear 7.12
2.33
0.90
5.41
• Arrhenius based on isoconversion values @60, 70, 80°C• Origin + point at 10 days; spec. limit (0.20%)• RSD=10%; LOD = 0.02%• Isoconversion distribution using extrema method• True shelf-life equals 2.31 years
Comparison of Arrhenius Fitting Methods

[email protected] 2014 27
Arrhenius Fitting Uncertainty
• Non-linear least squares fitting gives larger, less normal distributions of ambient rates• Non-linear fitting’s greater weighting of higher
temperatures makes non-Arrhenius behavior more likely to cause inaccuracies• Since linear is also less computationally
challenging, recommend use of linear fitting

[email protected] 2014 28
Low Degradant vs. Standard Deviation• For low degradation rate (with respect to the SD),
isoconversion less symmetric• Becomes discontinuous @Δdeg = 0 (isoconversion = ∞)
for any sampled point• Can resolve by clipping points with MC• Distribution meaning when most points removed?
• Can use extrema• Define behavior with no regression line isoconversion• Can define mean from first extrema intercept (2 X value)
• No perfect answers—modeling better when data show change

[email protected] 2014 29
Notes
• ICH guidelines allow ±2C and ±5%RH—average drug product shows a factor of 2.7 shelf-life difference within this range• ASAP modeling uses both T and RH, both
potentially changing with time—errors will change accordingly• Assume mathematics the same, but
need to focus on instantaneous rates

[email protected] 2014 30
•Modeling drug product shelf-life from accelerated data more accurate using isoconversion
•Isoconversion more accurate using points bracketing specification limit than using all points
•With isoconversion, regression interval (not confidence interval) includes error of fit, but difficult to calculate with varying SD
•Extrema method reasonably approximates RI for interpolation; more conservative for extrapolation
•Linear fitting of Arrhenius equation preferred
Conclusions

[email protected] 2014 31
Notes on King, Kung, Fung “Statistical prediction of drug stability based on non-linear parameter estimation” J.
Pharm. Sci. 1984;73:657-662• Used rates based on each time point independently
• Changing rate constants not projected accurately for shelf-life• Gives greater precision by treating each point as equivalent, even when
far from isoconversion (32 points at 4 T’s gives better error bars than just 4 isoconversion values: more precise, but more likely to be wrong)
• Non-linear fitting to Arrhenius• Weights higher T more heavily (and where they had most degradation)• Made more sense with constant errors used for loss of potency• Non-linear fitting in general bigger, less symmetric error bars, more
likely to be in error if mechanism shift with T• Used mean and SD for linear fitting, even when not normally distributed
(i.e., not statistically valid method)• Do not recommend general use of KKF method (fine for ideal behavior,
loss of potency)