Embed Size (px)
Citation preview

KENYA COCONUT DEVELOPMENT AUTHORITY
YEAR BOOK OF COCONUT STATISTICS 2012
JULY 2012

2
TABLE OF CONTENTS
TABLE OF CONTENTS ...................................................................................................................... 2
LIST OF ACRONYMS ......................................................................................................................... 3
1. AGRICULTURAL PERFORMANCE .......................................................................................... 4
2.1 Area under Coconut .................................................................................................................. 4
2.2 Mother plants .............................................................................................................................. 4
2.3 Coconut Seedlings’ Nurseries ................................................................................................. 5
3.0 VALUE ADDITION ......................................................................................................................... 7
3.1 Processors .................................................................................................................................. 7
3.2 Dealers of Primary Coconut Products .................................................................................... 8
3.3 Toddy (Mnazi) Vendors ............................................................................................................ 8
3.4 Price of Mature Nuts ............................................................................................................... 10
4.0 EXPORTS AND IMPORTS ........................................................................................................ 14
4.1 Exports ...................................................................................................................................... 14
4.2 Imports ...................................................................................................................................... 15

3
LIST OF ACRONYMS
ATC Agricultural Technical College
CIGs Common Interest Groups
CIF Cost Insurance and Freight
KARI Kenya Agricultural Research Institute
KCDA Kenya Coconut Development Authority
UAE United Arab Emirates
USA United States of America

4
INTRODUCTION
Coconut farming in Kenya’s Coastal region is dominated by over 150,000 smallholder households spread over more than five districts in the region. Coconut occupies 60,128 hectares with an estimated population of 7.4 million trees. Nuts production stands at 250,538,379 pieces annually (FAO, 2006). The industry has the potential of contributing KES 13.2 billion to the GDP but only 25 percent (KES 3.2 billion) of existing potential is currently exploited. This is as a result of a myriad of factors which include lack of adequate statistics to guide policy formulation; and lack of awareness on available business opportunities in the sub-sector among others. The industry operated under unclear policy framework until 27th August, 2007 when the Government established the Kenya Coconut Development Authority (KCDA) to provide a policy and legal framework for industry regulation and development. Key among its functions was to collect and collate data with the aim of providing advisory services on matters related to the coconut industry to the Government and to the industry for planning purposes. Data related to coconut performance is therefore highlighted in this statistical year book as a way of appreciating where the sub-sector is coming from and where it targets to go.
1. AGRICULTURAL PERFORMANCE
2.1 Area under Coconut
Total area under coconut in six major coconut growing districts of Kilifi, Kwale, Lamu, Mombasa, Taita Taveta and Tana River at the end of 2011 was 50,663 hectares compared to 46,963 hectares at the end of 2009. This marks a 7% increase in area under coconut in the six major coconut growing districts. While there may not have been significant changes in the area under coconut in other parts of the coastal region, the increase noted in the six areas in question points to a number of significant issues. This increase is attributed to:-
Sensitization campaigns done by Kenya Coconut Development Authority (KCDA) on the importance of coconut,
Provision of free coconut seedlings to farmers that has in turn led to an increase in the number of coconut seedlings’ nurseries.
2.2 Mother plants
Kenya Coconut Development Authority has endeavored to ensure that farmers in the coconut sub-sector access quality planting materials. It has been doing this by way of marking mother plants so that seed nuts are obtained from these marked plants. Such seed nuts are thereafter availed to coconut seedlings nursery operators and finally to farmers. The marking exercise is aimed at arriving at mother plants that have good characteristics in as far as good seed nuts are concerned. From these analysis seed nuts that are good for nut trees, tender nut coconut water, and wine are then indentified. The information below shows the number of marked mother plants across the coastal region.

5
District Summaries Nut Trees Madafu trees Wine trees Total Marked
Kilifi 1024 2 237 1,263
Malindi/Magarini 758 11 150 919
Kaloleni 2898 31 321 3,250
Kwale 92 0 1 93
Msambweni 977 0 15 992
Changamwe 164 0 29 193
Lamu West 476 1 1 478
Lamu East 1297 55 87 1,439
Tana Delta 292 0 6 298
TOTAL 7978 100 847 8,925
Source: KCDA Database 2011
2.3 Coconut Seedlings’ Nurseries 426 coconut seedlings’ nursery operators have been trained as at the end of 2011. However, a large number of these have not taken the practice seriously. Several factors explain this phenomenon. First, the practice of nursery establishment has not been handled as a business but as some kind of hobby. Thus training efforts have been frustrated by this attitude. Secondly, the guaranteed market of seedlings by KCDA appears to make the nursery operators complacent hence they do not invest anything more than what the Authority has assisted them with. Towards this end, when challenging times come like adverse weather conditions, a number of the operators have been unwilling to endure through these hard times thus have fallen off. However, a number have been resilient and have continued with the operations. Currently there are 80 operators across the coastal region that the Authority has contracted to be able to raise 250,000 seedlings for planting in June 2012. The distribution of the operators is as shown in the table below. District/Institution Number of operators Number of seed nuts secured
to raise seedlings
Kilifi 13 44,150
Ganze 1 1,500
Rabai 6 24,403
Malindi 9 24,518
Kaloleni 5 15,800
Magarini 4 8,960
Tana Delta 6 13,800
Lamu West 10 74,400
Lamu East 5 9,400
Kwale 6 22,480
Msambweni 1 3,000
Kinango 3 2,000
Taita Taveta 4 3,000
Voi & Mwatate 6 23,000
Changamwe 1 6,200
TOTAL 80 276,611
Source: KCDA Database 2012

6
It should be noted that six institutions are also operating nurseries. These are as shown below.
Institution Number of seed nuts secured to raise seedlings
Shimo La Tewa Prison 3,350
Lake Kenyatta ATC 7,500
Kilifi Prison; 10,000
KARI Matuga 13,000
KARI Msabaha 5,400
Mtwapa ATC 6,090
TOTAL 45,340
Source: KCDA Database 2012
2.4 Coconut Seedlings Distributed In the quest to rehabilitate senile coconut orchards as well as increase coconut tree population, Kenya Coconut Development Authority is engaged in distributing coconut seedlings to farmers. The Authority has targeted to distribute 500,000 coconut seedlings by the end of 2012/2013 financial year. The table and the figure below depict seedlings distributed to date and the targeted figure by the end of 2012/2013 financial year
Year Seedlings Distributed
2009/2010 99,531
2010/2011 74,536
2011/2012 269,186
2012/2013 500,000 (projected)
Source: KCDA Database 2012
0.0
100.0
200.0
300.0
400.0
500.0
2009/2010 2010/2011 2011/2012 2012/2013
Year of distribution
Seed
lings
dis
trib
uted
('0
00)
Source: KCDA Database 2012
7
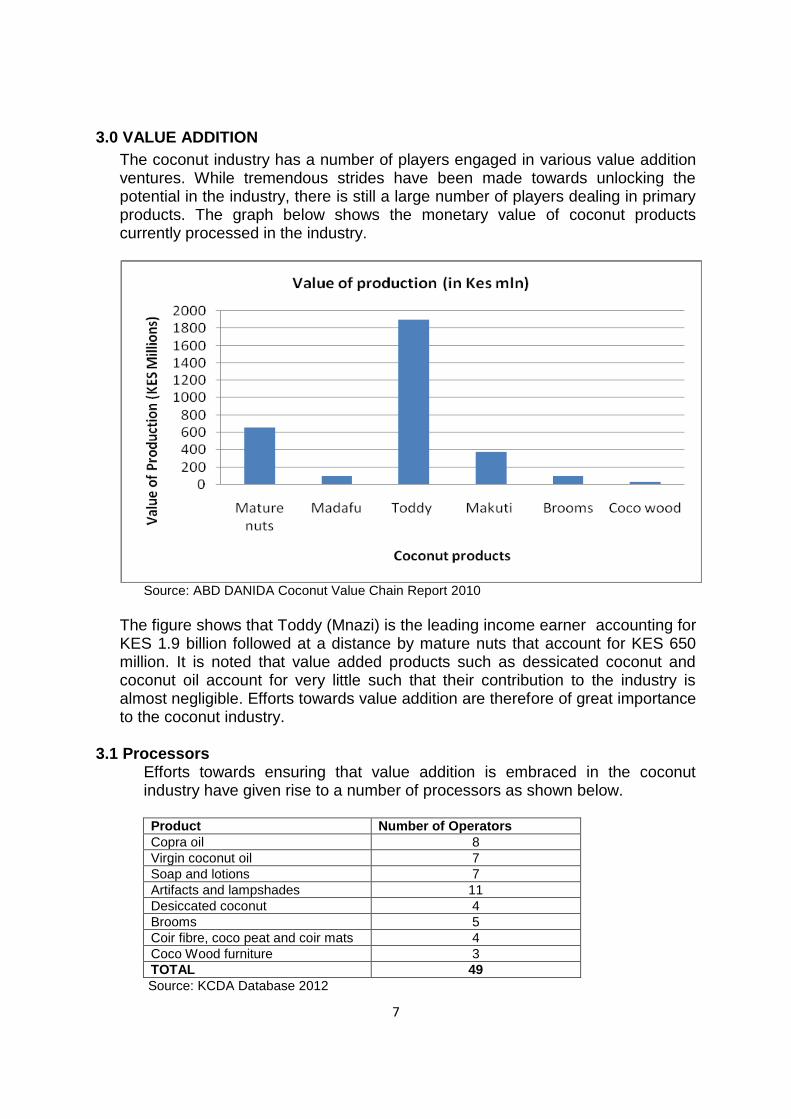
3.0 VALUE ADDITION
The coconut industry has a number of players engaged in various value addition ventures. While tremendous strides have been made towards unlocking the potential in the industry, there is still a large number of players dealing in primary products. The graph below shows the monetary value of coconut products currently processed in the industry.
Source: ABD DANIDA Coconut Value Chain Report 2010
The figure shows that Toddy (Mnazi) is the leading income earner accounting for KES 1.9 billion followed at a distance by mature nuts that account for KES 650 million. It is noted that value added products such as dessicated coconut and coconut oil account for very little such that their contribution to the industry is almost negligible. Efforts towards value addition are therefore of great importance to the coconut industry.
3.1 Processors Efforts towards ensuring that value addition is embraced in the coconut industry have given rise to a number of processors as shown below.
Product Number of Operators
Copra oil 8
Virgin coconut oil 7
Soap and lotions 7
Artifacts and lampshades 11
Desiccated coconut 4
Brooms 5
Coir fibre, coco peat and coir mats 4
Coco Wood furniture 3
TOTAL 49
Source: KCDA Database 2012

8
These processors are concentrated in Mombasa, Kilifi, Kwale, Lamu and Kaloleni counties. Efforts towards having such entities in Taita Taveta County will be required as this is a border point that presents huge potential for export endeavors. There are a few processors outside the coastal region. These are mainly in Nairobi and Nakuru.
3.2 Dealers of Primary Coconut Products
Source: KCDA Database 2011
From the figure, it is interesting to note that only Kaloleni district has groups of dealers engaged in all the common coconut primary products with Lamu West dealing in only one. This implies that there are players in the coconut industry engaged in some form of business whose capacity can be enhanced through training and provision of resources. This will in turn ensure value addition which is critical for unlocking the potential in the coconut sub-sector.
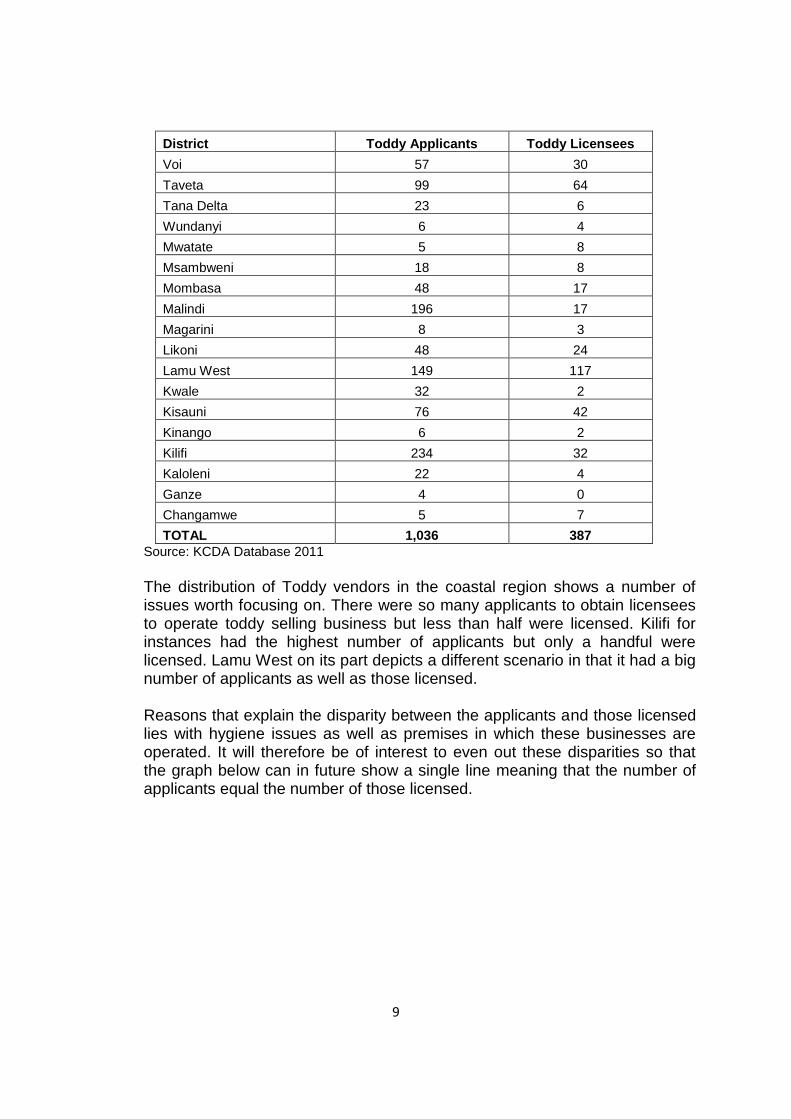
3.3 Toddy (Mnazi) Vendors Noting that Toddy contributes the most to the earnings in the coconut sub-sector, the distribution of these players in the coastal region is worth looking at.
9
District Toddy Applicants Toddy Licensees
Voi 57 30
Taveta 99 64
Tana Delta 23 6
Wundanyi 6 4
Mwatate 5 8
Msambweni 18 8
Mombasa 48 17
Malindi 196 17
Magarini 8 3
Likoni 48 24
Lamu West 149 117
Kwale 32 2
Kisauni 76 42
Kinango 6 2
Kilifi 234 32
Kaloleni 22 4
Ganze 4 0
Changamwe 5 7
TOTAL 1,036 387
Source: KCDA Database 2011
The distribution of Toddy vendors in the coastal region shows a number of issues worth focusing on. There were so many applicants to obtain licensees to operate toddy selling business but less than half were licensed. Kilifi for instances had the highest number of applicants but only a handful were licensed. Lamu West on its part depicts a different scenario in that it had a big number of applicants as well as those licensed.
Reasons that explain the disparity between the applicants and those licensed lies with hygiene issues as well as premises in which these businesses are operated. It will therefore be of interest to even out these disparities so that the graph below can in future show a single line meaning that the number of applicants equal the number of those licensed.

10
Source: KCDA Database 2011
3.4 Price of Mature Nuts The price of mature nuts has been fluctuating from time to time. Since March 2012,
we have been tracking wholesale market price at Kongowea market. Our
observation is that coconut price is influenced by size of nut; supply and demand
conditions in the market as well as rainfall patterns in that order. Other factors that
have a bearing on determination of price are maturity level of the nut and festive
events such as the holy month of Ramadhan.
Nuts are sold in pieces and four major categories of nuts based on size have
emerged. The categories include small; medium; large and phantom sizes each
attracting different price range. Generally, our analysis demonstrates that the
average price of the nut oscillates between a minimum price of KES 10 and an upper
price limit of KES 14. Price data is reported in two different panels in the section
below.
Table 1: Average Monthly Price (KES)
Month Average price
March 11
April 10.6
May 11.2
June 11.4 Source: KCDA Database 2012

11
Monthly Average Price (KES)
Source: KCDA Database 2012
Daily Price Fluctuation for Mature Nuts (March - June 2012)
Source: KCDA Database 2012

12
DAILY AVERAGE WHOLESALE PRICE DATA FOR THE PERIOD BETWEEN MARCH AND JUNE 2012
DATE
COCONUT GRADE/PRICE
E D C B A AVER PRICE
18/03/12 6 9 13 19 24 14.2
19/03/12 7 10 13 15 0 9
20/03/12 5 8 10 13 16 10.4
22/03/12 5 8 10 13 16 10.4
24/03/12 5 7 10 13 15 10
25/03/12 7 9 10 13 16 11
27/03/12 7 9 13 15 18 12.4
29/03/12 7 10 13 16 18 12.8
30/03/12 5 7 10 13 16 10.2
31/03/12 5 7 10 13 15 10
01/04/12 7 8 10 13 16 10.8
03/04/12 6 9 16 19 24 14.8
05/04/12 5 8 10 13 16 10.4
07/04/12 5 8 10 13 16 10.4
10/04/12 5 7 10 13 16 10.2
24/04/12 5 7 10 13 15 10
25/04/12 5 7 10 13 15 10
26/04/12 5 7 10 13 15 10
27/04/12 5 7 10 13 15 10
28/04/12 5 7 10 13 15 10
29/04/12 5 7 10 13 16 10.2
05/05/12 7 10 13 15 16 12.2
06/05/12 5 7 10 13 16 10.2
07/05/12 7 10 13 15 15 12
08/05/12 5 8 10 13 15 10.2
09/05/12 5 8 10 13 15 10.2
10/05/12 5 7 10 13 15 10
11/05/12 7 10 13 15 16 12.2
14/05/12 6 7 10 13 16 10.4
15/05/12 5 8 10 13 16 10.4
16/05/12 6 7 10 13 18 10.8
17/05/12 5 8 10 13 17 10.6
18/05/12 6 8 10 15 18 11.4
19/05/12 6 8 10 15 17 11.2

13
20/05/12 6 7 10 15 18 11.2
21/05/12 5 8 10 13 17 10.6
22/05/12 10 12 15 17 13.5
23/05/12 8 10 12 15 17 12.4
24/05/12 8 10 12 15 17 12.4
25/05/12 8 10 12 15 17 12.4
26/05/12 5 10 12 15 10.5
27/05/12 5 10 12 15 10.5
28/05/12 5 10 12 15 10.5
29/05/12 5 8 10 12 15 10
30/05/12 5 8 10 12 15 10
31/05/12 10 13 15 17 13.75
01/06/12 5 10 15 10
02/06/12 5 10 15 10
03/06/12 10 12 17 13
04/06/12 10 12 17 13
05/06/12 8 10 12 17 11.75
06/06/12 5 10 12 15 10.5
07/06/12 7 10 15 17 12.25
08/06/12 7 10 12 15 11
09/06/12 7 10 15 17 12.25
10/06/12 7 10 13 17 20 13.4
11/06/12 7 10 13 15 20 13
12/06/12 7 10 13 15 20 13
13/06/12 10 13 15 20 14.5
14/06/12 5 8 10 13 16 10.4
15/06/12 5 8 10 13 16 10.4
16/06/12 5 8 10 12 15 10
17/06/12 5 8 10 12 15 10
18/06/12 7 10 13 15 11.25
19/06/12 5 8 10 13 15 10.2
20/06/12 7 10 13 15 17 12.4
21/06/12 5 8 10 13 15 10.2
22/06/12 8 10 13 15 11.5
23/06/12 10 12 15 17 13.5
24/06/12 10 12 15 17 13.5
25/06/12 10 12 15 17 13.5
26/06/12 8 10 12 15 17 12.4 Source: KCDA Database 2012

14
4.0 EXPORTS AND IMPORTS
Kenya is engaged in the exportation of coconut products albeit in small proportions. Conversely it imports a lot of coconut products cementing the fact that value addition is still an issue to grapple with. Below is a table showing monetary value of both exports and imports in the coconut sub-sector for the period 2007 to 2011.
Year Export value (KES) Import value (KES)
2007 - 333,567,503.47
2008 - 430,699,883.92
2009 - 260,931,460.69
2010 9,081,861,24 182,162,299.33
2011 47,659,803.32 835,456,011.47
Source: KRA Staitistical Record 2012
Adequate statistics for the year 2009 and 2010 in relation to imports were not obtained because of coding issues. The figures given only give the status of imports in the first six months of the years in question. Regarding exports, a framework to determine exports between the year 2007 and 2009 was not yet in place until 2010. The volumes of trade at that time were almost negligible attracting little interest in the same. Nonetheless it is noted that the volume of trade of exports and imports is steadily rising.
4.1 Exports
Coconut exports from the country in the year 2011 were dominated by raw coconuts. Other products exported during the year included, virgin coconut oil, coco peat, desiccated coconut and coconut milk. The tables below show where the products were exported to and the quantities involved.
Destination Country Nuts (Pcs) CIF (KES)
Tanzania 14,792,388 19,745,000.00
Uganda 108,651 309,050.00
Djibouti 76 3,768.95
Mauritius 44,983 1,213,297.89
Pakistan 360 245,680.00
TOTAL 14,946,458 21,516,796.84 Coconut Exports 2011 (Source KRA Statistical Records 2012)

15
Destination Country Litres CIF (KES)
United States of America 47,800 11,227,771.33
Uganda 400 118,325.05
Yemen 32,512 4,560,745.63
Netherlands 60 6,287.02
Canada 2,976 1,546,431.28
TOTAL 83,748 17,459,560.31 Virgin Coconut Oil Exports 2011 (Source KRA Statistical Records 2012)
Destination Country Kilograms CIF (KES)
Coco peat Uganda 46,200 2,648,785.72
Tanzania 57,000 3,032,852.44
TOTAL 103,200 5,681,638.16
Dessicated coconut Kilograms CIF (KES)
Uganda 8,630 2,872,280.00
Sudan 10 2,000.00
TOTAL 8,640 2,874,280.00
Coconut milk Kilograms CIF (KES)
Sudan 45 12,244.00
TOTAL 45 12,244.00 Various Coconut Products Exports 2011 (Source KRA Statistical Records 2012)
4.2 Imports
Various coconut products were imported in the year 2011 with crude coconut oil taking the lead. This product was mainly imported from Indonesia and Singapore. A summary of the value of key imports in the year 2011 is as follows. Product Kilograms CIF (KES)
Coco peat 3,470,949 118,518,163.44
Crude coconut oil 4,362,594 656,173,960.03
Desiccated coconut 59,100 12,357,913.15
Coconut milk 40,217 10,756,561.72
Virgin coconut oil 63,840 4,299,201.04
TOTAL 7,996,700 802,105,799.38 Summary of the value of Key Coconut Products’ Imports 2011 (Source KRA Statistical Records 2012)
Regarding the origin of these imports, data available indicates that South East Asian countries dominated the pack as the following shows.

16
Monetary value of Coco peat imported from various countries (Source KRA Statistical Records 2012)
Monetary value of Crude Coconut oil imported from various countries (Source KRA Statistical Records 2012)

17
Monetary value of Desiccated Coconut imported from various countries (Source KRA Statistical Records 2012)
Monetary value of Coconut Milk imported from various countries (Source KRA Statistical Records 2012)

18
Monetary value of Virgin Coconut Oil imported from various countries (Source KRA Statistical Records 2012)