Embed Size (px)
Citation preview

Kenya Data Cube Project PlansBrian KilloughCEOS Systems Engineering Office (SEO)
CEOS SDCG-7 MeetingSydney, AustraliaMarch 4, 2015 (Day #3)
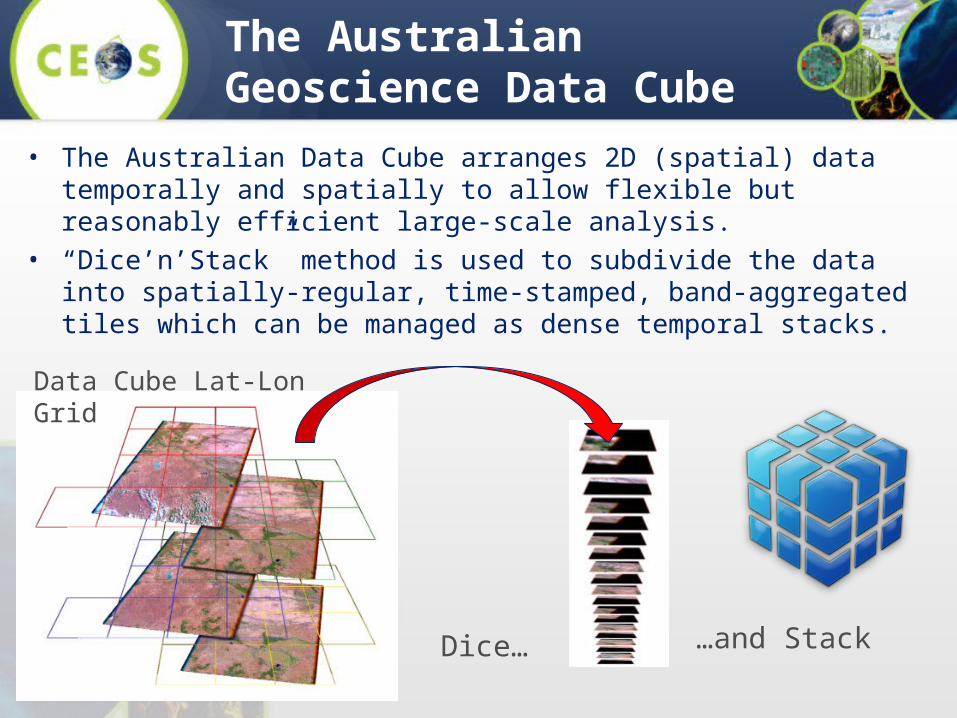
The Australian Geoscience Data Cube• The Australian Data Cube arranges 2D (spatial) data temporally
and spatially to allow flexible but reasonably efficient large-scale analysis.
• “Dice’n’Stack” method is used to subdivide the data into spatially-regular, time-stamped, band-aggregated tiles which can be managed as dense temporal stacks.
Dice… …and Stack
Data Cube Lat-Lon Grid
3
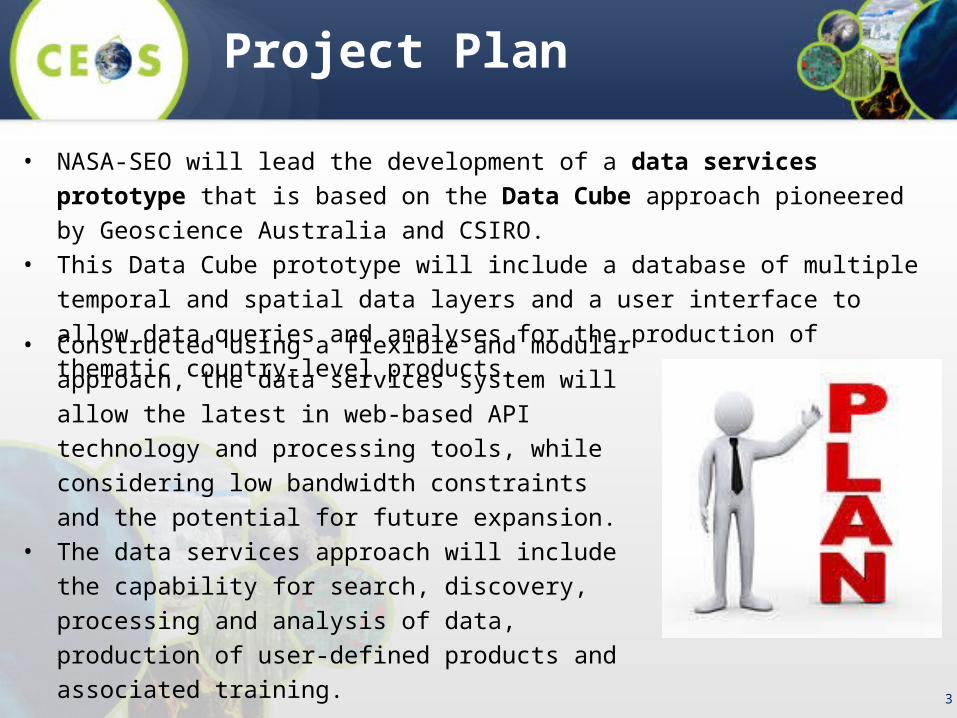
• NASA-SEO will lead the development of a data services prototype that is based
on the Data Cube approach pioneered by Geoscience Australia and CSIRO. • This Data Cube prototype will include a database of multiple temporal and spatial
data layers and a user interface to allow data queries and analyses for the
production of thematic country-level products.
Project Plan
• Constructed using a flexible and modular approach,
the data services system will allow the latest in web-
based API technology and processing tools, while
considering low bandwidth constraints and the
potential for future expansion. • The data services approach will include the capability
for search, discovery, processing and analysis of data,
production of user-defined products and associated
training.
4
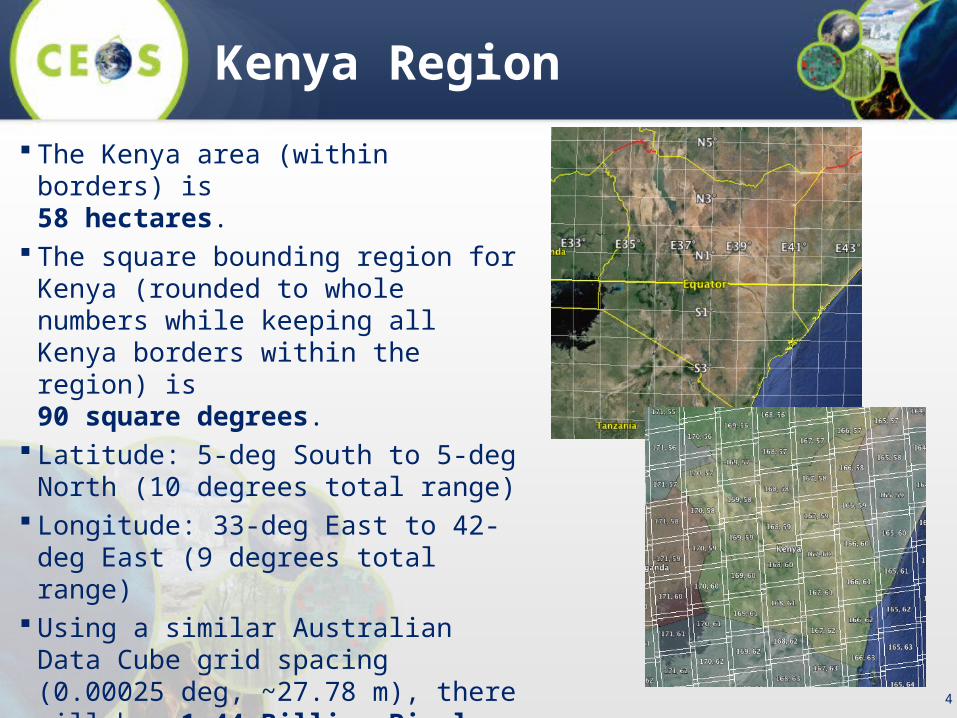
Kenya Region
The Kenya area (within borders) is 58 hectares.
The square bounding region for Kenya (rounded to whole numbers while keeping all Kenya borders within the region) is 90 square degrees.
Latitude: 5-deg South to 5-deg North (10 degrees total range)
Longitude: 33-deg East to 42-deg East (9 degrees total range)
Using a similar Australian Data Cube grid spacing (0.00025 deg, ~27.78 m), there will be ~1.44 Billion Pixels
Landsat Scenes: 33Landsat Scene Area: 104 hectaresSince 1999, over 6300 scenes ... 1.15TB
5
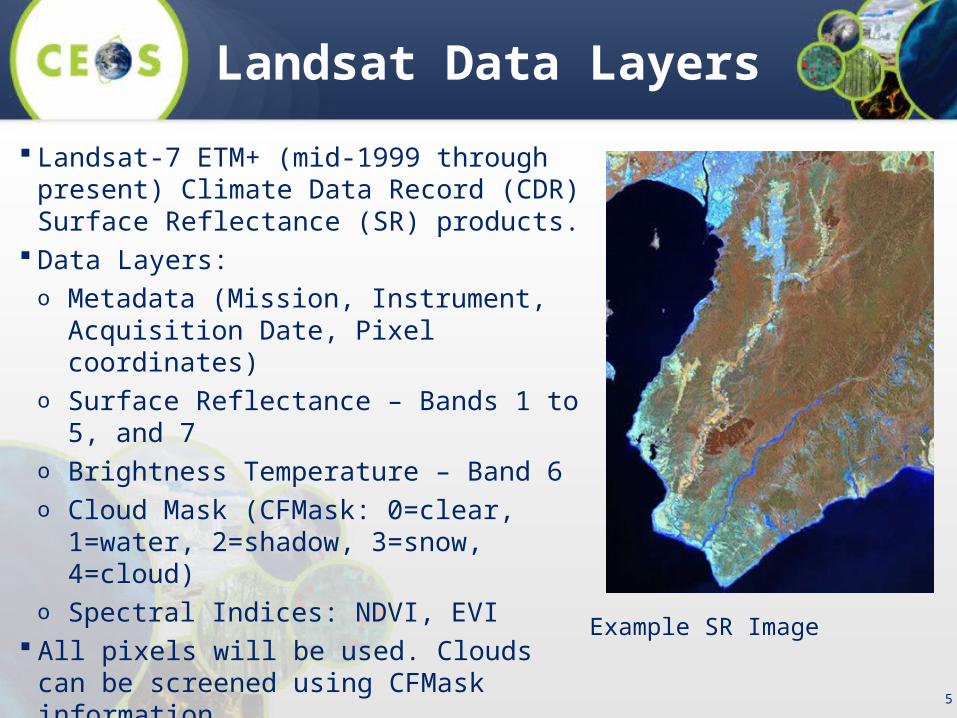
Landsat Data Layers
Landsat-7 ETM+ (mid-1999 through present) Climate Data Record (CDR) Surface Reflectance (SR) products.
Data Layers:o Metadata (Mission, Instrument,
Acquisition Date, Pixel coordinates)o Surface Reflectance – Bands 1 to 5, and 7o Brightness Temperature – Band 6 o Cloud Mask (CFMask: 0=clear, 1=water,
2=shadow, 3=snow, 4=cloud)o Spectral Indices: NDVI, EVI
All pixels will be used. Clouds can be screened using CFMask information.
Example SR Image
6
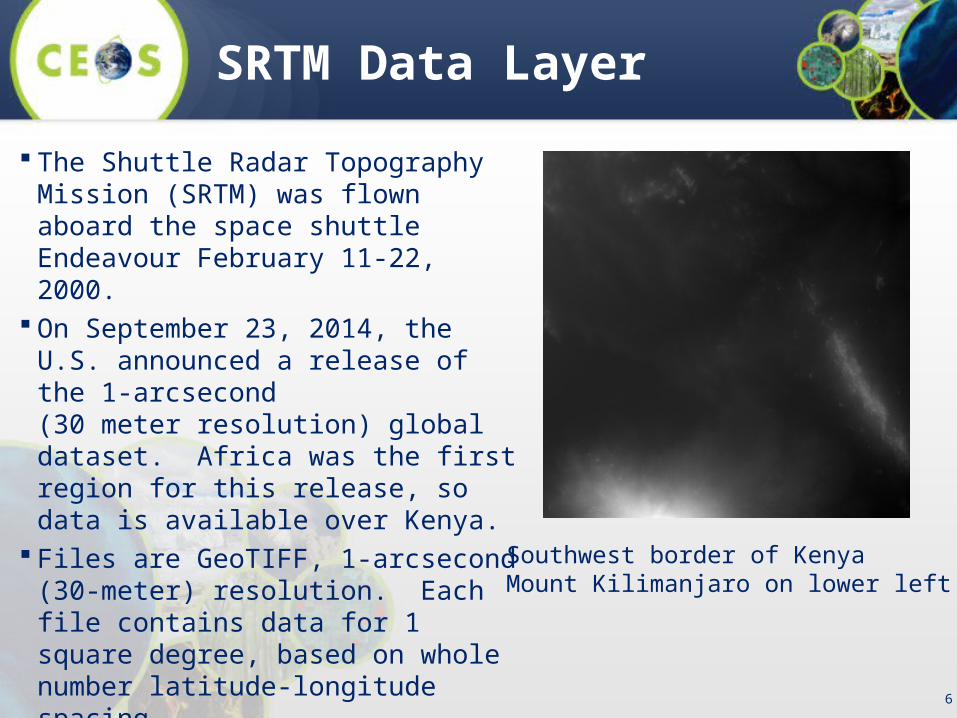
SRTM Data Layer
The Shuttle Radar Topography Mission (SRTM) was flown aboard the space shuttle Endeavour February 11-22, 2000.
On September 23, 2014, the U.S. announced a release of the 1-arcsecond (30 meter resolution) global dataset. Africa was the first region for this release, so data is available over Kenya.
Files are GeoTIFF, 1-arcsecond (30-meter) resolution. Each file contains data for 1 square degree, based on whole number latitude-longitude spacing.
The estimated total number of datasets is 90 (one per square degree). The total storage space is estimated at 90 * 26MB each = 2.34GB.
Southwest border of KenyaMount Kilimanjaro on lower left
7
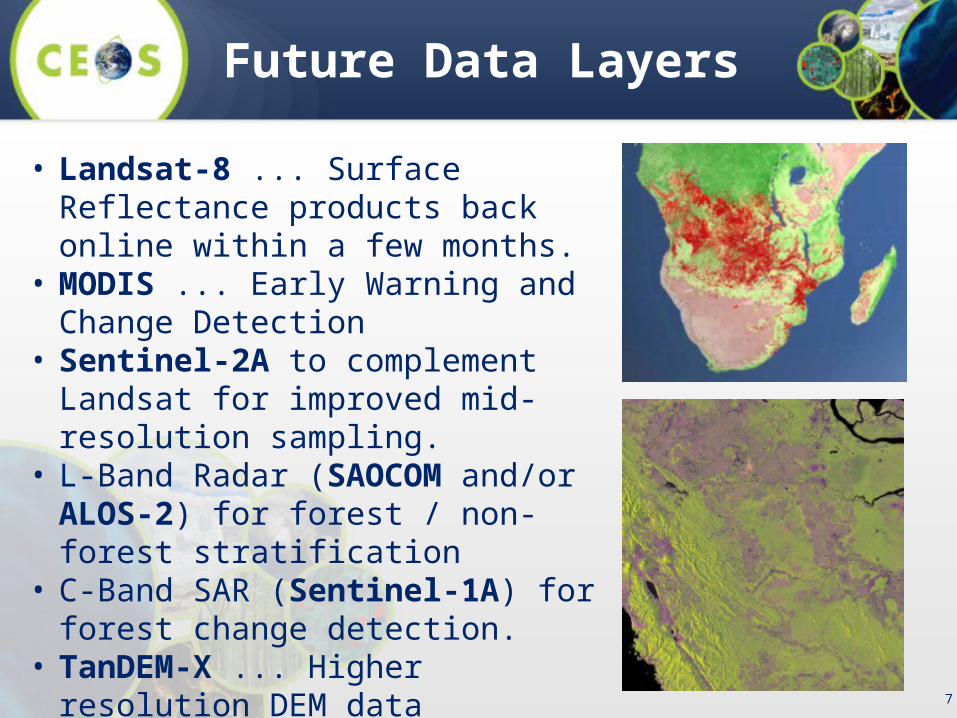
• Landsat-8 ... Surface Reflectance products back online within a few months.
• MODIS ... Early Warning and Change Detection
• Sentinel-2A to complement Landsat for improved mid-resolution sampling.
• L-Band Radar (SAOCOM and/or ALOS-2) for forest / non-forest stratification
• C-Band SAR (Sentinel-1A) for forest change detection.
• TanDEM-X ... Higher resolution DEM data• Other High Resolution datasets to
support R&D
Future Data Layers
8
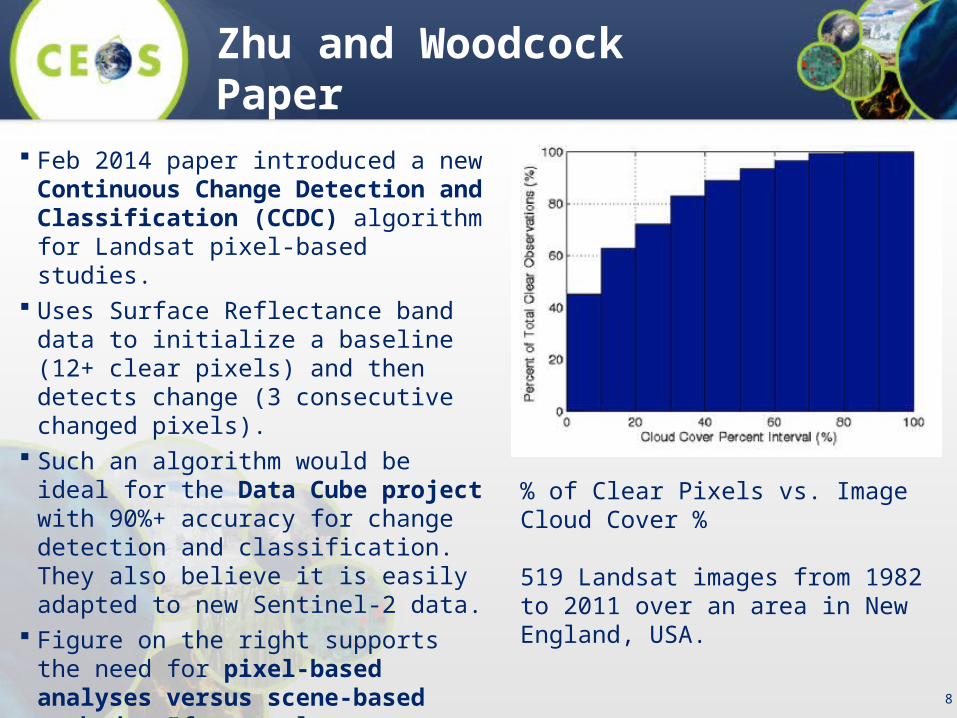
Zhu and Woodcock Paper2014, Remote Sensing of Environment Feb 2014 paper introduced a new Continuous
Change Detection and Classification (CCDC) algorithm for Landsat pixel-based studies.
Uses Surface Reflectance band data to initialize a baseline (12+ clear pixels) and then detects change (3 consecutive changed pixels).
Such an algorithm would be ideal for the Data Cube project with 90%+ accuracy for change detection and classification. They also believe it is easily adapted to new Sentinel-2 data.
Figure on the right supports the need for pixel-based analyses versus scene-based methods. If one only uses scenes with <10% cloud cover (typical threshold for "clear" scenes) one would omit 50% of the clear pixels by not considering pixels from all of the "cloudy" scenes.
% of Clear Pixels vs. Image Cloud Cover %
519 Landsat images from 1982 to 2011 over an area in New England, USA.
9
Project Schedule
March 9-11: The NASA Systems Engineering Office (SEO) team and GA will meet in Canberra to initiate the Data Cube Project for Kenya.
April 2015: SEO to procure Amazon Web Services (AWS). Submit batch processing order to USGS for 6300+ Landsat-7 images (surface reflectance products). Download L7 products and SRTM data over Kenya.
June 2015: Release #1 of Data Cube. Basic Data Cube with no user interface. September 2015 (SDCG-8): Release #2 of Data Cube. Addition of Landsat-8
datasets. Add API-based user interface and product development tools for interacting with the Data Cube and creating analysis results. SEO to demonstrate operation of the Data Cube and obtain feedback from the SDCG group.
Early 2016: Release #3 of Data Cube for SDCG-9 Meeting. Addition of MODIS and Sentinel-2A products.
Dec 31, 2016: End of Project. Determine transition plan to deliver Data Cube to Kenya for daily operations and maintenance. Also develop an automated plan for incremental ingestion of new data into the cube.