Embed Size (px)
Citation preview

Kenyan Awareness of Aflatoxin:
An Analysis of Processed Milk Consumers
Nadhem Mtimet1*
, Maria Walke2, Derek Baker
3, Johanna Lindahl
1,
Monica Hartmann2 and Delia Grace
1
1International Livestock Research Institute (ILRI) – Kenya
2University of Bonn – Germany
3University of New England – Australia
*Corresponding author: [email protected]
Abstract
Aflatoxin is a human health threat in many developing countries. This study
examines Kenyan milk consumers’ behaviour toward aflatoxin by way of choice
experiments. Further, the willingness to pay for different types of milk and
aflatoxin status awareness was assessed. Five attributes were selected to
describe milk products: milk processing technique, fat content, packaging,
price and aflatoxin-free certification.
Results indicate that awareness of aflatoxin is high, and that consumers are
willing to pay a significant premium for milk that is certified as aflatoxin-free.
Results also show, however, that the substantial majority does not know how to
avoid aflatoxin-contaminated milk. The results indicate a great need for further
education and awareness-raising programs throughout the Kenyan dairy value
chain, and a potential for market-based solutions to aflatoxin control in milk.

1
1. Introduction
Aflatoxins are mycotoxins produced by certain species of moulds, mainly Aspergillus
flavus and Aspergillus parasiticus. Aflatoxins are considered an important public health
concern in the developing world and can seriously affect people’s health and livelihoods. The
problem is rooted throughout the food chain, and as freedom of choice in food is limited for a
poor and food-insecure population, exposure to aflatoxin is widespread and consumers in
developing countries are at risk from aflatoxin-related illnesses. Recent estimates suggest that
there are more than five billion people worldwide at risk of chronic exposure to aflatoxins
(Williams et al., 2004; WHO, 2005).
Although there are no accurate estimates of incidence of chronic and acute disease
related to aflatoxin exposure, outbreaks in Kenya (1982, 2001, 2004 and 2005) and Somalia
(1997/98) indicate the magnitude of the problem. The 2004 outbreak in Kenya was
responsible for 317 cases and 125 deaths. A known consequence of chronic exposure to
aflatoxins is increased risk of liver cancer. Moreover, aflatoxin exposure in young children
has been shown to be associated with stunting and underweight (Wang et al., 1996; WHO,
2005). In general, adults have a higher tolerance for aflatoxin than children, and children are
more prone to death from acute aflatoxicosis (Cullen and Newberne, 1994).
Because Kenya´s climate is favorable to the growth of aflatoxin-producing moulds, the
country faces high risk of mycotoxin-related livestock and human poisoning (Lanyasunya et
al., 2005). Humans are exposed to aflatoxins not only through staple foods such as cereals,
but also through animal source food; the most risky food is milk (Jarvis, 2002). Aflatoxins
found in milk are produced by lactating animals after they have consumed aflatoxin-
contaminated feed or fodder (Lanyasunya et al., 2005; Lizárraga-Paulin, 2011). The most
effective means of controlling aflatoxin in milk is therefore by restricting its presence in the
cattle´s feed (FAO, 2005).
Feed represents the largest part of the cost of milk production in market-oriented Kenyan
dairy farming, and so there is a pronounced incentive for minimizing these costs. There are
consequent incentives to feed forage of low quality, and such practices are widely observed
(Muriuki, 2011). There are no effective mechanisms to ensure quality in the market for feeds.
The negative impacts of aflatoxins in milk on human health have led to several research
projects being focused on the subject. Widespread uptake of information on similar threats to

2
health in Kenya, from various sources, has been documented (USAID, 2010). The
consequence should be a dairy industry encouraged to strive for better control of aflatoxins’
occurrence in milk. Milk is an important source of animal protein in Kenya. It is of special
importance for society’s three most nutritionally vulnerable groups: infants, children and
pregnant women. Therefore, if exposure could be reduced by inspection and certification
controlling the levels of aflatoxins in milk, the overall health of Kenyans could be enhanced,
while also reducing health care costs.
In Kenya, milk production is dominated by smallholders’ dairy farmers who contribute
more than 70 percent of gross marketed production. Besides smallholders, there are around
30 licensed milk processors. More than 80 percent of the total processed milk is handled by
four largest processors combined. In addition, two of those are responsible for more than 60
percent of the total milk processing (MoLD, 2008). Standards must be realistic for this
context, for setting up and administering certification. Introducing licensing of milk
processors involves monitoring of milk quality not only at the end processing level but also at
the production level. This implies additional production and handling costs that directly affect
milk selling prices.
Understanding consumer behaviour plays a major role in the design of successful
interventions in commercial processes. Relevant research has been widely conducted in
developing countries for animal products’ consumption (e.g. Jabbar et al., 2010). The current
study aims to reveal important insights in Kenyans´ milk purchase and consumption
behaviour. It also addresses a major public health concern by focusing on aflatoxin. Kenyan
processed milk consumers’ perceptions of aflatoxin are identified, along with any willingness
to pay (WTP) for an aflatoxin-free certificate. Such WTP could encourage dairy stakeholders
to invest in credible certification instruments. This paper also identifies the needs of a
certification by providing insights into milk consumers´ attitudes.
This paper is organized into four main sections. After this introduction, the second
section is on the methodology followed and the process of data collection, followed by the
results and discussion section, and finalized by the conclusions and main recommendations.

3
2. Methodology and data
2.1 Data collection
A survey was conducted during July 2013 using face-to-face interviews with
consumers/buyers of processed milk. The survey was conducted in different urban areas of
Nairobi characterized by mainly middle-income inhabitants such as Buru-Buru, Nairobi West
and South C. Besides, customers of Sarit Centre which is one of the largest shopping malls of
Eastern Africa were interviewed.
For the selection of respondents, systematic sampling was conducted, pursuant to
assumptions of randomness over time. Refusal to participate (an early concern of the authors)
was negligible, so systematic bias concerning respondents´ characteristics is unlikely. All
categories of consumers were targeted, by way of conducting the survey across different
periods of time. This involved collection from Tuesday until Saturday from 9am to 6pm for a
3-week period. Four enumerators established a total sample size of 299 respondents.
The questionnaire contains five sections. The first addresses milk purchase and
consumption habits, and so helps depict the respondent´s purchase and consumption
behaviour. The second part assesses the respondent´s aflatoxin awareness. Following this, the
consumer was given informational text informing about aflatoxins and the risks of aflatoxins
in milk especially. This information was needed to complete the subsequent section of the
questionnaire which simulates a purchase decision by using a choice experiment. Finally,
some questions concerning the respondent´s attitudes and socio-demographic characteristics
were asked.
To choose the appropriate attributes and their corresponding levels for the choice
experiment, relevant literature about raw milk purchase and consumption in developed and
developing countries (Waithaka et al., 2002; Omore et al., 2005; Makokha and Fadiga, 2010;
Wolf et al., 2011; Fadiga and Makokha, 2014) was reviewed. To reflect the milk market´s
price level, four levels ranging from 70 KSH to 130 KSH per litre were selected (Table 1).
<< Insert Table 1 >>
The combination of the five attributes with their corresponding levels led to a total of
144 (2x3x2x3x4) hypothetical products. As the questionnaire was supposed to be completed
in a reasonable time, the number of choice cards needed to be reduced, and this task
employed an orthogonal design procedure. Considering efficiency and orthogonality

4
requirements, without reducing variability, eight choice cards was the minimum feasible
number. Each card contained three choices of hypothetical milk products. Respondents were
asked to state their most, as well as their least, preferred choice of milk (product) for each
card. The resulting choice experiment fulfils the properties of orthogonality, and exhibits a
high D-efficiency level (95%). Figure 1 shows an example of a choice experiment card. This
type of experiment is better known as a Best-Worst, or sometimes a Most-Least, experiment.
<< Insert Figure 1 >>
Respondents were asked to indicate the most and least preferred products. In the case of
this experiment which includes three alternatives, the choice of most and least preferred
products makes possible the full classification of the three products. Because the alternatives
have no specific label or name, this class of choice experiment is referred to as generic or
unlabelled (Louviere et al., 2000).
2.2 Methodology
Conjoint analysis arises from the theory of Lancaster (1966), which stipulates that utility
is derived from the properties or characteristics that goods possess (bundle of attributes)
rather than the good per se. Since its first development during the 1970s (Green and Rao,
1971; Green and Srinivasan, 1978), the conjoint analysis technique has grown in popularity
and has been extended to many disciplines such as transportation, telecommunications, the
environment, marketing, and human health. In the agrifood sector, various studies used
conjoint analysis (choice experiments) to explore consumer behaviour.
Choice experiment derives from the Lancaster assumption regarding overall utility
decomposition as well as random utility theory (Manski, 1977). The latter states that overall
utility Uij can be expressed as the sum of a systematic (deterministic) component Vij, which is
expressed as a function of the attributes presented (raw milk characteristics in this example),
and a random stochastic component 𝜀𝑖𝑗:
𝑈𝑖𝑗 = 𝑉𝑖𝑗 + 𝜀𝑖𝑗 (Equation 1)
Lancaster theory leads to the following linear additive decomposition of Vij:
𝑉𝑖𝑗 = 𝛽1𝑥𝑖𝑗1 + 𝛽2𝑥𝑖𝑗2 + … + 𝛽𝑛𝑥𝑖𝑗𝑛 (Equation 2)

5
where xijn is the nth
attribute value for card j for consumer i, and 𝛽n represents the coefficients
to be estimated. Finally, following additional assumptions about the distribution of the error
term, the following probability models could be derived:
Conditional logit (CL) (McFadden, 1973):
Pr(𝑗) = 𝑒
𝑉𝑖𝑗
∑ 𝑒𝑉𝑖𝑘𝑘∈𝐶𝑛
(Equation 3)
Random parameters logit (RPL) model (Train, 2009):
Pr(𝑖) = ∫(𝑒𝛽′.𝑋𝑛𝑖
∑ 𝑒𝛽′.𝑋𝑛𝑗
𝑗
). 𝑓(𝛽). 𝑑𝛽 (Equation 4)
where 𝑓(𝛽) is the density function of 𝛽
Based on the aforementioned models, the willingness to pay (for specific attributes)
(WTP) estimates are obtained as follows (Haefele and Loomis, 2001):
𝑊𝑇𝑃𝑖 = −𝛽𝑖
𝛽𝑝𝑟𝑖𝑐𝑒 (Equation 5)
In the case of the RPL model, a normal distribution for the random parameters is
imposed.
3. Results and discussion
3.1 Milk purchase and consumption habits
The following paragraphs present the descriptive statistics for the study. As per sampling
strategy, every respondent is consuming or buying raw milk, and all are Kenyan citizens.
Respondents were asked about their milk purchase habits (Table 2). For almost every
respondent, processed milk is the first choice. Around nine percent consider raw milk as
second choice. Cow milk is consumed by all respondents while other types of milk, such as
goat and camel milk, play a negligible role.
<< Insert Table 2 >>
Women are more responsible for the household´s milk purchase than are men. The
preferred purchase places of processed milk consumers in middle income areas of Nairobi are
super-/hypermarkets as well as shops (Table 2). Kiosks, milk bars, and hawkers only play a
minor role as purchase places. More than half of the respondents buy milk once a day, and 14

6
percent more than once a day. These numbers reflect the consumers´ concerns about
freshness and quality concerning dairy products.
Three quarter of the respondents report knowing who has produced the milk they are
buying and were asked how much they trust the producer to provide hygienically produced
milk. The majority of respondents (90 percent) fully or mostly trust; only three percent do not
trust at all.
The amounts of milk bought per purchase vary from 0.3 litres until more than 2.5 litres.
Due to the common packaging sizes, the most popular amount bought is half a litre and one
litre. The prices per litre primarily ranged between 80 KSH, 90 KSH and 100 KSH. Ten
percent did not remember the amount of milk and even 16 percent did not know the price of
the milk they recently purchased. The prices given by the respondents display the medium
price level of the choice experiment which ranges between 70 KSH and 130 KSH.
Survey results for consumption habits are presented in Table 3. A high proportion of
respondents report boiling milk prior to consumption and the majority of them believe milk is
totally safe after boiling. The main reasons stated for boiling the milk (multiple answers
allowed) were health and hygienic concerns, followed by the preference of warming the milk
up and by “because everybody does it”.
<< Insert Table 3 >>
Almost half of the respondents drink milk on a daily basis where the quantities of 250ml,
300ml and 500ml are the most frequent ones. In general, the quantities consumed vary from
small amounts used in tea to amounts of half a litre. Half of the respondents consume milk
every day, whereas this proportion of is slightly higher in the case of children (from three to
18 years of age), and much higher in the case of infants (two years and younger). On the
other hand, 13 percent of households´ infants never consume milk (Table 3).
3.2 Consumers’ aflatoxin awareness and opinions on certificates
Table 4 summarizes some of the findings of the aflatoxin awareness testing. These show
that eighty percent of processed milk consumers have already heard about aflatoxins. In
addition, the vast majority (72 percent) of those who had never heard about aflatoxin indicate
that they do not know whether it can be transferred into milk. Without distinguishing between
those who have heard or not have heard about aflatoxin, almost half of the 299 respondents

7
believe that aflatoxins in feed can be transferred into the milk. These respondents were asked
further questions concerning aflatoxins in milk.
<< Insert Table 4 >>
Respondents further assessed the health impact on humans when consuming aflatoxin
contaminated milk. The majority perceive a serious or medium threat. They were also asked
if it is possible to make aflatoxin contaminated milk safe for human consumption. There is no
substantial difference in the answers given, between persons that knew about aflatoxin
before, and those that did not. In total, 23 percent assume that it is, 29 percent think it is not,
and 48 percent do not know if it is possible to make the contaminated milk safe. Respondents
who indicated that they believe it is possible to make aflatoxin contaminated milk safe for
human consumption were also asked how this can be done (an open-ended question). The
majority answered boiling the milk, although in fact boiling the milk will not help to make
aflatoxin contaminated milk safe. Also using new technologies or/and chemicals and
controlling/testing of milk or/and feed was an often stated answer by processed milk
consumers. Only few people said that not feeding contaminated feed ensures safe milk,
although this is, according to FAO (2005), the most effective means of controlling aflatoxins
in milk.
In addition to assessing the WTP for aflatoxin-free certified milk, it is important to know
consumers´ attitude towards information provided by the industry or government, such as
labels and certificates which would be the main communicated elements of the certification
system. The survey sought respondents´ opinions about food certificates/food safety labels, as
well as information given on product packaging labels and commercial advertisements.
Results are similar for both of these as indicated in Table 5. However, the perception of
certificates and labels is slightly more positive than that of packaging and advertisements.
Around 40 percent fully or mostly trust in food certificates and labels; the same percentage
does not. Another 16 percent do not even look at those. Concerning packaging labels and
advertisements, around 30 percent have a rather positive attitude, more than 40 percent are
negatively-minded and some 28 percent do not even look at them.
<< Insert Table 5 >>
The survey also assessed milk consumers´ main sources of information for staying
current. Multiple answers were allowed and the results are consistent with those achieved by

8
USAID in 2010. Television is the most popular one, and it’s followed by internet, radio and
newspaper. Consequently, TV and internet are the most efficient channels to inform people in
urban areas. As outlined above, these communication means are available to organizations in
order to spread information, for example about health threats and new products.
3.3 Models’ estimates and consumers’ willingness to pay
3.3.1. Models’ estimates
As discussed, we used two models (CL and RPL) to analyse the importance of raw milk
attributes and evaluate consumers’ willingness to pay (WTP) for processed milk attributes.
The log likelihood ratio test (LL) indicates the two models´ overall significance. The obtained
results (Table 6) for both models feature almost the same coefficients´ signs and pattern of
significance. The majority of the variables are significant at a 1% or 5% level of test, in each
model.
<< Insert Table 6 >>
Results from Table 6 indicate that consumers prefer pasteurized to UHT milk. In the case
of RPL model the coefficient is not statistically significant although heterogeneity of
consumers’ perception is depicted by the highly significant standard deviation of the random
parameter coefficient (SD_UHT). We performed a likelihood ratio test to test the null
hypothesis that the conditional logit fits the data better than the random parameters logit.
Result indicates the rejection of the null hypothesis (likelihood ratio = 858.8 > 𝜒(7; 1%)2 =
18.48). Thus the RPL model is preferred to the CL model. All the coefficients of the standard
deviation of the random parameters are statistically significant at 1% level, which indicates
heterogeneous preferences among processed milk consumers.
The RPL model estimates indicate that consumers prefer milk with higher fat content:
whole milk is preferred to low fat milk which is preferred to skimmed milk. As expected,
aflatoxin-free certified milk is preferred to non-certified one. The negative price coefficient
estimate indicates that lower prices are preferred to higher prices, which is consistent with
conventional demand theory. Consumers prefer TetraPak packaged milk in comparison to
plastic container and pouch.
From the estimated means and standard deviations of the coefficients, it is possible to
assess the share of the respondent that place a positive or negative value on the attribute trait

9
(Ouma et al., 2007). Certified aflatoxin-free milk is preferred by 93% of the respondents,
which indicates that the majority of the population prefers a certified product. The consensus
is lower when it comes to whole milk preference where only 55% of the population shows a
positive preference for this trait. The proportion is much lower for the skimmed
characteristic, where only 36% of the population shows a positive preference for the attribute.
3.3.2. Consumers’ willingness to pay
The second step in the analysis was to estimate consumers’ willingness to pay (WTP)
following equation 5. Table 7 summarizes the WTP estimates and 95% confidence intervals
obtained following the Krinsky and Robb (1986) parametric bootstrapping procedure with
2,000 replications. The WTP estimates obtained with CL and RPL differ. This was expected
since for the latter model, consumers’ preference heterogeneity is taken into account.
<< Insert Table 7 >>
Although the great majority of respondents stated that they fully or mostly trust in the
hygienic milk handling of milk producers, results indicate that they would be willing to pay a
premium for improved quality. Especially for an aflatoxin-free certificate, Kenyan processed
milk consumers would be willing to pay a high premium. Both CL and ROL show a WTP
between 121 and 137 KSH.
On average, consumers would pay a premium of 7 KSH to avoid fat reduced milk and to
get whole milk. The negative sign of the skimmed milk´s WTP shows the disapprobation of
that kind of milk. Such results indicate that even middle-income groups consider milk as a
nutrient rather than a drink. On the other hand, it might be that taste attributes are more
important than health attributes are. Moreover, it is likely that people are prejudiced
concerning fat-reduced products as they assume they lack in taste, flavour and nutrients.
However, as important whole milk is for the undernourished population, as important it
is to educate urban Kenyans about advantages of fat-reduced milk products since obesity is
becoming a severe problem among that society (Ziraba et al., 2009; Steyn et al., 2011).
The premium people are willing to pay for milk in tetra pack compared to milk in pouch
plastic bag is around 18 KSH. Also plastic bottles are favoured which is expressed by the
WTP of around 10 KSH.
10
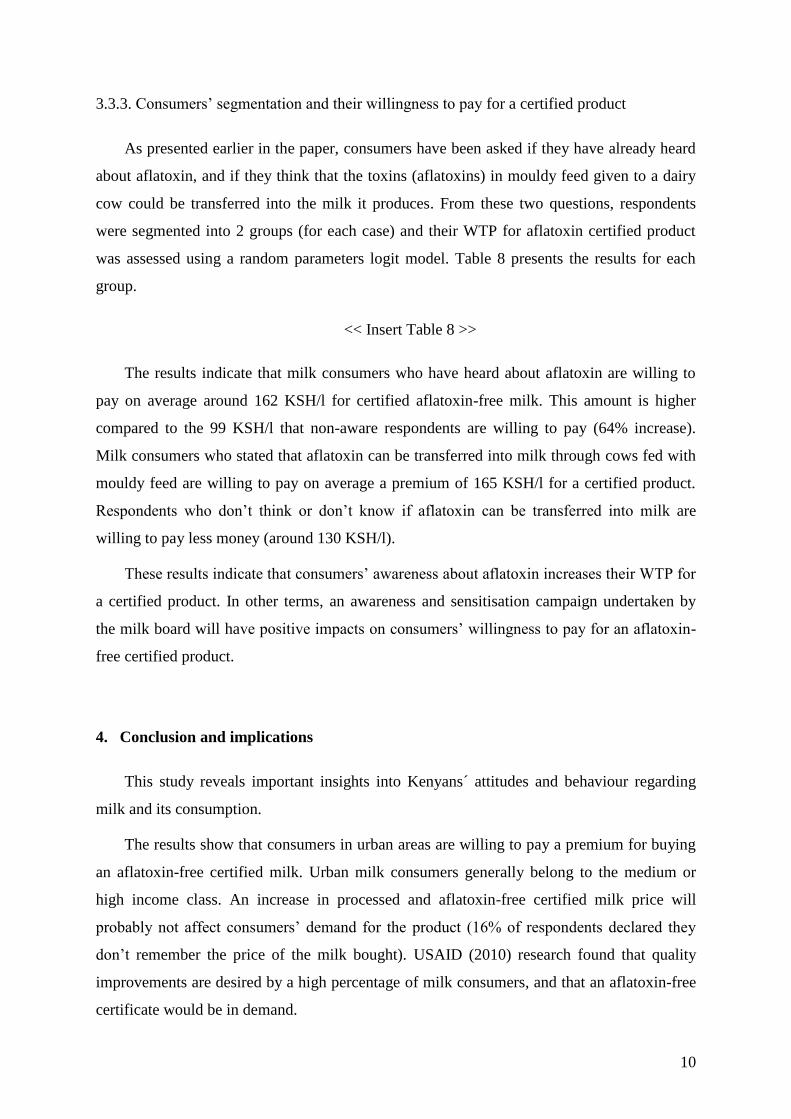
3.3.3. Consumers’ segmentation and their willingness to pay for a certified product
As presented earlier in the paper, consumers have been asked if they have already heard
about aflatoxin, and if they think that the toxins (aflatoxins) in mouldy feed given to a dairy
cow could be transferred into the milk it produces. From these two questions, respondents
were segmented into 2 groups (for each case) and their WTP for aflatoxin certified product
was assessed using a random parameters logit model. Table 8 presents the results for each
group.
<< Insert Table 8 >>
The results indicate that milk consumers who have heard about aflatoxin are willing to
pay on average around 162 KSH/l for certified aflatoxin-free milk. This amount is higher
compared to the 99 KSH/l that non-aware respondents are willing to pay (64% increase).
Milk consumers who stated that aflatoxin can be transferred into milk through cows fed with
mouldy feed are willing to pay on average a premium of 165 KSH/l for a certified product.
Respondents who don’t think or don’t know if aflatoxin can be transferred into milk are
willing to pay less money (around 130 KSH/l).
These results indicate that consumers’ awareness about aflatoxin increases their WTP for
a certified product. In other terms, an awareness and sensitisation campaign undertaken by
the milk board will have positive impacts on consumers’ willingness to pay for an aflatoxin-
free certified product.
4. Conclusion and implications
This study reveals important insights into Kenyans´ attitudes and behaviour regarding
milk and its consumption.
The results show that consumers in urban areas are willing to pay a premium for buying
an aflatoxin-free certified milk. Urban milk consumers generally belong to the medium or
high income class. An increase in processed and aflatoxin-free certified milk price will
probably not affect consumers’ demand for the product (16% of respondents declared they
don’t remember the price of the milk bought). USAID (2010) research found that quality
improvements are desired by a high percentage of milk consumers, and that an aflatoxin-free
certificate would be in demand.

11
The survey revealed that a high proportion of Kenyans does not trust certificates and
labels. As this result contradicts some other findings in similar contexts (Jabbar et al., 2010),
the need for further research is apparent, possibly on steps to improve the image of Kenyan
certification. Certification requires credibility and intense public information, as well as
institutional development. Although the current study does not address these issues directly,
its findings of significant WTP suggest that there is sufficient private incentive for change to
occur. Hence, its results can be used to put further pressure on stakeholders in the milk value
chain to tackle the challenging objective of establishing an independent certification setup
that will be accepted and trusted.
As processors are aware that milk of high quality leads to increased sales (USAID,
2010), there can be expected to be interest in enhancing their products by certifying them.
Launching a certificate involves cost which would be incident to some extent on milk
consumers. Therefore, people need to understand why there is a need to pay more for milk.
The study shows that people do not have sufficient knowledge about aflatoxin and its
associated health risks in milk. Research results such as these can then provide the latest and
most relevant information which, in association with dairy industry advertisements and
brands, can have a high impact on Kenyans and their perceptions. This advocates for
partnership amongst researchers, government and the private sector, for further research into
the topics covered here, and for further examination of experimental methods and analytical
approaches.
Acknowledgement
This article is part of the FoodAfrica Programme, financed as research collaboration
between the MFA of Finland, MTT Agrifood Research Finland, the CGIAR research
programs on: Agriculture for Nutrition and Health and on Policies Institutions Markets led
by the International Food Policy Research Institute, and the GIZ.
5. References
CBS, 1999. Population and housing census, Volume I. Central Bureau of Statistics, Ministry
of Finance and Planning, Nairobi, Kenya.
Cullen, J. M., Newberne, P. M., 1994. Acute hepatotoxicity of aflatoxins. In: Eaton DL,
Groopman JD, eds. The toxicology of aflatoxins: human health, veterinary, and agricultural
significance. San Diego: Academic Press: 3–26.
Denli, M., Pérez, J. F., 2006. Contaminación por Micotoxinas en los piensos: Efectos,
tratamiento y prevención. XXII Curso de Especialización FEDNA, in E.G. Lizárraga-Paulin,

12
E. Moreno-Martínez and S. P. Miranda-Castro, S.P., Aflatoxins and Their Impact on Human
and Animal Health: An Emerging Problem. Aflatoxins - Biochemistry and Molecular
Biology, Dr. Ramon G. Guevara-Gonzalez (Ed.), InTech.
Fadiga, M., Makokha, S., 2014. Consumer valuations of the quality and safety attributes of
milk and meat in Kenya. Afr. J. Ag. Resour. Econ. 9, 91–105.
FAO, 2005. Global livestock production and health atlas. Food and Agriculture
Organization, Rome. http://www.fao.org/ag/aga/glipha/index.jsp (accessed 28.10.2013).
Green, P. E., Rao, V. R., 1971. Conjoint measurement for quantifying judgmental data. J.
Marketing Res. 8, 355–363.
Green, P. E., Srinivasan, V., 1978. Conjoint analysis in consumer research: issues and
outlook. J. Consum. Res. 5, 103–123.
Haefele, M., Loomis, J., 2001. Using the conjoint analysis technique for the estimation of
passive use values of forest health. J. Forest Econ. 7, 9–24.
Jabbar, M. A., D. Baker, D., M. Fadiga (eds), 2010. Demand for livestock products in
developing countries with a focus on quality and safety attributes: Evidence from Asia and
Africa. ILRI Research Report No. 24. ILRI (International Livestock Research Institute),
Nairobi, Kenya.
Jarvis, B. B., 2002. Chemistry and toxicology of moulds isolated from water-damaged
buildings, Mycotoxins and Food Safety. Adv. Exp. Med. Biol. 504, 43–52.
Kang’ethe, E., Kimani, V. N., McDermott, B., Grace, D., Lang’at, A. K., Kiragu, M. W.,
Karanja, N., Njehu, A. N., Randolph, T., Mbugua, G., Irungu, T. W., Ombutu, P., 2012. A
trans-disciplinary study on the health risks of cryptosporidiosis from dairy systems in
Dagoretti, Nairobi, Kenya: study background and farming system characteristics. Trop.
Anim. Health Pro. 44, 3–10.
Krinsky, I., Robb, A., 1986. On approximating the statistical properties of elasticities. Rev.
Econ. Stat. 68, 715–719.
Lancaster, K., 1966. A new approach to consumer theory. J. Polit. Econ. 74, 132–157.
Lanyasunya, T. P., Wamae, L. W., Musa, H. H., Olowofeso, O., Lokwalepurt, I. K., 2005.
The risk of mycotoxins contamination of dairy feed and milk on smallholder dairy farms in
Kenya. Pak. J. Nutr. 4, 162–169.
Lizárraga-Paulin, E. G., Moreno-Martínez, E., Miranda-Castro, S. P., 2011. Aflatoxins and
Their Impact on Human and Animal Health: An Emerging Problem. Aflatoxins -
Biochemistry and Molecular Biology, Dr. Ramon G. Guevara-Gonzalez (Ed.), InTech,
Available from: http://www.intechopen.com/books/aflatoxins-biochemistry-and-molecular-
biology/aflatoxins-and-their-impacton-human-and-animal-health-an-emerging-problem.
Louviere, J. J., Hensher, D. A., Swait, J. D., 2000. Stated choice methods. Cambridge
University Press: Cambridge, UK.
Lapar, M. A., Choubey, M., Patwari, P., Kumar, A., Baltenweck, I., Jabbar, M. A., Staal, S.,
2010. Consumer preferences for attributes of raw and powdered milk in Assam, Northeast
India: Research Report 24. Nairobi, Kenya, ILRI.
Makokha, S., Fadiga, M., 2010. Exploiting markets for dairy and meat products’ quality and
safety: A Kenyan case study. ILRI Research Report No.24: 72–92.
Manski, C. F., 1977. The structure of random utility models. Theor. Decis. 8, 229–254.

13
McFadden, D., 1973. Conditional logit analysis of qualitative choice behavior. In P.
Zarembka, eds., Frontiers in Econometrics, Academic Press: New York, NY.
MoLD: Ministry of Livestock Development, 2008. Provincial/District Annual Report, 2007,
Kenya.
Muriuki, H. G., 2011. Dairy development in Kenya, Food and Agricultural Organization,
Rome.
Omore, A., Lore, T., Staal, S., Kutwa, J., Ouma, R., Arimi, S., Kang’ethe, E., 2005.
Addressing the public health and quality concerns towards marketed milk in Kenya. SDP
Research and Development Report No.3, Smallholder Dairy (R&D) Project, Nairobi.
Ouma, E., Abdulai, A., Drucker, A., 2007. Measuring heterogeneous preferences for cattle
traits among cattle-keeping households in East Africa. Am. J. Agr. Econ. 89, 1005–1019.
Steyn, N. P., Nel, J. H., Parker, W., Ayah, R., Mbithe, D., 2011. Dietary, social, and
environmental determinants of obesity in Kenyan women. Scand. J. Public Healt. 39, 88–97.
Train, K., 2009. Discrete choice methods with simulation, Second Edition. Cambridge
University Press: Cambridge, UK.
USAID Kenya, 2010. Consumer milk quality perception/preferences and an assessment of
willingness to pay for quality. USAID Kenya Dairy Sector Competitiveness Program, 623-C-
00-08-00020-00.
Waithaka, M. M., Nyangaga, J. N., Staal, S., Wokabi, A. W., Njubi, D., Muriuki, K. G.,
Njoroge, L. N., Wanjohi, P. N., 2002. Report of dairy and crop characterization activities in
western Kenya, SDP Collaborative Research Report, Nairobi.
Wang, L. Y., Hatch, M., Chen, C. J., Levin, B., You, S. L., Lu, S. N. et al., 1996. Aflatoxin
exposure and risk of hepatocellular carcinoma in Taiwan. Int. J. Cancer. 67, 620–625.
WHO, 2005. Public health strategies for preventing aflatoxin exposure. World Health
Organization, 1-26.
Williams, J. H., Phillips, T. D., Jolly, P. E., Stiles, J. K., Jolly, C. M., Aggarwal, D., 2004.
Human aflatoxicosis in developing countries: A review of toxicology, exposure, potential
health consequences, and interventions. Am. J. Clin. Nutr. 80, 1106–1122.
Wolf, C. A., Tonsor, G. T., Olynk, N. J., 2011. Understanding U.S. consumer demand for
milk production attributes. J. Agr. Resour. Econ. 36, 326–342.
Ziraba, A. K., Fotso, J. C., Ochako, R., 2009. Overweight and obesity in urban Africa: A
problem of the rich or the poor? BMC Public Health. 9,465.

14
Table 1. Selected packaged milk attributes and their corresponding levels
Attributes Levels
Milk processing Pasteurized
UHT
Milk fat content Whole
Low fat
Skimmed
Aflatoxin-free certified milk Certified
Non-certified
Milk packaging Plastic container
Tetra Pak
Pouch
Milk price 70 KSH/Litre
90 KSH/Litre
110 KSH/Litre
130 KSH/Litre

15
Table 2. Selected milk purchase sample habits
Characteristic Definition %
Milk bought/purchase occasion 0.3 litre
0.5 litre
1
57
1.0 litre 20
2.0 litres and more 12
I don´t remember 10
Price per litre 80 KSH /litre 20
90 KSH /litre 43
100 KSH /litre 11
Other 10
I don´t remember 16
Place of purchase Super-/Hypermarket 77
(Multiple answers) Shop 65
Kiosk
Milk Bar
6
1
Hawker 1
Frequency of milk purchase More than once a day 14
Once a day 55
Several times per week
Once a week
20
7
Occasionally 4

16
Table 3. Selected milk consumption habits
Characteristic Definition %
Boiling milk prior to consumption Yes 79
No 21
Milk is safe after boiling Yes 93
No 7
Reasons for boiling the milk Health concerns 53
(Multiple answers) Hygienic concerns 34
No refrigeration 3
Uncertainty about milk´s freshness 8
Because everybody is doing it
To warm the milk up
10
14
Personal consumption frequency Daily 48
Several times per week 8
Occasionally 31
Never 13
Own infants´ consumption frequency Daily 65
Occasionally 3
Never
I don´t know
13
19
Own children´s consumption frequency Daily 58
Occasionally 13
Never
I don´t know
7
22

17
Table 4. Selected aflatoxin awareness sample findings
Characteristic Definition %
Heard about aflatoxin Yes 80
No 20
Aflatoxins can be transferred Yes 45
into milk No 9
I don´t know 46
People who have heard about aflatoxin Aflatoxin can be transferred 51
Aflatoxin cannot be transferred 9
I don´t know if Aflatoxin can be transferred 40
People who have not heard about Aflatoxin can be transferred 18
aflatoxin Aflatoxin cannot be transferred 10
I don´t know if aflatoxin can be transferred 72
Health impact on humans Serious threat 71
Medium threat 16
Minor threat 1
No threat at all 2
I don´t know 10
Possible to make aflatoxin Yes 23
contaminated milk safe No 29
I don´t know 48
Options to make aflatoxin Boiling 62
contaminated milk safe Use of new technologies or/and chemicals 31
(Multiple answers) Controlling/testing of milk or/and feed 14

18
Table 5. Opinions on certificates, labels and advertisements
Characteristic Definition %
Opinion of food certificates/ Fully trust 19
food safety labels Mostly trust 24
Do not really trust 22
Do not trust at all 19
Do not even look at them 16
Opinion of packaging labels Fully rely 13
/ advertisements Mostly rely 18
Do not really rely 27
Do not rely at all 14
Do not even look at them 28

19
Table 6. Estimated CL and RPL models’ coefficients
Variable
CL RPL
Coefficient Standard
deviation
Coefficient Standard
deviation
UHTa
-0.1166**
0.0583 0.0319 0.1226
Wholeb
0.1513**
0.0648 0.3077*
0.1807
Skimmedc -0.1634
** 0.0731
-0.4711
*** 0.1666
Certifiedd 1.8736
*** 0.0691 6.2639
*** 0.5559
Plastice 0.2564
*** 0.0760 0.42736
*** 0.1434
TetraPakf 0.2782
*** 0.0643 0.8408
*** 0.1272
Price -0.0155***
0.0013 -0.0458***
0.0059
SD_UHT -0.8260***
0.1755
SD_Whole 2.2844***
0.2269
SD_Skimmed 1.2963*** 0.1839
SD_Certified 4.2813*** 0.4018
SD_Plastic -0.5028**
0.2510
SD_TetraPak -0.5693*** 0.1719
SD_Price 0.0735***
0.0071
LL -1803.4***
-1374.0***
Pseudo R2 0.3137
a Dummy variable takes 1 when milk is UHT and 0 when it is pasteurized.
b Dummy variable takes 1 when it is whole milk and 0 when it is low fat or skimmed.
c Dummy variable takes 1 when it is skimmed milk and 0 when it is whole or low fat.
d Dummy variable takes 1 when milk is certified and 0 when it is not certified.
e Dummy variable takes 1 when milk is sold in plastic container , 0 when it is a tetra pack or pouch.
f Dummy variable takes 1 when milk is sold in tetra pack, 0 when it is a plastic container or pouch.
***Significant at 1%,
**Significant at 5%,
*Significant at 1%.

20
Table 7. Willingness to pay (WTP) estimates and 95% confidence intervals (CI)
Variable CL RPL
WTP (KSH/l) 95% CI WTP (KSH/l) 95% CI
UHT
-7.5 [-15.5; -0.4] 0.7 [-4.56; 5.8]
Whole
9.7 [1.3; 19.1] 6.7 [-1.1; 15.4]
Skimmed -10.5 [-19.0; -1.0] -10.3 [-17.7; -3.1]
Certified 120.7 [102.5; 144.1] 136.8
[108.7; 176.3]
Plastic 16.5 [6.7; 26.4] 9.3
[3.1; 16.3]
TetraPak 17.9 [10.0; 26.7] 18.4
[12.8; 25.8]

21
Table 8. WTP estimates and 95% confidence intervals (CI) for
“aflatoxin free” certified milk
Segment WTP (KSH/l) 95% CI
All sample
136.8
[108.7; 176.3]
Heard about aflatoxin
161.7 [121.4; 226.4]
Have not heard about aflatoxin 99.0 [68.0; 154.1]
Aflatoxin can be transferred 165.2 [111.0; 259.2]
It can’t be transferred /don’t know 129.7 [95.7; 179.3]

22
Figure 1. An example of a choice experiment card
Card 1
Please indicate the most preferred cow milk and the least preferred cow milk (Tick only one case in
each line)
Milk 1 Milk 2 Milk 3
Pasteurized Pasteurized UHT
Whole Skimmed Low Fat
Aflatoxin-free certified Non-certified Aflatoxin-free certified
Tetra pack Plastic container Pouch
90 KSH/Litre 130 KSH/Litre 110 KSH/Litre
Most preferred
Least preferred