Embed Size (px)
Citation preview

A Presentation by
Kevin Hopkins Director of Research
The Communications Institute
November 12, 2014
Kern County
Energy Portfolio
and Forecast

Kern County Energy Portfolio & Forecast
The Communications Institute
Goals of The Communications Institute:
Objective analysis of critical public policy issues.
Emphasis on economic & scientific underpinnings.
Education of leaders in government, business, & media.
Communications consulting with government & business.
Focus on emerging state and regional energy issues.

Kern County Energy Portfolio & Forecast
The Powering California Research Series
September 2011:
Assessing California’s Energy Needs
January 2013:
Understanding the Economic Impact of
the Monterey Shale
January 2013:
Monterey Shale Development: Impact on
Employment in the San Joaquin Valley
With funding from:
Western States Petroleum Association

Kern County Energy Portfolio & Forecast
Goals of this Presentation
Review the national and state energy context.
Review the Kern County economic environment.
Highlight the Kern County energy promise.
Examine Kern County’s conventional energy picture.
Highlight Kern’s growing renewable-energy contribution.
Project the economic effects of greater energy development.

Kern County Energy Portfolio & Forecast
The National and State Energy Context

Kern County Energy Portfolio & Forecast
America’s Energy Transformation
Dramatic turnaround: levels not seen in 20 years.
Could overtake Saudi Arabia production by 2020.
IEA: net U.S. energy self-sufficiency by 2035.

Kern County Energy Portfolio & Forecast
America’s Energy Transformation
Dramatic turnaround: levels not seen in 20 years.
Could overtake Saudi Arabia production by 2020 2014.
IEA: net U.S. energy self-sufficiency by 2035.

Kern County Energy Portfolio & Forecast
America’s Energy Transformation
0.0
5.0
10.0
15.0
20.0
25.0
30.0
35.0
2011 2012 2013 2014 2015 2016 2017 2018 2019 2020 2025
US Oil Production Forecast, 2013
US Oil Production Forecast, 2014
% Change in Forecast, 2014/2013
Source: U.S. Energy Information Agency

Kern County Energy Portfolio & Forecast
America’s Energy Transformation: Renewables
Renewable energy generation—
primarily wind and solar power—
provided more than 40% of the
new energy capacity in the U.S. in
the first three quarters of 2014.
Source: Federal Energy Regulatory Commission,
Energy Infrastructure Update, October 2014

Kern County Energy Portfolio & Forecast
Energy in California: Demand
California’s energy demand = energy conservation success.
Ranks 47 out of 50 in per-capita energy use.
Almost 30% lower than national average.
With 12.4% of U.S. population, uses only 8.6% of U.S. energy.
Without conservation, would need some 75% more energy today.

Kern County Energy Portfolio & Forecast
Energy in California: Oil & Gas Supply
Largest untapped oil & gas production potential in the United States.
Third in U.S. in oil production & refining capacity.
Yet between 1985 and 2010, California oil production declined by 47%.
Production has finally started to edge up beginning in 2012.

Kern County Energy Portfolio & Forecast
Energy in California: Oil & Gas Supply
Source: U.S. Energy Information Agency

Kern County Energy Portfolio & Forecast
Energy in California: Renewable Energy
Renewables currently account for 27% of California energy.
More than half from hydro, but role of solar, wind, & biomass is growing.
California on track to meet its goal of having 1/3 of energy from renewables.
Kern County Energy Portfolio & Forecast
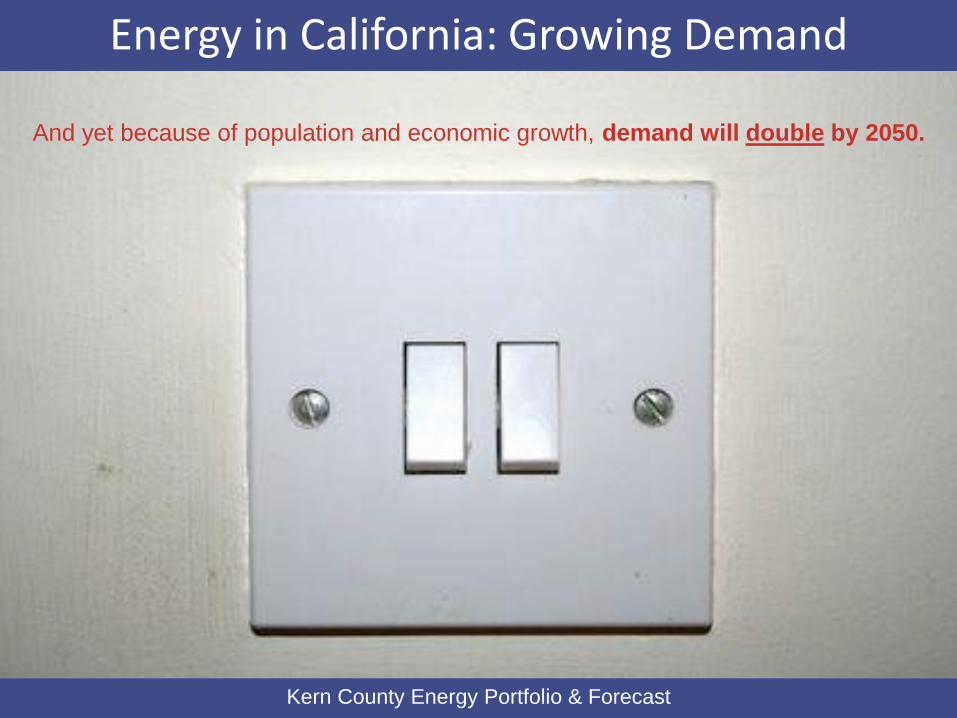
Energy in California: Growing Demand
And yet because of population and economic growth, demand will double by 2050.

Kern County Energy Portfolio & Forecast
The Kern County Economic Environment
Kern County Energy Portfolio & Forecast
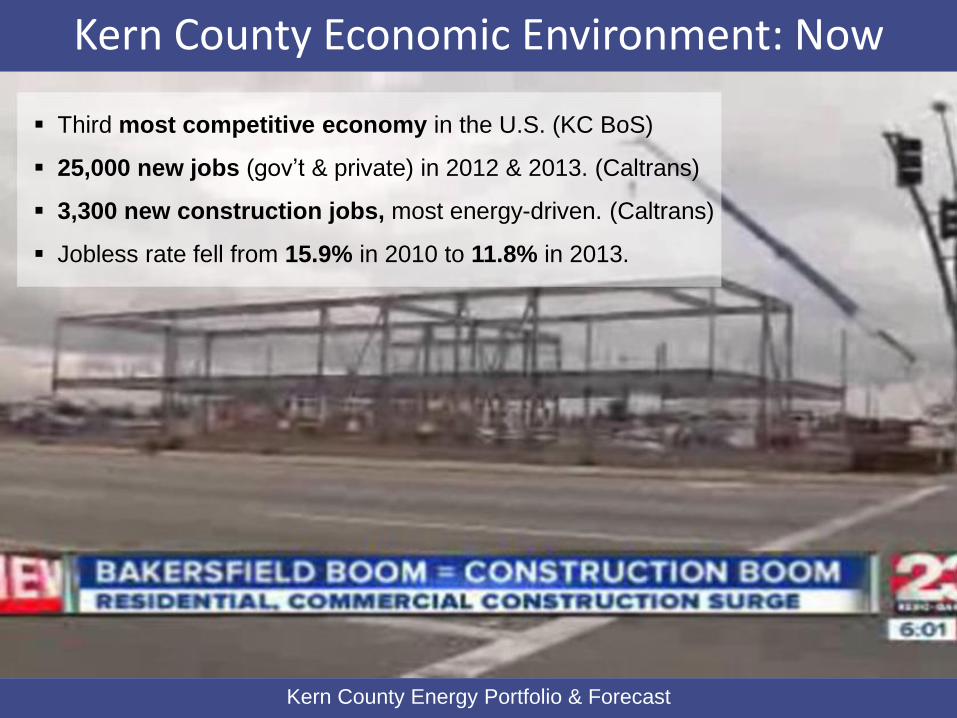
Kern County Economic Environment: Now
Third most competitive economy in the U.S. (KC BoS)
25,000 new jobs (gov’t & private) in 2012 & 2013. (Caltrans)
3,300 new construction jobs, most energy-driven. (Caltrans)
Jobless rate fell from 15.9% in 2010 to 11.8% in 2013.

Kern County Energy Portfolio & Forecast
Kern County Economic Forecast: 2014 – 2019
0.0%
1.0%
2.0%
3.0%
4.0%
5.0%
6.0%
Wage & salaryemployment
Population Real per capitaincome
Real taxable sales Industrialproduction
Change in 2014
Annual Change, 2014-2019
Change in 2014 Annual Change, 2014-2019 Wage & salary employment 3.2% 1.9% Population 1.2% 1.8% Real per capita income 3.5% 2.1% Real taxable sales 5.4% 2.2% Industrial production 4.3% 3.8%
Unemployment rate 11.2% (2014) 8.3% (2019)
Source: Caltrans 2014 Economic Forecast

Kern County Energy Portfolio & Forecast
Kern County Will Need A Lot More of This…

Kern County Energy Portfolio & Forecast
Kern County’s Energy Promise

Kern County Energy Portfolio & Forecast
Kern County’s Energy Promise
If Kern County were a state, it
would be the 4th largest oil-
producing state in the country
(behind Texas, North Dakota, and Alaska).
Kern County
produces 72% of
California’s crude
oil, and is home to
the state’s five largest producing oil fields.
Kern County accounts
for about 58% of the
state’s total natural
gas production.
Kern County’s currently
deployed renewables
capacity is 7,500 MW—far
beyond the use of renewables
in any other California County.
The Tehachapi Wind Resources
Area generates almost half of the wind energy produced in California.

Kern County Energy Portfolio & Forecast
Energy’s Value to Kern County’s Economy
Kern County’s top 3 industries in economic value:
Oil & Gas, $36.4 billion, 32% increase (2012-2013).
Energy Generation (Renewables Energy Sector), $7.4 billion,
31.5% increase (2011-2012).
Agriculture, $6.7 billion, 18% increase (2012-2013).
Source: Kern County Assessor’s Statistical Fiscal Summary

Kern County Energy Portfolio & Forecast
The Energy—Economic Cycle in Kern County
Energy
Production
Economic
Performance
Fourth-strongest recovering area. No. 2 in millennial job creation. Fastest-growing metro workforce. No. 4 region for STEM jobs.
—2015 CA Investment Guide

Kern County Energy Portfolio & Forecast
The Kern County Conventional Energy Picture

Kern County Energy Portfolio & Forecast
Kern County Oil Production: Leading the Nation
Source: U.S. Energy Information Agency

Kern County Energy Portfolio & Forecast
Kern Oil & Gas Production In Perspective
Although Kern County is the nation’s leading
crude oil producer over the past two
decades, oil production has been in steady
decline—and has fallen by 36% since 1992.
After rising substantially in the late 1990s,
natural gas production has declined over
the past decade.
However, since 2008, production levels have
begun to improve. In 2013, more gas was
extracted than in any year since 2007.
Even though crude oil and natural gas
production have been relatively stagnant, the
values of these resources are at near-
record levels in Kern County.

Kern County Energy Portfolio & Forecast
The Monterey Shale/SJV Studies
Title:
The Petroleum Industry and the Monterey
Shale: Current Economic Impact and the
Economic Future of the San Joaquin Valley
Date Published:
August 2013
Written By:
Antonio Avalos, Ph.D., & David Vera, Ph.D.,
Craig School of Business
California State University, Fresno
Sponsored By:
Western States Petroleum Assn.
Principle Methodology:
Projection of historical data

Kern County Energy Portfolio & Forecast
The Monterey Shale/SJV Studies
Title:
Monterey Shale Development:
An Analysis of the Impact on Employment
in the San Joaquin Valley
Date Published:
May 2014
Written By:
Gokce Soydemir, Ph.D.
Head of Economic Forecasting Team
California State University, Stanislaus
Sponsored By:
The Communications Institute/WSPA
Primary Methodology:
Analogical extrapolation from North Dakota
Kern County Energy Portfolio & Forecast
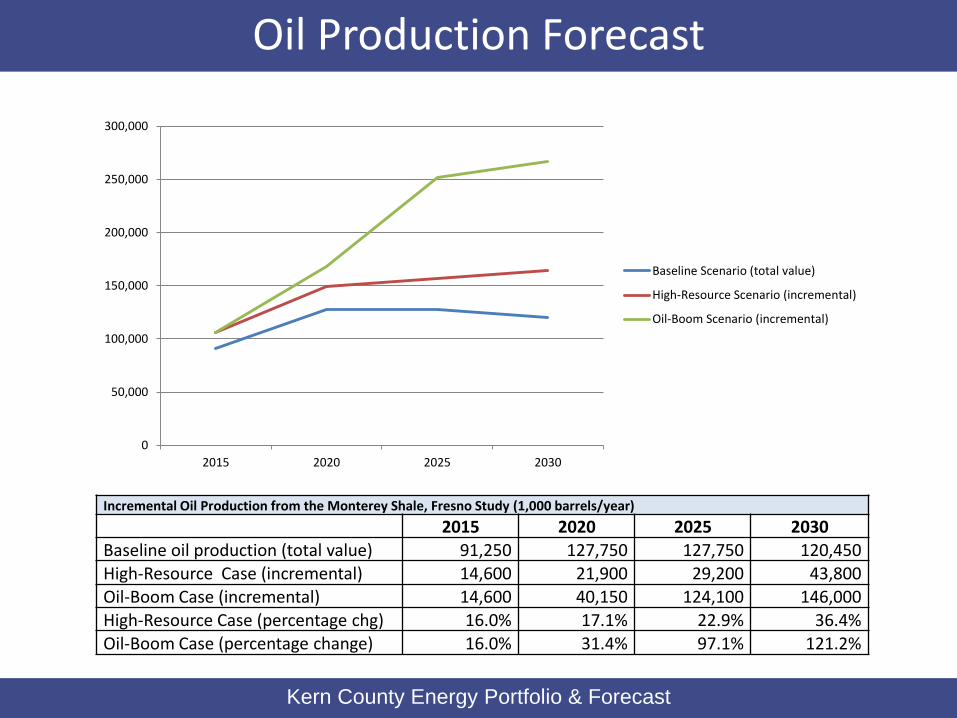
Oil Production Forecast
0
50,000
100,000
150,000
200,000
250,000
300,000
2015 2020 2025 2030
Baseline Scenario (total value)
High-Resource Scenario (incremental)
Oil-Boom Scenario (incremental)
Incremental Oil Production from the Monterey Shale, Fresno Study (1,000 barrels/year)
2015 2020 2025 2030
Baseline oil production (total value) 91,250 127,750 127,750 120,450 High-Resource Case (incremental) 14,600 21,900 29,200 43,800 Oil-Boom Case (incremental) 14,600 40,150 124,100 146,000
High-Resource Case (percentage chg) 16.0% 17.1% 22.9% 36.4% Oil-Boom Case (percentage change) 16.0% 31.4% 97.1% 121.2%

Kern County Energy Portfolio & Forecast
Oil Production Forecast
Incremental Oil Production from the Monterey Shale, Stanislaus Study (1,000 barrels/year)
2015 2020 2025 2030 Baseline oil production (total value) 195,372 203,715 212,414 221,484 Shale Case oil production (total value) 206,241 223,707 240,759 253,752 Percentage Increment 5.6% 9.8% 13.3% 14.6%
190,000
200,000
210,000
220,000
230,000
240,000
250,000
260,000
270,000
280,000
2000 2001 2002 2003 2004 2005 2006 2007 2008 2009 2010 2011 2012 2013 2015 2020 2025 2030
Baseline Case
Shale Case

Kern County Energy Portfolio & Forecast
Kern County’s Growing Renewable-Energy
Contribution

Kern County Energy Portfolio & Forecast
Kern County: A Commitment to Renewables
Goal : 10,000 MW of renewable energy by 2015.
Expediting permitting > more solar & wind projects
approved than in any other U.S. jurisdiction.
8,200 MW now permitted; 3,000 MW in pipeline.

Kern County Energy Portfolio & Forecast
Kern County: Economic Value of Renewables
9,500 construction & operational jobs.
$25 billion in investment.
$150 million in new property tax revenue.
Power for more than 7 million people.
Source: Kern Business Journal, December 2013

Kern County Energy Portfolio & Forecast
Kern County’s Solar Potential

Kern County Energy Portfolio & Forecast
Solar Power in Kern County
—Kern Business Journal, October/November 2012

Kern County Energy Portfolio & Forecast
Solar Power in Kern County: Google
—Los Angles Times, September 22, 2014
GOOGLE INVESTS $145M IN KERN
COUNTY SOLAR PROJECT
The 82-megawatt project will feed enough power to the grid for 10,000
homes, Google said. It is expected to bring 650 jobs to Kern County.

Kern County Energy Portfolio & Forecast
Solar Power in Kern County: MidAmerican Solar
In January, MidAmerican Solar and SunPower brought their Solar Star
development project online.
The world’s largest solar plant—579MW capacity, 1.7 million panels.
Construction began in early 2013; to be completed year-end 2015.
Has provides 600 construction jobs on-site.
Will deliver more than $500 million in regional economic benefits.

Kern County Energy Portfolio & Forecast
Solar Power in Kern County: Catalina
Last fall, EDF Renewable Energy dedicated its 143 MW Catalina
Solar Project.
The world’s eighth largest photovoltaic plant—1 million PV panels.
Will serve electricity needs of 35,000 homes.
Has provides 500 construction jobs on-site.
Will offset 250,000 metric tons of greenhouse gases annually..

Kern County Energy Portfolio & Forecast
Wind Power in Kern County: Alta Wind Center
Alta Wind Energy Center is the nation’s largest wind facility.
Generation capacity of 1.548 MW of power.
Can provide electricity for up to 450,000 homes.
Generates $30 million in royalty payments to farmers.
Property tax payments of more than $40 million annually.
State sales tax payments in excess of $200 million.
Kern County Energy Portfolio & Forecast
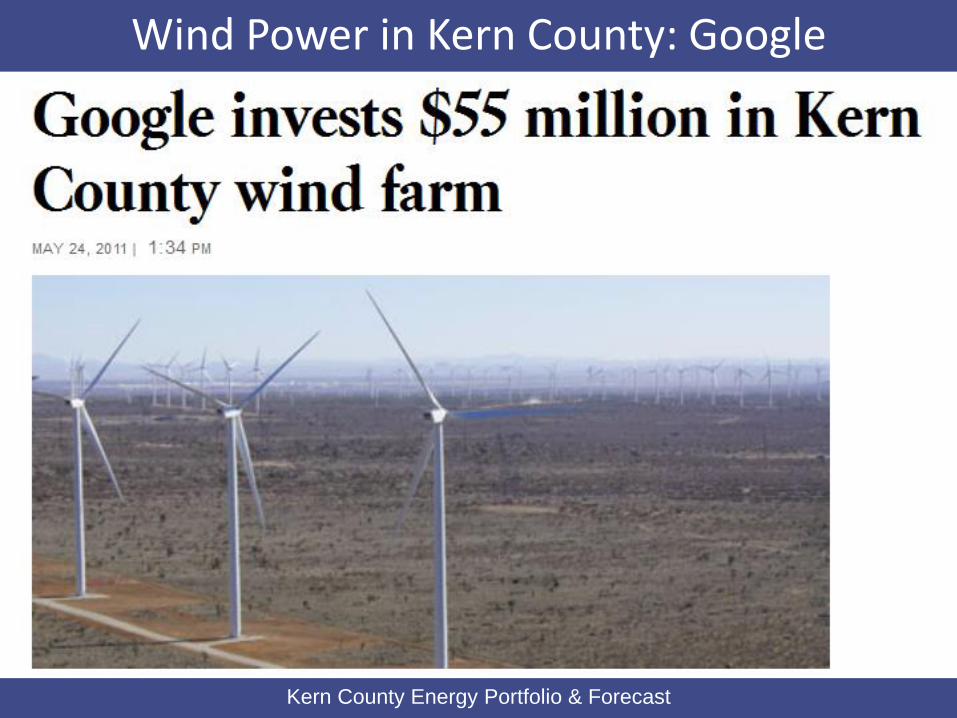
Wind Power in Kern County: Google

Kern County Energy Portfolio & Forecast
Battery Storage: Tehachapi Energy Storage Pjt

Kern County Energy Portfolio & Forecast
Biomass: Conversion of Coal-Fire Mt. Poso Plant
$50 million project located north of Bakersfield.
Keeps 2 million pounds/day of agricultural waste out of landfills.
Significantly reduces sulfur pollution.
Will provide power for 30,000 homes.

Kern County Energy Portfolio & Forecast
Economic Effects of Greater Energy Development

Kern County Energy Portfolio & Forecast
Economic Impact Forecast
1,500,000
1,550,000
1,600,000
1,650,000
1,700,000
1,750,000
1,800,000
1,850,000
2015 2020 2025 2030
Baseline
High-Resource Scenario
Oil-Boom Scenario
San Joaquin Valley Employment Impact: Fresno Study
Employment (number of jobs) 2015 2020 2025 2030
Baseline 1,568,187 1,596,395 1,612,998 1,617,777 High-Resource Scenario 2,151 16,284 91,275 159,170 Oil-Boom Scenario 2,151 46,649 133,335 195,683

Kern County Energy Portfolio & Forecast
Economic Impact Forecast
San Joaquin Valley Employment Impact: Stanislaus Study
Category 2013 2015 2020 2025 2030 17yr %Δ
Baseline 1,591,766 1,672,482 1,716,145 1,824,096 2,065,460 29.8%
Shale Case 1,591,766 1,640,586 1,797,880 1,961,862 2,273,051 42.8%
# of Jobs Δ 0 -31, 895 81,735 137,766 207,591
1,500,000
1,600,000
1,700,000
1,800,000
1,900,000
2,000,000
2,100,000
2,200,000
2,300,000
2,400,000
2,500,000
2015 2020 2025 2030
Baseline
Shale Case

Kern County Energy Portfolio & Forecast
Jobs by Sector
Employment-Level Increases by Sector: Stanislaus Study
Category 2013 2015 2020 2025 2030 17yr %Δ
Total Jobs: Baseline 1,591,766 1,672,482 1,716,145 1,824,096 2,065,460 29.8%
Education & Health 149,406 156,982 173,305 187,803 205,447 37.5%
Manufacturing 102,792 108,004 109,439 110,893 112,095 9.1%
Government 237,237 249,267 262,041 275,470 286,708 20.9%
Construction 39,560 41,566 48,948 55,808 62,936 59.1%
Leisure & Hospitality 104,339 109,630 118,162 127,360 135,230 29.6%
Wholesale Trade 46,045 48,380 52,145 56,204 59,677 29.6%
Retail Trade 131,257 137,913 141,403 144,982 147,910 12.7%
Trade, Trans, & Utilities 237,823 249,883 274,765 302,126 325,963 37.1%
Information 10,114 10,627 10,680 10,733 10,976 8.5%
Financial 40,471 42,523 43,382 44,258 44,972 11.1%
Mining 28,002 29,422 31,712 34,181 36,293 29.6%
Total Jobs: Shale Case 1,591,766 1,640,586 1,797,880 1,961,862 2,273,051 42.8%
Education & Health 149,406 159,204 177,309 207,561 235,476 57.6%
Manufacturing 102,792 109,877 115,006 117,845 122,220 18.9%
Government 237,237 284,574 301,505 367,792 380,671 60.5%
Construction 39,560 42,913 53,291 63,956 71,430 80.6%
Leisure & Hospitality 104,339 111,204 129,808 141,210 155,443 49.0%
Wholesale Trade 46,045 48,534 55,961 64,354 69,943 51.9%
Retail Trade 131,257 145,599 153,208 169,928 184,774 40.8%
Trade, Trans, & Utilities 237,823 254,733 289,708 329,135 364,201 53.1%
Information 10,114 10,828 11,192 11,635 12,202 20.7%
Financial 40,471 42,559 44,274 45,913 47,163 16.5%
Mining 28,002 31,240 38,881 47,363 54,803 95.7%

Kern County Energy Portfolio & Forecast
Kern County’s Energy Future
Conventional energy production retains great promise.
Positioned to increase its renewable energy leadership.
Significant, cross-sector impact on Kern County employment.
Become a national role model for energy production.
Contact:
Jack Cox
President
The Communications Institute
209.785.1944
Kevin Hopkins
Director of Research
The Communications Institute
408.930.3633
Kern County
Energy Portfolio
and Forecast


![[Piano] Kevin Kern - Once in the Long Ago](https://img.pdfslide.net/doc/110x75/55cf9abc550346d033a326fb/piano-kevin-kern-once-in-the-long-ago.jpg)