Embed Size (px)
Citation preview
1
Evaluating and Interpreting Banking Indicators
Keshab Bahadur K.C.Bank Supervision Department
Nepal Rastra Bank
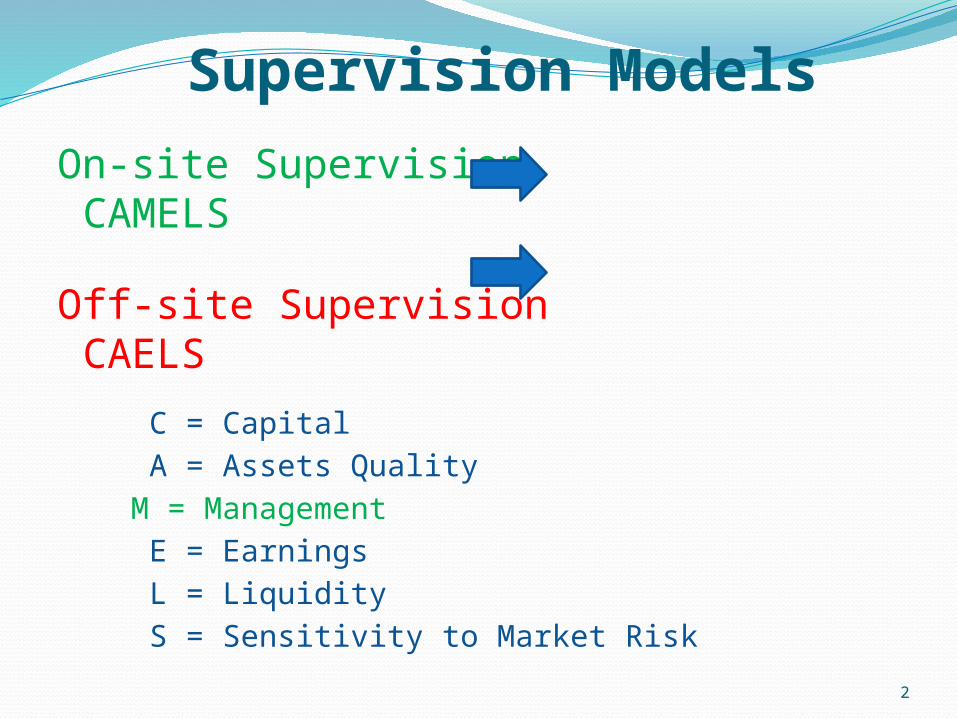
Supervision ModelsOn-site Supervision CAMELS
Off-site Supervision CAELS
C = Capital
A = Assets Quality
M = Management
E = Earnings
L = Liquidity
S = Sensitivity to Market Risk
2

3
C = Capital

Evaluation factors for Capital Volume of poor quality of assets
Bank’s capital growth experience and future prospects
Ability to address emerging needs for additional capital
Risk exposures
Balance sheet composition
Quality and strength of earnings, earnings retention and reasonableness of dividend distribution
Ability of management to address emerging needs of capital
Comparison with the regulatory requirement and industry norms
4

Capital Ratios Core Capital / Risk Weighted Assets Total Capital / Risk Weighted Assets Total Loans to a single Sector / Total Loans Total Loans to a single sector / Core Capital Fund Based Loans to a Single Borrower or Group of
Related Borrowers / Core Capital Non-Fund Based Facilities to a Single Borrower or
Group or Group of Related Borrowers / Core Capital Actual Provisioning / Required Provisioning Net Earnings / Core Capital
5
6
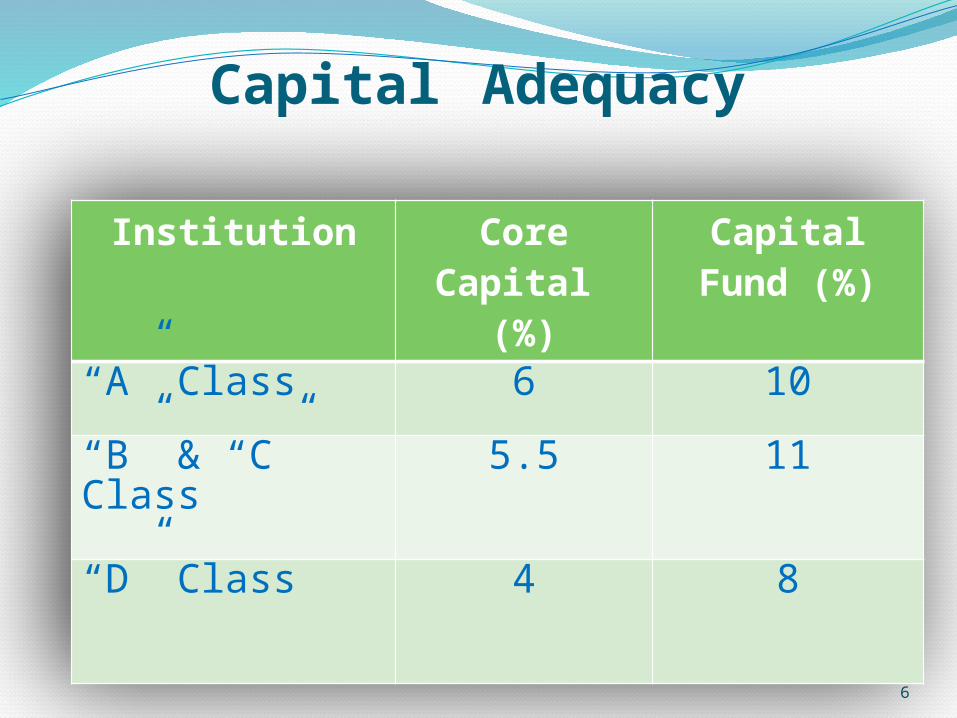
Capital Adequacy
Institution Core Capital
(%)
Capital Fund (%)
“A” Class 6 10
“B” & “C” Class 5.5 11
“D” Class 4 8

7
Calculation Formula

8
Prompt Corrective Action (PCA)
Level of Capital Trigger Points
Less than 2% 1st
Less than 2% - 4% 2nd
Less than 4% - 6% 3rd
Less than 6% - 8% 4th
More than 8% 5th
Trigger points for PCA

9
A = Assets Quality

10
Evaluation factors for Assets Quality Level, severity, trend of problem, restructured and non performing
loans
Adequacy of underwriting standards, soundness of credit administration practices and risk management
Adequacy of provisioning
Trend of off-balance sheet transactions Credit Risk
Diversification and quality of the loan and investment portfolios
Diversification or concentration in sectors or borrowers
Adequacy of loan and investment policies, procedures and practices
Recovery trend of problem assets (Bad Loan)
Adequacy of internal controls and management information system

11
Assets Quality Ratios1. Past Due Loans (Non performing Loan)/ Total Loans
2. Past Due Loans to Total Loans / Industry Av of Past Due Loans to Total Loans
3. Provisioning for Substandard Loans / Total Substandard Loans
4. Provisioning for Doubtful Loans/Total Doubtful Loans
5. Provisioning for Loss Loans / Total Loss Loans
6. Total Loans to a Single Sector / Core Capital
7. Fund Based Loans to a Single Borrower or Group of Related Borrowers / Core Capital
8. Non Fund Based Loans to a Single Borrower or Group of Related Borrowers / Core Capital
9. Bank's investment in shares and securities of a company / Core Capital

12
M = Management

13
Evaluation factors for Management Ability of the board and management Level and quality of oversight and support of all
activities by the Board of Directors and management. Educational background of staff, experience in banking,
rate of employee transfer between departments, employee turnover, staff moral and harmony between management and staff.
Adequacy of audit and internal controls Compliance with laws and regulations Accuracy, timeliness and effectiveness of MIS and risk
monitoring systems

14
E = Earning

15
Evaluation factors for Earnings
Level of earnings, including trends and stability
Quality and source of earnings
Adequacy of budgeting systems, forecasting processes and MIS
Adequacy of provisioning
Ability to contribute to capital through retained earnings

16
Earning Ratios1. Net Income (after tax) / Annual Average of end-of-
month Assets
2. Net Income (after tax) / Core Capital
3. Net Spread: (Interest earned/ Interest earning assets ) – (Interest paid/ Interest bearing Liabilities)
4. Net Interest Margin: (Interest Income – Interest Expense )/ (Annual Average of end-of month Total Assets)
5. Total Operating Income / Annual Av. Of end-of-month Total Assets
6. Total Operating Expenses / Annual Av. Of end-of-month Total Assets

17
Earning Ratios
7. Net Operating Income / Annual Av. Of end-of-month Total Assets
8. Total Operating Expenses / Total Operating Income
9. Interest on Deposits / Total Expenses
10. Interest on Borrowings / Total Expenses
11. Total Interest Expenses / Total Operating Income
12. Interest Income on Loans / Total Operating Income
13. Staff expenses / Total Expenses
14. Staff Expenses / Total Operation Income

18
L = Liquidity

19
Evaluation factors for Liquidity
Volatility, type, concentration and trend of deposits
Availability of assets readily convertible into cash
Access to money markets or other ready sources of fund
Trend and stability of deposits
Capability of the management to manage liquidity risk

20
Liquidity Ratios Total Liquid Assets / Total Deposit
Net Liquid Assets/Total Deposit
Total Loan / Total Local Currency Deposit
Total Loan / Total Local Currency Deposit and Core Capital
Current Assets / Short Term Liabilities (with in 90 days)
Quarterly Gap (Maturity Mismatch) / Cash in Vault & NRB Balance
Quarterly Gap (Maturity Mismatch) / Core Capital
Tendency of Inter Bank Loan

21
S = Sensitivity to Market Risk

22
Evaluation factors for Sensitivity to Market Risk
Sensitivity of the bank’s earning or economic value of
capital to adverse changes in interest rates, foreign
exchange rates, equity prices
Ability of the management to manage the market risk

Sensitivity to Market Risk Ratios Interest Rate Risk: First Quarter Gap (A/L maturity
mismatch)/Av. Quarterly Earnings
Interest Rate Risk: Second Quarter Gap (A/L maturity mismatch)/Average Quarterly Earnings:
Exchange Rate Risk: Net Foreign Exchange Position / Core Capital
23

24
Thank you


![Nepal Rastra Bank Act, 2002 Eng[1].nrb.org.np/lgd/acts_ordinances/nepal_rastra_bank_act...Nepal Rastra Bank Act, 2058 (2002) (First Amendment, 2063 (2006)) Date of Royal Accent: Amendment](https://img.pdfslide.net/doc/110x75/5b03ec8e7f8b9a3c378cf161/nepal-rastra-bank-act-2002-eng1nrborgnplgdactsordinancesnepalrastrabankactnepal.jpg)