Embed Size (px)
Citation preview
1 5 f e b r u a r y 2 0 1 8 | V O L 5 5 4 | N a T u r e | 3 1 7
arTicLedoi:10.1038/nature25509
Ketamine blocks bursting in the lateral habenula to rapidly relieve depressionyan yang1,2*, yihui cui1,2*, Kangning Sang1,2*, yiyan Dong1*, Zheyi Ni1, Shuangshuang Ma1 & Hailan Hu1,2
The discovery of the rapid antidepressant effects of the NMDAR antagonist ketamine is arguably the most important advance in the field of psychiatry in the past half century1. A single administration of ketamine elicits fast (in as little as half an hour) and sustained antidepressant effects both in humans1,2 and in animal models of depression3–6. It also has a fast metabolic turnover rate, with a half-life of three hours7. This rapid ‘hit-and-go’ temporal profile suggests that ketamine is likely to act on a system that has ongoing activity with open NMDAR channels8.
The LHb has recently been implicated in the coding of negative emotion9–13 and the pathophysiology of major depression14–18. The LHb hosts primarily glutamatergic neurons19, but it inhibits the brain’s reward centres (including the dopaminergic ventral tegmental area (VTA) and the serotonergic dorsal raphe nucleus (DRN), hypoactivity of which has been implicated in depression20,21) either through a relay at the γ -aminobutyric acid (GABA)ergic rostromedial tegmental nucleus (RMTg) or via local interneurons within the VTA and DRN9,12,22–24. Although there is accumulating evidence that aberrant overactivity in the LHb is crucial to depression14–18, it remains unknown how the spike patterns of LHb neurons are altered during depression and what role this may play in the aetiology of depression and the fast antidepressant effects of ketamine.
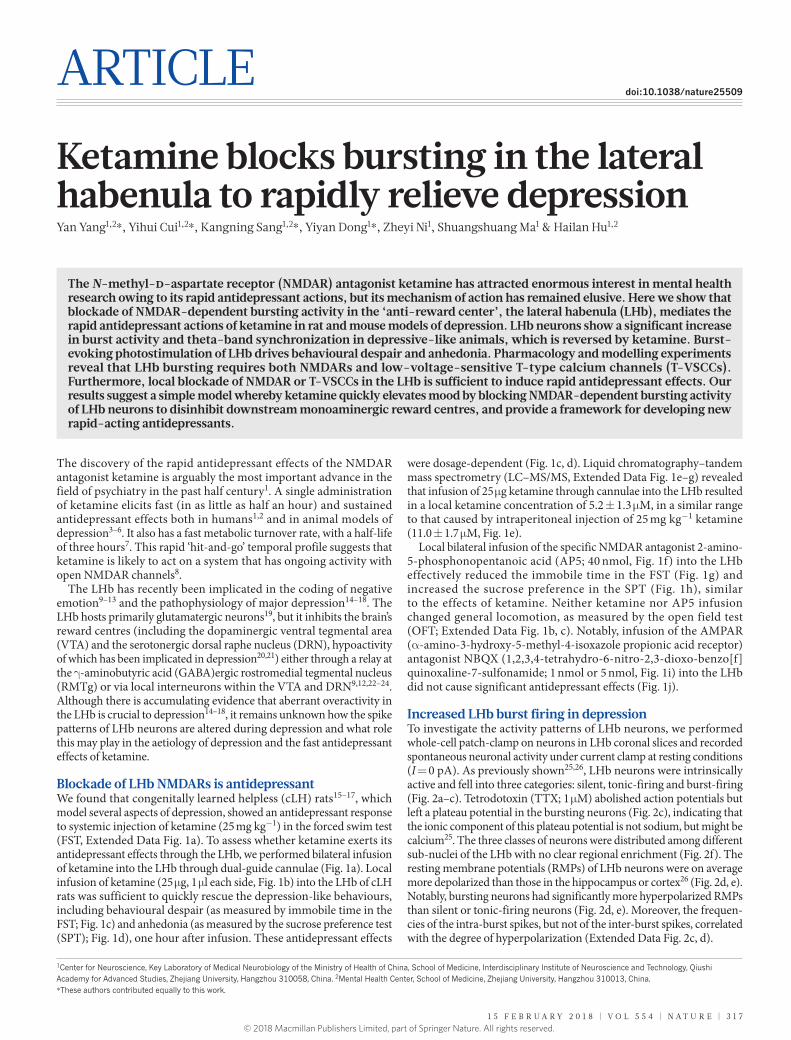
Blockade of LHb NMDARs is antidepressantWe found that congenitally learned helpless (cLH) rats15–17, which model several aspects of depression, showed an antidepressant response to systemic injection of ketamine (25 mg kg−1) in the forced swim test (FST, Extended Data Fig. 1a). To assess whether ketamine exerts its antidepressant effects through the LHb, we performed bilateral infusion of ketamine into the LHb through dual-guide cannulae (Fig. 1a). Local infusion of ketamine (25 μ g, 1 μ l each side, Fig. 1b) into the LHb of cLH rats was sufficient to quickly rescue the depression-like behaviours, including behavioural despair (as measured by immobile time in the FST; Fig. 1c) and anhedonia (as measured by the sucrose preference test (SPT); Fig. 1d), one hour after infusion. These antidepressant effects
were dosage-dependent (Fig. 1c, d). Liquid chromatography–tandem mass spectrometry (LC–MS/MS, Extended Data Fig. 1e–g) revealed that infusion of 25 μ g ketamine through cannulae into the LHb resulted in a local ketamine concentration of 5.2 ± 1.3 μ M, in a similar range to that caused by intraperitoneal injection of 25 mg kg−1 ketamine (11.0 ± 1.7 μ M, Fig. 1e).
Local bilateral infusion of the specific NMDAR antagonist 2-amino- 5-phosphonopentanoic acid (AP5; 40 nmol, Fig. 1f) into the LHb effectively reduced the immobile time in the FST (Fig. 1g) and increased the sucrose preference in the SPT (Fig. 1h), similar to the effects of ketamine. Neither ketamine nor AP5 infusion changed general locomotion, as measured by the open field test (OFT; Extended Data Fig. 1b, c). Notably, infusion of the AMPAR (α -amino-3-hydroxy-5-methyl-4-isoxazole propionic acid receptor) antagonist NBQX (1,2,3,4-tetrahydro-6-nitro-2,3-dioxo-benzo[f] quinoxaline-7-sulfonamide; 1 nmol or 5 nmol, Fig. 1i) into the LHb did not cause significant antidepressant effects (Fig. 1j).
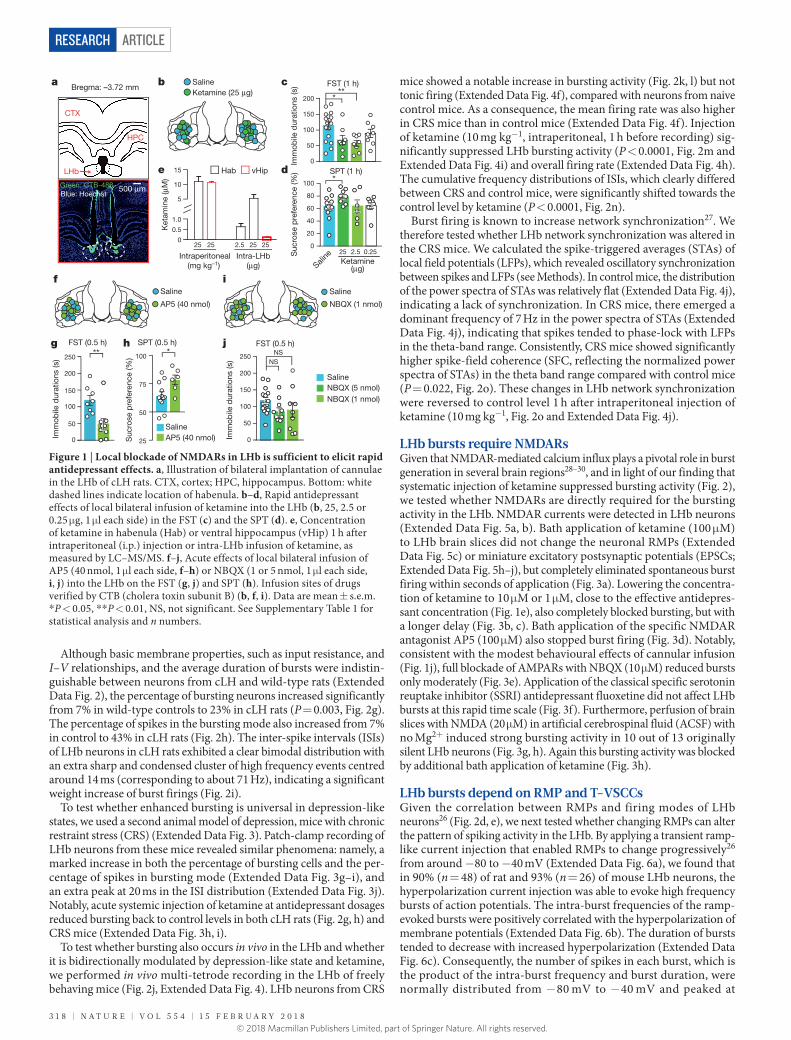
Increased LHb burst firing in depressionTo investigate the activity patterns of LHb neurons, we performed whole-cell patch-clamp on neurons in LHb coronal slices and recorded spontaneous neuronal activity under current clamp at resting conditions (I = 0 pA). As previously shown25,26, LHb neurons were intrinsically active and fell into three categories: silent, tonic-firing and burst-firing (Fig. 2a–c). Tetrodotoxin (TTX; 1 μ M) abolished action potentials but left a plateau potential in the bursting neurons (Fig. 2c), indicating that the ionic component of this plateau potential is not sodium, but might be calcium25. The three classes of neurons were distributed among different sub-nuclei of the LHb with no clear regional enrichment (Fig. 2f). The resting membrane potentials (RMPs) of LHb neurons were on average more depolarized than those in the hippocampus or cortex26 (Fig. 2d, e). Notably, bursting neurons had significantly more hyperpolarized RMPs than silent or tonic-firing neurons (Fig. 2d, e). Moreover, the frequen-cies of the intra-burst spikes, but not of the inter-burst spikes, correlated with the degree of hyperpolarization (Extended Data Fig. 2c, d).
The N-methyl-d-aspartate receptor (NMDAR) antagonist ketamine has attracted enormous interest in mental health research owing to its rapid antidepressant actions, but its mechanism of action has remained elusive. Here we show that blockade of NMDAR-dependent bursting activity in the ‘anti-reward center’, the lateral habenula (LHb), mediates the rapid antidepressant actions of ketamine in rat and mouse models of depression. LHb neurons show a significant increase in burst activity and theta-band synchronization in depressive-like animals, which is reversed by ketamine. Burst-evoking photostimulation of LHb drives behavioural despair and anhedonia. Pharmacology and modelling experiments reveal that LHb bursting requires both NMDARs and low-voltage-sensitive T-type calcium channels (T-VSCCs). Furthermore, local blockade of NMDAR or T-VSCCs in the LHb is sufficient to induce rapid antidepressant effects. Our results suggest a simple model whereby ketamine quickly elevates mood by blocking NMDAR-dependent bursting activity of LHb neurons to disinhibit downstream monoaminergic reward centres, and provide a framework for developing new rapid-acting antidepressants.
1Center for Neuroscience, Key Laboratory of Medical Neurobiology of the Ministry of Health of China, School of Medicine, Interdisciplinary Institute of Neuroscience and Technology, Qiushi Academy for Advanced Studies, Zhejiang University, Hangzhou 310058, China. 2Mental Health Center, School of Medicine, Zhejiang University, Hangzhou 310013, China.* These authors contributed equally to this work.
© 2018 Macmillan Publishers Limited, part of Springer Nature. All rights reserved.
3 1 8 | N a T u r e | V O L 5 5 4 | 1 5 f e b r u a r y 2 0 1 8
ArticlereSeArcH
Although basic membrane properties, such as input resistance, and I–V relationships, and the average duration of bursts were indistin-guishable between neurons from cLH and wild-type rats (Extended Data Fig. 2), the percentage of bursting neurons increased significantly from 7% in wild-type controls to 23% in cLH rats (P = 0.003, Fig. 2g). The percentage of spikes in the bursting mode also increased from 7% in control to 43% in cLH rats (Fig. 2h). The inter-spike intervals (ISIs) of LHb neurons in cLH rats exhibited a clear bimodal distribution with an extra sharp and condensed cluster of high frequency events centred around 14 ms (corresponding to about 71 Hz), indicating a significant weight increase of burst firings (Fig. 2i).
To test whether enhanced bursting is universal in depression-like states, we used a second animal model of depression, mice with chronic restraint stress (CRS) (Extended Data Fig. 3). Patch-clamp recording of LHb neurons from these mice revealed similar phenomena: namely, a marked increase in both the percentage of bursting cells and the per-centage of spikes in bursting mode (Extended Data Fig. 3g–i), and an extra peak at 20 ms in the ISI distribution (Extended Data Fig. 3j). Notably, acute systemic injection of ketamine at antidepressant dosages reduced bursting back to control levels in both cLH rats (Fig. 2g, h) and CRS mice (Extended Data Fig. 3h, i).
To test whether bursting also occurs in vivo in the LHb and whether it is bidirectionally modulated by depression-like state and ketamine, we performed in vivo multi-tetrode recording in the LHb of freely behaving mice (Fig. 2j, Extended Data Fig. 4). LHb neurons from CRS
mice showed a notable increase in bursting activity (Fig. 2k, l) but not tonic firing (Extended Data Fig. 4f), compared with neurons from naive control mice. As a consequence, the mean firing rate was also higher in CRS mice than in control mice (Extended Data Fig. 4f). Injection of ketamine (10 mg kg−1, intraperitoneal, 1 h before recording) sig-nificantly suppressed LHb bursting activity (P < 0.0001, Fig. 2m and Extended Data Fig. 4i) and overall firing rate (Extended Data Fig. 4h). The cumulative frequency distributions of ISIs, which clearly differed between CRS and control mice, were significantly shifted towards the control level by ketamine (P < 0.0001, Fig. 2n).
Burst firing is known to increase network synchronization27. We therefore tested whether LHb network synchronization was altered in the CRS mice. We calculated the spike-triggered averages (STAs) of local field potentials (LFPs), which revealed oscillatory synchronization between spikes and LFPs (see Methods). In control mice, the distribution of the power spectra of STAs was relatively flat (Extended Data Fig. 4j), indicating a lack of synchronization. In CRS mice, there emerged a dominant frequency of 7 Hz in the power spectra of STAs (Extended Data Fig. 4j), indicating that spikes tended to phase-lock with LFPs in the theta-band range. Consistently, CRS mice showed significantly higher spike-field coherence (SFC, reflecting the normalized power spectra of STAs) in the theta band range compared with control mice (P = 0.022, Fig. 2o). These changes in LHb network synchronization were reversed to control level 1 h after intraperitoneal injection of ketamine (10 mg kg−1, Fig. 2o and Extended Data Fig. 4j).
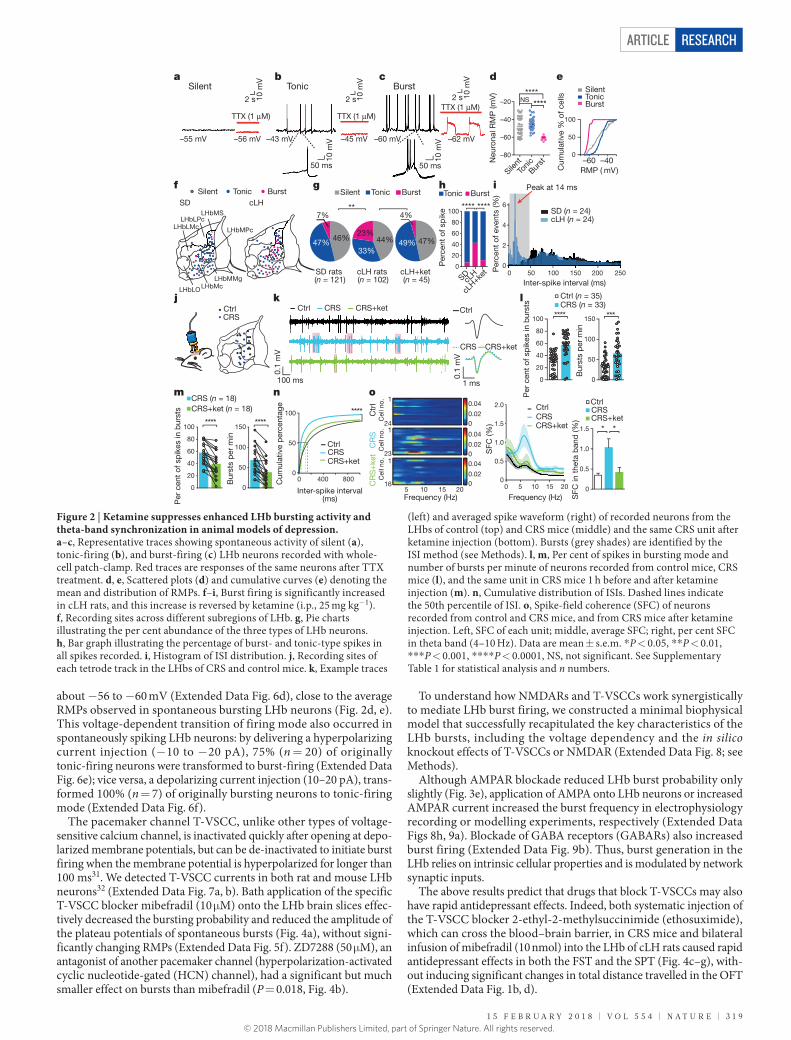
LHb bursts require NMDARsGiven that NMDAR-mediated calcium influx plays a pivotal role in burst generation in several brain regions28–30, and in light of our finding that systematic injection of ketamine suppressed bursting activity (Fig. 2), we tested whether NMDARs are directly required for the bursting activity in the LHb. NMDAR currents were detected in LHb neurons (Extended Data Fig. 5a, b). Bath application of ketamine (100 μ M) to LHb brain slices did not change the neuronal RMPs (Extended Data Fig. 5c) or miniature excitatory postsynaptic potentials (EPSCs; Extended Data Fig. 5h–j), but completely eliminated spontaneous burst firing within seconds of application (Fig. 3a). Lowering the concentra-tion of ketamine to 10 μ M or 1 μ M, close to the effective antidepres-sant concentration (Fig. 1e), also completely blocked bursting, but with a longer delay (Fig. 3b, c). Bath application of the specific NMDAR antagonist AP5 (100 μ M) also stopped burst firing (Fig. 3d). Notably, consistent with the modest behavioural effects of cannular infusion (Fig. 1j), full blockade of AMPARs with NBQX (10 μ M) reduced bursts only moderately (Fig. 3e). Application of the classical specific serotonin reuptake inhibitor (SSRI) antidepressant fluoxetine did not affect LHb bursts at this rapid time scale (Fig. 3f). Furthermore, perfusion of brain slices with NMDA (20 μ M) in artificial cerebrospinal fluid (ACSF) with no Mg2+ induced strong bursting activity in 10 out of 13 originally silent LHb neurons (Fig. 3g, h). Again this bursting activity was blocked by additional bath application of ketamine (Fig. 3h).
LHb bursts depend on RMP and T-VSCCsGiven the correlation between RMPs and firing modes of LHb neurons26 (Fig. 2d, e), we next tested whether changing RMPs can alter the pattern of spiking activity in the LHb. By applying a transient ramp-like current injection that enabled RMPs to change progressively26 from around − 80 to − 40 mV (Extended Data Fig. 6a), we found that in 90% (n = 48) of rat and 93% (n = 26) of mouse LHb neurons, the hyperpolarization current injection was able to evoke high frequency bursts of action potentials. The intra-burst frequencies of the ramp-evoked bursts were positively correlated with the hyperpolarization of membrane potentials (Extended Data Fig. 6b). The duration of bursts tended to decrease with increased hyperpolarization (Extended Data Fig. 6c). Consequently, the number of spikes in each burst, which is the product of the intra-burst frequency and burst duration, were normally distributed from − 80 mV to − 40 mV and peaked at
e
a
500 μmGreen: CTB-488
SPT (1 h)
Blue: Hoechst
b Saline
LHb
HPC
CTX
Bregma: –3.72 mm
0
20
40
60
80
100
Ket
amin
e (μ
M)
d
c
Imm
obile
dur
atio
ns (s
)
0
50
100
150
200
FST (1 h)
f i
j FST (0.5 h)
Suc
rose
pre
fere
nce
(%)Hab vHip
Intraperitoneal(mg kg–1)
Intra-LHb(μg) (μg)
25 2525 252.525 0.252.5
0
0.5
1.0
5
10
15
Saline
***
*
NSNS
Imm
obile
dur
atio
ns (s
)
0
50
100
150
200
250
Saline
AP5 (40 nmol)
Saline
NBQX (1 nmol)
Ketamine (25 μg)
Ketamine
FST (0.5 h) SPT (0.5 h)g h
Imm
obile
dur
atio
ns (s
)
**
0
50
100
150
200
250
Suc
rose
pre
fere
nce
(%)
*
25
50
75
100
NBQX (1 nmol)NBQX (5 nmol)Saline
SalineAP5 (40 nmol)
Figure 1 | Local blockade of NMDARs in LHb is sufficient to elicit rapid antidepressant effects. a, Illustration of bilateral implantation of cannulae in the LHb of cLH rats. CTX, cortex; HPC, hippocampus. Bottom: white dashed lines indicate location of habenula. b–d, Rapid antidepressant effects of local bilateral infusion of ketamine into the LHb (b, 25, 2.5 or 0.25 μ g, 1 μ l each side) in the FST (c) and the SPT (d). e, Concentration of ketamine in habenula (Hab) or ventral hippocampus (vHip) 1 h after intraperitoneal (i.p.) injection or intra-LHb infusion of ketamine, as measured by LC–MS/MS. f–j, Acute effects of local bilateral infusion of AP5 (40 nmol, 1 μ l each side, f–h) or NBQX (1 or 5 nmol, 1 μ l each side, i, j) into the LHb on the FST (g, j) and SPT (h). Infusion sites of drugs verified by CTB (cholera toxin subunit B) (b, f, i). Data are mean ± s.e.m. * P < 0.05, * * P < 0.01, NS, not significant. See Supplementary Table 1 for statistical analysis and n numbers.
© 2018 Macmillan Publishers Limited, part of Springer Nature. All rights reserved.
1 5 f e b r u a r y 2 0 1 8 | V O L 5 5 4 | N a T u r e | 3 1 9
Article reSeArcH
about −56 to − 60 mV (Extended Data Fig. 6d), close to the average RMPs observed in spontaneous bursting LHb neurons (Fig. 2d, e). This voltage-dependent transition of firing mode also occurred in spontaneously spiking LHb neurons: by delivering a hyperpolarizing current injection (− 10 to − 20 pA), 75% (n = 20) of originally tonic-firing neurons were transformed to burst-firing (Extended Data Fig. 6e); vice versa, a depolarizing current injection (10–20 pA), trans-formed 100% (n = 7) of originally bursting neurons to tonic-firing mode (Extended Data Fig. 6f).
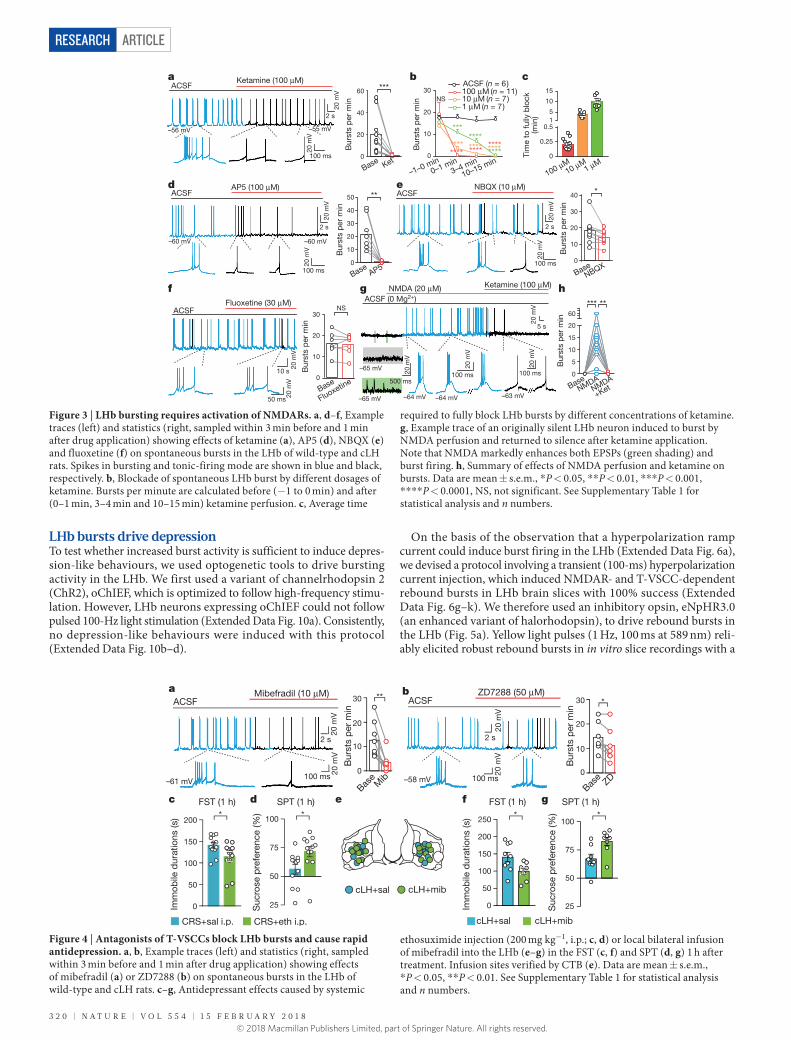
The pacemaker channel T-VSCC, unlike other types of voltage- sensitive calcium channel, is inactivated quickly after opening at depo-larized membrane potentials, but can be de-inactivated to initiate burst firing when the membrane potential is hyperpolarized for longer than 100 ms31. We detected T-VSCC currents in both rat and mouse LHb neurons32 (Extended Data Fig. 7a, b). Bath application of the specific T-VSCC blocker mibefradil (10 μ M) onto the LHb brain slices effec-tively decreased the bursting probability and reduced the amplitude of the plateau potentials of spontaneous bursts (Fig. 4a), without signi-ficantly changing RMPs (Extended Data Fig. 5f). ZD7288 (50 μ M), an antagonist of another pacemaker channel (hyperpolarization-activated cyclic nucleotide-gated (HCN) channel), had a significant but much smaller effect on bursts than mibefradil (P = 0.018, Fig. 4b).
To understand how NMDARs and T-VSCCs work synergistically to mediate LHb burst firing, we constructed a minimal biophysical model that successfully recapitulated the key characteristics of the LHb bursts, including the voltage dependency and the in silico knockout effects of T-VSCCs or NMDAR (Extended Data Fig. 8; see Methods).
Although AMPAR blockade reduced LHb burst probability only slightly (Fig. 3e), application of AMPA onto LHb neurons or increased AMPAR current increased the burst frequency in electrophysiology recording or modelling experiments, respectively (Extended Data Figs 8h, 9a). Blockade of GABA receptors (GABARs) also increased burst firing (Extended Data Fig. 9b). Thus, burst generation in the LHb relies on intrinsic cellular properties and is modulated by network synaptic inputs.
The above results predict that drugs that block T-VSCCs may also have rapid antidepressant effects. Indeed, both systematic injection of the T-VSCC blocker 2-ethyl-2-methylsuccinimide (ethosuximide), which can cross the blood–brain barrier, in CRS mice and bilateral infusion of mibefradil (10 nmol) into the LHb of cLH rats caused rapid antidepressant effects in both the FST and the SPT (Fig. 4c–g), with-out inducing significant changes in total distance travelled in the OFT (Extended Data Fig. 1b, d).
****
**** ****
fSilent Tonic Burst
cLHLHbMS
LHbMPc
LHbLOLHbMcLHbMMg
LHbLMcLHbLPc
SD
i
Per
cent
of e
vent
s (%
)
SD (n = 24)cLH (n = 24)
Inter-spike interval (ms)0 50 100 150 200 250
0
2
4
6
Peak at 14 ms
46%
7%
47%
SD rats (n = 121)
cLH rats (n = 102)
33%
23%44% 47%49%
4%
cLH+ket (n = 45)
g
**
Tonic BurstSilent
cLH+ke
tcL
HSD
Tonic Bursth
0
20
40
60
80
100
Per
cent
of s
pik
e
CtrlCRS
Cum
ulat
ive
per
cent
age
Inter-spike interval(ms)
0400 8000
50
100
jCRS CRS+ketCtrl
100 ms
0.1
mV
****
0.1
mV
1 ms
CRS+ket
Ctrl
CRS
0
50
100
150
0
20
40
60
80
100
0
20
40
60
80
100
0
50
100
150
Ctrl (n = 35)CRS (n = 33)
CRS (n = 18)CRS+ket (n = 18)
**** ***
**** ****
CRS+ket CRSCtrl
0
0.5
1.0
1.5
SFC
(%)
10 15 200 5
Frequency (Hz)
2.0
0
0.5
1.0
1.5
SFC
in t
heta
ban
d (%
)
Ctrl
* *
CRSCRS+ket
CRS+ket CRSCtrl
k l
m n o
CR
SC
trl
Cel
l no.
Cel
l no.
1
23
1
24
Cel
l no. 1
16CR
S+
ket
5 10 15 20Frequency (Hz)
00.02
0.04
00.02
0.04
00.02
0.04
SilentTo
nicBur
st
d
Neu
rona
l RM
P (m
V)
NS****
–80
–60
–40
–20
SilentTonicBurst
e
0
50
100
Cum
ulat
ive
% o
f cel
ls
RMP ( mV)–60 –40
Per
cen
t of
sp
ikes
in b
urst
s
Per
cen
t of
sp
ikes
in b
urst
s
TTX (1 μM) TTX (1 μM)TTX (1 μM)
10 m
V–55 mV
50 ms
b
–43 mV
a
–60 mV
Silent Tonic Burstc
–56 mV –45 mV –62 mV
10 m
V
50 ms
2 s 10 m
V
2 s 10 m
V
2 s 10 m
V
Bur
sts
per
min
Bur
sts
per
min
Figure 2 | Ketamine suppresses enhanced LHb bursting activity and theta-band synchronization in animal models of depression. a–c, Representative traces showing spontaneous activity of silent (a), tonic-firing (b), and burst-firing (c) LHb neurons recorded with whole-cell patch-clamp. Red traces are responses of the same neurons after TTX treatment. d, e, Scattered plots (d) and cumulative curves (e) denoting the mean and distribution of RMPs. f–i, Burst firing is significantly increased in cLH rats, and this increase is reversed by ketamine (i.p., 25 mg kg−1). f, Recording sites across different subregions of LHb. g, Pie charts illustrating the per cent abundance of the three types of LHb neurons. h, Bar graph illustrating the percentage of burst- and tonic-type spikes in all spikes recorded. i, Histogram of ISI distribution. j, Recording sites of each tetrode track in the LHbs of CRS and control mice. k, Example traces
(left) and averaged spike waveform (right) of recorded neurons from the LHbs of control (top) and CRS mice (middle) and the same CRS unit after ketamine injection (bottom). Bursts (grey shades) are identified by the ISI method (see Methods). l, m, Per cent of spikes in bursting mode and number of bursts per minute of neurons recorded from control mice, CRS mice (l), and the same unit in CRS mice 1 h before and after ketamine injection (m). n, Cumulative distribution of ISIs. Dashed lines indicate the 50th percentile of ISI. o, Spike-field coherence (SFC) of neurons recorded from control and CRS mice, and from CRS mice after ketamine injection. Left, SFC of each unit; middle, average SFC; right, per cent SFC in theta band (4–10 Hz). Data are mean ± s.e.m. * P < 0.05, * * P < 0.01, * * * P < 0.001, * * * * P < 0.0001, NS, not significant. See Supplementary Table 1 for statistical analysis and n numbers.
© 2018 Macmillan Publishers Limited, part of Springer Nature. All rights reserved.
3 2 0 | N a T u r e | V O L 5 5 4 | 1 5 f e b r u a r y 2 0 1 8
ArticlereSeArcH
LHb bursts drive depressionTo test whether increased burst activity is sufficient to induce depres-sion-like behaviours, we used optogenetic tools to drive bursting activity in the LHb. We first used a variant of channelrhodopsin 2 (ChR2), oChIEF, which is optimized to follow high-frequency stimu-lation. However, LHb neurons expressing oChIEF could not follow pulsed 100-Hz light stimulation (Extended Data Fig. 10a). Consistently, no depression-like behaviours were induced with this protocol (Extended Data Fig. 10b–d).
On the basis of the observation that a hyperpolarization ramp current could induce burst firing in the LHb (Extended Data Fig. 6a), we devised a protocol involving a transient (100-ms) hyperpolarization current injection, which induced NMDAR- and T-VSCC-dependent rebound bursts in LHb brain slices with 100% success (Extended Data Fig. 6g–k). We therefore used an inhibitory opsin, eNpHR3.0 (an enhanced variant of halorhodopsin), to drive rebound bursts in the LHb (Fig. 5a). Yellow light pulses (1 Hz, 100 ms at 589 nm) reli-ably elicited robust rebound bursts in in vitro slice recordings with a
*** **
h
e
0
5
10
15
20
60
ACSF (0 Mg2+)NMDA (20 μM)
–65 mV
–65 mV –64 mV –64 mV –63 mV
ACSFKetamine (100 μM)a
ACSFAP5 (100 μM)d
20 m
V
5 s
20 m
V
100 ms
g
Bur
sts
per
min
Bur
sts
per
min
***
0
20
40
60
Bur
sts
per
min
Bur
sts
per
min
Bur
sts
per
min
**
Bur
sts
per
min
20 m
V
2 s
–56 mV –55 mV
20 m
V
100 ms
–60 mV –60 mV
20 m
V
2 s
20 m
V
100 ms
ACSFNBQX (10 μM)
20 m
V
2 s
20 m
V
100 ms0
10
20
30
40
50
0
10
20
30
40 *
Ketamine (100 μM)
0
10
20
3010 μM (n = 7)1 μM (n = 7)
ACSF (n = 6)100 μM (n = 11)
b c
20 m
V
10 s
ACSFFluoxetine (30 μM)
20 m
V
50 ms
0
10
20
30NS
f
Tim
e to
fully
blo
ck(m
in)
0
0.25
0.5
5
10
15
1
20 m
V
100 ms500 ms
20 m
V
Base Ket
BaseAP5
BaseNBQX
Base
Fluoxetine BaseNMDA
+KetNMDA
–1–0 min
100 μM0–1 min
10–15 min3–4 min
1 μM10 μM
************
NS
************
********
***
Figure 3 | LHb bursting requires activation of NMDARs. a, d–f, Example traces (left) and statistics (right, sampled within 3 min before and 1 min after drug application) showing effects of ketamine (a), AP5 (d), NBQX (e) and fluoxetine (f) on spontaneous bursts in the LHb of wild-type and cLH rats. Spikes in bursting and tonic-firing mode are shown in blue and black, respectively. b, Blockade of spontaneous LHb burst by different dosages of ketamine. Bursts per minute are calculated before (− 1 to 0 min) and after (0–1 min, 3–4 min and 10–15 min) ketamine perfusion. c, Average time
required to fully block LHb bursts by different concentrations of ketamine. g, Example trace of an originally silent LHb neuron induced to burst by NMDA perfusion and returned to silence after ketamine application. Note that NMDA markedly enhances both EPSPs (green shading) and burst firing. h, Summary of effects of NMDA perfusion and ketamine on bursts. Data are mean ± s.e.m., * P < 0.05, * * P < 0.01, * * * P < 0.001, * * * * P < 0.0001, NS, not significant. See Supplementary Table 1 for statistical analysis and n numbers.
**
e
cLH+sal cLH+mib
SPT (1 h)FST (1 h)c d
Suc
rose
pre
fere
nce
(%)
CRS+eth i.p.
0
50
100
150
200
Imm
obile
dur
atio
ns (s
)
CRS+sal i.p.
25
50
75
100
aACSF
Mibefradil (10 μM)
Bur
sts
per
min
Bur
sts
per
min
Base
Mib
*
Base ZD
0
10
20
30
20 m
V
2 s
ACSFZD7288 (50 μM)
100 ms
20 m
V
b
100 ms 20 m
V
–61 mV –58 mV
20 m
V
2 s
0
10
20
30
f
Imm
obile
dur
atio
ns (s
)
Suc
rose
pre
fere
nce
(%)
SPT (1 h)FST (1 h)
cLH+sal cLH+mib
0
50
100
150
200
250
g*
25
50
75
100* * *
Figure 4 | Antagonists of T-VSCCs block LHb bursts and cause rapid antidepression. a, b, Example traces (left) and statistics (right, sampled within 3 min before and 1 min after drug application) showing effects of mibefradil (a) or ZD7288 (b) on spontaneous bursts in the LHb of wild-type and cLH rats. c–g, Antidepressant effects caused by systemic
ethosuximide injection (200 mg kg−1, i.p.; c, d) or local bilateral infusion of mibefradil into the LHb (e–g) in the FST (c, f) and SPT (d, g) 1 h after treatment. Infusion sites verified by CTB (e). Data are mean ± s.e.m., * P < 0.05, * * P < 0.01. See Supplementary Table 1 for statistical analysis and n numbers.
© 2018 Macmillan Publishers Limited, part of Springer Nature. All rights reserved.
1 5 f e b r u a r y 2 0 1 8 | V O L 5 5 4 | N a T u r e | 3 2 1
Article reSeArcH
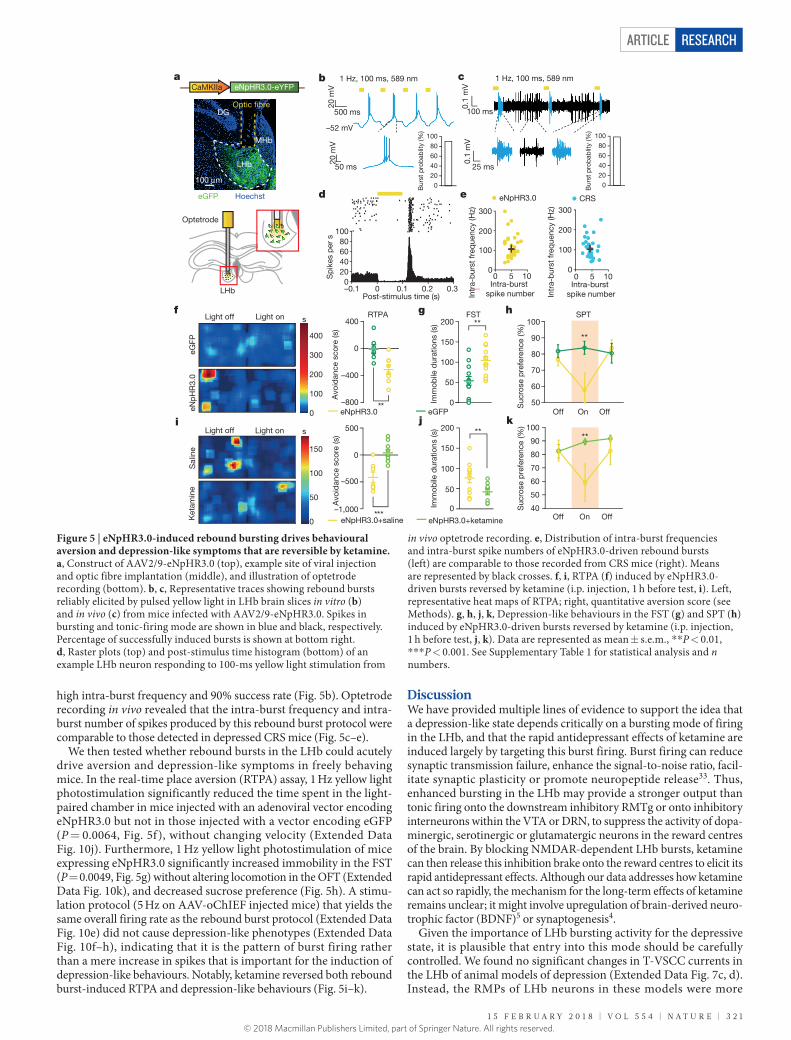
high intra-burst frequency and 90% success rate (Fig. 5b). Optetrode recording in vivo revealed that the intra-burst frequency and intra-burst number of spikes produced by this rebound burst protocol were comparable to those detected in depressed CRS mice (Fig. 5c–e).
We then tested whether rebound bursts in the LHb could acutely drive aversion and depression-like symptoms in freely behaving mice. In the real-time place aversion (RTPA) assay, 1 Hz yellow light photostimulation significantly reduced the time spent in the light-paired chamber in mice injected with an adenoviral vector encoding eNpHR3.0 but not in those injected with a vector encoding eGFP (P = 0.0064, Fig. 5f), without changing velocity (Extended Data Fig. 10j). Furthermore, 1 Hz yellow light photostimulation of mice expressing eNpHR3.0 significantly increased immobility in the FST (P = 0.0049, Fig. 5g) without altering locomotion in the OFT (Extended Data Fig. 10k), and decreased sucrose preference (Fig. 5h). A stimu-lation protocol (5 Hz on AAV-oChIEF injected mice) that yields the same overall firing rate as the rebound burst protocol (Extended Data Fig. 10e) did not cause depression-like phenotypes (Extended Data Fig. 10f–h), indicating that it is the pattern of burst firing rather than a mere increase in spikes that is important for the induction of depression-like behaviours. Notably, ketamine reversed both rebound burst-induced RTPA and depression-like behaviours (Fig. 5i–k).
DiscussionWe have provided multiple lines of evidence to support the idea that a depression-like state depends critically on a bursting mode of firing in the LHb, and that the rapid antidepressant effects of ketamine are induced largely by targeting this burst firing. Burst firing can reduce synaptic transmission failure, enhance the signal-to-noise ratio, facil-itate synaptic plasticity or promote neuropeptide release33. Thus, enhanced bursting in the LHb may provide a stronger output than tonic firing onto the downstream inhibitory RMTg or onto inhibitory interneurons within the VTA or DRN, to suppress the activity of dopa-minergic, serotinergic or glutamatergic neurons in the reward centres of the brain. By blocking NMDAR-dependent LHb bursts, ketamine can then release this inhibition brake onto the reward centres to elicit its rapid antidepressant effects. Although our data addresses how ketamine can act so rapidly, the mechanism for the long-term effects of ketamine remains unclear; it might involve upregulation of brain-derived neuro-trophic factor (BDNF)5 or synaptogenesis4.
Given the importance of LHb bursting activity for the depressive state, it is plausible that entry into this mode should be carefully controlled. We found no significant changes in T-VSCC currents in the LHb of animal models of depression (Extended Data Fig. 7c, d). Instead, the RMPs of LHb neurons in these models were more
SPT
50
60
70
80
90
100
Off On Off
**
a b
20 m
V
500 ms
–52 mV
1 Hz, 100 ms, 589 nm
50 ms
20 m
V
c
f h
i
eNp
HR
3.0
eGFP
0
100
200
300
Intr
a-b
urst
freq
uenc
y (H
z)
10Intra-burst
spike number
50
ed
–0.10
20406080
100
Sp
ikes
per
s
0.1Post-stimulus time (s)
0.2 0.30
eNpHR3.0 CRS
0
100
200
300
Intr
a-b
urst
freq
uenc
y (H
z)
10Intra-burst
spike number
50
eNpHR3.0 eGFP
100 ms
0.1
mV
0.1
mV
25 ms
0
50
100
150
200 **A
void
ance
sco
re (s
)
**
1 Hz, 100 ms, 589 nmeNpHR3.0-eYFP
j k
Ket
amin
eS
alin
e
Light onLight off
Optetrode
LHb
g
0
100
200
300
400
0
50
100
150
s
sFSTRTPA
–800
–400
0
400
Suc
rose
pre
fere
nce
(%)
Suc
rose
pre
fere
nce
(%)
Imm
obile
dur
atio
ns (s
)Im
mob
ile d
urat
ions
(s)
Avo
idan
ce s
core
(s)
–1,000
–500
0
500
***0
50
100
150
200 **
Off On Off40
50
60
70
80
90
100**
eNpHR3.0+saline eNpHR3.0+ketamine
Light onLight off
Optic �bre
LHb
MHb
DG
100 μm0
20
40
60
80
100
Bur
st p
rob
ablit
y (%
)
Bur
st p
rob
ablit
y (%
)
0
20
40
60
80
100
CaMKIIa
eGFP Hoechst
Figure 5 | eNpHR3.0-induced rebound bursting drives behavioural aversion and depression-like symptoms that are reversible by ketamine. a, Construct of AAV2/9-eNpHR3.0 (top), example site of viral injection and optic fibre implantation (middle), and illustration of optetrode recording (bottom). b, c, Representative traces showing rebound bursts reliably elicited by pulsed yellow light in LHb brain slices in vitro (b) and in vivo (c) from mice infected with AAV2/9-eNpHR3.0. Spikes in bursting and tonic-firing mode are shown in blue and black, respectively. Percentage of successfully induced bursts is shown at bottom right. d, Raster plots (top) and post-stimulus time histogram (bottom) of an example LHb neuron responding to 100-ms yellow light stimulation from
in vivo optetrode recording. e, Distribution of intra-burst frequencies and intra-burst spike numbers of eNpHR3.0-driven rebound bursts (left) are comparable to those recorded from CRS mice (right). Means are represented by black crosses. f, i, RTPA (f) induced by eNpHR3.0-driven bursts reversed by ketamine (i.p. injection, 1 h before test, i). Left, representative heat maps of RTPA; right, quantitative aversion score (see Methods). g, h, j, k, Depression-like behaviours in the FST (g) and SPT (h) induced by eNpHR3.0-driven bursts reversed by ketamine (i.p. injection, 1 h before test, j, k). Data are represented as mean ± s.e.m., * * P < 0.01, * * * P < 0.001. See Supplementary Table 1 for statistical analysis and n numbers.
© 2018 Macmillan Publishers Limited, part of Springer Nature. All rights reserved.
3 2 2 | N a T u r e | V O L 5 5 4 | 1 5 f e b r u a r y 2 0 1 8
ArticlereSeArcH
hyperpolarized (by 5–6 mV) than those of control animals (Extended Data Fig. 7e, f). Considering that hyperpolarization can convert silent or tonic-firing neurons to bursting mode (Extended Data Fig. 6e), we hypothesize that a molecular mechanism that lowers the RMPs of LHb neurons to the level at which T-VSCCs can be de-inactivated may account for the increase of LHb bursting in depression-like states. In the accompanying paper34, we show that increased levels of astrocytic Kir4.1 and potassium buffering may be responsible for the hyperpo-larization of RMPs and for the increased bursting of LHb neurons in depression.
Online Content Methods, along with any additional Extended Data display items and Source Data, are available in the online version of the paper; references unique to these sections appear only in the online paper.
received 18 May 2017; accepted 9 January 2018.
1. Berman, R. M. et al. Antidepressant effects of ketamine in depressed patients. Biol. Psychiatry 47, 351–354 (2000).
2. Zarate, C. A. Jr et al. A randomized trial of an N-methyl-d-aspartate antagonist in treatment-resistant major depression. Arch. Gen. Psychiatry 63, 856–864 (2006).
3. Maeng, S. et al. Cellular mechanisms underlying the antidepressant effects of ketamine: role of α -amino-3-hydroxy-5-methylisoxazole-4-propionic acid receptors. Biol. Psychiatry 63, 349–352 (2008).
4. Li, N. et al. mTOR-dependent synapse formation underlies the rapid antidepressant effects of NMDA antagonists. Science 329, 959–964 (2010).
5. Autry, A. E.et al. NMDA receptor blockade at rest triggers rapid behavioural antidepressant responses. Nature 475, 91–95 (2011).
6. Zanos, P. et al. NMDAR inhibition-independent antidepressant actions of ketamine metabolites. Nature 533, 481–486 (2016).
7. Clements, J. A., Nimmo, W. S. & Grant, I. S. Bioavailability, pharmacokinetics, and analgesic activity of ketamine in humans. J. Pharm. Sci. 71, 539–542 (1982).
8. Homayoun, H. & Moghaddam, B. NMDA receptor hypofunction produces opposite effects on prefrontal cortex interneurons and pyramidal neurons. J. Neurosci. 27, 11496–11500 (2007).
9. Matsumoto, M. & Hikosaka, O. Lateral habenula as a source of negative reward signals in dopamine neurons. Nature 447, 1111–1115 (2007).
10. Lammel, S. et al. Input-specific control of reward and aversion in the ventral tegmental area. Nature 491, 212–217 (2012).
11. Shabel, S. J., Proulx, C. D., Trias, A., Murphy, R. T. & Malinow, R. Input to the lateral habenula from the basal ganglia is excitatory, aversive, and suppressed by serotonin. Neuron 74, 475–481 (2012).
12. Stamatakis, A. M. & Stuber, G. D. Activation of lateral habenula inputs to the ventral midbrain promotes behavioral avoidance. Nat. Neurosci. 15, 1105–1107 (2012).
13. Stephenson-Jones, M. et al. A basal ganglia circuit for evaluating action outcomes. Nature 539, 289–293 (2016).
14. Morris, J. S., Smith, K. A., Cowen, P. J., Friston, K. J. & Dolan, R. J. Covariation of activity in habenula and dorsal raphé nuclei following tryptophan depletion. Neuroimage 10, 163–172 (1999).
15. Shumake, J., Edwards, E. & Gonzalez-Lima, F. Opposite metabolic changes in the habenula and ventral tegmental area of a genetic model of helpless behavior. Brain Res. 963, 274–281 (2003).
16. Li, B. et al. Synaptic potentiation onto habenula neurons in the learned helplessness model of depression. Nature 470, 535–539 (2011).
17. Li, K. et al. β CaMKII in lateral habenula mediates core symptoms of depression. Science 341, 1016–1020 (2013).
18. Lecca, S. et al. Rescue of GABAB and GIRK function in the lateral habenula by protein phosphatase 2A inhibition ameliorates depression-like phenotypes in mice. Nat. Med. 22, 254–261 (2016).
19. Aizawa, H., Kobayashi, M., Tanaka, S., Fukai, T. & Okamoto, H. Molecular characterization of the subnuclei in rat habenula. J. Comp. Neurol. 520, 4051–4066 (2012).
20. Tye, K. M. et al. Dopamine neurons modulate neural encoding and expression of depression-related behaviour. Nature 493, 537–541 (2013).
21. Hu, H. Reward and aversion. Annu. Rev. Neurosci. 39, 297–324 (2016).22. Jhou, T. C., Fields, H. L., Baxter, M. G., Saper, C. B. & Holland, P. C. The
rostromedial tegmental nucleus (RMTg), a GABAergic afferent to midbrain dopamine neurons, encodes aversive stimuli and inhibits motor responses. Neuron 61, 786–800 (2009).
23. Tian, J. & Uchida, N. Habenula lesions reveal that multiple mechanisms underlie dopamine prediction errors. Neuron 87, 1304–1316 (2015).
24. Zhou, L. et al. Organization of functional long-range circuits controlling the activity of serotonergic neurons in the dorsal raphe nucleus. Cell Reports 18, 3018–3032 (2017).
25. Chang, S. Y. & Kim, U. Ionic mechanism of long-lasting discharges of action potentials triggered by membrane hyperpolarization in the medial lateral habenula. J. Neurosci. 24, 2172–2181 (2004).
26. Weiss, T. & Veh, R. W. Morphological and electrophysiological characteristics of neurons within identified subnuclei of the lateral habenula in rat brain slices. Neuroscience 172, 74–93 (2011).
27. McCormick, D. A. & Bal, T. Sleep and arousal: thalamocortical mechanisms. Annu. Rev. Neurosci. 20,185–215 (1997).
28. Grillner, S., McClellan, A., Sigvardt, K., Wallén, P. & Wilén, M. Activation of NMDA-receptors elicits “fictive locomotion” in lamprey spinal cord in vitro. Acta Physiol. Scand. 113, 549–551 (1981).
29. Schiller, J., Major, G., Koester, H. J. & Schiller, Y. NMDA spikes in basal dendrites of cortical pyramidal neurons. Nature 404, 285–289 (2000).
30. Zhu, Z. T., Munhall, A., Shen, K. Z. & Johnson, S. W. NMDA enhances a depolarization-activated inward current in subthalamic neurons. Neuropharmacology 49, 317–327 (2005).
31. Cheong, E. & Shin, H. S. T-type Ca2+ channels in normal and abnormal brain functions. Physiol. Rev. 93, 961–992 (2013).
32. Huguenard, J. R., Gutnick, M. J. & Prince, D. A. Transient Ca2+ currents in neurons isolated from rat lateral habenula. J. Neurophysiol. 70, 158–166 (1993).
33. Lisman, J. E. Bursts as a unit of neural information: making unreliable synapses reliable. Trends Neurosci. 20, 38–43 (1997).
34. Cui, Y. et al. Astroglial Kir4.1 in the lateral habenula drives neuronal bursts in depression. Nature https://doi.org/10.1038/nature25752 (2018).
Supplementary Information is available in the online version of the paper.
Acknowledgements We thank L.-S. Yu and J. Pan for performing LC–MS/MS; S.-M. Duan, X.-H. Zhang, X.-W. Chen, Y.-S. Shu, X. Ju, C. Lohmann and W. Yang for advice on experimental design and comments on the manuscript; and N. Lin, L. Zhang and K.-F. Liu for consultation on in vivo recording. This work was supported by grants from the National Key R&D Program of China (2016YFA0501000), the National Natural Science Foundation of China (91432108, 31225010, and 81527901) to H.H. and (81600954) to Y.Y., and the 111 project (B13026) to H. H.
Author Contributions H.H, Y.C and Y.Y. designed the study. Y.C. performed the in vitro patch-clamp experiments. Y.Y. and S.M. conducted the behavioural pharmacology experiments. K.S. performed the in vivo recordings. Y.D. and K.S. performed the optogenetic behaviour experiments. Z.N. established the biophysical model. H.H. conceived the project and wrote the manuscript with the assistance of Y.C., Y. Y. and Z.N.
Author Information Reprints and permissions information is available at www.nature.com/reprints. The authors declare competing financial interests; details are available in the online version of the paper. Readers are welcome to comment on the online version of the paper. Publisher’s note: Springer Nature remains neutral with regard to jurisdictional claims in published maps and institutional affiliations. Correspondence and requests for materials should be addressed to H.H. ([email protected]).
reviewer Information Nature thanks P. Kenny, H.-S. Shin and the other anonymous reviewer(s) for their contribution to the peer review of this work.
© 2018 Macmillan Publishers Limited, part of Springer Nature. All rights reserved.
Article reSeArcH
MethOdSAnimals. Male cLH rats (8–16 weeks of age) and age-matched male Sprague Dawley rats (SLAC Laboratory Animal Co.) were used. The cLH rats were screened using the learned helpless test17,35 for breeding as previously described35. Male adult (8–16 weeks of age) C57BL/6 mice (SLAC) were used for establishing the chronic restraint stress (CRS) depression model. Rats were group-housed two per cage and mice were housed four per cage under a 12-h light–dark cycle (light on from 7 a.m. to 7 p.m.) with free access to food and water ad libitum. All animal studies and experimental procedures were approved by the Animal Care and Use Committee of the animal facility at Zhejiang University.Systemic drug delivery for antidepressant. All drugs were dissolved in 0.9% saline, and administered intraperitoneally (i.p.). Concentrations were as follows: ketamine (Gutian Pharma Co.) 25 mg/kg for rats36 and 10 mg/kg for mice6; etho-suximide (2-ethyl-2-methylsuccinimide: a T-VSCC blocker, which can cross the blood–brain barrier37, Selleck) 200 mg/kg for mice. One hour after drug delivery, animals were used for behavioural or in vivo electrophysiology studies, or killed for in vitro electrophysiology studies.Cannula infusion experiment. A 26-gauge double guide cannulae (centre-to-centre distance 1.4 mm, Plastics One) was placed at a 2° angle to the coronal plane (without the 2° rotation, we found it difficult to hit both sides of the LHb) and inserted bilaterally into the LHb (AP, − 3.7 mm from bregma; ML, ± 0.7 mm; DV, − 4.05 mm from the brain surface) of cLH rats. A 33-gauge double dummy cannulae (Plastic One), secured with a dust cap, was inserted into the guide cannula to prevent clogging during the recovery period. After rats had recovered for at least 7 days, drugs were microinjected with a 33-gauge double injector cannulae, which has a 0.6-mm extension beyond the tip of the guide cannula, while cLH rats were anaesthetized with isoflurane on an anaesthetic machine. The extensions were manually sharpened before insertion.
Ketamine (25 μ g/μ l, IC50 = 5.35 μ M38), AP5 (40 nmol/μ l, IC50 = 30 μ M39), NBQX (1 or 5 nmol/μ l, IC50 = 0.15 μ M40) or mibefradil (10 mol/μ l, IC50 = 2.7 μ M41) were dissolved in 0.9% saline. Before the local drug infusion, tip-sharpened 33-gauge double injector cannulae were inserted into the guide cannulae to ensure clear passage and then pulled out. One microlitre of drug was infused (0.1 μ l/min) into each side through another set of tip-sharpened 33-gauge double injector cannulae, which were connected to the microsyringe. The injector cannulae were left in place for an additional 10 min to minimize spread of the drug along the injection track. The FST or SPT was performed 1 h after the injection of ketamine or mibefradil and 0.5 h after the injection of AP5 or NBQX. To verify the drug infusion sites, rats were injected with 1 μ l CTB-488 to each side of the LHb after all behavioural tests. For immunostaining, rats were then euthanized 30 min after CTB injection and processed as described17. Brain slices were counterstained with Hoechst before mounting on the slides. Fluorescent image acquisition was performed with an Olympus VS120 virtual microscopy slide scanning system. Only data from rats with correctly sited injections were used.LC–MS/MS measurement of ketamine concentration. Male cLH rats were anaesthetized by isoflurane and subsequently decapitated 1 h after drug admin-istration (i.p. or LHb cannulae infusion). Habenular or ventral hippocampal tis-sues (about 4 mg) were immediately dissected from the brain with Brain Matrix (RWD). The tissues were rinsed with PBS and immediately frozen in liquid nitro-gen and stored at − 80 °C until analysis. After samples were thawed, 100 μ l solution (ddH2O: acetonitrile = 9:1, v/v) and steel balls were added to homogenize samples for 2 min at 60 Hz with a tissue grinder. Ten microlitres of fluvoxamine solution (0.5 μ g/ml) was then added for vortex mixing, followed by the addition of 100 μ l supersaturated sodium carbonate. After vortex mixing for 10 s, the samples were extracted by liquid–liquid extraction with 800 μ l methyl tert-butyl ether under continuous shaking for 2 min at room temperature. After centrifugation for 10 min at 13,000 r.p.m. at 4 °C, 640 μ l of the upper layer was removed into a centrifu-gal concentrator (CentriVap, LABCONCO) to spin at 1,725 r.p.m. and 30 °C for 45 min, then vortexed with 40 μ l solution (ddH2O: acetonitrile = 1:1, v/v). After centrifugation for 5 min at 13,000 r.p.m. and 4 °C, the upper layer was injected into the chromatographic system.
The concentrations of (R,S)-ketamine in habenular and hippocampal tissue were determined by achiral LC–MS/MS following a previously described method6,42 with slight modifications. The analysis was accomplished using an Agilent Extend-C18 column (3.0 mm × 100 mm ID, 1.8 μ m; Varian). The mobile phase consisted of 0.1% methanoic acid buffer (pH 2.67) as component A and acetonitrile as component B at a flow rate of 0.3 ml/min, temporized at 10 °C (injection volume: 7 μ l). A linear gradient was run as follows: 0–0.2 min, 10% B; 0.2–1.5 min, from 10% B increased to 90% B; 1.5–3.0 min, 90% B; 3.0–3.1 min, from 90% B decreased to 10% B; 3.1–4.0 min, 10% B. Ten microlitres of (R,S)-ketamine of different concentrations (0.1, 1, 5, 10, 50, 100, 200 ng/ml) was mixed with 90 μ l brain tissue to establish the standard calibration curve. The quantification of (R,S)-ketamine was accomplished by calculating area ratios using fluvoxamine
(10 μ l of 0.5 μ g/ml solution loaded) as the internal standard. The MS/MS analy-sis was performed using a triple quadruple mass spectrometer model AB SCIEX 4000 plus (AB Company). The data were acquired and analysed using MutiQuant 3.0.2. Positive electrospray ionization data were acquired using multiple reaction monitoring (MRM) using the following transitions for (R,S)-ketamine studies: 238 → 125.Viral vectors. AAV2/9-CaMKIIa-eNpHR3.0-eYFP (titre: 7.45 × 10¹² vector genome (v.g.)/ml, dilution: 1:5, 0.1 μ l unilateral into LHb, Taitool Bioscience), AAV2/9-Ubi-eGFP (titre: 2.5 × 10¹³ v.g./ml, 1:30, 0.1 μ l unilateral into LHb, University of Massachusetts, Guangping Gao Laboratory), and AAV2/9-hSyn-oChIEF-tdTomato (titre: 6.29 × 10¹² v.g./ml, 1:5, 0.1 μ l unilateral into LHb, Obio Technology) were aliquoted and stored at − 80 °C until use.Behavioural assays. All behavioural assays were performed on animals 12–16 weeks old. Most behaviours were performed during the light phase except for the sucrose preference test, which was performed during the dark phase to maximize the consumption of solution, and the open field test for CRS mice. Behavioural analysis was performed blinded to experimental conditions.Chronic restraint stress (CRS). Mice were subjected to chronic-restraint stress by placement in 50-ml conical tubes with holes for air flow for 2–3 h per day for 14 consecutive days43.Open field test (OFT). Animals were placed in the centre of an arena (40 cm × 40 cm × 40.5 cm for mice and 100 cm × 100 cm × 50 cm for rats) in a room with dim light for 10 min. A video camera positioned directly above the arena was used to track the movement of each animal (Any-maze, Stoelting). For optogenetic manipulations, mice were allowed to move freely throughout the arena for 9 min, with laser stimulation occurring during the middle 3-min epoch.Forced swim test (FST). Animals were individually placed in a cylinder (12 cm diameter, 25 cm height for mice; 20 cm diameter, 50 cm height for rats) of water (23–25 °C) and swam for 6 min under normal light44. Water depth was set to pre-vent animals from touching the bottom with their tails or hind limbs. Animal behaviours were videotaped from the side. The immobile time during the last 4-min test was counted offline by an observer blinded to animal treatment. Immobile time was defined as time when animals remained floating or motion-less with only movements necessary for keeping balance in the water. For rats, an additional pre-test was conducted 24 h before the test, during which rats were indi-vidually placed in a cylinder of water with conditions described above for 15 min. For optogenetic manipulations, laser stimulation was delivered immediately after mice were placed in the water and lasted for 6 min. In order to minimize the impact of the optogenetic cable on swimming behaviour, the cable length was adjusted to allow the cable to just touch the water surface.Sucrose preference test (SPT). Animals were single housed and habituated with two bottles of water for 2 days, followed by two bottles of 2% sucrose for 2 days44. Animals were then water deprived for 24 h and then exposed to one bottle of 2% sucrose and one bottle of water for 2 h in the dark phase. Bottle positions were switched after 1 h (for 2 h test). Total consumption of each fluid was measured and sucrose preference was defined as the average sucrose consumption ratio during the first and second hours. Sucrose consumption ratio was calculated by divid-ing the total consumption of sucrose by the total consumption of both water and sucrose. For optogenetic manipulations, mice were gently placed in a white arena containing normal bedding and allowed to move freely in the arena. During the 90-min test, light was delivered during 30–60 min. Sucrose preference scores were measured for every 30 min. Only animals that had a baseline sucrose preference greater than 30% during the first 30-min session proceeded to the next session. Otherwise they were tested later on a different day20.Real-time place aversion (RTPA). Mice were placed in a white open chamber (52 cm × 26 cm × 23 cm) consisting of two chambers, and allowed to freely move between chambers for 20 min to assess their baseline place preference45. During the following 20-min test, we assigned a stimulated side in a counterbalanced manner. Laser stimulation was delivered as soon as mice entered the stimulated side and terminated once mice crossed to the non-stimulated side. A video camera posi-tioned above the chamber recorded each trial. Mouse locations and velocity were tracked and analysed using Any-maze software (Stoelting). Avoidance score was calculated as (Time in stimulated side – Time in non-stimulated side)test – (Time in stimulated side – Time in non-stimulated side)baseline.Optogenetic light delivery and protocols. For mice expressing eNpHR3.046 and eGFP, a 589-nm yellow light laser was delivered at 1 Hz, 100 ms pulse. Light inten-sity was calculated to be 16 mW, which was estimated at 3.5 mm from optic patch cable tip with a ceramic sleeve. For the SPT experiment, laser intensity during eNpHR3.0 stimulation was adjusted to 10 mW because LHb neurons could not follow 16 mW stimulation for longer than 10 min (amplitude of bursting spikes declines to noise level). For mice expressing oChIEF47 and eGFP, a 473-nm blue light laser was used; light intensity was calculated to be 25 mW. The blue light delivery paradigm was either 5 ms pulse, 5 pulses per s for the pulsed 100-Hz
© 2018 Macmillan Publishers Limited, part of Springer Nature. All rights reserved.
ArticlereSeArcH
protocol, or 20 Hz, tonic 5-ms pulses for the 20-Hz protocol, or 5 Hz, tonic 5-ms pulses for the 5-Hz protocol.LHb brain slice preparation. Animals (postnatal day (P)45–70 rats and P65–75 mice) were anaesthetized with isoflurane and 10% chloral hydrate, and then per-fused with 20 ml ice-cold ACSF (oxygenated with 95% O2 + 5% CO2) containing (mM): 125 NaCl, 2.5 KCl, 25 NaHCO3, 1.25 NaH2PO4, 1 MgCl2 and 25 glucose, with 1 mM pyruvate added. The brain was removed as quickly as possible after decapitation and put into chilled and oxygenated ACSF. Coronal (for most of experiments if not specified) or sagittal slices containing the habenula (350 μ m and 300 μ m thickness for rats and mice, respectively) were sectioned in cold ACSF using a Leica2000 vibratome and then transferred to ASCF at 32 °C for incubation and recovery. ACSF was continuously gassed with 95% O2 and 5% CO2. Slices were allowed to recover for at least 1 h before recording. For cLH rats, as a very high percentage (90%) of cLH offspring are learned helpless, we did not perform a learned helplessness test before taking them for brain slice recording. For CRS mice, both CRS and wild-type control mice went through an FST before brain slice recording. We then used the CRS animals that showed high immobility scores (immobile time > 140 s) and control mice that showed low immobility (immobile time < 110 s) in the FST for slice recording.In vitro electrophysiological recordings. For LHb neuron recordings, currents were measured under whole-cell patch-clamp using pipettes with a typical resist-ance of 5–6 MΩ filled with internal solution containing (mM) 105 K-gluconate, 30 KCl, 4 Mg-ATP, 0.3 Na-GTP, 0.3 EGTA, 10 HEPES and 10 Na-phosphocreatine, with pH set to 7.35. The external ACSF solution contained (in mM) 125 NaCl, 2.5 KCl, 25 NaHCO3, 1.25 NaH2PO4, 1 MgCl2 and 25 glucose. Cells were visualized with infrared optics on an upright microscope (BX51WI, Olympus). A MultiClamp 700B amplifier and pCLAMP10 software were used for electro-physiology (Axon Instruments). The series resistance and capacitance were compensated automatically after a stable Gigaseal was formed. Recordings were typically performed between 3 and 6 min after break-in. The spontaneous neuronal activity was recorded under current clamp (I = 0 pA).
LHb neurons show three modes of spontaneous activity at resting conditions. Silent cells showed no spike activity during recording. Tonic cells spontaneously generated tonic trains of action potentials at frequencies between 0.1 and 10 Hz, rarely up to 10–20 Hz. Burst-firing cells spontaneously generated clusters of spikes with an initially high but progressively declining intra-burst firing frequency in each burst. For bursting neurons, 99% (from n = 50 bursting neurons) of their spikes occurred within bursts. The inter-spike intervals (ISI) of neurons represent the duration of the silent periods between two neighbouring single spikes. A typical bursting neuron shows a bimodal distribution of ISIs since it is composed of relatively large inter-burst intervals and small intra-burst intervals. By contrast, tonic-firing neurons show a more homogenous Poisson distribution of ISIs.
Evoked NMDAR EPSCs were recorded under voltage clamp from − 50 mV to − 80 mV in sagittal LHb slices by stimulating the input stria medullaris fibre in a modified extracellular ACSF solution48 with the AMPAR blocker NBQX, GABAR blocker picrotoxin and 0 Mg2+ and isolated currents were confirmed to be NMDAR currents because they could be abolished by AP5 (Extended Data Fig. 5a, b). Evoked T-type VSCC currents were recorded under voltage clamp starting from a holding potential of − 50 mV before being increased to conditioning potential (− 100 mV) for 1 s preceding the command steps (5 mV, 0.1 Hz per step increment). LHb T-VSCC currents were obtained by subtraction of recorded traces in the presence or absence of mibefradil49 (Extended Data Fig. 7a–d).Pharmacological characterization of burst and neuronal RMP. Ketamine (100 μ M, 10 mΜ and 1 μ M, Gutian Pharma Co.)5, AP5 (100 μ M, Sigma)50, NBQX (10 μ M, Sigma)51, mibefradil (10 μ M, Sigma)52, ZD7288 (50 μ M, Tocris)53, TTX (1 μ M, Sigma)18, picrotoxin (100 μ M, Sigma)50, NMDA (20 μ M, Sigma)54, AMPA (1 μ M, Sigma)48 and fluoxetine (30 μ M, Sigma)55,56 were used for electrophysiology. Drugs were dissolved in water, aliquoted at 1,000× final concentration and stocked at − 80 °C before use. Recordings were performed between 3 and 6 min after whole cell break-in. During recordings, baselines of spontaneous or rebound bursts and RMPs were recorded for at least 3 min before drugs were perfused. The start of drug perfusion was precisely indicated by a bubble that was added before the transition from normal ACSF to ACSF with drug.
The effect of ketamine (100 μ M) on mEPSCs was tested under voltage clamp (the cells were held at − 60 mV) in the presence of TTX (1 μ M) and picrotoxin (100 μ M) in ACSF. The intracellular solution contained CsMeSO3 115 mM, CsCl 20 mM, HEPES 10 mM, MgCl2 2.5 mM, Na2-ATP 4 mM, Na-GTP 0.4 mM, Na-phosphocreatine 10 mM, and EGTA 0.6 mM. Data were filtered at 2 kHz and sampled at 10 kHz using Digidata1550. The baseline was recorded for 5 min. Ketamine was then perfused for 10 min. mEPSCs were analysed from 2 to 4 min before and 5 to 7 min after the start of ketamine perfusion. Data were analysed by Mini Analysis Program (Synaptosoft) with an amplitude threshold of 5 pA.
In vivo electrophysiology. For in vivo recording experiments, a custom-made microdrive array consisting of eight tetrodes (impedance 250–500 KΩ , California fine wire)57 was implanted into the LHb (AP, − 1.72 mm; ML, 0.46 mm; DV, − 2.44 mm from the brain surface) of control or CRS mice. Stainless steel wires were attached to two screws on the skull as ground. The microdrive was secured to the skull with dental cement. After recovery for 2 weeks, mice were allowed to adapt to the recording headstage for 10 min per day for 2–3 days. Spontaneous spiking activity (digitized at 40 kHz, band-pass filtered between 300 and 6,000 Hz) and LFP (digitized at 1 kHz sampling rate, low-pass filtered up to 250 Hz) were recorded simultaneously for 30 min during the still period of the mice in their home cages with a gain of 5,000× . A single channel without a detectable unit was assigned as a reference electrode. The tetrodes were lowered in steps of 70 μ m after each recording session, followed by at least a 2-day recovery. For CRS mice, data were recorded for 30 min before and 1 h after ketamine treatment (10 mg/kg, i.p.). If mice received a second ketamine injection, at least a 2-week interval was introduced before the next recording session. All procedures were performed during the light phase. The positions of the electrodes were verified by electrolytic lesions (30 μ A, 10–15 s) at the end of all experiments.Spike sorting. All waveforms recorded from each tetrode were imported in Offline Sorter V3 (Plexon Inc.). Single units were manually identified by threshold crossing and principal component analysis (PCA). Spikes with inter-spike interval (ISI) less than the refractory period (1.4 ms) were excluded. Cross correlograms were plotted to ensure that no cell was discriminated more than once on overlapping tetrodes. Only units with a signal-to-noise ratio larger than 2 were used.Data analysis. Data analysis was conducted by Neuroexplorer4 (Plexon Inc.) and MATLAB. For criteria to identify in vivo bursts in the LHb, we analysed intra-spike intervals from 120 spontaneous bursts (from 10 neurons) recorded in LHb brain slices (Extended Data Fig. 4c). All bursts began with a maximal inter-spike interval of 20 ms and ended with a maximal inter-spike interval of 100 ms (Extended Data Fig. 4c). Accordingly, we defined in vivo bursting as clusters of spikes beginning with a maximal inter-spike interval of 20 ms and ending with a maximal inter-spike interval of 100 ms (Extended Data Fig. 4d). The minimum intra-burst interval was set at 100 ms (Extended Data Fig. 4d) and the minimum number of spikes in a burst was set at 2. Burst events per minute, the percentage of spike firing within bursts, intra and inter-burst intervals and average spike numbers in a burst were analysed.
The raw LFPs were filtered between 1 and 200 Hz using a fourth-order Butterworth filter. To measure the synchronization between spikes and local field potential oscillations, we calculated spike-triggered averages (STAs)58,59 by aver-aging all LFP segments at ± 300 ms around all spikes under one experimental condition, and normalized STAs by spike number. Only STAs of spikes and LFPs recorded from separate electrodes were used. We then quantified STAs using spike-field coherence (SFC)58,59. The spectrum of the STA (fSTA) was calculated using the multitaper method (Chronux 2.0) with seven tapers. The average of these indi-vidual frequency spectra results in the spike triggered power (STP). The SFC was calculated as SFC (f) = [fSTA(f)/STP(f)]. SFC in the theta band was calculated as the average SFC in the theta frequency domain (4–10 Hz).In vivo optetrode recordings. To validate the effects of optogenetic stimulation on neuron firing, optetrode recording was applied oton mice injected with AAV2/9-CaMKIIa-eNpHR3.0-eYFP into the LHb. Mice were anaesthetized with isoflu-rane (5% for induction and 1% for maintenance). An optetrode consisted of four tetrodes and an optical fibre in the centre was lowered into the LHb (AP, − 1.72 mm; ML, 0.46 mm; DV, − 2.62 mm from the brain surface). The tip of the optical fibre was 200 μ m above the tip of the tetrodes. For optical stimulation, the optical fibre was connected to a 589 nm laser. 100 ms light pulses at 1 Hz were delivered to evoke rebound bursting. The light intensity was identical to that used in behavioural tests. Single units were recorded and sorted as described above.Surgery for optogenetics. Mice (P50–80) were deeply anaesthetized and placed in a stereotactic frame (RWD Instruments). Virus (0.1 μ l) was injected into the LHb one one side (AP, − 1.72 mm from bregma; ML, ± 0.46 mm; DV, − 2.62 mm from the brain surface) using a pulled glass capillary with a pressure microinjector (Picospritzer III, Parker) at a rate of 0.1 μ l/min. The injection needle was with-drawn 10 min after the end of the injection. After surgery, mice recovered from anaesthesia on a heat pad.
For optic fibre implantation, a 200-μ m fibre-optic cannula (Plastics one) was placed 300 μ m above the centre of viral injection site, and cemented onto the skull using dental cement.Biophysics modelling. Our single compartment model of a LHb neuron was con-structed using the following equations:
/ = − − − − − − − /V t I I I I I I I I I cd d ( – )inj T K Na Kleak Naleak AMPA NMDA GABA
where V is the membrane potential and c is the capacitance of the membrane. Only currents absolutely necessary were included in the model. Iinj is the external current
© 2018 Macmillan Publishers Limited, part of Springer Nature. All rights reserved.
Article reSeArcH
applied to the cell; IT is the low-threshold Ca2+ current mediated by T-VSCCs; INa and IK are the fast Na+ and K+ currents of action potentials; IKleak and INaleak are responsible for the resting membrane potential; IAMPA, INMDA and IGABA are the synaptic currents mediated by AMPA, NMDA and GABA receptors respectively. See Supplementary Information for detailed formulae.Statistical analysis. Required sample sizes were estimated on the basis of our past experience performing similar experiments. Mice were randomly assigned to treat-ment groups. Analyses were performed in a manner blinded to treatment assign-ments in all behavioural experiments. Statistical analyses were performed using GraphPad Prism software v6. By pre-established criteria, values were excluded from analyses if the viral injection or drug delivery sites were out of the LHb. All statistical tests were two-tailed, and significance was assigned at P < 0.05. Normality and equal variances between group samples were assessed using the D’Agostino & Pearson omnibus normality test and Brown–Forsythe tests, respec-tively. When normality and equal variance between sample groups was achieved, one-way ANOVA (followed by Bonferroni’s multiple comparisons test), or t-test were used. Where normality or equal variance of samples failed, Kruskal–Wallis one-way ANOVA (followed by Dunn’s correction), Mann–Whitney U test, or Wilcoxon matched-pairs signed rank test were performed. Linear regression test, Chi-square test, Fisher’s exact test or two-way ANOVA (followed by Bonferroni’s multiple comparisons test) were used in appropriate situations. The sample sizes, specific statistical tests used, and main effects of our statistical analyses for each experiment are reported in Supplementary Information Table 1.Data availability. The data that support the findings of this study are available from the corresponding author upon reasonable request.
35. Henn, F. A. & Vollmayr, B. Stress models of depression: forming genetically vulnerable strains. Neurosci. Biobehav. Rev. 29, 799–804 (2005).
36. Gigliucci, V. et al. Ketamine elicits sustained antidepressant-like activity via a serotonin-dependent mechanism. Psychopharmacology (Berl.) 228, 157–166 (2013).
37. Gören, M. Z. & Onat, F. Ethosuximide: from bench to bedside. CNS Drug Rev. 13, 224–239 (2007).
38. Gideons, E. S., Kavalali, E. T. & Monteggia, L. M. Mechanisms underlying differential effectiveness of memantine and ketamine in rapid antidepressant responses. Proc. Natl Acad. Sci. USA 111, 8649–8654 (2014).
39. Ambert, N. et al. Computational studies of NMDA receptors: differential effects of neuronal activity on efficacy of competitive and non-competitive antagonists. Open Access Bioinformatics 2, 113–125 (2010).
40. Endo, M., Kurachi, Y. & Mishina, M. Pharmacology of Ionic Channel Function: Activators and Inhibitors Vol. 147 (Springer Science & Business Media, 2012).
41. Mehrke, G., Zong, X. G., Flockerzi, V. & Hofmann, F. The Ca++-channel blocker Ro 40-5967 blocks differently T-type and L-type Ca++ channels. J. Pharmacol. Exp. Ther. 271, 1483–1488 (1994).
42. Hasan, M. et al. Quantitative chiral and achiral determination of ketamine and its metabolites by LC-MS/MS in human serum, urine and fecal samples. J. Pharm. Biomed. Anal. 139, 87–97 (2017).
43. Kim, K. S. & Han, P. L. Optimization of chronic stress paradigms using anxiety- and depression-like behavioral parameters. J. Neurosci. Res. 83, 497–507 (2006).
44. Powell, T. R., Fernandes, C. & Schalkwyk, L. C. Depression-related behavioral tests. Curr. Protoc. Mouse Biol. 2, 119–127 (2012).
45. Zhu, Y., Wienecke, C. F., Nachtrab, G. & Chen, X. A thalamic input to the nucleus accumbens mediates opiate dependence. Nature 530, 219–222 (2016).
46. Gradinaru, V. et al. Molecular and cellular approaches for diversifying and extending optogenetics. Cell 141, 154–165 (2010).
47. Lin, J. Y., Lin, M. Z., Steinbach, P. & Tsien, R. Y. Characterization of engineered channelrhodopsin variants with improved properties and kinetics. Biophys. J. 96, 1803–1814 (2009).
48. Ren, M., Cao, V., Ye, Y., Manji, H. K. & Wang, K. H. Arc regulates experience-dependent persistent firing patterns in frontal cortex. J. Neurosci. 34, 6583–6595 (2014).
49. Coulter, D. A., Huguenard, J. R. & Prince, D. A. Calcium currents in rat thalamocortical relay neurones: kinetic properties of the transient, low-threshold current. J. Physiol. (Lond.) 414, 587–604 (1989).
50. Shabel, S. J., Proulx, C. D., Piriz, J. & Malinow, R. Mood regulation. GABA/glutamate co-release controls habenula output and is modified by antidepressant treatment. Science 345, 1494–1498 (2014).
51. Valentinova, K. & Mameli, M. mGluR-LTD at excitatory and inhibitory synapses in the lateral habenula tunes neuronal output. Cell Reports 16, 2298–2307 (2016).
52. Zhu, Z. T., Munhall, A., Shen, K. Z. & Johnson, S. W. Calcium-dependent subthreshold oscillations determine bursting activity induced by N-methyl-d-aspartate in rat subthalamic neurons in vitro. Eur. J. Neurosci. 19, 1296–1304 (2004).
53. Rateau, Y. & Ropert, N. Expression of a functional hyperpolarization-activated current (Ih) in the mouse nucleus reticularis thalami. J. Neurophysiol. 95, 3073–3085 (2006).
54. Bon, C. L., Paulsen, O. & Greenfield, S. A. Association between the low threshold calcium spike and activation of NMDA receptors in guinea-pig substantia nigra pars compacta neurons. Eur. J. Neurosci. 10, 2009–2015 (1998).
55. Zhong, P. & Yan, Z. Differential regulation of the excitability of prefrontal cortical fast-spiking interneurons and pyramidal neurons by serotonin and fluoxetine. PLoS One 6, e16970 (2011).
56. Caiati, M. D. & Cherubini, E. Fluoxetine impairs GABAergic signaling in hippocampal slices from neonatal rats. Front. Cell. Neurosci. 7, 63 (2013).
57. Lin, L. et al. Large-scale neural ensemble recording in the brains of freely behaving mice. J. Neurosci. Methods 155, 28–38 (2006).
58. Fries, P., Roelfsema, P. R., Engel, A. K., König, P. & Singer, W. Synchronization of oscillatory responses in visual cortex correlates with perception in interocular rivalry. Proc. Natl Acad. Sci. USA 94, 12699–12704 (1997).
59. Rutishauser, U., Ross, I. B., Mamelak, A. N. & Schuman, E. M. Human memory strength is predicted by theta-frequency phase-locking of single neurons. Nature 464, 903–907 (2010).
© 2018 Macmillan Publishers Limited, part of Springer Nature. All rights reserved.
ArticlereSeArcH
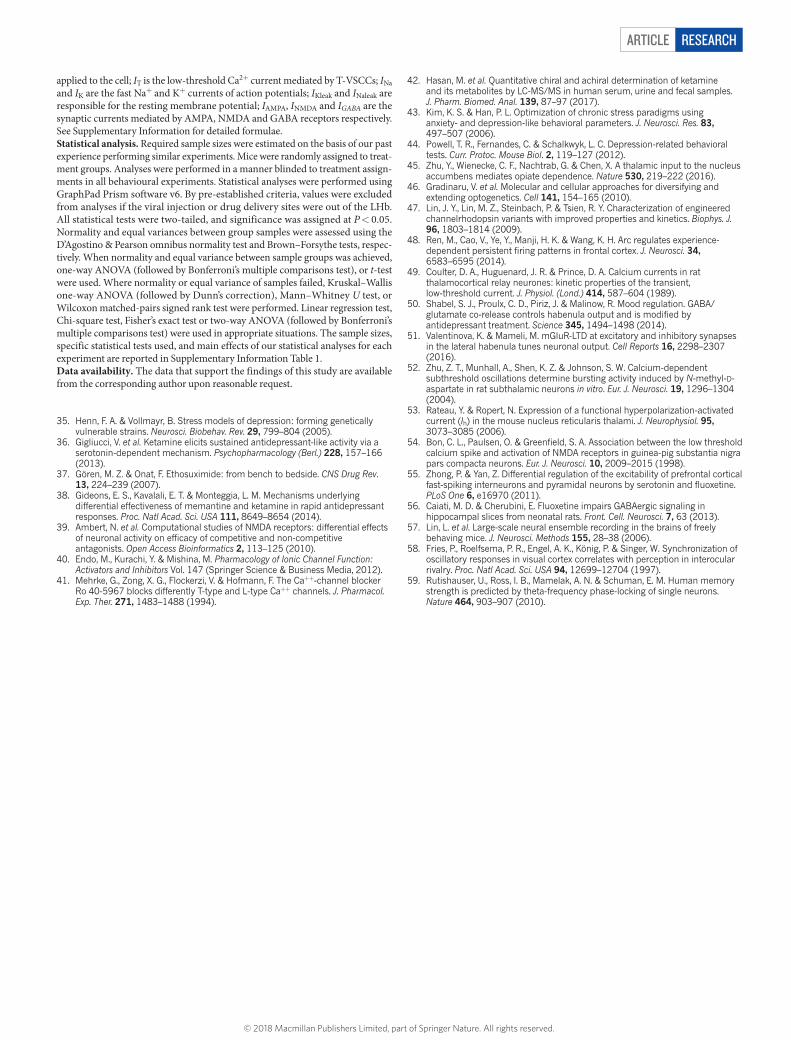
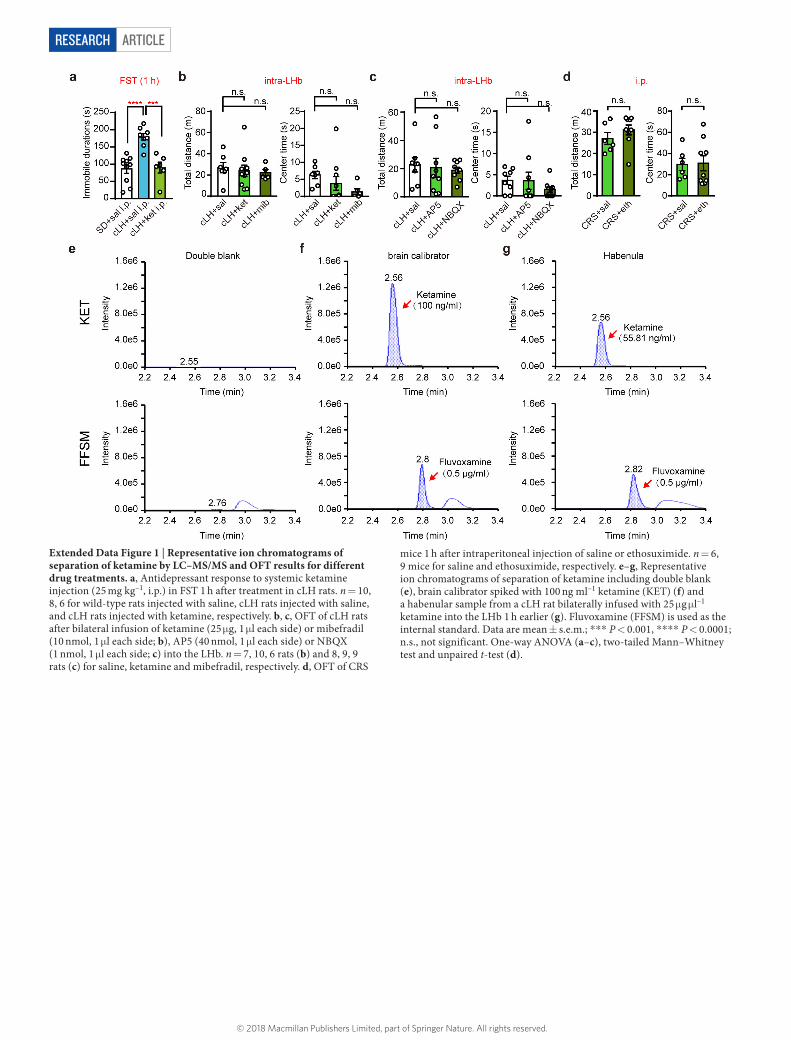
Extended Data Figure 1 | Representative ion chromatograms of separation of ketamine by LC–MS/MS and OFT results for different drug treatments. a, Antidepressant response to systemic ketamine injection (25 mg kg–1, i.p.) in FST 1 h after treatment in cLH rats. n = 10, 8, 6 for wild-type rats injected with saline, cLH rats injected with saline, and cLH rats injected with ketamine, respectively. b, c, OFT of cLH rats after bilateral infusion of ketamine (25 μ g, 1 μ l each side) or mibefradil (10 nmol, 1 μ l each side; b), AP5 (40 nmol, 1 μ l each side) or NBQX (1 nmol, 1 μ l each side; c) into the LHb. n = 7, 10, 6 rats (b) and 8, 9, 9 rats (c) for saline, ketamine and mibefradil, respectively. d, OFT of CRS
mice 1 h after intraperitoneal injection of saline or ethosuximide. n = 6, 9 mice for saline and ethosuximide, respectively. e–g, Representative ion chromatograms of separation of ketamine including double blank (e), brain calibrator spiked with 100 ng ml–1 ketamine (KET) (f) and a habenular sample from a cLH rat bilaterally infused with 25 μ g μ l–1 ketamine into the LHb 1 h earlier (g). Fluvoxamine (FFSM) is used as the internal standard. Data are mean ± s.e.m.; * ** P < 0.001, * ** * P < 0.0001; n.s., not significant. One-way ANOVA (a–c), two-tailed Mann–Whitney test and unpaired t-test (d).
© 2018 Macmillan Publishers Limited, part of Springer Nature. All rights reserved.
Article reSeArcH
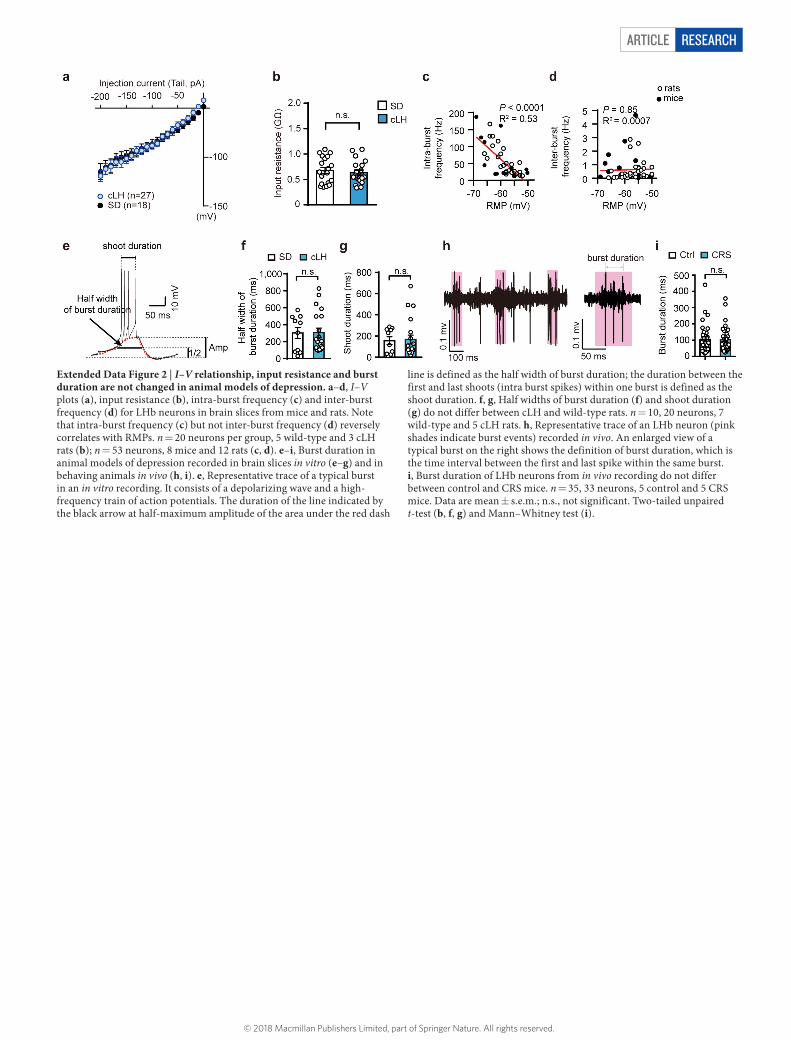
Extended Data Figure 2 | I–V relationship, input resistance and burst duration are not changed in animal models of depression. a–d, I–V plots (a), input resistance (b), intra-burst frequency (c) and inter-burst frequency (d) for LHb neurons in brain slices from mice and rats. Note that intra-burst frequency (c) but not inter-burst frequency (d) reversely correlates with RMPs. n = 20 neurons per group, 5 wild-type and 3 cLH rats (b); n = 53 neurons, 8 mice and 12 rats (c, d). e–i, Burst duration in animal models of depression recorded in brain slices in vitro (e–g) and in behaving animals in vivo (h, i). e, Representative trace of a typical burst in an in vitro recording. It consists of a depolarizing wave and a high-frequency train of action potentials. The duration of the line indicated by the black arrow at half-maximum amplitude of the area under the red dash
line is defined as the half width of burst duration; the duration between the first and last shoots (intra burst spikes) within one burst is defined as the shoot duration. f, g, Half widths of burst duration (f) and shoot duration (g) do not differ between cLH and wild-type rats. n = 10, 20 neurons, 7 wild-type and 5 cLH rats. h, Representative trace of an LHb neuron (pink shades indicate burst events) recorded in vivo. An enlarged view of a typical burst on the right shows the definition of burst duration, which is the time interval between the first and last spike within the same burst. i, Burst duration of LHb neurons from in vivo recording do not differ between control and CRS mice. n = 35, 33 neurons, 5 control and 5 CRS mice. Data are mean ± s.e.m.; n.s., not significant. Two-tailed unpaired t-test (b, f, g) and Mann–Whitney test (i).
© 2018 Macmillan Publishers Limited, part of Springer Nature. All rights reserved.
ArticlereSeArcH
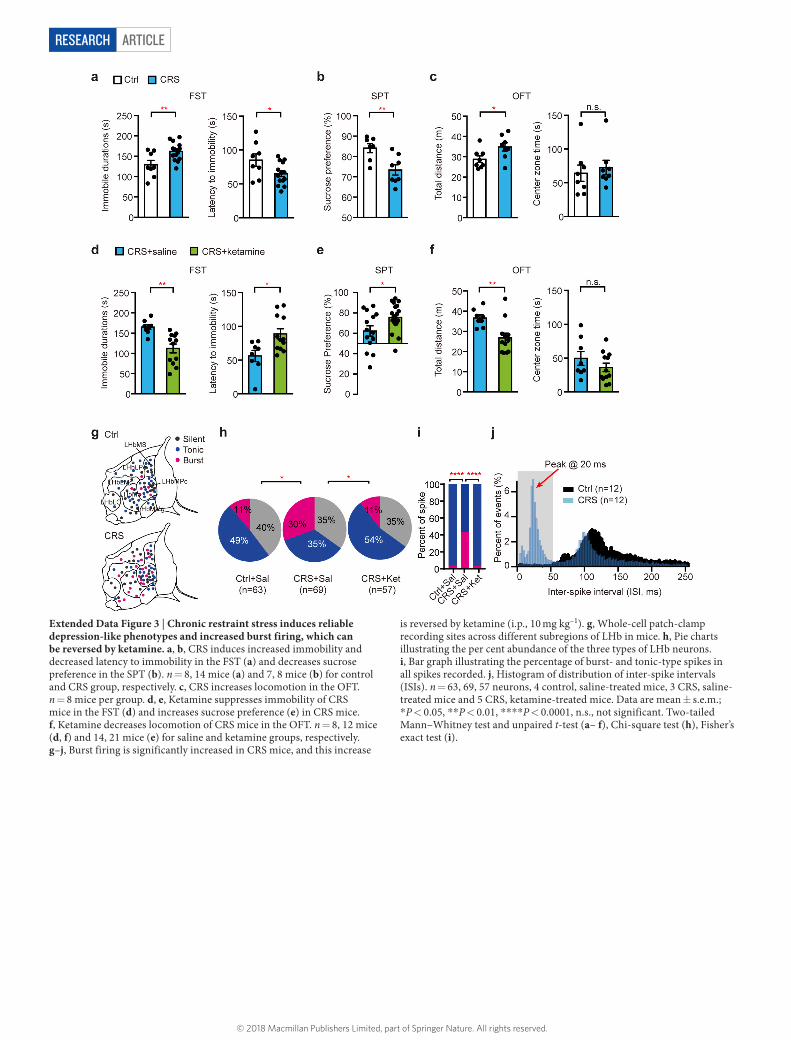
Extended Data Figure 3 | Chronic restraint stress induces reliable depression-like phenotypes and increased burst firing, which can be reversed by ketamine. a, b, CRS induces increased immobility and decreased latency to immobility in the FST (a) and decreases sucrose preference in the SPT (b). n = 8, 14 mice (a) and 7, 8 mice (b) for control and CRS group, respectively. c, CRS increases locomotion in the OFT. n = 8 mice per group. d, e, Ketamine suppresses immobility of CRS mice in the FST (d) and increases sucrose preference (e) in CRS mice. f, Ketamine decreases locomotion of CRS mice in the OFT. n = 8, 12 mice (d, f) and 14, 21 mice (e) for saline and ketamine groups, respectively. g–j, Burst firing is significantly increased in CRS mice, and this increase
is reversed by ketamine (i.p., 10 mg kg–1). g, Whole-cell patch-clamp recording sites across different subregions of LHb in mice. h, Pie charts illustrating the per cent abundance of the three types of LHb neurons. i, Bar graph illustrating the percentage of burst- and tonic-type spikes in all spikes recorded. j, Histogram of distribution of inter-spike intervals (ISIs). n = 63, 69, 57 neurons, 4 control, saline-treated mice, 3 CRS, saline-treated mice and 5 CRS, ketamine-treated mice. Data are mean ± s.e.m.; * P < 0.05, * * P < 0.01, * * * * P < 0.0001, n.s., not significant. Two-tailed Mann–Whitney test and unpaired t-test (a– f), Chi-square test (h), Fisher’s exact test (i).
© 2018 Macmillan Publishers Limited, part of Springer Nature. All rights reserved.
Article reSeArcH
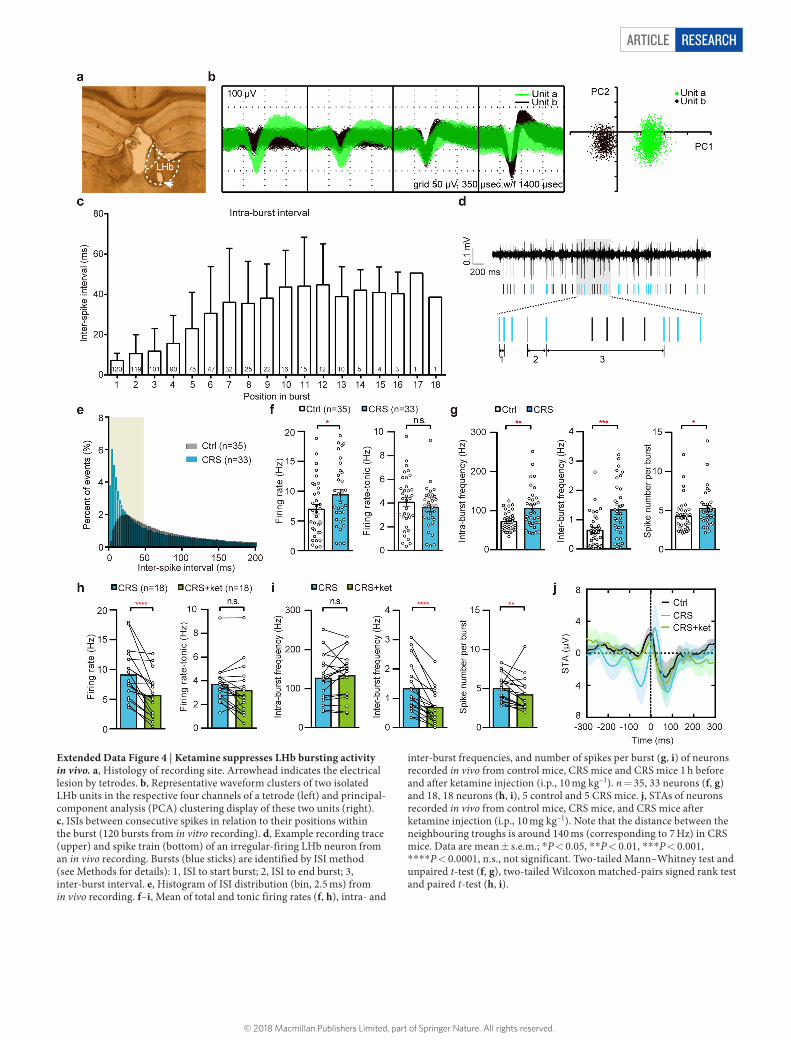
Extended Data Figure 4 | Ketamine suppresses LHb bursting activity in vivo. a, Histology of recording site. Arrowhead indicates the electrical lesion by tetrodes. b, Representative waveform clusters of two isolated LHb units in the respective four channels of a tetrode (left) and principal-component analysis (PCA) clustering display of these two units (right). c, ISIs between consecutive spikes in relation to their positions within the burst (120 bursts from in vitro recording). d, Example recording trace (upper) and spike train (bottom) of an irregular-firing LHb neuron from an in vivo recording. Bursts (blue sticks) are identified by ISI method (see Methods for details): 1, ISI to start burst; 2, ISI to end burst; 3, inter-burst interval. e, Histogram of ISI distribution (bin, 2.5 ms) from in vivo recording. f–i, Mean of total and tonic firing rates (f, h), intra- and
inter-burst frequencies, and number of spikes per burst (g, i) of neurons recorded in vivo from control mice, CRS mice and CRS mice 1 h before and after ketamine injection (i.p., 10 mg kg–1). n = 35, 33 neurons (f, g) and 18, 18 neurons (h, i), 5 control and 5 CRS mice. j, STAs of neurons recorded in vivo from control mice, CRS mice, and CRS mice after ketamine injection (i.p., 10 mg kg–1). Note that the distance between the neighbouring troughs is around 140 ms (corresponding to 7 Hz) in CRS mice. Data are mean ± s.e.m.; * P < 0.05, * * P < 0.01, * * * P < 0.001, * * * * P < 0.0001, n.s., not significant. Two-tailed Mann–Whitney test and unpaired t-test (f, g), two-tailed Wilcoxon matched-pairs signed rank test and paired t-test (h, i).
© 2018 Macmillan Publishers Limited, part of Springer Nature. All rights reserved.
ArticlereSeArcH
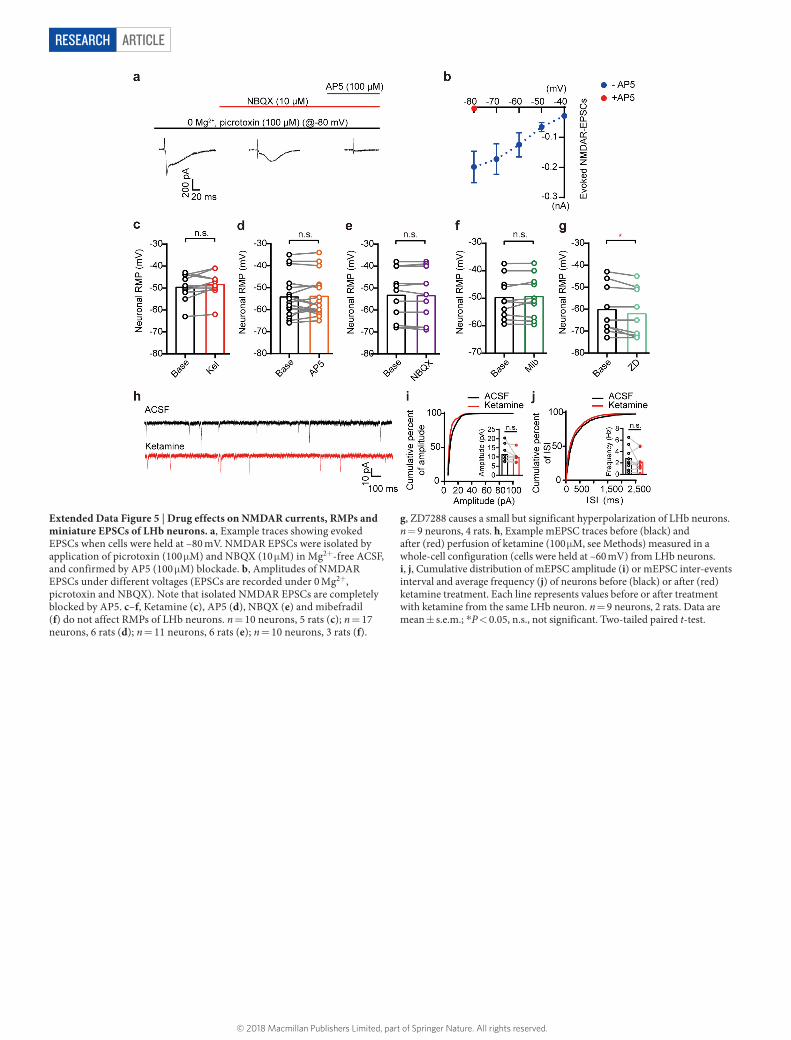
Extended Data Figure 5 | Drug effects on NMDAR currents, RMPs and miniature EPSCs of LHb neurons. a, Example traces showing evoked EPSCs when cells were held at –80 mV. NMDAR EPSCs were isolated by application of picrotoxin (100 μ M) and NBQX (10 μ M) in Mg2+-free ACSF, and confirmed by AP5 (100 μ M) blockade. b, Amplitudes of NMDAR EPSCs under different voltages (EPSCs are recorded under 0 Mg2+, picrotoxin and NBQX). Note that isolated NMDAR EPSCs are completely blocked by AP5. c–f, Ketamine (c), AP5 (d), NBQX (e) and mibefradil (f) do not affect RMPs of LHb neurons. n = 10 neurons, 5 rats (c); n = 17 neurons, 6 rats (d); n = 11 neurons, 6 rats (e); n = 10 neurons, 3 rats (f).
g, ZD7288 causes a small but significant hyperpolarization of LHb neurons. n = 9 neurons, 4 rats. h, Example mEPSC traces before (black) and after (red) perfusion of ketamine (100 μ M, see Methods) measured in a whole-cell configuration (cells were held at –60 mV) from LHb neurons. i, j, Cumulative distribution of mEPSC amplitude (i) or mEPSC inter-events interval and average frequency (j) of neurons before (black) or after (red) ketamine treatment. Each line represents values before or after treatment with ketamine from the same LHb neuron. n = 9 neurons, 2 rats. Data are mean ± s.e.m.; * P < 0.05, n.s., not significant. Two-tailed paired t-test.
© 2018 Macmillan Publishers Limited, part of Springer Nature. All rights reserved.
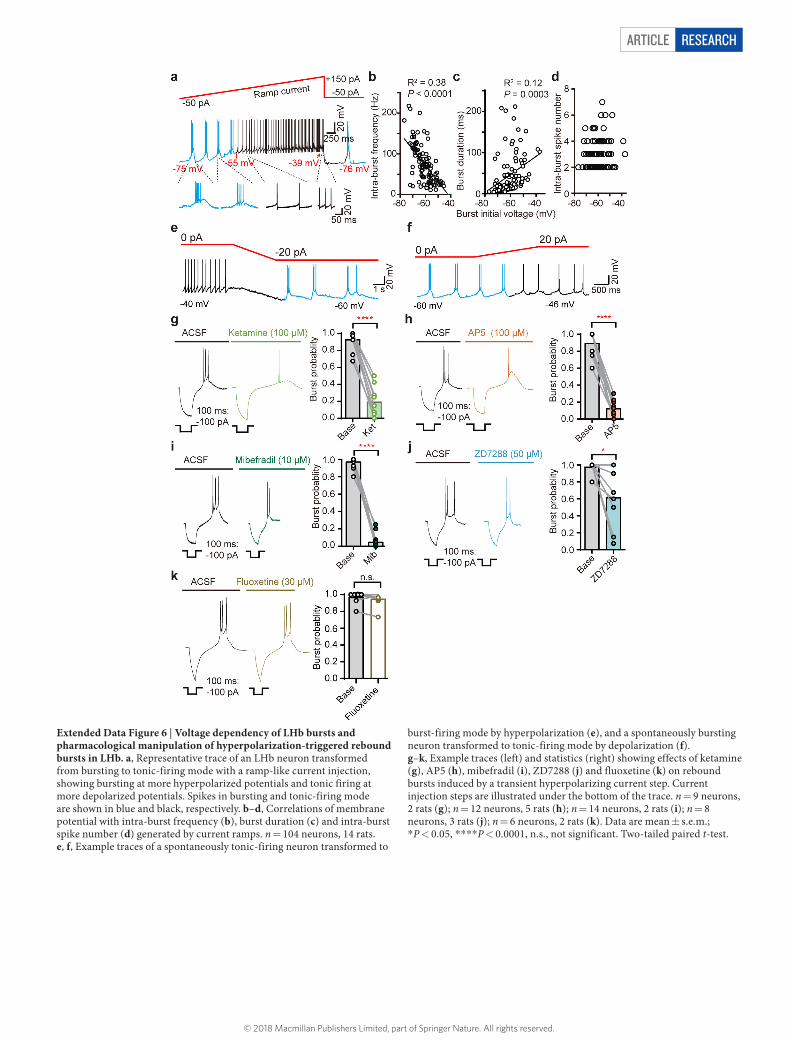
Article reSeArcH
Extended Data Figure 6 | Voltage dependency of LHb bursts and pharmacological manipulation of hyperpolarization-triggered rebound bursts in LHb. a, Representative trace of an LHb neuron transformed from bursting to tonic-firing mode with a ramp-like current injection, showing bursting at more hyperpolarized potentials and tonic firing at more depolarized potentials. Spikes in bursting and tonic-firing mode are shown in blue and black, respectively. b–d, Correlations of membrane potential with intra-burst frequency (b), burst duration (c) and intra-burst spike number (d) generated by current ramps. n = 104 neurons, 14 rats. e, f, Example traces of a spontaneously tonic-firing neuron transformed to
burst-firing mode by hyperpolarization (e), and a spontaneously bursting neuron transformed to tonic-firing mode by depolarization (f). g–k, Example traces (left) and statistics (right) showing effects of ketamine (g), AP5 (h), mibefradil (i), ZD7288 (j) and fluoxetine (k) on rebound bursts induced by a transient hyperpolarizing current step. Current injection steps are illustrated under the bottom of the trace. n = 9 neurons, 2 rats (g); n = 12 neurons, 5 rats (h); n = 14 neurons, 2 rats (i); n = 8 neurons, 3 rats (j); n = 6 neurons, 2 rats (k). Data are mean ± s.e.m.; * P < 0.05, * * * * P < 0.0001, n.s., not significant. Two-tailed paired t-test.
© 2018 Macmillan Publishers Limited, part of Springer Nature. All rights reserved.
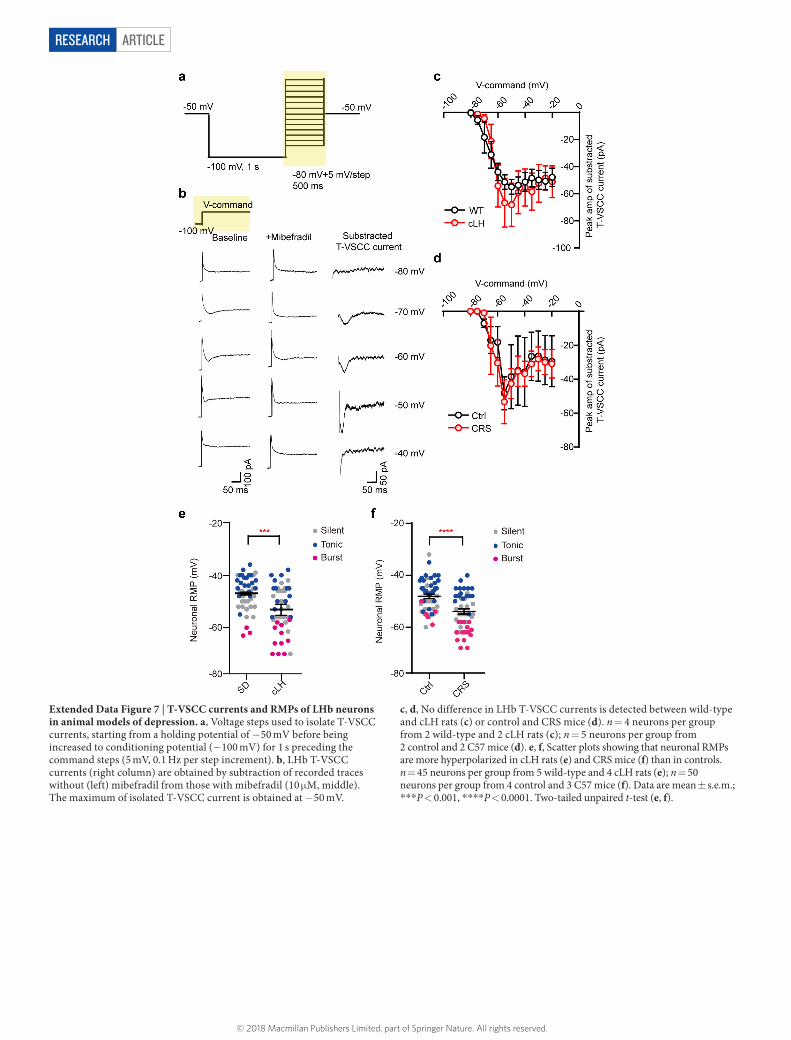
ArticlereSeArcH
Extended Data Figure 7 | T-VSCC currents and RMPs of LHb neurons in animal models of depression. a, Voltage steps used to isolate T-VSCC currents, starting from a holding potential of − 50 mV before being increased to conditioning potential (− 100 mV) for 1 s preceding the command steps (5 mV, 0.1 Hz per step increment). b, LHb T-VSCC currents (right column) are obtained by subtraction of recorded traces without (left) mibefradil from those with mibefradil (10 μ M, middle). The maximum of isolated T-VSCC current is obtained at − 50 mV.
c, d, No difference in LHb T-VSCC currents is detected between wild-type and cLH rats (c) or control and CRS mice (d). n = 4 neurons per group from 2 wild-type and 2 cLH rats (c); n = 5 neurons per group from 2 control and 2 C57 mice (d). e, f, Scatter plots showing that neuronal RMPs are more hyperpolarized in cLH rats (e) and CRS mice (f) than in controls. n = 45 neurons per group from 5 wild-type and 4 cLH rats (e); n = 50 neurons per group from 4 control and 3 C57 mice (f). Data are mean ± s.e.m.; * * * P < 0.001, * * * * P < 0.0001. Two-tailed unpaired t-test (e, f).
© 2018 Macmillan Publishers Limited, part of Springer Nature. All rights reserved.
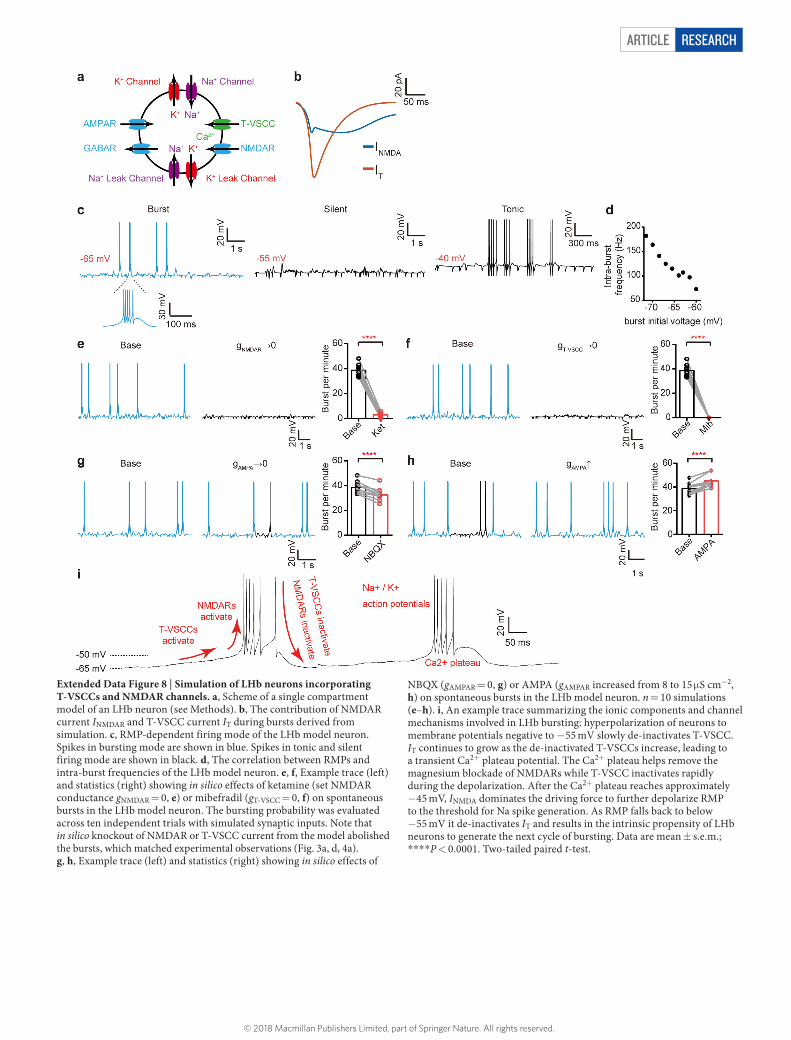
Article reSeArcH
Extended Data Figure 8 | Simulation of LHb neurons incorporating T-VSCCs and NMDAR channels. a, Scheme of a single compartment model of an LHb neuron (see Methods). b, The contribution of NMDAR current INMDAR and T-VSCC current IT during bursts derived from simulation. c, RMP-dependent firing mode of the LHb model neuron. Spikes in bursting mode are shown in blue. Spikes in tonic and silent firing mode are shown in black. d, The correlation between RMPs and intra-burst frequencies of the LHb model neuron. e, f, Example trace (left) and statistics (right) showing in silico effects of ketamine (set NMDAR conductance gNMDAR = 0, e) or mibefradil (gT-VSCC = 0, f) on spontaneous bursts in the LHb model neuron. The bursting probability was evaluated across ten independent trials with simulated synaptic inputs. Note that in silico knockout of NMDAR or T-VSCC current from the model abolished the bursts, which matched experimental observations (Fig. 3a, d, 4a). g, h, Example trace (left) and statistics (right) showing in silico effects of
NBQX (gAMPAR = 0, g) or AMPA (gAMPAR increased from 8 to 15 μ S cm−2, h) on spontaneous bursts in the LHb model neuron. n = 10 simulations (e–h). i, An example trace summarizing the ionic components and channel mechanisms involved in LHb bursting: hyperpolarization of neurons to membrane potentials negative to − 55 mV slowly de-inactivates T-VSCC. IT continues to grow as the de-inactivated T-VSCCs increase, leading to a transient Ca2+ plateau potential. The Ca2+ plateau helps remove the magnesium blockade of NMDARs while T-VSCC inactivates rapidly during the depolarization. After the Ca2+ plateau reaches approximately − 45 mV, INMDA dominates the driving force to further depolarize RMP to the threshold for Na spike generation. As RMP falls back to below − 55 mV it de-inactivates IT and results in the intrinsic propensity of LHb neurons to generate the next cycle of bursting. Data are mean ± s.e.m.; * * * * P < 0.0001. Two-tailed paired t-test.
© 2018 Macmillan Publishers Limited, part of Springer Nature. All rights reserved.
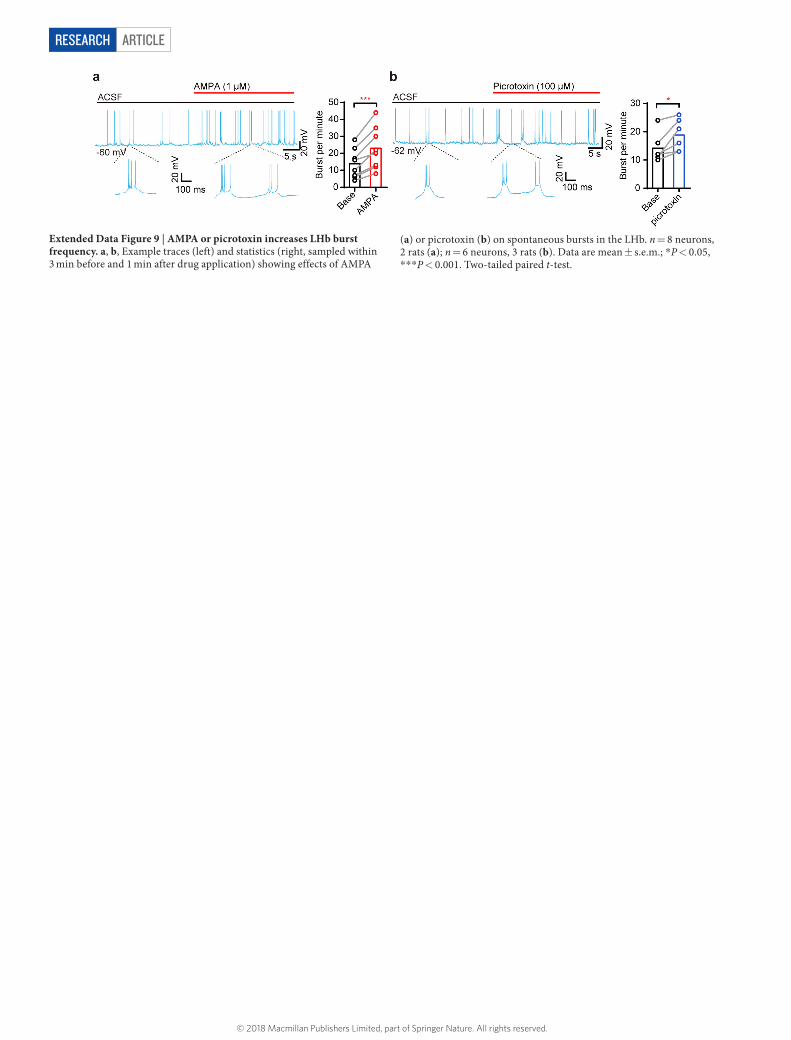
ArticlereSeArcH
Extended Data Figure 9 | AMPA or picrotoxin increases LHb burst frequency. a, b, Example traces (left) and statistics (right, sampled within 3 min before and 1 min after drug application) showing effects of AMPA
(a) or picrotoxin (b) on spontaneous bursts in the LHb. n = 8 neurons, 2 rats (a); n = 6 neurons, 3 rats (b). Data are mean ± s.e.m.; * P < 0.05, * * * P < 0.001. Two-tailed paired t-test.
© 2018 Macmillan Publishers Limited, part of Springer Nature. All rights reserved.
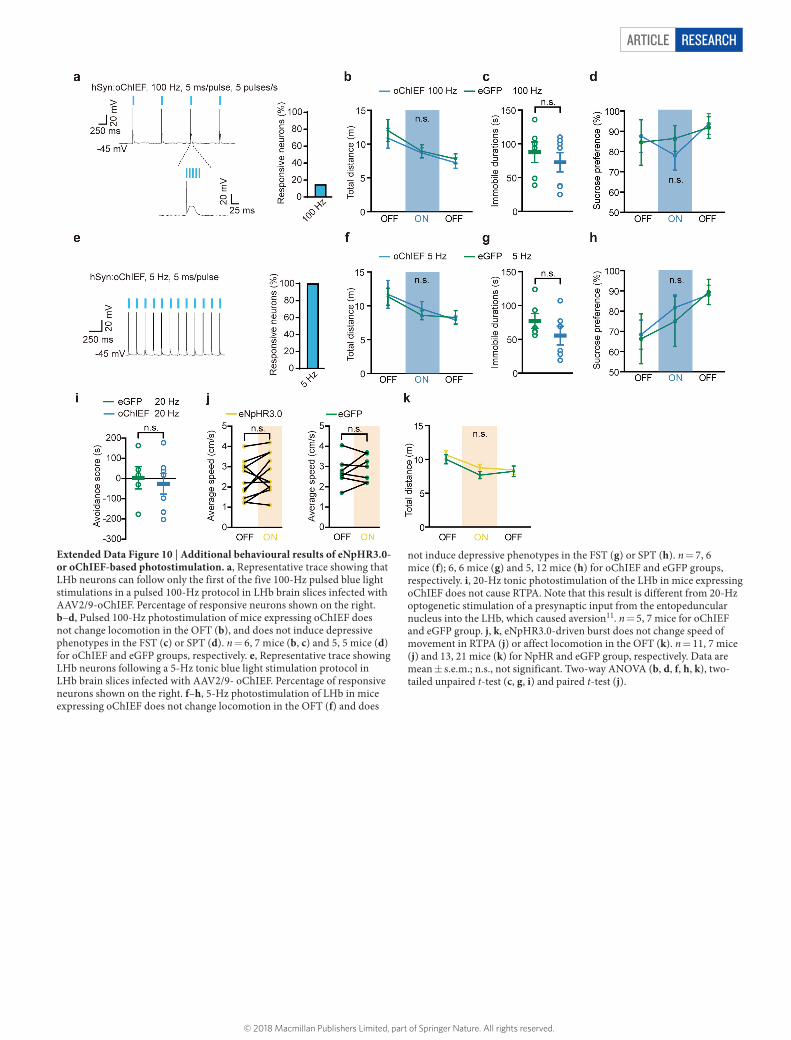
Article reSeArcH
Extended Data Figure 10 | Additional behavioural results of eNpHR3.0- or oChIEF-based photostimulation. a, Representative trace showing that LHb neurons can follow only the first of the five 100-Hz pulsed blue light stimulations in a pulsed 100-Hz protocol in LHb brain slices infected with AAV2/9-oChIEF. Percentage of responsive neurons shown on the right. b–d, Pulsed 100-Hz photostimulation of mice expressing oChIEF does not change locomotion in the OFT (b), and does not induce depressive phenotypes in the FST (c) or SPT (d). n = 6, 7 mice (b, c) and 5, 5 mice (d) for oChIEF and eGFP groups, respectively. e, Representative trace showing LHb neurons following a 5-Hz tonic blue light stimulation protocol in LHb brain slices infected with AAV2/9- oChIEF. Percentage of responsive neurons shown on the right. f–h, 5-Hz photostimulation of LHb in mice expressing oChIEF does not change locomotion in the OFT (f) and does
not induce depressive phenotypes in the FST (g) or SPT (h). n = 7, 6 mice (f); 6, 6 mice (g) and 5, 12 mice (h) for oChIEF and eGFP groups, respectively. i, 20-Hz tonic photostimulation of the LHb in mice expressing oChIEF does not cause RTPA. Note that this result is different from 20-Hz optogenetic stimulation of a presynaptic input from the entopeduncular nucleus into the LHb, which caused aversion11. n = 5, 7 mice for oChIEF and eGFP group. j, k, eNpHR3.0-driven burst does not change speed of movement in RTPA (j) or affect locomotion in the OFT (k). n = 11, 7 mice (j) and 13, 21 mice (k) for NpHR and eGFP group, respectively. Data are mean ± s.e.m.; n.s., not significant. Two-way ANOVA (b, d, f, h, k), two-tailed unpaired t-test (c, g, i) and paired t-test (j).
© 2018 Macmillan Publishers Limited, part of Springer Nature. All rights reserved.
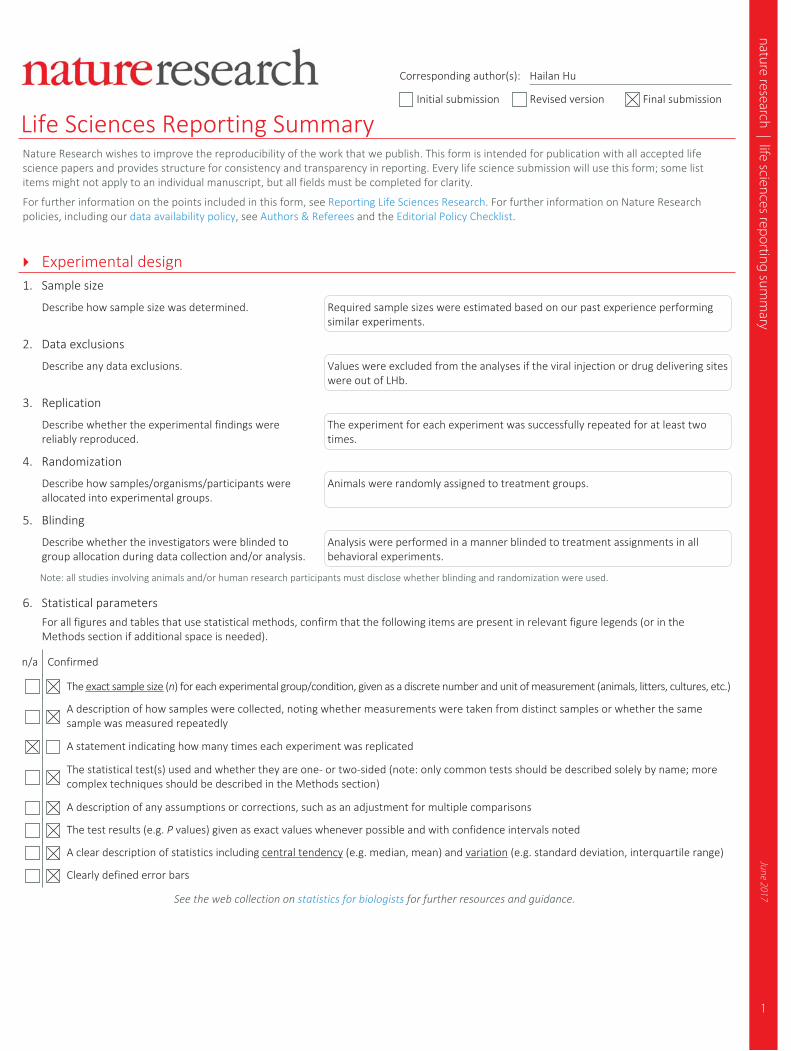
1
nature research | life sciences reporting summ
aryJune 2017
Corresponding author(s): Hailan Hu
Initial submission Revised version Final submission
Life Sciences Reporting SummaryNature Research wishes to improve the reproducibility of the work that we publish. This form is intended for publication with all accepted life science papers and provides structure for consistency and transparency in reporting. Every life science submission will use this form; some list items might not apply to an individual manuscript, but all fields must be completed for clarity.
For further information on the points included in this form, see Reporting Life Sciences Research. For further information on Nature Research policies, including our data availability policy, see Authors & Referees and the Editorial Policy Checklist.
Experimental design1. Sample size
Describe how sample size was determined. Required sample sizes were estimated based on our past experience performing similar experiments.
2. Data exclusions
Describe any data exclusions. Values were excluded from the analyses if the viral injection or drug delivering sites were out of LHb.
3. Replication
Describe whether the experimental findings were reliably reproduced.
The experiment for each experiment was successfully repeated for at least two times.
4. Randomization
Describe how samples/organisms/participants were allocated into experimental groups.
Animals were randomly assigned to treatment groups.
5. Blinding
Describe whether the investigators were blinded to group allocation during data collection and/or analysis.
Analysis were performed in a manner blinded to treatment assignments in all behavioral experiments.
Note: all studies involving animals and/or human research participants must disclose whether blinding and randomization were used.
6. Statistical parameters For all figures and tables that use statistical methods, confirm that the following items are present in relevant figure legends (or in the Methods section if additional space is needed).
n/a Confirmed
The exact sample size (n) for each experimental group/condition, given as a discrete number and unit of measurement (animals, litters, cultures, etc.)
A description of how samples were collected, noting whether measurements were taken from distinct samples or whether the same sample was measured repeatedly
A statement indicating how many times each experiment was replicated
The statistical test(s) used and whether they are one- or two-sided (note: only common tests should be described solely by name; more complex techniques should be described in the Methods section)
A description of any assumptions or corrections, such as an adjustment for multiple comparisons
The test results (e.g. P values) given as exact values whenever possible and with confidence intervals noted
A clear description of statistics including central tendency (e.g. median, mean) and variation (e.g. standard deviation, interquartile range)
Clearly defined error bars
See the web collection on statistics for biologists for further resources and guidance.

2
nature research | life sciences reporting summ
aryJune 2017
SoftwarePolicy information about availability of computer code
7. Software
Describe the software used to analyze the data in this study.
Offline sorter V3 was used for single unit sorting. Neuroexplorer V4 and Matlab was used for analysis of burst and synchronization. MATLAB was also used for the simulation. GraphPad Prism software v6 was used for statistical analyses.
For manuscripts utilizing custom algorithms or software that are central to the paper but not yet described in the published literature, software must be made available to editors and reviewers upon request. We strongly encourage code deposition in a community repository (e.g. GitHub). Nature Methods guidance for providing algorithms and software for publication provides further information on this topic.
Materials and reagentsPolicy information about availability of materials
8. Materials availability
Indicate whether there are restrictions on availability of unique materials or if these materials are only available for distribution by a for-profit company.
cLH rats need permission from Fritz Henn. Other unique materials used are readily available from the authors or commercially available.
9. Antibodies
Describe the antibodies used and how they were validated for use in the system under study (i.e. assay and species).
No antibodies were used
10. Eukaryotic cell linesa. State the source of each eukaryotic cell line used. No eukaryotic cell lines were used
b. Describe the method of cell line authentication used. N/A
c. Report whether the cell lines were tested for mycoplasma contamination.
N/A
d. If any of the cell lines used are listed in the database of commonly misidentified cell lines maintained by ICLAC, provide a scientific rationale for their use.
N/A
Animals and human research participantsPolicy information about studies involving animals; when reporting animal research, follow the ARRIVE guidelines
11. Description of research animalsProvide details on animals and/or animal-derived materials used in the study.
Male cLH rats (8-16 weeks of age) and age-matched male Sprague Dawley rats (SLAC Laboratory Animal Co., Shanghai) were used. The cLH rats were screened by learned helpless test for breeding as previously described. Male adult (8-16 weeks of age) C57BL/6 mice (SLAC) were used for establishing the chronic restraint stress (CRS) depression model.
Policy information about studies involving human research participants
12. Description of human research participantsDescribe the covariate-relevant population characteristics of the human research participants.
No human research participants.