Embed Size (px)
Citation preview

J Pharm Chem Biol Sci , December 2015-February 2016; 3(4): 440-453
Journal of Pharmaceutical, Chemical and Biological
Sciences ISSN: 2348-7658
Impact Factor (GIF): 0.615 Impact Factor (SJIF): 2.092
December 2015-February 2016; 3(4): 440-453
Ketoprofen Solubility in Organic Solvents and Aqueous Co-solvent Systems: Interactions and Thermodynamic Parameters of Solvation
Mauricio A. Filippa, Gisela M. Melo and Estela I. Gasull
Área de Química Física. Departamento de Química. Facultad de Química, Bioquímica y Farmacia. IMIBIO-CONICET. Universidad Nacional de San Luis. D5700HW. San Luis. Argentina.
*Corresponding Author: Estela Gasull, Chacabuco 917, San Luis, Argentina (CP 5700)
Received: 25 November 2015 Revised: 05 December 2015 Accepted: 10 December 2015
INTRODUCTION
The analysis of the physicochemical properties
of drugs is of great interest in pharmacy.
Ketoprofen (KET) (±) 2-(3-benzoylphenyl)
propionic acid (Figure1) is a non-steroidal
antiinflammatory drug (NSAIDs) nonselective
COX propionic acid derivative [1]. The NSAIDs
propionic acid derivatives have low water
solubility. KET being used a non-steroidal
analgesic and antipyretic in Argentina in
different presentations [2]. Whereas KET has
wide spread use as NSAIDs, it is important to
know their physicochemical properties and how
it interacts with pure solvents and water.
Knowledge of these interactions is important in
the design of new presentations of liquid
dosage forms [3]. The availability of this
information is often used for other applications
Original Research Article
ABSTRACT
Ketoprofen (KET) solubility was determined in fifteen pure solvents and aqueous-cosolvent mixtures
systems. The results obtained and the parameterized values solvents allowed us to observe the
influence of the latter on the solubility of KET. The experimental data obtained indicates that the 𝜋
parameter,which accounts for the polarity/polarizability of the solvent, and the Hildebrand's solubility
parameter, which depicts the cohesive forces of the solvent ,has the greatest influence on the
solubility of KET. In all the analyzed cosolvent mixtures, the solute was preferentially solvated by the
organic cosolvent. This indicates that with a decreasing polarity of the solvent, solvent-solvent
interactions decrease, favoring the solute-solvent interactions. For aqueous binary mixtures of
ethanol, ethylene glycol and propylene glycol, the apparent enthalpy, entropy and Gibbs free energy
changes involved in the solvation process were determined.
Keyword: Ketoprofen; co-solvents; solubility; interactions; thermodynamic parameters

Estela et al 441
J Pharm Chem Biol Sci , December 2015-February 2016; 3(4):440-453
such as purification methods and
preformulation [4, 5].
Fig. 1: Scheme of Ketoprofen (KET)
On the other hand, in analysis of interactions at
play between KET and solvents, it is possible to
analyze it from the thermodynamic point of
view by a thermal analysis of the dissolution
process [6].
Through solubility studies in different
conditions with different solvent sand water,
using solvent properties as descriptors for KET
solubilization process, we aim at finding
characteristics that favor the process of
solubilization of this drug. Furthermore, the
study of thermodynamic parameters improves
the interpretation of the results of the
solubilization of KET.
EXPERIMENTAL
Solubility determinations
Pure solvents and/or binary water and organic
cosolvent mixtures were prepared in a closed
system which provides continuous and stirring
thermally conditioned using a stirrer SI Lab
Companion 300R. KET excess was added in a
glass tube with a lid of 10 mL capacity
containing the pure solvent or the prepared
mixtures. A sufficient amount of KET was added
to achieve system saturation. The same was
held for at least 72 hours, with continuous
agitation. The saturated system was then
analyzed by a UV-Vis spectrophotometer
extracting an aliquot of the system [7]. The
concentrations were determined by the
necessary dilutions to the wavelength of
maximum absorption of KET (λ= 254.4 nm; ε
=16853 L mol-1 cm-1) using methanol as solvent
during the dilution process. In order to ensure
the reproducibility and saturation of the
solutions, all dilutions and solubility
measurements were performed in triplicate and
experimental results reported were the average
of three measurements. Absorbance
measurements were performed with a
Shimadzu double beam UV 160 A with a fitted
thermostatic cell holder. Furthermore, a
thermodynamic study modifying the
temperature systems for water-organic solvent
mixtures (ethanol, ethylene glycol and
propylene glycol) was carried out at a working
temperature (291.15±0.3 - 307.15±0.3 K). The
solvents used were spectroscopic grade and
KET (CAS 22071-15-4;Molar mass 254.28 g mol-1
99.7%, analytical quality).
Data analysis
Data processing and fitting of all equations
were performed using the scientific program
Origin v 8.0. To fit equations, linear regression
was performed by minimum squares. Statistical
analysis was performed using IBM SPSS
Statistics 19 v program.
RESULTS AND DISCUSSION
Pure solvents
The analysis of the drug solubility at constant
temperature in pure solvents or mixtures of
cosolvents reveals chemical properties of both
solute and solvent. Due to the fact that
physicochemical properties of the solvents are
generally well known, we carried out this study
to analyze the interaction of the drug with its
environment through knowledge of the
solvents. To analyze the positive or negative
influence of solvents on the solubility of KET, an
analysis of multiple linear regression was used.
To this end the description of linear free energy
relationships (LSER) is proposed. The most
widely used of these is the Kamlet-Taft
expression [8, 9], in which XYZ is a property
linearly related to Gibbs energy:

Estela et al 442
J Pharm Chem Biol Sci , December 2015-February 2016; 3(4):440-453
stestocf energyenergyXYZXYZ º (1)
where, XYZo is a constant that depends only on
the solute; energycf is the energy of the
formation of cavity, term related to the solvent,
and the energysto-ste term includes all modes of
solute-solvent interaction.
Now we can write [10]:
bapmXYZXYZ H *2
º (2)
In the above expression the descriptors used
are. H is the Hildebrand's solubility parameter
of the solvent, that represents their self-
cohesiveness; the solvatochromic parameter
describes a combination of properties, the
polarity and the polarizability of the solvent.
The and quantities are solvatochromic
properties of the solvent, is the hydrogen
bond donation (HBD) ability and is the
hydrogen bond acceptance (HBA) ability or
electron pair donation ability to form a
coordinative bond.
These parameters are determined primarily by
the energies of the longer wavelength
absorption peaks of certain carefully selected
probe solutes in the solvents in question, after
subtraction of the effect that non-HBD and/or
non-HBA solvents would have on the probe,
determined in separate experiments [11]. They
have been designed and given numerical values
so that ideally they describe exclusively the HBD
and HBA properties of the solvents, unaffected
by their other properties, such as polarity,
polarizability or tightness of cohesion. For some
processes, any of the coefficients XYZ0, m, p, a
and/or b may be neglected, then the property
that they represent does not play an important
role in the solubilization process.
The solubility results obtained (Table 1) were
adjusted with the following expression:
855.0135.1
*505.3)1000/
2(133.3469.1log
HS(3)
1;961,0 r
as may be seen, the positive values of
coefficients and indicate that solubility
increases with the increase in the value of these
parameters. Therefore, both HBD and HBA
interactions of the solvent with the carbonyl
group of the solute have a positive effect on the
solubility of the solute. On the same lines, the
dipolar solute-solvent interaction results in an
increase in solubility but with a very significant
value showing the greatest positive effect on
the solubility of KET. It may be observed that
the magnitude of the coefficientsand is is
small compared with the value of which has
a significant weight in the solubility of KET.
Moreover, as can be observed, another
coefficient which has a great effect on the
solubility of KET is the Hildebrand's solubility.
This parameter represents the square root of
the cohesive energy density and it is an index of
polarity, i.e. the greater value of H is the most
polar compound. The negative sign indicates
that the solubility decreases as the cohesive
forces of the solvent increase. This means that
an increase in the solvent-solvent interaction
inducing self-cohesiveness has an adverse
effect on the solubility of the solute.
According to the data given in Table 1, at
300.15 K, KET showed very low solubility in
water (6.27.10-4 mol L-1) and ciclohexane
(4.16.10-3 mol L-1) solvents. As can be seen, the
Hildebrand solubility parameter of water has a
very significant value as compared to the terms
which contribute favorably to the increase in
solubility. Theand parameters, and
therefore the significant cohesive forces which
manifest themselves in the water, determine
the low solubility of KET in this solvent.
Ciclohexane does not contribute as a donor or
acceptor of hydrogen bridges, nor does it
influence the polarity/polarizability.

Estela et al 443
J Pharm Chem Biol Sci , December 2015-February 2016; 3(4):440-453
On the other hand, the NSAID analyzed has a
greater solubility in dimethyl sulfoxide (2.89
mol L-1) and dimethylformamide (2.73 mol L-1).
KET solubility in these two solvents results from
the predominant influence on the
polarity/polarizability of the solvent, having a
value slightly higher than that for which also
contributes to the high solubility of KET in these
two solvents.
Table 1: Experimental Solubility of KET and parameters related to solvents
: HBD ability; : HBA ability; : polarity/polarizability; dimensionless
2H/1000: Hildebrand parameter, Jcm-3; T=300.15 K
Table 2: Solubility and parameters for the cosolvent systems analyzed
Cosolvent A B C D r S S exp
Methanol 4.343 1.250 -6.711 1.882 0.998 2.203 1.706±0.026
Ethanol 4.308 -1.603 8.142 -10.48 0.999 2.032 1.849±0.028
i-Propanol 4.143 -2.158 8.720 -11.671 0.992 1.389 1.285±0.022
n-Propanol 4.185 -1.374 8.591 -10.813 0.997 1.531 1.390±0.025
Ethylene glycol 3.395 -0.838 -1.590 -0.189 0.999 0.248 0.256±0.005
Propylene glycol 3.732 -1.052 3.648 -5.862 0.998 0.539 0.499±0.011
Acetone 4.270 -0.683 5.143 -7.503 0.989 1.862 1.803±0.027
Acetonitrile 3.939 0.090 5.403 8.562 0.997 0.869 0.753±0.015
A, B, C, D: parameters; S: Solubility in pure organic solvents obtained from A: S=10(A-4) (mol L-1);
Sexp (experimental solubility; mol L-1); r=correlation coefficient. T=300.15 K.
When interpreting KET solubility data in the
monoalcohols tested, it may be observed that
the higher the amount of carbon atoms, the
lower the solubility. KET presents the largest
solubility in methanol (1.71 mol L-1) and in
ethanol (1.85 mol L-1), a value close to that
reported by Singhai et al. [12] to 298.15 K, while
the lowest is in octanol (0.38 mol L-1).
Solvent log S
2H/1000
Water -3.203 1.17 0.47 1.09 2.294 Methanol 0.232 0.98 0.66 0.60 0.880 Ethanol 0.267 0.86 0.75 0.54 0.707 i-Propanol 0.109 0.76 0.84 0.48 0.552 n-Propanol 0.143 0.84 0.9 0.52 0.602 i-Butanol -0.047 0.79 0.84 0.40 0.467 n-Butanol 0.052 0.84 0.84 0.47 0.533 Octanol -0.424 0.77 0.81 0.40 0.444 Ethylene glycol -0.591 0.90 0.52 0.92 1.084 Propylene glycol -0.302 1.21 0.51 0.62 0.912 Dimethylformamide 0.437 0.00 0.69 0.88 0.613 Dimethyl sulfoxide 0,461 0.00 0.76 1.00 0.707 Ciclohexane -2.381 0.00 0.00 0.00 0.281 Acetone 0.256 0.08 0.43 0.71 0.402 Acetonitrile -0.123 0.19 0.40 0.75 0.581

Estela et al 444
J Pharm Chem Biol Sci , December 2015-February 2016; 3(4):440-453
If we analyze the KET solubility in the
polyalcohols studied, it is lower compared to
then-alcohol with the same number of carbon
atom and this is due to an increase in the value
of the forces of cohesion of polyalcohols.
It can be seen that the solubility values
determined by us were some what higher than
those reported by other authors. For example,
we obtained for solubility of KET in water
6.2710-4mol L-1 to 300.15 K, while Gantiva et al.
[13] reported 4.295 10-4mol L-1 to 298.15 K. The
data provided by Epitalier et al. [14] to 303.15 K
(8.89.10-4mol L-1) is close to what is reported in
this study. According to the data available, the
value of solubility in this solvent presented by
Kommury et al [15] (5.58 10-3mol L-1) is
significantly higher than those reported by
other authors. In ethanol, the solubility of KET
reported in this work (1.85 mol L-1 to 300.15 K)
is close to what is reported by Jouyban et al.
[16] (1.8 M at 298.15 K), whereas the data
reported by Gantiva et al. [13] is substantially
lower (0.67 M at 298.15 K).
The solubility value of KET in cyclohexane
informed by Gantiva et al. [16] at 298.15 K was
5.50 10-4 mol L-1, far below the value reported in
our study (4.16 10-3mol L-1 to 300.15 K), which
was ratified in additional experiences.
Regarding the value of solubility of this NSAIDs
in propylene glycol, Gantiva et al. [17] reported
0.1832 mol L-1 at 298.15 K, much lower than the
value found by us (0.499 mol L-1 to 300.15K).
It is observed that the solubility values reported
by Gantiva et al. [13, 17] are lower than those
presented in this study. This enables us to claim
that the contact time and the technique used to
determine the solubility plays an important role
in the results. In our determinations, the
samples analyzed were left in contact for a
period of at least 5 days after the saturation
process, with continuous agitation of the entire
bulk solution. These times were extended even
more when KET was contacted with solvents of
high viscosity such as propylene glycol or
ethylene glycol and also in the case where
saturation conditions created a situation of high
viscosity in the solution.
Analysis in water-organic solvent mixtures
The solvent mixtures are widely used in
industry and laboratories as a single solvent to
satisfy multiple requirements: to increase the
solubility of poorly water soluble drugs, to
enhance the chemical and physical stability of a
drug, among others. In the preformulation of
pharmaceuticals, these mixtures are used
extensively for vehiculization.
The solubility (log S) is related to the standard
molar Gibbs energy of solvation. In an ideal
solvation, the standard Gibbs energy in a
mixture of cosolvents is given by the average of
molar fraction, and the solubility in a mixture
binary solvent, while log Swo is a linear function
of molar fraction. The deviation from linearity
expresses the existence of a non-ideal process
of solvation. For all the mixtures analyzed, the
data for log Swo (solubility in the cosolvent
mixture) can be fitted satisfactorily with a
polynomial cubic in Xw (mole fraction of water)
according to the following equation [18]:
32log WWWWO DXCXBXAS
(4)
In this equation, A represents the value of log S
in the pure organic solvent. The representation
of the equation (4) allows the classification of
the solubility profiles in two groups [19]:
solubility profiles having a maximum peak and
those which do not. For the former class of
profiles, the nonlinear variation of log Swo with
mole fraction might be attributed to the
preferential solvation of the solute through one
of the two components of the mixture [20].
The parameter used to observe the excess or
deficiency of one of the components of the
mixture in the local region of the solute is the
δw parameter calculated for water using the
following equation:

Estela et al 445
J Pharm Chem Biol Sci , December 2015-February 2016; 3(4): 440-453
(5)logloglogloglog OWOOWWWOW SSSXSXS
δw is useful to compare the performance of
different mixtures of cosolvents, and its
variation with Xw responds to a cubic
polynomial that can be expressed by:
3
3
2
21 WWWW XBXBXBIntercept
(6)
XL expresses the local mole fraction of water or
organic cosolvent in the surrounding of the
solute and it is related to the solubility [20] as
follows:
O
L
OW
L
WWO SXSXS logloglog
(7)
Considering that:
1 L
O
L
W XX (8), we obtain:
OWOWO
L
W SSSSX loglogloglog
(9)
Combining (5) and (7) gives the expression for
the δw parameter, which, according to [20, 21],
represents an excess or deficit of solvent in the
local region, as follows:
OW
L
WW XX (10)
When 0W , the solute is preferentially
solvated for water, otherwise it is solvated by
the organic solvent. If ,01,0W the
preferential solvation is negligible, but when
1L
WX , there is a complete solvation of solute
by water.
Some samples tested showed phase separation
and because of this in some proportions it was
not possible to determine solubility. This
situation occurred for acetonitrile-water
mixtures for XW values between 0.5 and 0.8 as
well as in mixtures of n-propanol for values
between 0.7 and 0.9 of XW. The literature does
not provide details regarding this situation,
neither similar observation were reported.
Because the scope of this research does not
cover the study of these events in particular, we
believe that it may be the subject of further
studies.
The graphical representation of log SWO versus
XW (eq.4) for KET is illustrated in Figure 2 for
binary mixtures of water with methanol,
ethanol, ethylene glycol, propylene glycol and
acetonitrile. Table 2 shows the A, B, C and D
parameters for all the cosolvent systems
analyzed. As can be observed, the solubility
values obtained from A (solubility in pure
organic solvent) agree with the experimental
values. In all the cosolvent mixtures analyzed,
the solubility profile did not shows a maximum.
From equations 4 and/or 9 the δW values were
calculated. The negative values obtained
indicate that there is a deficit of water around
the solute. In other words, the organic
cosolvent is preferred over the water in this
area. This can be attributed to the hydrogen
bond linking the water molecules that the
strongly hydrophobic solute cannot break, thus
reducing the amount of water molecules
participating in the solvation process.
Figure 3 shows the profile of variation of
negative values of wversus Xw at different
compositions of binary mixtures for KET in
methanol and acetonitrile as organic cosolvent.
For all the cosolvent-water mixtures used, the
curves pass through a maximum, which is about
0.5 for XW values. Table 3 shows the values of
coefficients obtained by representation of -w
versus Xw for different cosolvent systems.

Estela et al 446
J Pharm Chem Biol Sci , December 2015-February 2016; 3(4):440-453
Table 3: Coefficients obtained by representation of -w versus Xwfor cosolvent systems
Cosolvent Intercept B1 B2 B3 r
Methanol -0.012 1.349 1.876 0.526 0.977
Ethanol 0.011 0.587 2.097 -2.700 0.994
i-Propanol 0.011 0.614 2.411 -3.035 0.993
n-Propanol 0.108 0.978 1.096 -2.200 0.985
Ethylene glycol -0.005 0.677 -0.612 -0.073 0.976
Propylene glycol 0.010 0.679 1.109 -1.782 0.991
Acetone 0.006 0.770 1.469 -1.976 0.988
Acetonitrile 0.020 1.029 1.763 -2.796 0.987
r=correlation coefficient. T=300.15K.
In Figure 4 we illustrate the variation of XwL
versus Xw for ethanol and ethylene glycol
aqueous binary mixtures. Evidently, the
preferential salvation of the cosolvent is higher
in ethanol than in ethylene glycol, and this may
be attributed to the fact that the KET solution
acts primarily as a Lewis acid by forming
hydrogen bonds with the functional groups of
the solvent proton acceptor (oxygen -OH). In
addition, the KET compound can act as a proton
accept or through its carbonyl, hydroxyl and
ketone moieties [17].
Fig. 2: Plot of 4+log S as function of XWL in water-organic cosolvent mixtures
0,0 0,2 0,4 0,6 0,8 1,0 1,2
0,0
1,0
2,0
3,0
4,0
5,0
Acetonitrile
Ethilene glycol
Propylene glycol
Methanol
Ethanol
4+
log S
wo
Xw

Estela et al 447
J Pharm Chem Biol Sci , December 2015-February 2016; 3(4):440-453
0.0 0.2 0.4 0.6 0.8 1.0 1.2
0.0
0.2
0.4
0.6
Acetonitrile
Methanol
-w
XW
Fig. 3: Plot of -δW as a function of solvent composition (
0.0 0.2 0.4 0.6 0.8 1.0 1.2
0.0
0.2
0.4
0.6
0.8
1.0
1.2
Xw
XL
w
Ethanol
Ethylene glycol
Fig. 4: Graphic representation of calculated as function of
It is reasonable to consider that the water
surrounding the carboxyl group interacts with
the ketone group as well, as is the case with the
organic solvent. As seen in the solubility values,
all pure cosolvents facilitate the solubility of
KET. KET solubility in aqueous mixtures of
ethanol increases to a maximum value
corresponding to pure cosolvent. The same
situation has been described in studies by
Gantiva et al. [3, 17]. Alcohols which haves one
or two hydroxyl groups (in the case of
propylene glycol and ethylene glycol) may
donate or accept hydrogen bonds of the
carboxyl and ketone groups. Moreover, the
hydrocarbon portion of the alcohol can interact
with the aromatic portions of the drug via
dispersion forces more effectively than water.
As expressed above, the existence of
preferential solvation for these drugs is then
expected. Profiles such as those seen in Figure 4
shows solvation capabilities of the solvents
relative to water. These capabilities have been
found to be greater than those reported in
Estela et al 448
J Pharm Chem Biol Sci , December 2015-February 2016; 3(4):440-453
other studies on KET, in which only one solvent
was used.
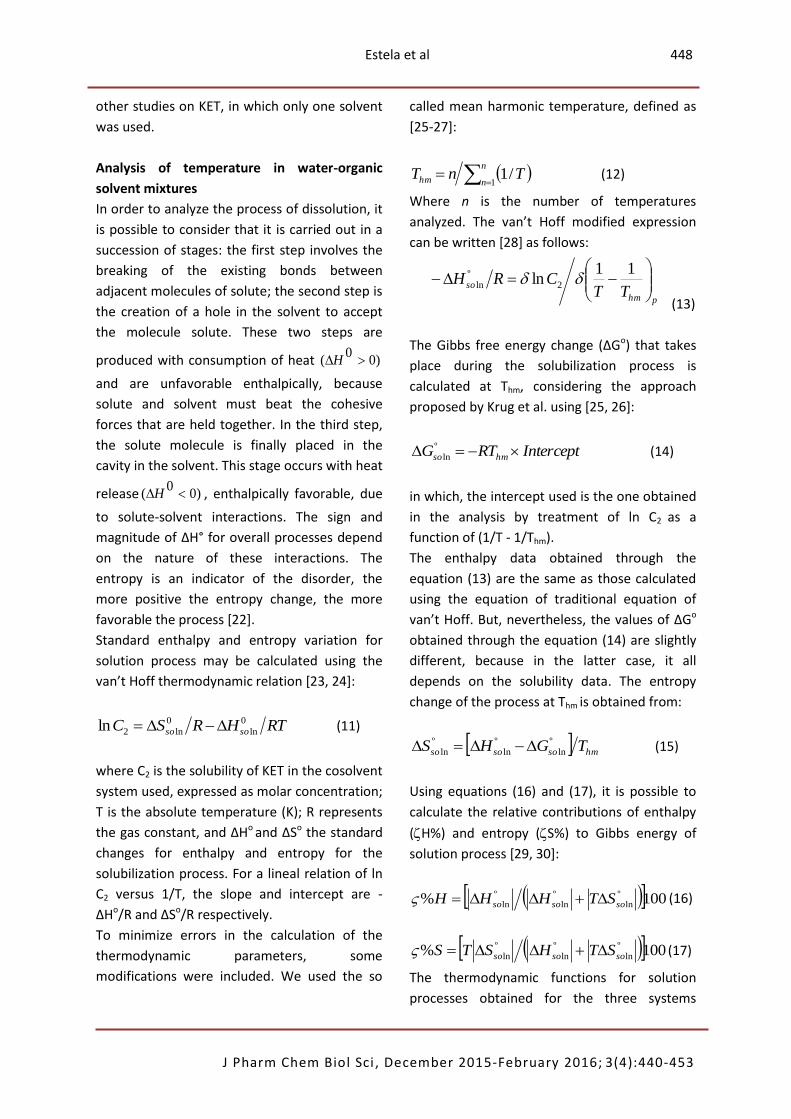
Analysis of temperature in water-organic
solvent mixtures
In order to analyze the process of dissolution, it
is possible to consider that it is carried out in a
succession of stages: the first step involves the
breaking of the existing bonds between
adjacent molecules of solute; the second step is
the creation of a hole in the solvent to accept
the molecule solute. These two steps are
produced with consumption of heat )00
( H
and are unfavorable enthalpically, because
solute and solvent must beat the cohesive
forces that are held together. In the third step,
the solute molecule is finally placed in the
cavity in the solvent. This stage occurs with heat
release )00
( H , enthalpically favorable, due
to solute-solvent interactions. The sign and
magnitude of ∆H° for overall processes depend
on the nature of these interactions. The
entropy is an indicator of the disorder, the
more positive the entropy change, the more
favorable the process [22].
Standard enthalpy and entropy variation for
solution process may be calculated using the
van’t Hoff thermodynamic relation [23, 24]:
RTHRSC soso
0
ln
0
ln2ln (11)
where C2 is the solubility of KET in the cosolvent
system used, expressed as molar concentration;
T is the absolute temperature (K); R represents
the gas constant, and ∆Ho and ∆So the standard
changes for enthalpy and entropy for the
solubilization process. For a lineal relation of ln
C2 versus 1/T, the slope and intercept are -
∆Ho/R and ∆So/R respectively.
To minimize errors in the calculation of the
thermodynamic parameters, some
modifications were included. We used the so
called mean harmonic temperature, defined as
[25-27]:
n
nhm TnT1
/1
(12)
Where n is the number of temperatures
analyzed. The van’t Hoff modified expression
can be written [28] as follows:
phm
soTT
CRH
11ln 2
º
ln
(13)
The Gibbs free energy change (∆Go) that takes
place during the solubilization process is
calculated at Thm, considering the approach
proposed by Krug et al. using [25, 26]:
InterceptRTG hmso º
ln (14)
in which, the intercept used is the one obtained
in the analysis by treatment of ln C2 as a
function of (1/T - 1/Thm).
The enthalpy data obtained through the
equation (13) are the same as those calculated
using the equation of traditional equation of
van’t Hoff. But, nevertheless, the values of ΔGo
obtained through the equation (14) are slightly
different, because in the latter case, it all
depends on the solubility data. The entropy
change of the process at Thm is obtained from:
hmsososo TGHS º
ln
º
ln
º
ln
(15)
Using equations (16) and (17), it is possible to
calculate the relative contributions of enthalpy
(H%) and entropy (S%) to Gibbs energy of
solution process [29, 30]:
100% º
ln
º
ln
º
ln sososo STHHH (16)
100% º
ln
º
ln
º
ln sososo STHSTS (17)
The thermodynamic functions for solution
processes obtained for the three systems
Estela et al 449
J Pharm Chem Biol Sci , December 2015-February 2016; 3(4):440-453
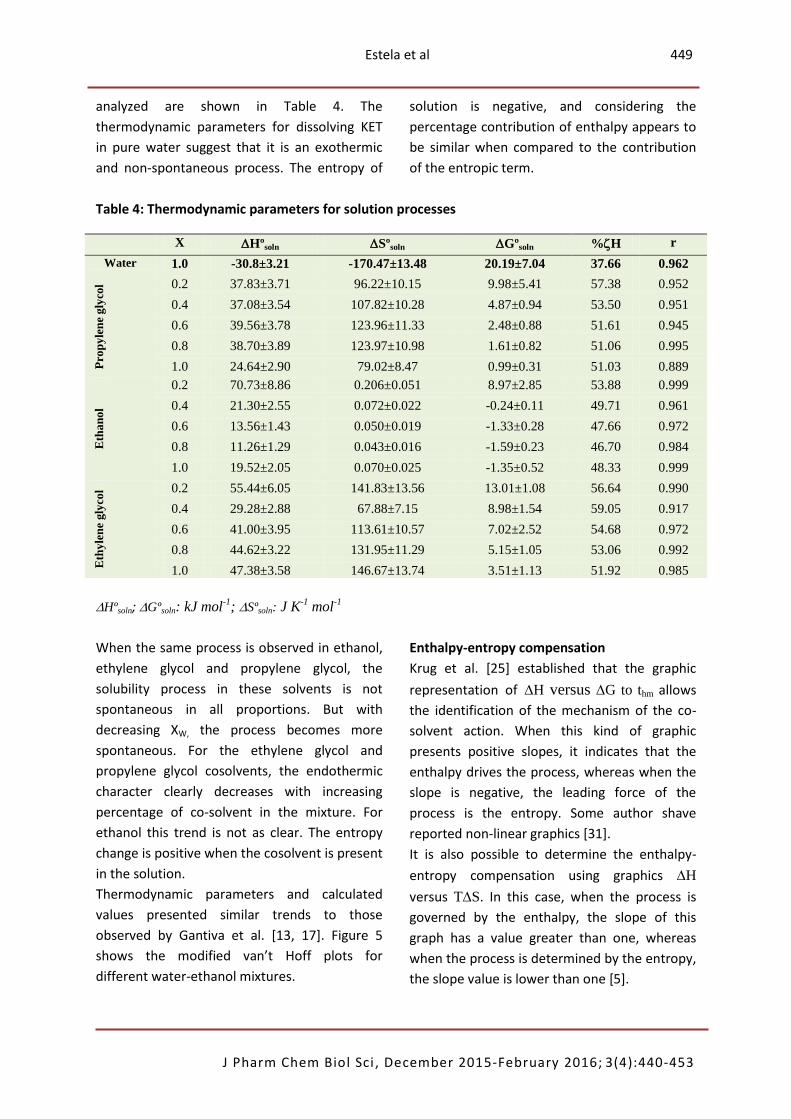
analyzed are shown in Table 4. The
thermodynamic parameters for dissolving KET
in pure water suggest that it is an exothermic
and non-spontaneous process. The entropy of
solution is negative, and considering the
percentage contribution of enthalpy appears to
be similar when compared to the contribution
of the entropic term.
Table 4: Thermodynamic parameters for solution processes
Hºsoln;Gºsoln: kJ mol-1
; Sºsoln: J K-1
mol-1
When the same process is observed in ethanol,
ethylene glycol and propylene glycol, the
solubility process in these solvents is not
spontaneous in all proportions. But with
decreasing XW, the process becomes more
spontaneous. For the ethylene glycol and
propylene glycol cosolvents, the endothermic
character clearly decreases with increasing
percentage of co-solvent in the mixture. For
ethanol this trend is not as clear. The entropy
change is positive when the cosolvent is present
in the solution.
Thermodynamic parameters and calculated
values presented similar trends to those
observed by Gantiva et al. [13, 17]. Figure 5
shows the modified van’t Hoff plots for
different water-ethanol mixtures.
Enthalpy-entropy compensation
Krug et al. [25] established that the graphic
representation of H versus G to thm allows
the identification of the mechanism of the co-
solvent action. When this kind of graphic
presents positive slopes, it indicates that the
enthalpy drives the process, whereas when the
slope is negative, the leading force of the
process is the entropy. Some author shave
reported non-linear graphics [31].
It is also possible to determine the enthalpy-
entropy compensation using graphics H
versus TS. In this case, when the process is
governed by the enthalpy, the slope of this
graph has a value greater than one, whereas
when the process is determined by the entropy,
the slope value is lower than one [5].
X Hºsoln Sºsoln Gºsoln %H r
Water 1.0 -30.8±3.21 -170.47±13.48 20.19±7.04 37.66 0.962
Pro
py
len
e g
lyco
l 0.2 37.83±3.71 96.22±10.15 9.98±5.41 57.38 0.952
0.4 37.08±3.54 107.82±10.28 4.87±0.94 53.50 0.951
0.6 39.56±3.78 123.96±11.33 2.48±0.88 51.61 0.945
0.8 38.70±3.89 123.97±10.98 1.61±0.82 51.06 0.995
1.0 24.64±2.90 79.02±8.47 0.99±0.31 51.03 0.889
Eth
an
ol
0.2 70.73±8.86 0.206±0.051 8.97±2.85 53.88 0.999
0.4 21.30±2.55 0.072±0.022 -0.24±0.11 49.71 0.961
0.6 13.56±1.43 0.050±0.019 -1.33±0.28 47.66 0.972
0.8 11.26±1.29 0.043±0.016 -1.59±0.23 46.70 0.984
1.0 19.52±2.05 0.070±0.025 -1.35±0.52 48.33 0.999
Eth
yle
ne
gly
col 0.2 55.44±6.05 141.83±13.56 13.01±1.08 56.64 0.990
0.4 29.28±2.88 67.88±7.15 8.98±1.54 59.05 0.917
0.6 41.00±3.95 113.61±10.57 7.02±2.52 54.68 0.972
0.8 44.62±3.22 131.95±11.29 5.15±1.05 53.06 0.992
1.0 47.38±3.58 146.67±13.74 3.51±1.13 51.92 0.985

Estela et al 450
J Pharm Chem Biol Sci , December 2015-February 2016; 3(4): 440-453
Fig. 5: Graphic representation of Van’t Hoff modified expression
From plotting H versus G (at thm) for aqueous
cosolvent mixtures, we obtained a straight line
for the water-ethanol (y=-0.431x + 6.141;
R2=0.944), water-ethylene glycol (y=-4.91x +
70.30; R2=0.983) and water-propylene glycol
(y=-3.52x + 43.08; R2=0.894) mixtures. The
slopes obtained showed a negative value
indicating that, in this case, the process is
dominated by entropy. Gantiva et al. obtained
non-linear graphs for KET in aqueous mixtures
of propylene glycol [17] and ethanol [13]. This
difference could be attributed to the use of
different experimental techniques for
determining solubility.
Confirming the results mentioned above, the
graph of enthalpy changes (H) versus the
product of entropy changes by mean harmonic
temperature (Thm, S) presented the following
settings for the three analyzed systems for
water-etanol y= 0.866x + 5.907, R2=0.947; for
water- ethylene glycol y=0.843x + 12.083, R2=
0.998 and for water- propylene glycol y=0.806x
+10.16, R2=0.986. As it can be observed, the
slope values slopes were lower than one, which
indicates that the process is driven by
organizational character (S). In Figure 6 we
show the graphs obtained lines obtained for
binary mixtures of ethylene glycol and
propylene glycol.
-60 -40 -20 0 20 40 60
-40
-20
0
20
40
60
80
Ethylenglycol
Propylenglycol
H
/ k
J m
ol-1
TS / kJ mol-1
Fig. 6: Enthalpy- entropy compensation
-1x10⁻⁴
-5x10⁻⁵ 0 5x10
-51x10
-4
-5
-3
-2
0.2
0.4
0.6
0.8
1.0
ln C
2
(1/T-1/Thm
)/K-1

Estela et al 451
J Pharm Chem Biol Sci , December 2015-February 2016; 3(4): 440-453
CONCLUSION
The results obtained in this work from solubility
determinations of KET are consistent with those
shown by other authors with the use of
spectroscopic parameters. Therefore, we may
conclude that the solubility data allows us to
obtain good results in relation to the
information on the interactions that occur in
the process of solvation.
KET is a relatively non-polar drug; in
consequence, it is more soluble in pure organic
solvents than in water and in water-organic
solvent mixtures. Their solubility depends on
the interaction polarity/polarizability, with a
positive effect, and on the cohesive forces of
solvents that occurs primarily through the
Hildebrand solubility parameter, with a
negative effect. Nevertheless, the solubility of
KET also depends on other factors that have a
minor influence on the process.
The analysis of the solubilization processes in
binary aqueous systems shows a non-ideal
behavior and a significant influence of solvent-
solvent interactions, determining the solubility.
The results show that for all ratios of aqueous
organic solvent mixtures, KET is preferentially
solvated by the organic cosolvent but not as
much as would have been suggested by the
differences in the solvation abilities of the net
solvent components. This is due to the
existence of an interaction between water and
the organic cosolvent. These solvents establish
two types of interactions with water: the
hydrophobic hydration, i.e. the accumulation of
water around apolar parts of cosolvent, and
furthermore, solvents having one or more
hydroxyl groups, which may form hydrogen
bonds with water, reinforcing its structure and
causing a decrease in solute- solvent
interactions.
In the analysis related to temperature, it can be
concluded that the process of dissolution in
water-cosolvent mixtures of ethanol, ethylene
glycol and propylene glycol, the enthalpy of
solution is positive. Therefore, the process is
always endothermic or unfavorable, i.e., solute-
solute and/or solvent-solvent interactions
predominate. They are entropically
unfavorable.
Considering the three systems, the energy of
formation of the cavity decreases as the solvent
polarity decreases, favoring these solute-
solvent interactions.
The analysis of the enthalpy-entropy
compensation suggests that the process of
solubilization of KET in aqueous mixtures of
ethanol, ethylene glycol and propylene glycol is
driven by the entropy.
It may be concluded that the data presented in
this study enhance existing information related
to the physicochemical behavior of KET in
different pure organic solvents and in their
aqueous mixtures. This information is very
useful for designing pharmaceutical of liquid
dosage forms.
ACKNOWLEDGMENT
Financial support from the National University
of San Luis (Argentine Republic) gratefully
acknowledged.
CONFLICT OF INTEREST STATEMENT
The authors declare that they have no
competing interests.
REFERENCES
1. Burke A Smyth E Fitzgerald G A. Analgesic-
antipyretic and antiinflamatory agents and
drugs employed in the treatment of gout. In
Brunton L, Lazo J, Parker K eds. The
Pharmacological Basis of Therapeutics,
México DF: McGraw-Hill; 2011.
2. Manual Fármacoterapéutico Argentina,
Vademecum de Especialidades Medicinales,
Buenos Aires, Argentina: Alfa Beta; 2014.
Estela et al 452
J Pharm Chem Biol Sci , December 2015-February 2016; 3(4):440-453
3. Gantiva M, Martínez F. Extended hildebrand
solubility approach in the estimation of
ketoprofen solubility in ethanol+water
cosolvent mixtures. Quim Nova 2010; 33:
370-376.
4. Samuel Yalkowsky. Solubility and
solubilization in aqueous media. New York:
Oxford University Press; 1999.
5. Delgado D R et al. Solubility of
sulfamethizole in some propylene
glycol+water mixtures at several
temperatures. Fluid Phase Equilib 2012; 322-
323: 113-119.
6. Ahumada E A et al. Solution thermo-
dynamics of acetaminophen in some PEG
400+water mixtures. Fluid Phase Equilib
2012; 332: 120-127.
7. Jouyban A et al. Solubility of Acetaminophen
and Ibuprofen in the Mixtures of
Polyethylene Glycol 200 or 400 with Ethanol
and Water and the Density of Solute-Free
Mixed Solvents at 298.2 K. J. Chem Eng Data
2010; 55: 5252–5257.
8. Carr P W. Solvatochromism, Linear Solvation
Energy Relationships, and Chromatography.
Microchem J 1993; 48: 4-28.
9. Mortimer Kamlet, Joseph Abboud, Robert
Taft. Progress in Physical Organic Chemistry.
New York: John Wiley & Sons, Inc.; 1981.
10. Kamlet M J et al. Linear solvation energy
relationships. A comprehensive collection of
the solvatochromic parameters, π*, α, and β,
and some methods for simplifying the
generalized solvatochromic equation. J Org
Chem 1983; 48: 2877-2887.
11. Marcus Y. The properties of organic liquids
that are relevant to their use as solvating
solvents. Chem Soc Rev 1993; 22: 409-416.
12. Singhai A K et al. Cosolvent solubilization
and formulation of an aqueous injection of
ketoprofen. Pharmazie 1996; 51: 737-740.
13. Gantiva M et al. Solution thermodynamics of
Ketoprofen in ethanol + water cosolvent
mixtures. J Chem Eng Data 2010; 55: 113-
118.
14. Espitalier F et al. Ternary diagram: alpha-(3-
benzoylphenyl)-propionic acid (ketoprofen)
in acetone-water mixtures at different
temperatures. Experimental data and
predicted results. Fluid Phase Equilib 1995;
113: 151-171.
15. Kommuru TR et al. Racemate and
enantiomers of ketoprofen: Phase diagram,
thermodynamic studies, skin permeability,
and use of chiral permeation enhancers J
Pharm Sci 1998; 87: 833-840.
16. Abolghasem Jouyban. Handbook of Solubility
data for Pharmaceuticals. Boca Raton, FL:
CRC Press, Taylor & Francis Group; 2010.
17. Gantiva M, Martínez F. Thermodynamic
analysis of the solubility of ketoprofen in
some propylene glycol + water cosolvent
mixtures. Fluid Phase Equilib 2010; 293: 242-
250.
18. Maitra A, Bagchi S. Study of solute-solvent
and solvent-solvent interactions in pure and
mixed binary solvents. J Mol Liq 2008; 137:
131-137.
19. Marcus Y. Solubility and solvation in mixed
solvent systems. Pure & Appl Chem 1990;
62: 2069-2076.
20. Ben-Naim A. Preferential solvation in two-
component systems. J Phys Chem 1989; 93:
3809-3813.
21. Marcus Y. Preferential solvation of ibuprofen
and naproxen in aqueous 1,2-propanediol.
Acta Chim Slov 2009; 56: 40-44.
22. Alfred Martin. Physical Pharmacy and
Pharmaceutical Sciences. Baltimore, USA:
Lippincott Williams & Wilkins; 2011.
23. Filippa M A, Gasull E I. Ibuprofen solubility in
pure organic solvents and aqueous mixtures
of cosolvents: Interactions and
thermodynamic parameters relating to the
solvation process. Fluid Phase Equilib 2013;
354: 185-190.
24. Filippa M A, Gasull E I. Experimental deter-
mination of Naproxen solubility in organic
solvents and aqueous binary mixtures:
Interactions and thermodynamic parameters

Estela et al 453
J Pharm Chem Biol Sci , December 2015-February 2016; 3(4):440-453
relating to the solvation process. J Mol Liq
2014; 198: 78-83.
25. Krug R R et al. Enthalpy-entropy compen-
sation. 1. Some fundamental statistical
problems associated with the analysis of
van't Hoff and Arrhenius data. J Phys Chem
1976; 80: 2335-2341.
26. Krug R R et al. Enthalpy-entropy compen-
sation. 2. Separation of the chemical from
the statistical effect. J Phys Chem 1976; 80:
2341-2351.
27. Bustamante P. Enthalpy-entropy
compensation for the solubility of drugs in
solvent mixtures: Paracetamol, acetanilide,
and nalidixic acid in dioxane-water. J Pharm
Sci 1998; 87: 1590-1596.
28. Pacheco D P et al. Thermodynamic study of
the solubility of ibuprofen and naproxen in
some ethanol + propylene glycol mixtures.
Fluid Phase Equilib 2007; 262: 23-31.
29. Perlovich G L et al. Solvation and hydration
characteristics of ibuprofen and
acetylsalicylic acid. AAPS J 2004; 6: 22-30.
30. Perlovich G L et al. Thermodynamics of
solutions III: Comparison of the solvation of
(+)-naproxen with other NSAIDs. Eur J Pharm
Biopharm 2004; 57: 411-420.
31. Martínez F et al. Thermodynamic analysis
and enthalpy-entropy compensation for the
solubility of indomethacin in aqueous and
non-aqueous mixtures. Fluid Phase Equilib
2011; 308: 98-106.
Cite this article as: Mauricio A. Filippa, Gisela M. Melo and Estela I. Gasull. Ketoprofen Solubility in Organic
Solvents and Aqueous Co-solvent Systems: Interactions and Thermodynamic Parameters of
Solvation. J Pharm Chem Biol Sci 2015; 3(4):440-453.