Embed Size (px)
Citation preview
1
Wind Direction, Intensity, andDominant Wave Period Analysis
Keweenaw North Waterway BuoyBob Shuchman: [email protected] Brooks: [email protected] Jessee: [email protected]
www.michigantechlakesuperior.orgwww.mtri.org
2
Analysis of Wind Direction and Speed
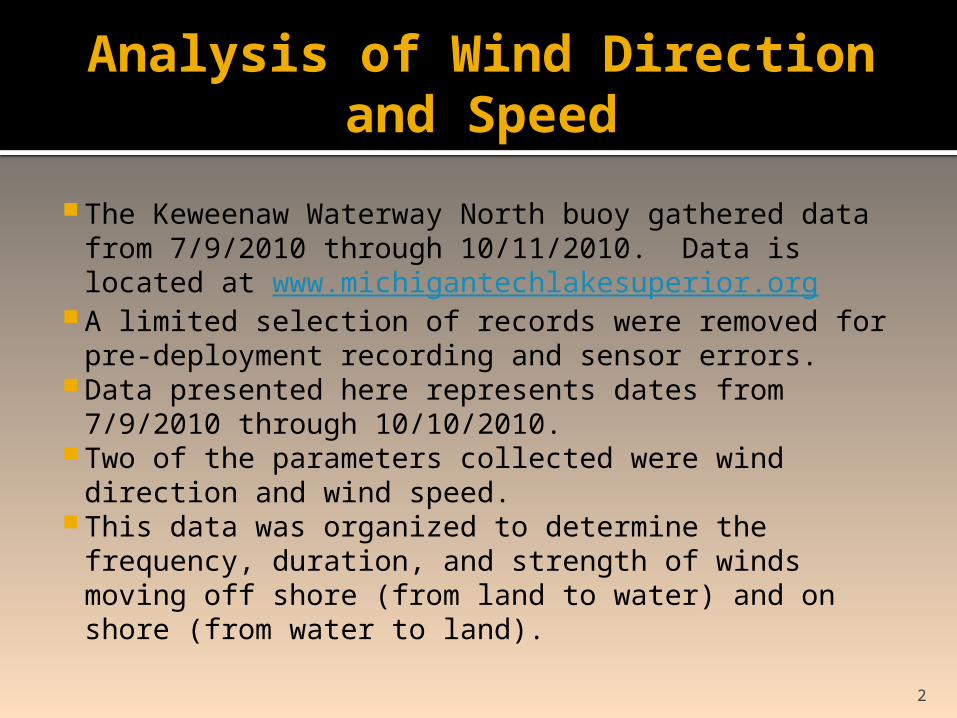
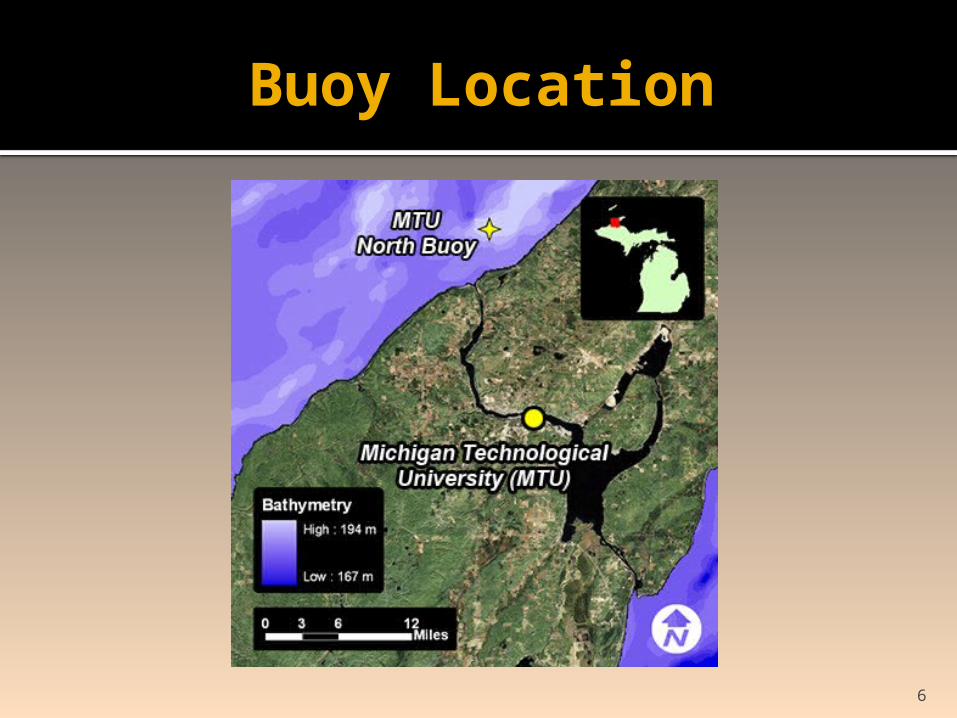
The Keweenaw Waterway North buoy gathered data from 7/9/2010 through 10/11/2010. Data is located at www.michigantechlakesuperior.org
A limited selection of records were removed for pre-deployment recording and sensor errors.
Data presented here represents dates from 7/9/2010 through 10/10/2010.
Two of the parameters collected were wind direction and wind speed.
This data was organized to determine the frequency, duration, and strength of winds moving off shore (from land to water) and on shore (from water to land).
3
General Wind Speed Analysis
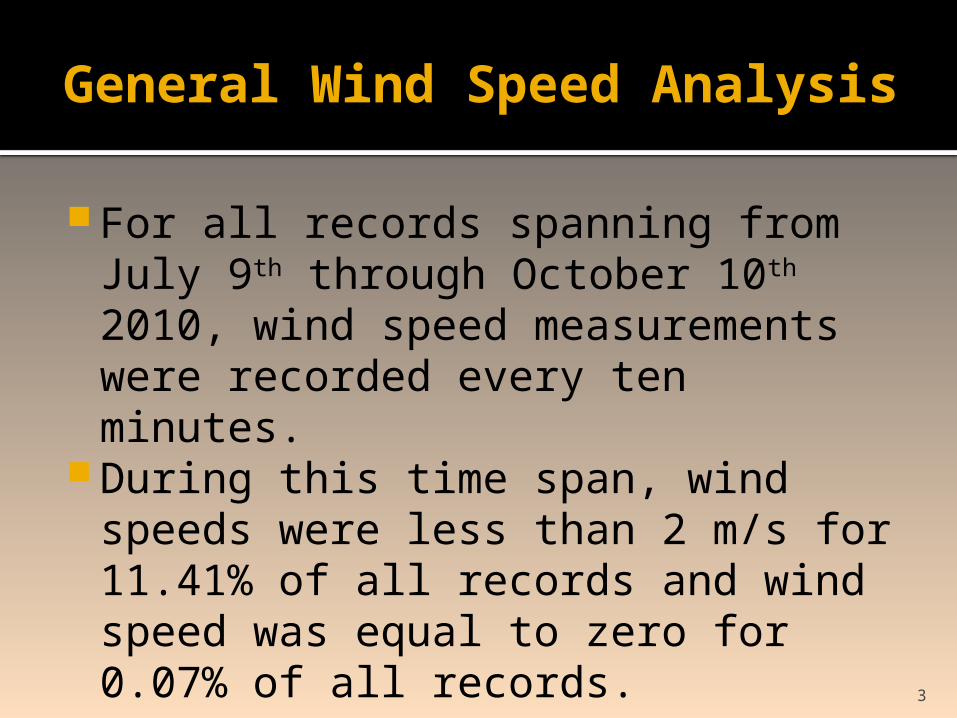
For all records spanning from July 9th through October 10th 2010, wind speed measurements were recorded every ten minutes.
During this time span, wind speeds were less than 2 m/s for 11.41% of all records and wind speed was equal to zero for 0.07% of all records.
4
Analysis of Wind Direction and Speed
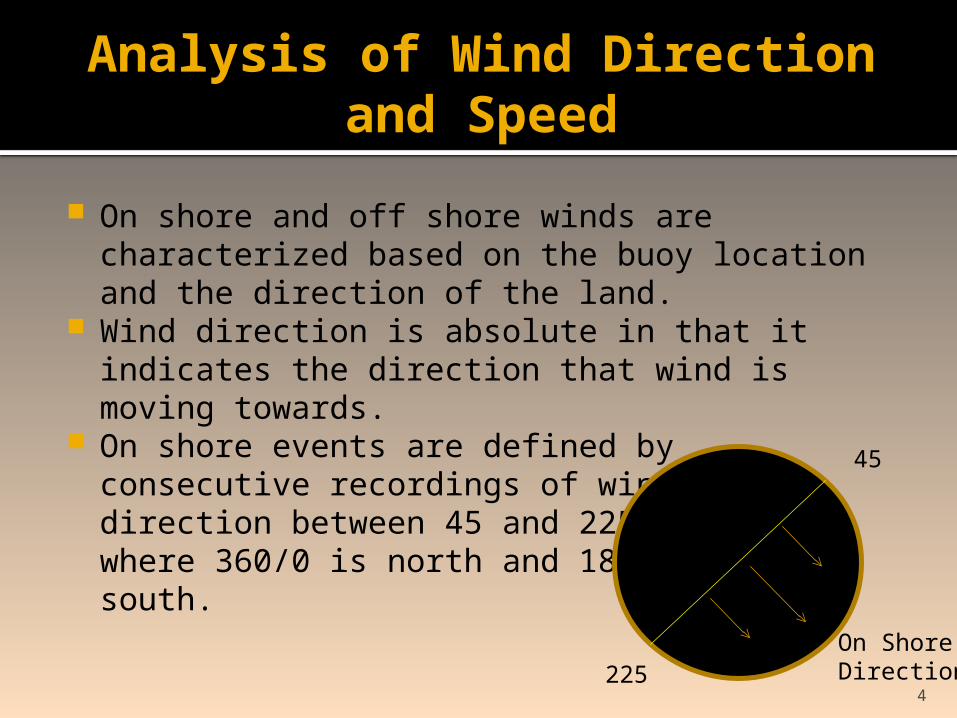
On shore and off shore winds are characterized based on the buoy location and the direction of the land.
Wind direction is absolute in that it indicates the direction that wind is moving towards.
On shore events are defined by consecutive recordings of winds with a direction between 45 and 225 degrees where 360/0 is north and 180 degrees as south.
45
225On ShoreDirection

5
Analysis of Wind Direction and Speed
Off shore events are consecutive recordings with a direction greater than 225 and less than 45 degrees where 360/0 is north and 180 degrees is south. 45
225
Off ShoreDirection
6
Buoy Location

7
Off Shore and On Shore Wind Direction Frequency
Off Shore On Shore0
1000
2000
3000
4000
5000
6000
7000
8000
9000
8005
5448
Histogram: Count of wind direction frequency
Frequency
Fre
quency
40.5%
59.5%
The frequency of wind direction recordings described as either off shore or on shore,a total of 13453 records were taken from July 9th to October 10th.
Count
of
Reco
rdin
gs
8
Off Shore Wind Event* Duration Statistics
Hours
Minimum Maximum Average Median Standard Deviation0
10
20
30
40
50
60
70
80
90
0.17
77.5
2.680.33
8.35
Value (Hours)
Value (Hours)
Min5.31m/s
Ave.8.07m/s
WindSpeedsFor thisevent
Max10.83m/s
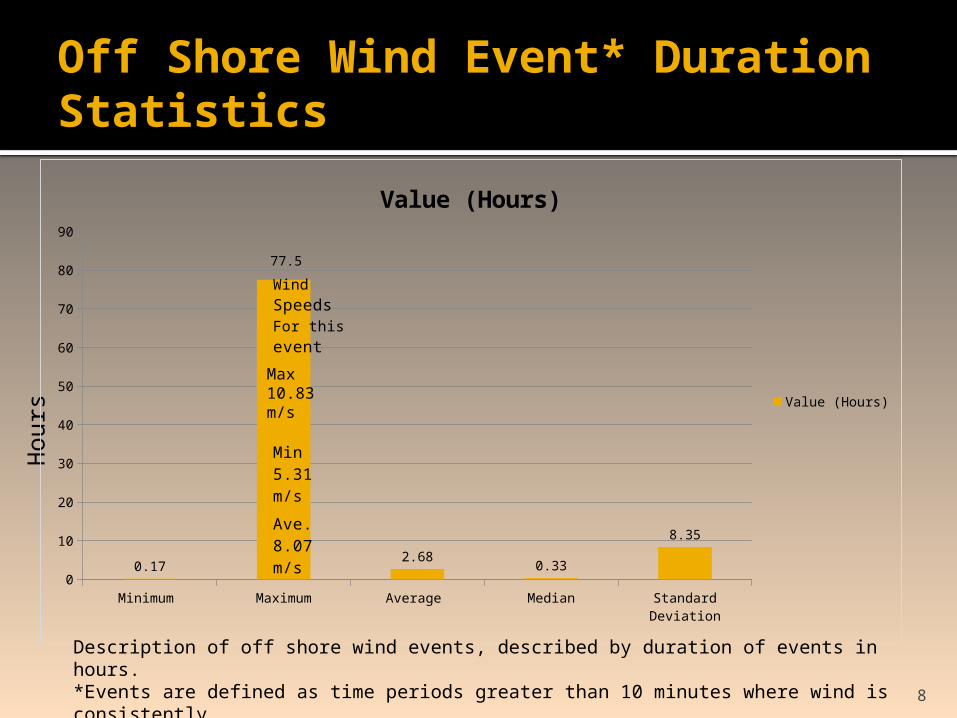
Description of off shore wind events, described by duration of events in hours.*Events are defined as time periods greater than 10 minutes where wind is consistently moving in the on or off shore direction.

9
Off Shore Wind Speed Statistics
Minimum Maximum Average Median Standard Deviation0.00
2.00
4.00
6.00
8.00
10.00
12.00
14.00
16.00
0.00
15.07
3.473.05
2.40
Wind Speed Values (m/s)
Values (m/s)
Win
d S
peed
, m
/s
Summary of all off shore wind speeds for all off shore events.
10
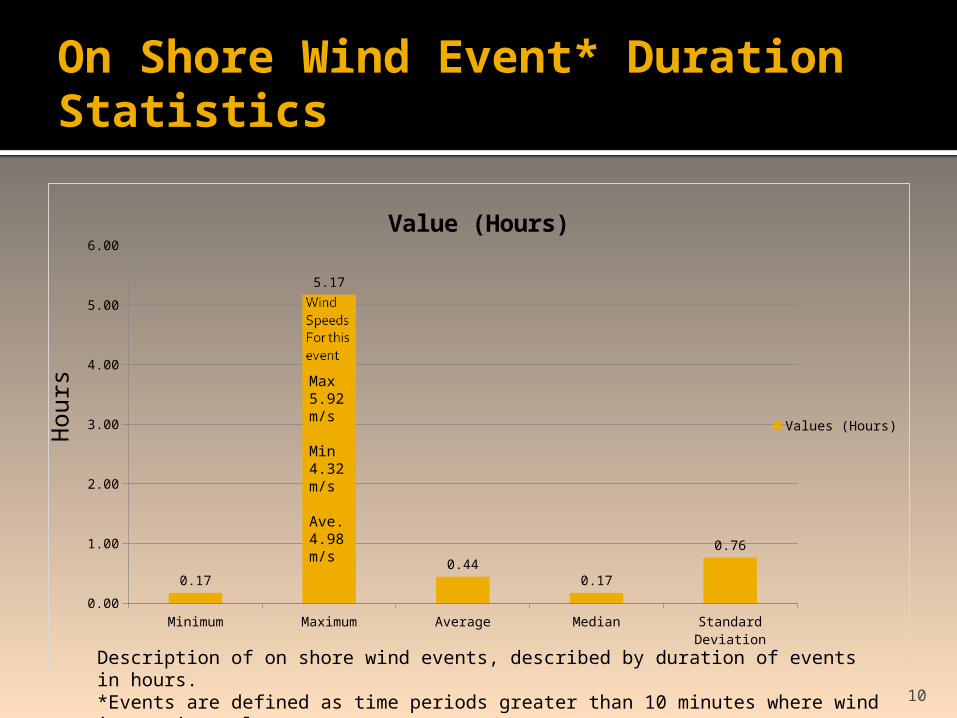
On Shore Wind Event* Duration Statistics
Minimum Maximum Average Median Standard Deviation0.00
1.00
2.00
3.00
4.00
5.00
6.00
0.17
5.17
0.440.17
0.76
Value (Hours)
Values (Hours)Hours Max
5.92m/s
Min4.32m/s
Ave.4.98m/s
Description of on shore wind events, described by duration of events in hours.*Events are defined as time periods greater than 10 minutes where wind is consistently moving in the on or off shore direction.
11
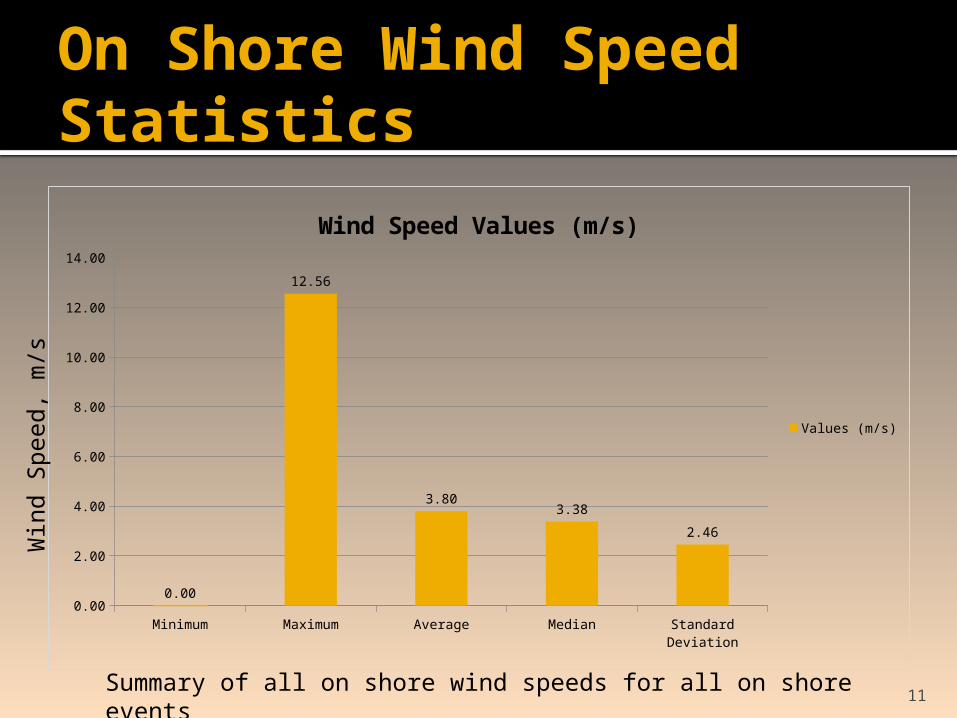
On Shore Wind Speed Statistics
Minimum Maximum Average Median Standard Deviation0.00
2.00
4.00
6.00
8.00
10.00
12.00
14.00
0.00
12.56
3.803.38
2.46
Wind Speed Values (m/s)
Values (m/s)
Win
d S
peed
, m
/s
Summary of all on shore wind speeds for all on shore events

12
Off Shore and On Shore Event Duration Comparison
Event Duration Statistics
Hours
Minimum Maximum Average Median Standard Deviation0
10
20
30
40
50
60
70
80
90
0.17
77.5
2.690.33
9.17
0.17
5.17
0.44 0.17 0.76
Off Shore Values (Hours)On Shore Values (Hours)
13
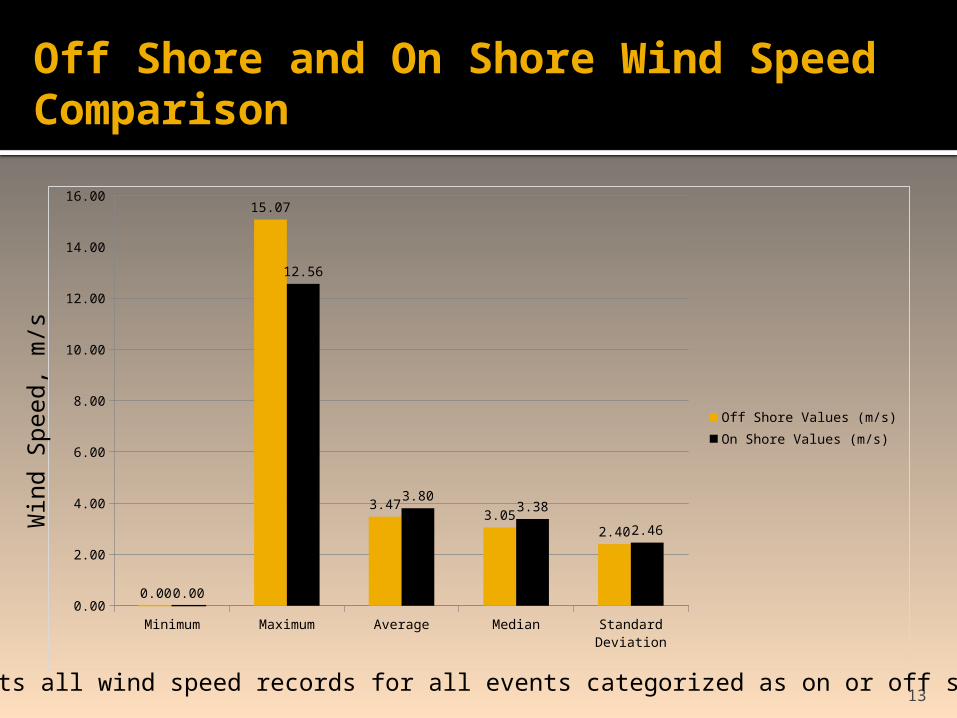
Off Shore and On Shore Wind Speed Comparison
Minimum Maximum Average Median Standard Deviation0.00
2.00
4.00
6.00
8.00
10.00
12.00
14.00
16.00
0.00
15.07
3.473.05
2.40
0.00
12.56
3.803.38
2.46
Off Shore Values (m/s)On Shore Values (m/s)
Win
d S
peed
, m
/s
Represents all wind speed records for all events categorized as on or off shore
14
Major Off Shore Wind Event
Started on September 11th at 7:30 p.m. and lasted through September 15th at 1:00 a.m. Lasting a total of 77 hours, 30 minutes.
The event had the following characteristics:
Average wind speed: 8.07 m/s Minimum wind speed: 5.31 m/s Maximum wind speed 10.83 m/s The following slide represents the
temporal distribution of wind speed.

15
Major Off Shore Event, Wind Speed Graph
9/11/10 19:30 9/12/10 6:40 9/12/10 18:10 9/13/10 5:30 9/13/10 16:50 9/14/10 4:10 9/14/10 15:300
2
4
6
8
10
12
Wind Speed (m/s)
Wind Speed (m/s)
Win
d S
peed
, m
/s

16
Major Wind Event Airport and Buoy Data Comparison
9/11/2010 19:309/12/2010 12:50 9/13/2010 6:30 9/14/2010 0:00 9/14/2010 17:300
50
100
150
200
250
300
350
0
50
100
150
200
250
300
350
400
Wind Direction Degrees (Buoy)Wind Direction Degrees (Airport)
*Wind Directions indicate the actual direction that wind is moving
*
Win
d D
irect
ion
17
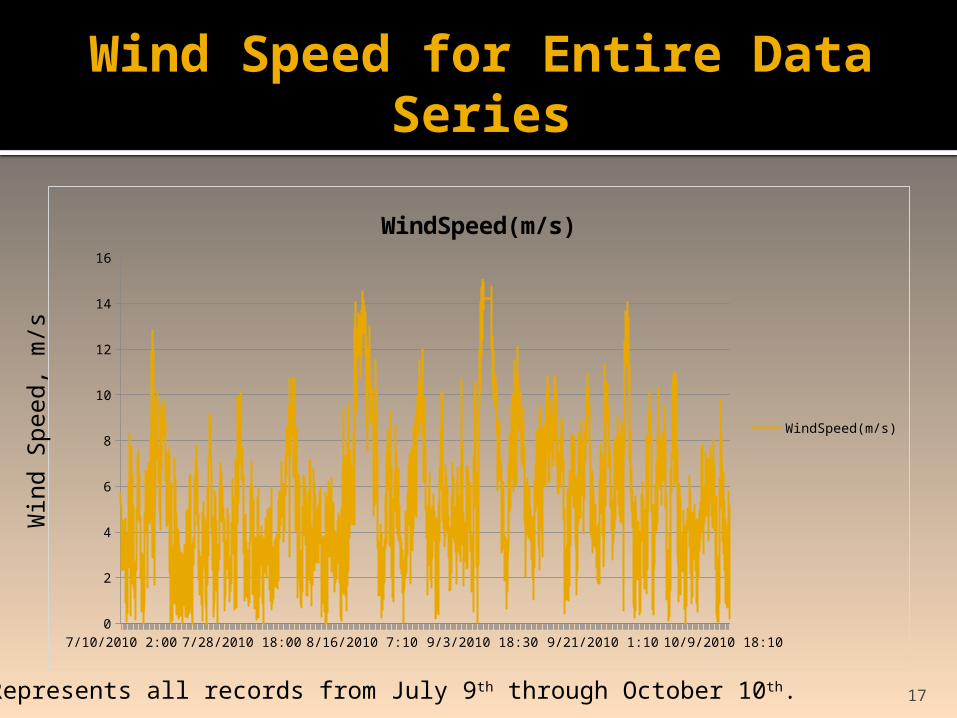
Wind Speed for Entire Data Series
7/10/2010 2:00 7/26/2010 5:40 8/11/2010 9:408/27/2010 10:309/11/2010 6:209/27/2010 12:500
2
4
6
8
10
12
14
16
WindSpeed(m/s)
WindSpeed(m/s)
Win
d S
peed
, m
/s
Represents all records from July 9th through October 10th.

18
Major Off Shore Wind Event Within Entire Time Line
7/9/2010 14:507/21/2010 18:308/2/2010 22:10 8/15/2010 1:50 8/27/2010 3:50 9/7/2010 1:00 9/19/2010 1:40 10/1/2010 9:300
2
4
6
8
10
12
14
16
Wind Speed (m/s)Major offshore wind event
Win
d S
peed
, m
/s
Represents all records from July 9th through October 10th and highlights the major off shore event

19
Dominant Wave Period Analysis High Frequency (HF) Radar is sensitive to
dominant wave period length. Wave periods of small length, less than 2
seconds for example, may be unnoticed by HF Radar.
An analysis was performed to determine how frequently the dominant wave period dropped below a specific value. Each event was also characterized by the length of time the wave period value was below the threshold.
20
General Dominant Wave Period Analysis
For all records spanning from July 9th to October 10th, dominant wave period measurements were recorded every ten minutes.
The dominant wave period had a value of zero second for 0.01% of all records.
Also, dominant wave period value was less than 2 seconds for 15.98% of all records and greater than 5 seconds for 16.03% of all records between July 9th and October 10th.
21
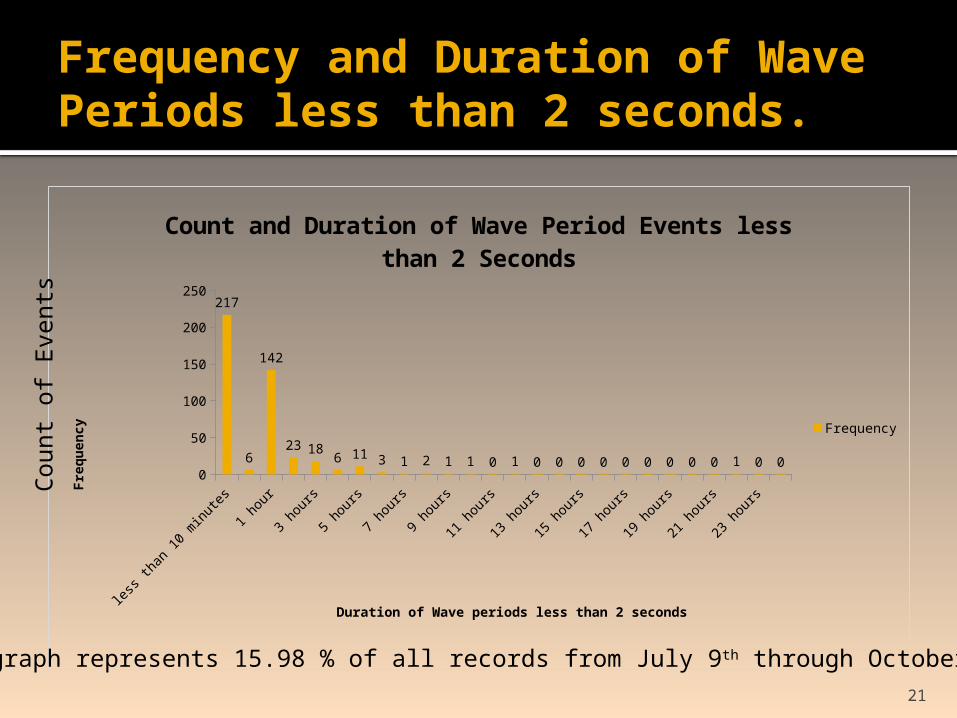
Frequency and Duration of Wave Periods less than 2 seconds.
less
than
10
min
utes
10 m
inut
es
1 ho
ur
2 ho
urs
3 ho
urs
4 ho
urs
5 ho
urs
6 ho
urs
7 ho
urs
8 ho
urs
9 ho
urs
10 h
ours
11 h
ours
12 h
ours
13 h
ours
14 h
ours
15 h
ours
16 h
ours
17 h
ours
18 h
ours
19 h
ours
20 h
ours
21 h
ours
22 h
ours
23 h
ours
1 da
y0
50
100
150
200
250217
6
142
23 186 11 3 1 2 1 1 0 1 0 0 0 0 0 0 0 0 0 1 0 0
Count and Duration of Wave Period Events less than 2 Seconds
Frequency
Duration of Wave periods less than 2 seconds
Fre
quency
This graph represents 15.98 % of all records from July 9th through October 10th.
Count
of
Events
22
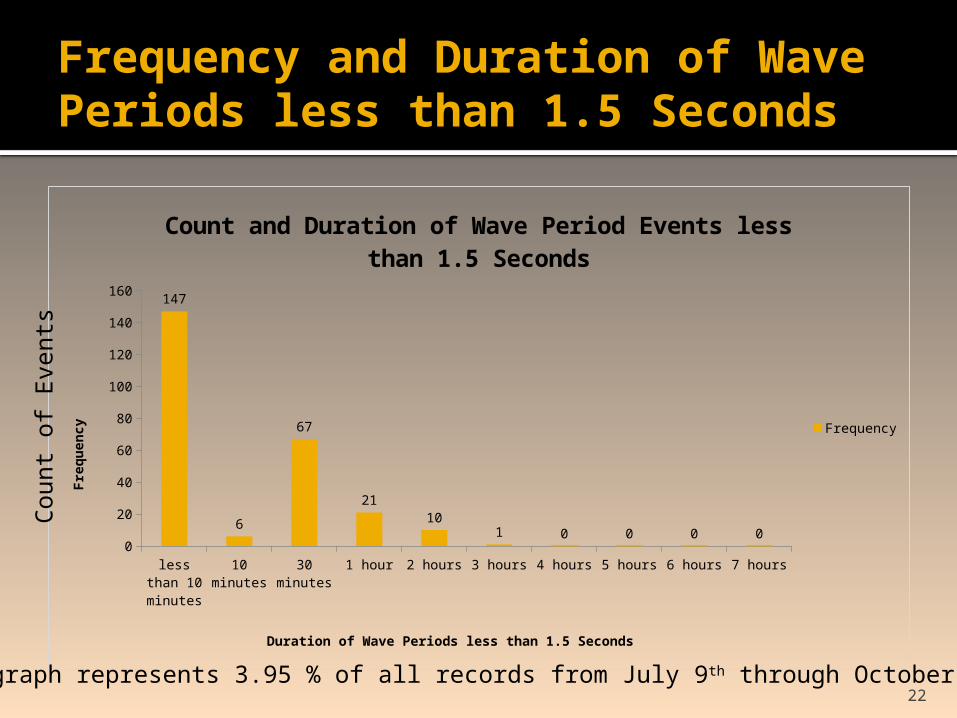
Frequency and Duration of Wave Periods less than 1.5 Seconds
less
than
10
min
utes
10 m
inut
es
30 m
inut
es
1 ho
ur
2 ho
urs
3 ho
urs
4 ho
urs
5 ho
urs
6 ho
urs
7 ho
urs
0
20
40
60
80
100
120
140
160 147
6
67
2110
1 0 0 0 0
Count and Duration of Wave Period Events less than 1.5 Seconds
Frequency
Duration of Wave Periods less than 1.5 Seconds
Fre
quency
This graph represents 3.95 % of all records from July 9th through October 10th.
Count
of
Events
23
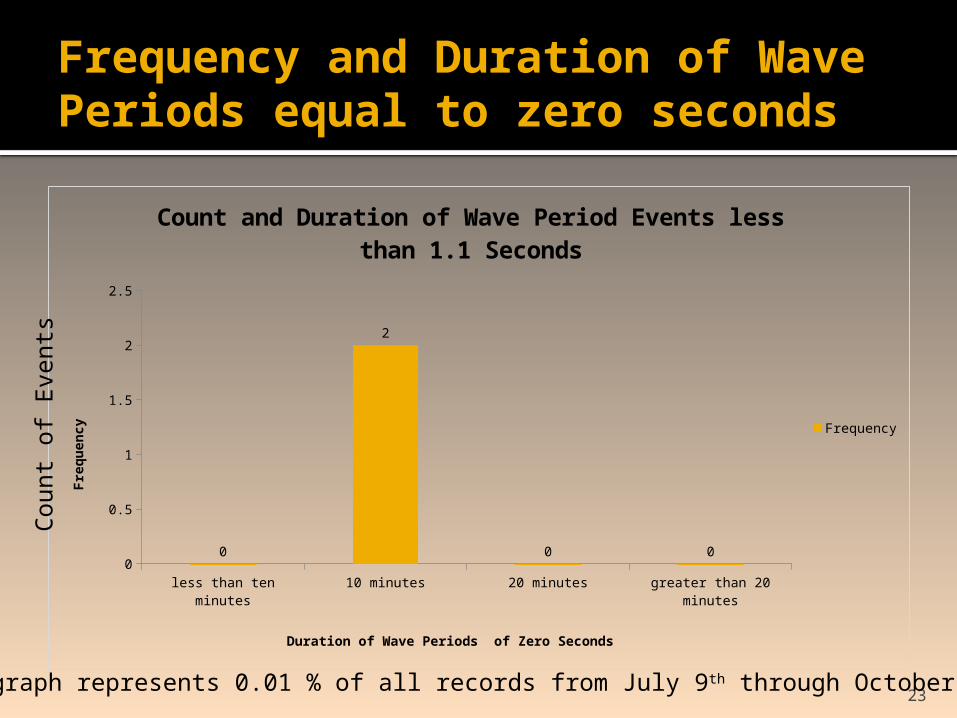
Frequency and Duration of Wave Periods equal to zero seconds
less than ten minutes 10 minutes 20 minutes greater than 20 minutes0
0.5
1
1.5
2
2.5
0
2
0 0
Count and Duration of Wave Period Events less than 1.1 Seconds
Frequency
Duration of Wave Periods of Zero Seconds
Fre
quency
This graph represents 0.01 % of all records from July 9th through October 10th.
Count
of
Events