Embed Size (px)
Citation preview
Karen MarzlinDNP, RN, CCNS, CCRN-CMC, CHFN www.cardionursing.com 1
1
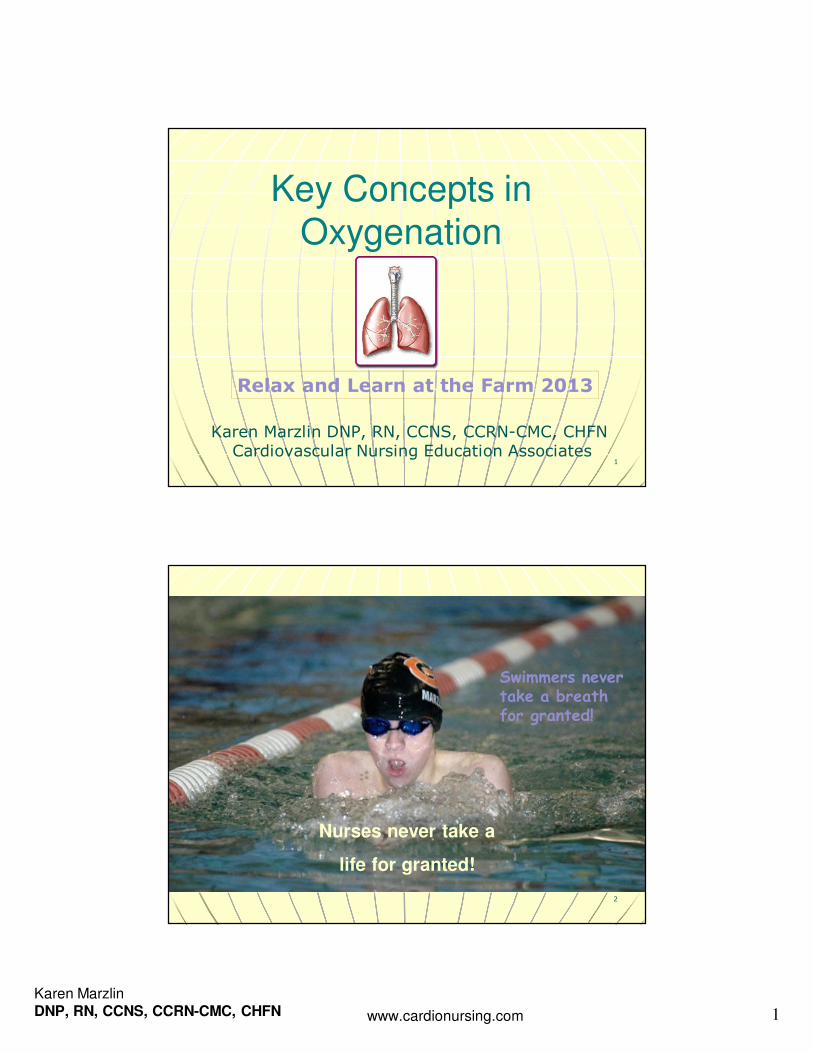
Key Concepts in Oxygenation
Karen Marzlin DNP, RN, CCNS, CCRN-CMC, CHFN Cardiovascular Nursing Education Associates
Relax and Learn at the Farm 2013
2
Swimmers never take a breath for granted!
Nurses never take a
life for granted!
Karen MarzlinDNP, RN, CCNS, CCRN-CMC, CHFN www.cardionursing.com 2
3
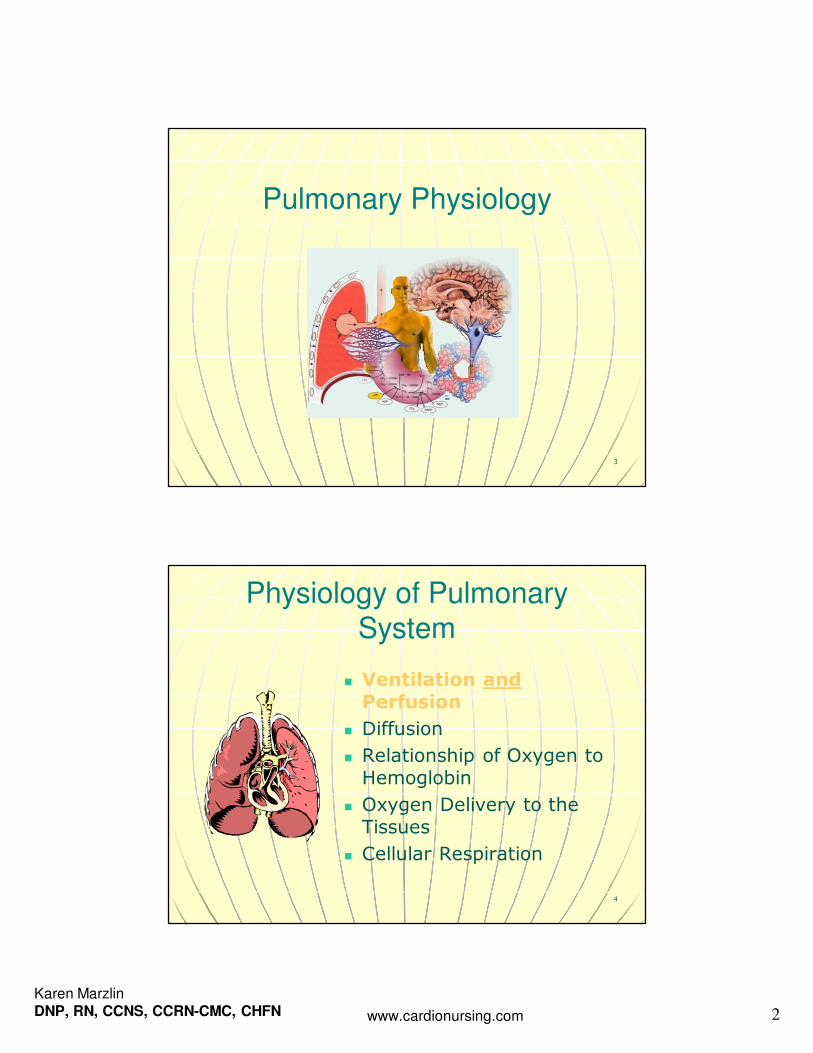
Pulmonary Physiology
4
Physiology of Pulmonary System
� Ventilation and Perfusion
� Diffusion
� Relationship of Oxygen to Hemoglobin
� Oxygen Delivery to the Tissues
� Cellular Respiration
Karen MarzlinDNP, RN, CCNS, CCRN-CMC, CHFN www.cardionursing.com 3
5
Ventilation
6
Ventilation
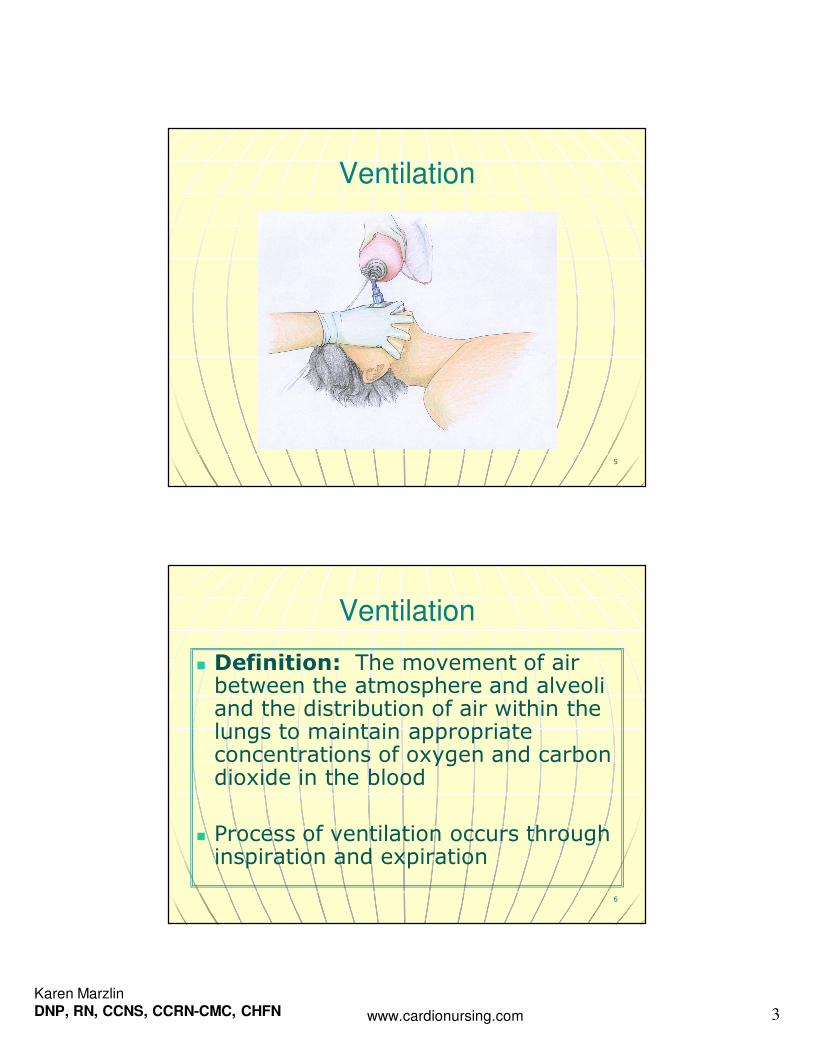
� Definition: The movement of air between the atmosphere and alveoli and the distribution of air within the lungs to maintain appropriate concentrations of oxygen and carbon dioxide in the blood
� Process of ventilation occurs through inspiration and expiration
Karen MarzlinDNP, RN, CCNS, CCRN-CMC, CHFN www.cardionursing.com 4
7
Ventilation
� Pressure difference between airway opening and alveoli • Contraction of inspiratory muscles
• Lowers intrathoracic pressure
• Creates a distending pressure
• Alveoli expand
• Alveolar pressure is lowered
• Inspiration occurs
• Result: Negative pressure breathing
8
Ventilation
� Minute ventilation (VE) = Total
volume of air expired in one minute
•Respiratory rate x tidal volume (VT) (tidal volume = amount of air per breath)
• Normal minute ventilation = 12 x 500 ml = 6000ml
• Note: (hypoventilation can occur with
normal or even high respiratory rate)
Karen MarzlinDNP, RN, CCNS, CCRN-CMC, CHFN www.cardionursing.com 5
9
Alveolar Ventilation (VA)
� VA = VT – anatomical dead space
� VA= Approximately 350 ml per breath • This is the ventilation that participates in gas exchange
Anatomical dead space:Walls are too thick for diffusion Mixed venous blood not present
Approximately 1 ml per ideal pound of body weight (150 ml)
10
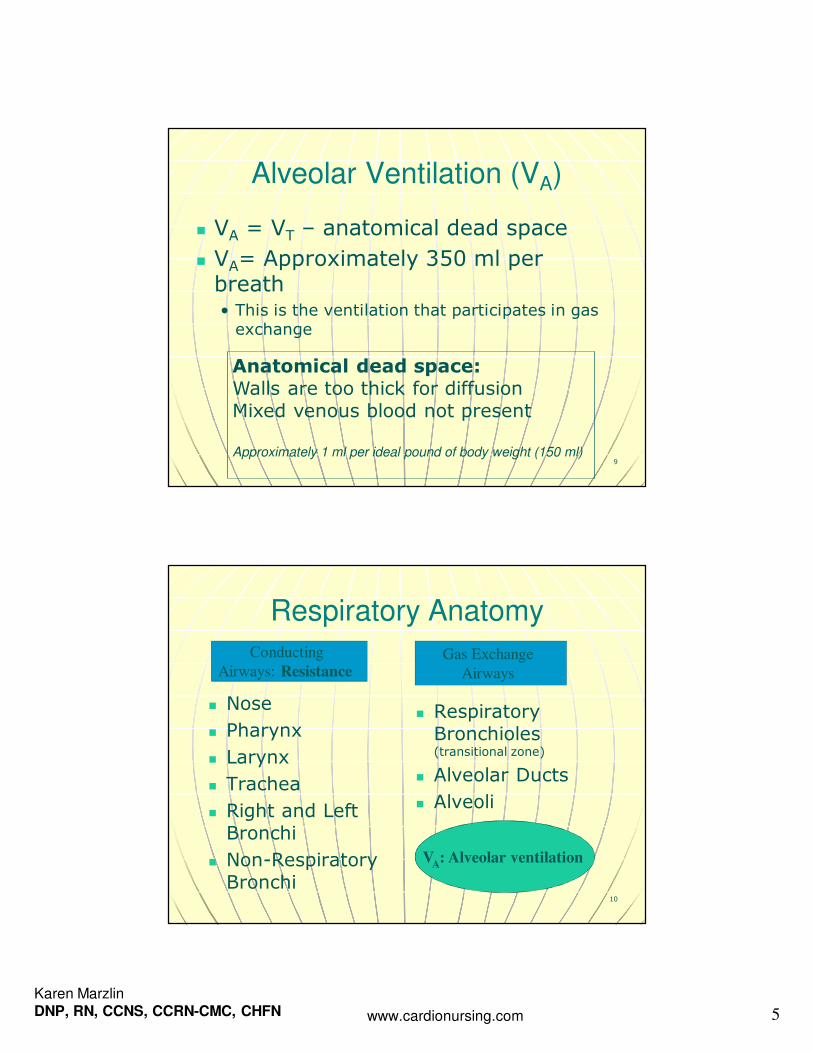
Respiratory Anatomy
� Nose
� Pharynx
� Larynx
� Trachea
� Right and Left Bronchi
� Non-Respiratory Bronchi
� Respiratory Bronchioles (transitional zone)
� Alveolar Ducts
� Alveoli
Conducting
Airways: Resistance Gas Exchange
Airways
VA: Alveolar ventilation
Karen MarzlinDNP, RN, CCNS, CCRN-CMC, CHFN www.cardionursing.com 6
11
12
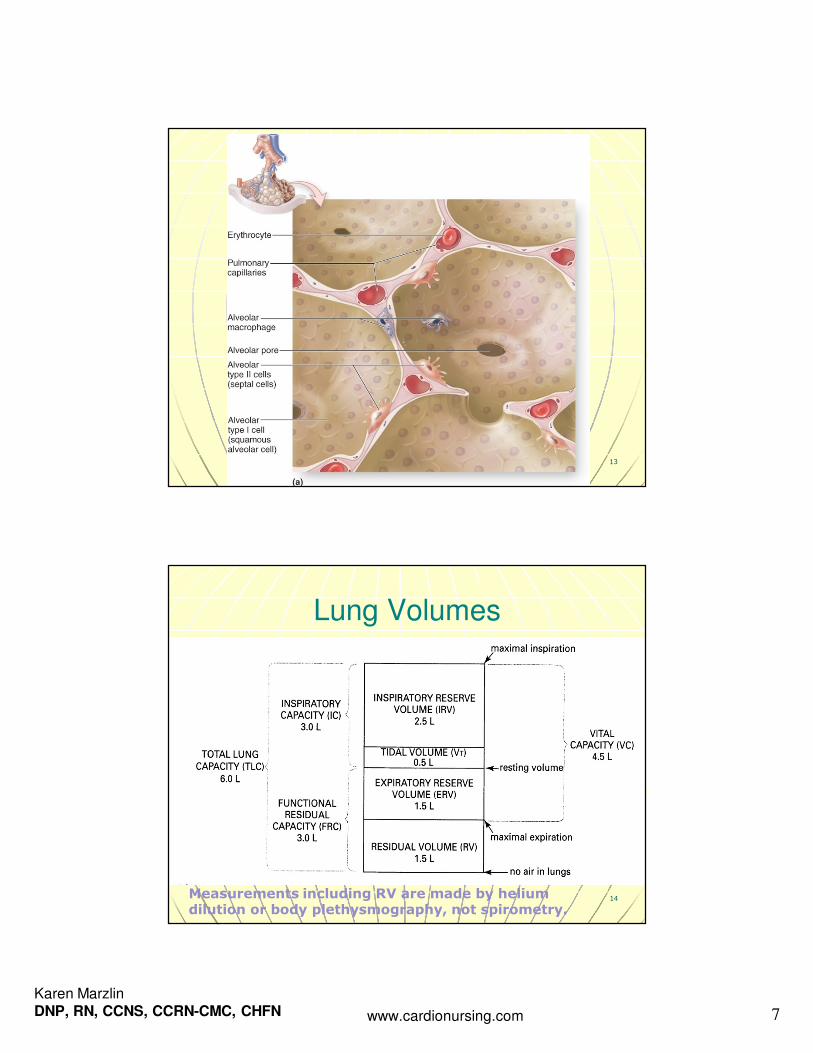
Alveolar Cells
� Type I (make up 90% of alveolar
surface area)
• Squamous epithelium
• Adapted for gas exchange
• Prevents fluid from entering alveoli
• Easily injured
� Type II
• Can generate into Type 1 cells
• Produces surfactant (allows alveoli to remain inflated at low distending pressures by decreasing surface tension, decreases work of breathing, detoxifies inhaled gases)
� Lipoprotein (phospholipid)
� Hypoxemia / hypoxia may lead to decreased production or increased destruction
• Metabolically active
� Alveolar Macrophages • Phagocytosis
Karen MarzlinDNP, RN, CCNS, CCRN-CMC, CHFN www.cardionursing.com 7
13
14
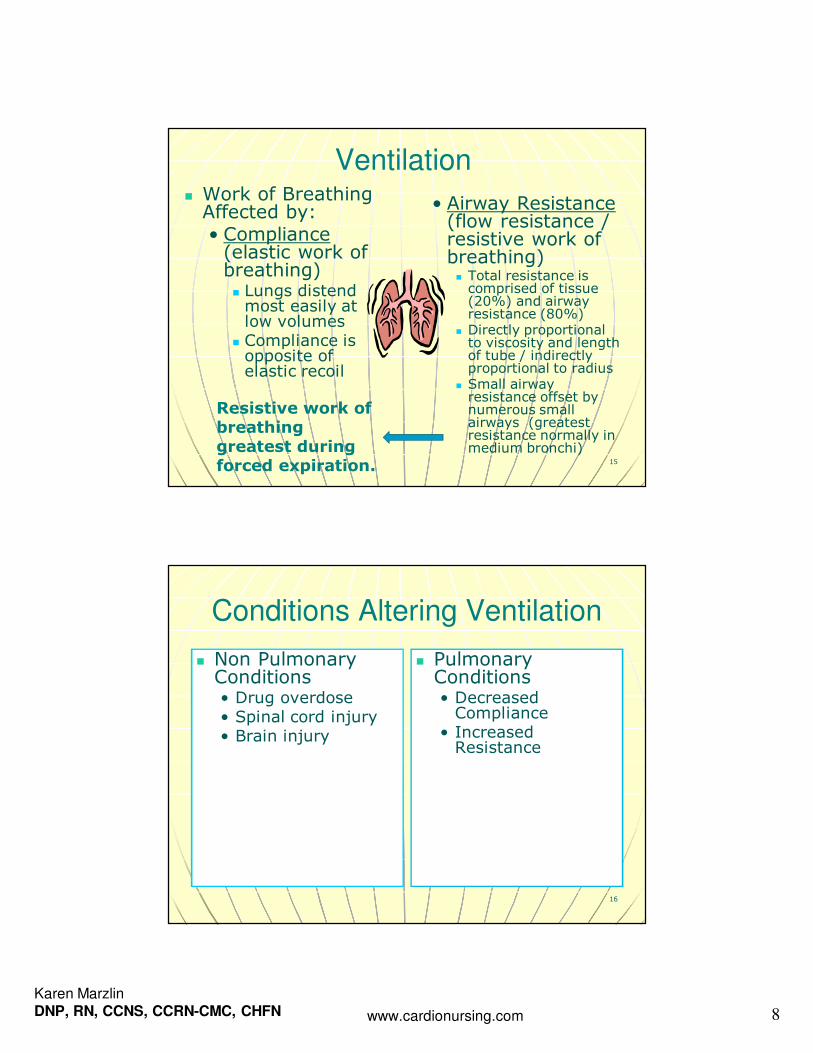
Lung Volumes
Measurements including RV are made by helium dilution or body plethysmography, not spirometry.
Karen MarzlinDNP, RN, CCNS, CCRN-CMC, CHFN www.cardionursing.com 8
15
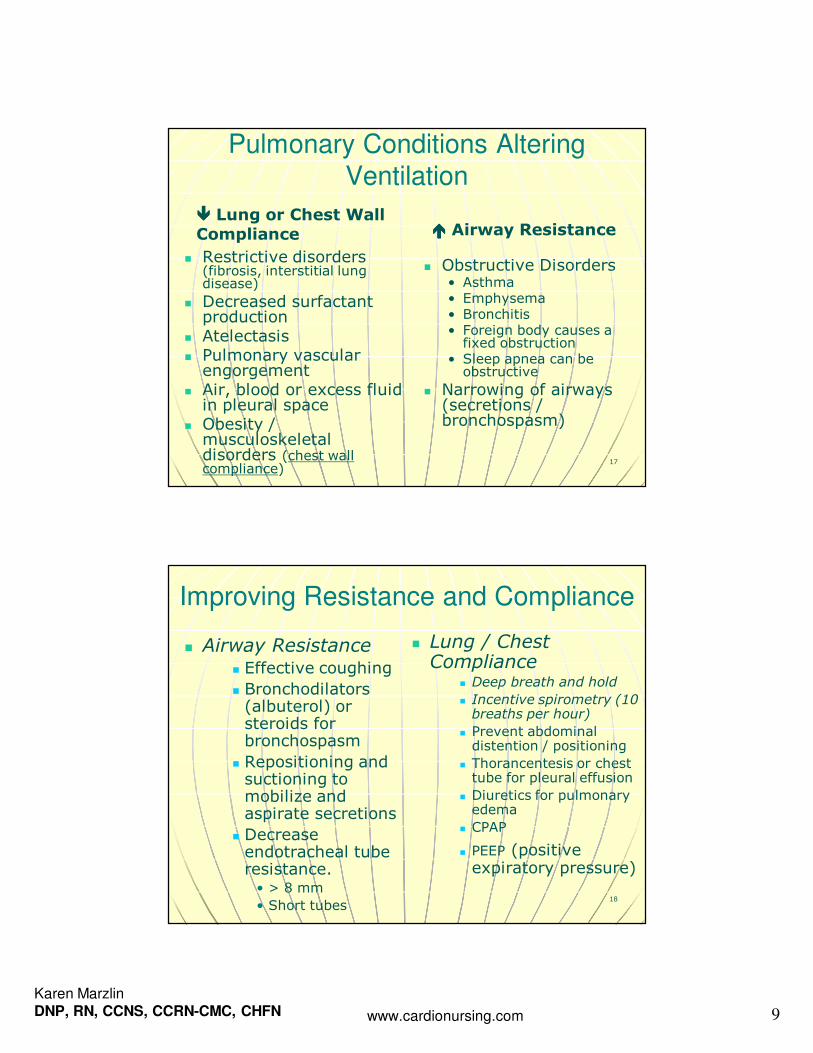
Ventilation � Work of Breathing Affected by: • Compliance(elastic work of breathing) � Lungs distend most easily at low volumes
� Compliance is opposite of elastic recoil
• Airway Resistance(flow resistance / resistive work of breathing)
� Total resistance is comprised of tissue (20%) and airway resistance (80%)
� Directly proportional to viscosity and length of tube / indirectly proportional to radius
� Small airway resistance offset by numerous small airways (greatest resistance normally in medium bronchi)
Resistive work of breathing greatest during forced expiration.
Conditions Altering Ventilation
� Non Pulmonary Conditions• Drug overdose • Spinal cord injury • Brain injury
� Pulmonary Conditions • Decreased Compliance
• Increased Resistance
16
Karen MarzlinDNP, RN, CCNS, CCRN-CMC, CHFN www.cardionursing.com 9
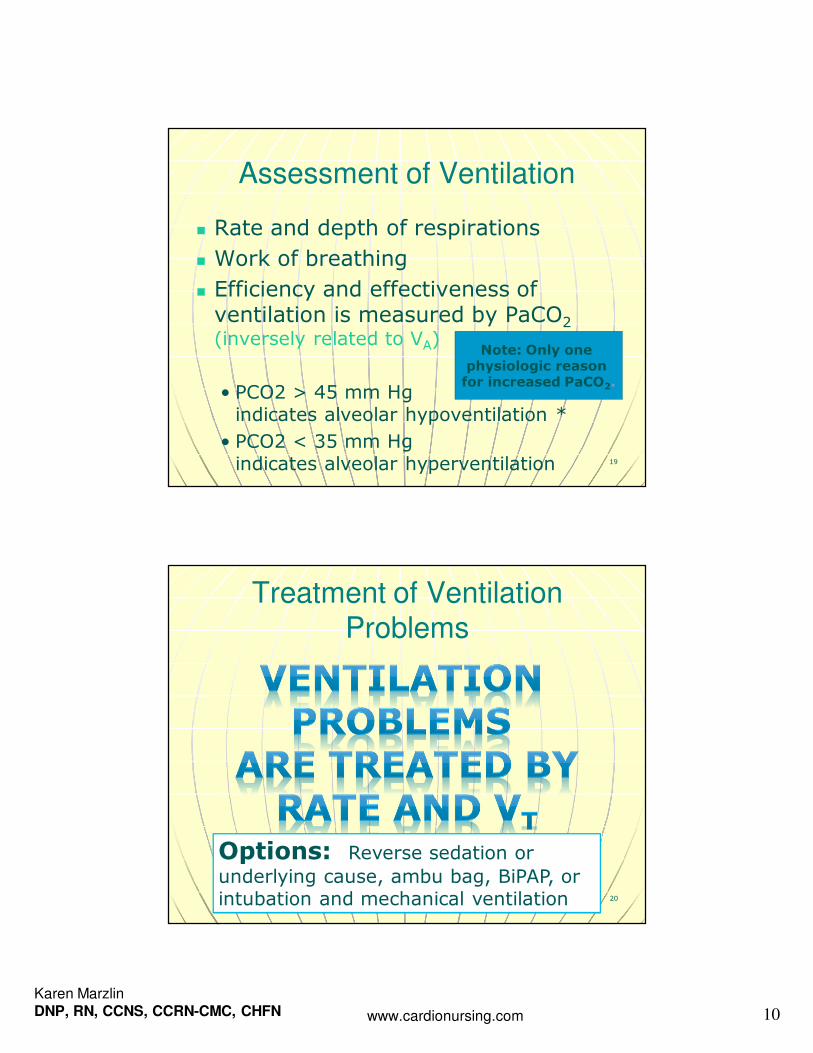
Pulmonary Conditions Altering
Ventilation
���� Lung or Chest Wall
Compliance
� Restrictive disorders (fibrosis, interstitial lung disease)
� Decreased surfactant production
� Atelectasis � Pulmonary vascular engorgement
� Air, blood or excess fluid in pleural space
� Obesity / musculoskeletal disorders (chest wall compliance)
���� Airway Resistance
� Obstructive Disorders • Asthma• Emphysema• Bronchitis• Foreign body causes a fixed obstruction
• Sleep apnea can be obstructive
� Narrowing of airways (secretions / bronchospasm)
17
18
Improving Resistance and Compliance
� Airway Resistance � Effective coughing
� Bronchodilators (albuterol) or steroids for bronchospasm
� Repositioning and suctioning to mobilize and aspirate secretions
� Decrease endotracheal tube resistance.• > 8 mm
• Short tubes
� Lung / Chest Compliance
� Deep breath and hold
� Incentive spirometry (10 breaths per hour)
� Prevent abdominal distention / positioning
� Thorancentesis or chest tube for pleural effusion
� Diuretics for pulmonary edema
� CPAP
� PEEP (positive expiratory pressure)
Karen MarzlinDNP, RN, CCNS, CCRN-CMC, CHFN www.cardionursing.com 10
19
Assessment of Ventilation
� Rate and depth of respirations
� Work of breathing
� Efficiency and effectiveness of ventilation is measured by PaCO2
(inversely related to VA)
• PCO2 > 45 mm Hg indicates alveolar hypoventilation *
• PCO2 < 35 mm Hg indicates alveolar hyperventilation
Note: Only one physiologic reason for increased PaCO2.
Treatment of Ventilation Problems
20
Options: Reverse sedation or underlying cause, ambu bag, BiPAP, or intubation and mechanical ventilation
Karen MarzlinDNP, RN, CCNS, CCRN-CMC, CHFN www.cardionursing.com 11
21
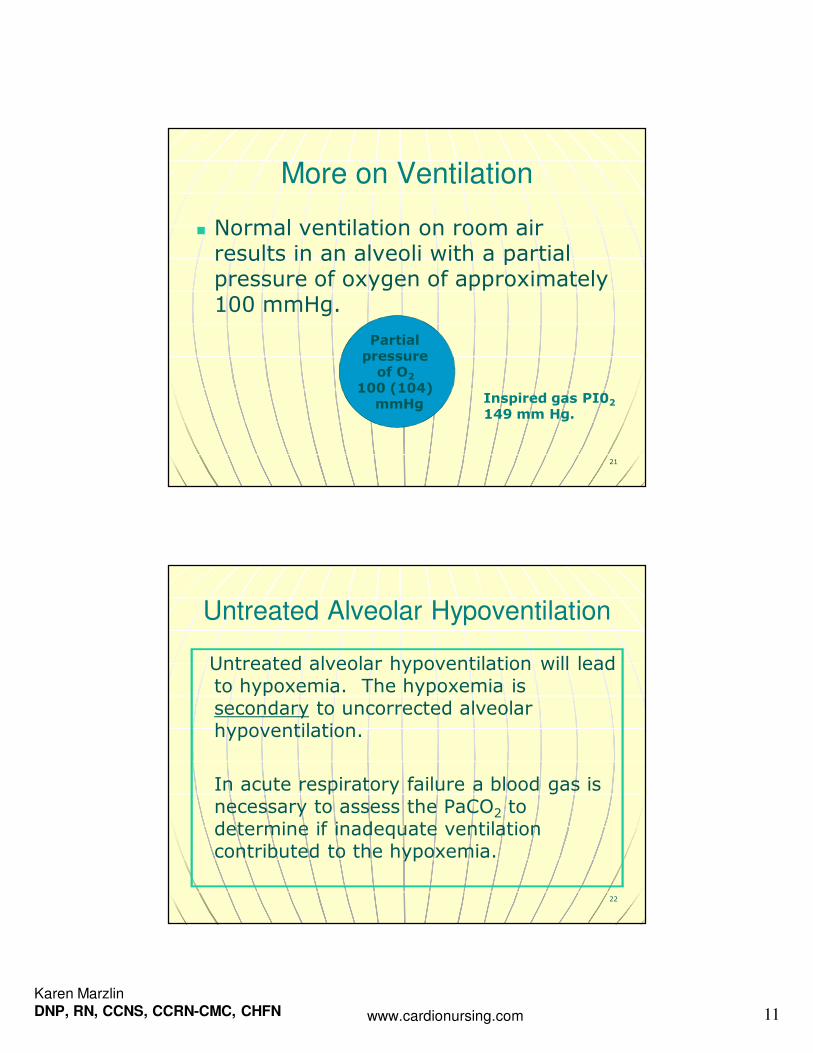
More on Ventilation
� Normal ventilation on room air results in an alveoli with a partial pressure of oxygen of approximately 100 mmHg.
Partial pressure of O2
100 (104) mmHg Inspired gas PI02
149 mm Hg.
22
Untreated Alveolar Hypoventilation
Untreated alveolar hypoventilation will lead to hypoxemia. The hypoxemia is secondary to uncorrected alveolar hypoventilation.
In acute respiratory failure a blood gas is necessary to assess the PaCO2 to determine if inadequate ventilation contributed to the hypoxemia.
Karen MarzlinDNP, RN, CCNS, CCRN-CMC, CHFN www.cardionursing.com 12
23
Perfusion
24
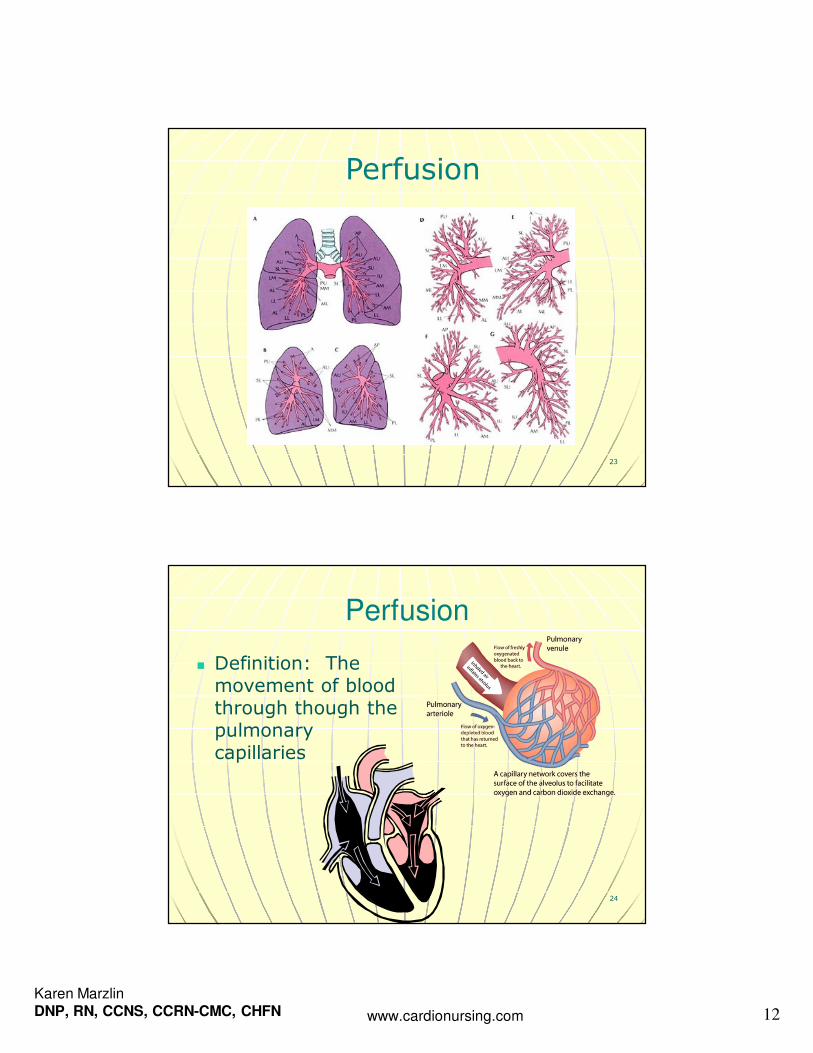
Perfusion
� Definition: The movement of blood through though the pulmonary capillaries
Karen MarzlinDNP, RN, CCNS, CCRN-CMC, CHFN www.cardionursing.com 13
25
Perfusion � Blood supply to lung
• Pulmonary blood flow
� Entire output of right ventricle
� Mixed venous blood
� Gas exchange with alveolar air into pulmonary capillaries
• Bronchial blood flow
� Left ventricle
� Part of tracheal bronchial tree
� Systemic arterial blood
26
Perfusion Fun Facts
� Pulmonary capillaries are slightly smaller than average erythrocyte
� Gas exchange actually starts in smaller pulmonary arterial vessels that are not true capillaries (functional pulmonary capillaries)
� 280 billion capillaries supply 300 million alveoli� Potential surface area for gas exchange is 50-100 m2
� Alveoli are completely enveloped in pulmonary capillaries
� At rest each red blood cell spends only about 0.75 seconds in the pulmonary capillary. Less time during exercise.
Karen MarzlinDNP, RN, CCNS, CCRN-CMC, CHFN www.cardionursing.com 14
27
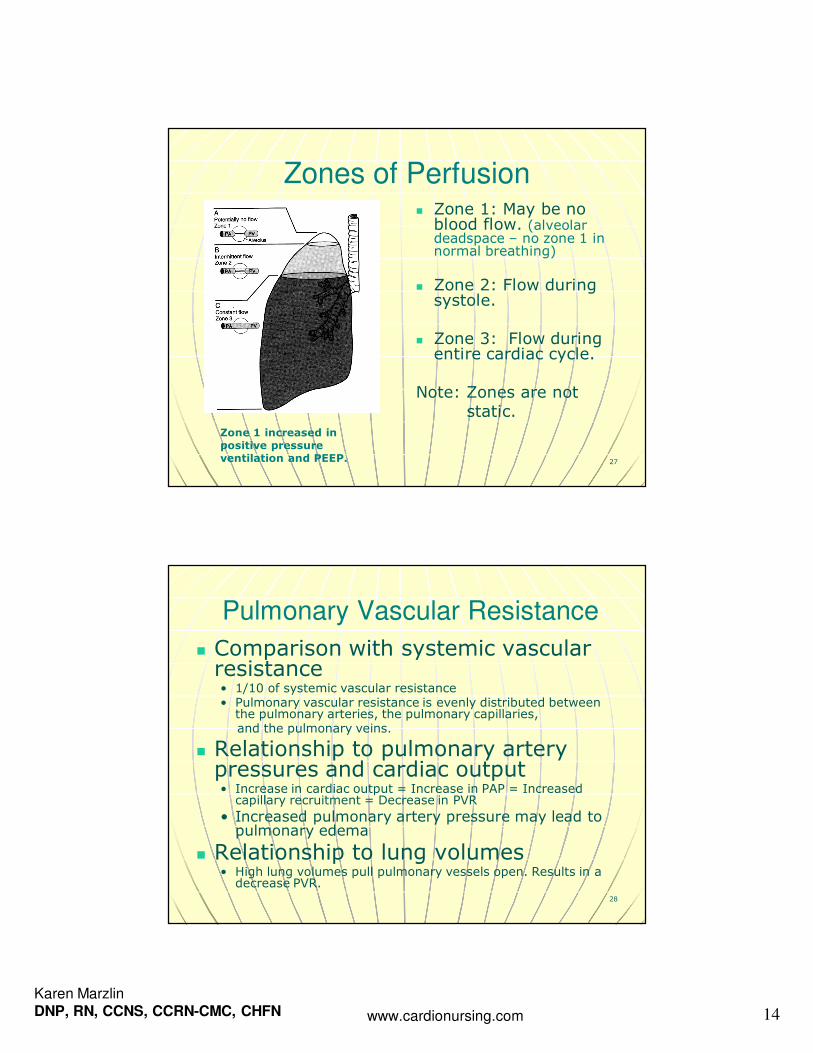
Zones of Perfusion � Zone 1: May be no blood flow. (alveolar deadspace – no zone 1 in normal breathing)
� Zone 2: Flow during systole.
� Zone 3: Flow during entire cardiac cycle.
Note: Zones are notstatic.
Zone 1 increased in positive pressure ventilation and PEEP.
28
Pulmonary Vascular Resistance
� Comparison with systemic vascular resistance • 1/10 of systemic vascular resistance • Pulmonary vascular resistance is evenly distributed between the pulmonary arteries, the pulmonary capillaries,and the pulmonary veins.
� Relationship to pulmonary artery pressures and cardiac output • Increase in cardiac output = Increase in PAP = Increased capillary recruitment = Decrease in PVR
• Increased pulmonary artery pressure may lead to pulmonary edema
� Relationship to lung volumes • High lung volumes pull pulmonary vessels open. Results in a decrease PVR.
Karen MarzlinDNP, RN, CCNS, CCRN-CMC, CHFN www.cardionursing.com 15
29
Pulmonary Vascular Resistance
� During positive pressure mechanical ventilation, both the alveolar and
extra-alveolar vessels are compressed during lung inflation and PVR is increased.
� PEEP increases PVR further.
30
Hypoxic Pulmonary Vasoconstriction � Diverts blood away from poorly ventilated alveoli
� Also occurs in response to more global hypoxia• Increases pulmonary artery pressure and recruits pulmonary capillaries to improve ventilation and perfusion matching
� Has limitations because of small amount of vascular smooth muscle in the pulmonary arteries
� Hypoxic vasoconstriction greatly increases the workload of the right ventricle
� Increased pulmonary artery pressure may lead to pulmonary edema.
Karen MarzlinDNP, RN, CCNS, CCRN-CMC, CHFN www.cardionursing.com 16
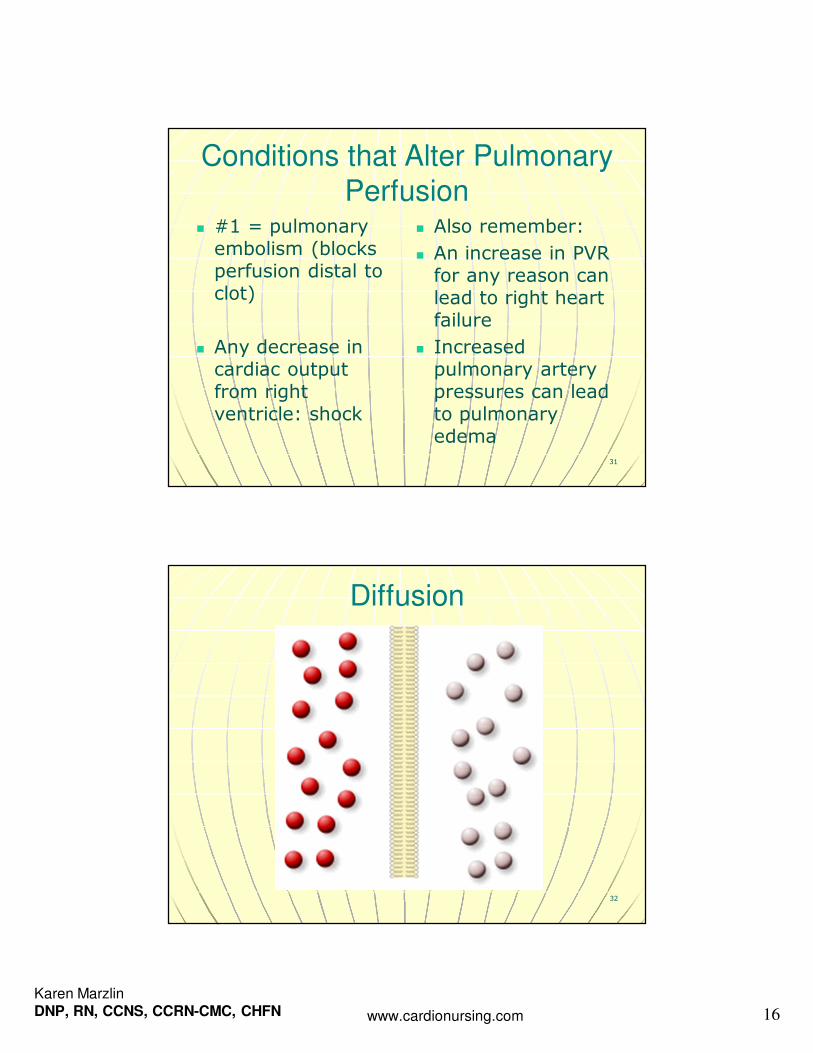
Conditions that Alter Pulmonary Perfusion
� #1 = pulmonary embolism (blocks perfusion distal to clot)
� Any decrease in cardiac output from right ventricle: shock
� Also remember:
� An increase in PVR for any reason can lead to right heart failure
� Increased pulmonary artery pressures can lead to pulmonary edema
31
32
Diffusion
Karen MarzlinDNP, RN, CCNS, CCRN-CMC, CHFN www.cardionursing.com 17
33
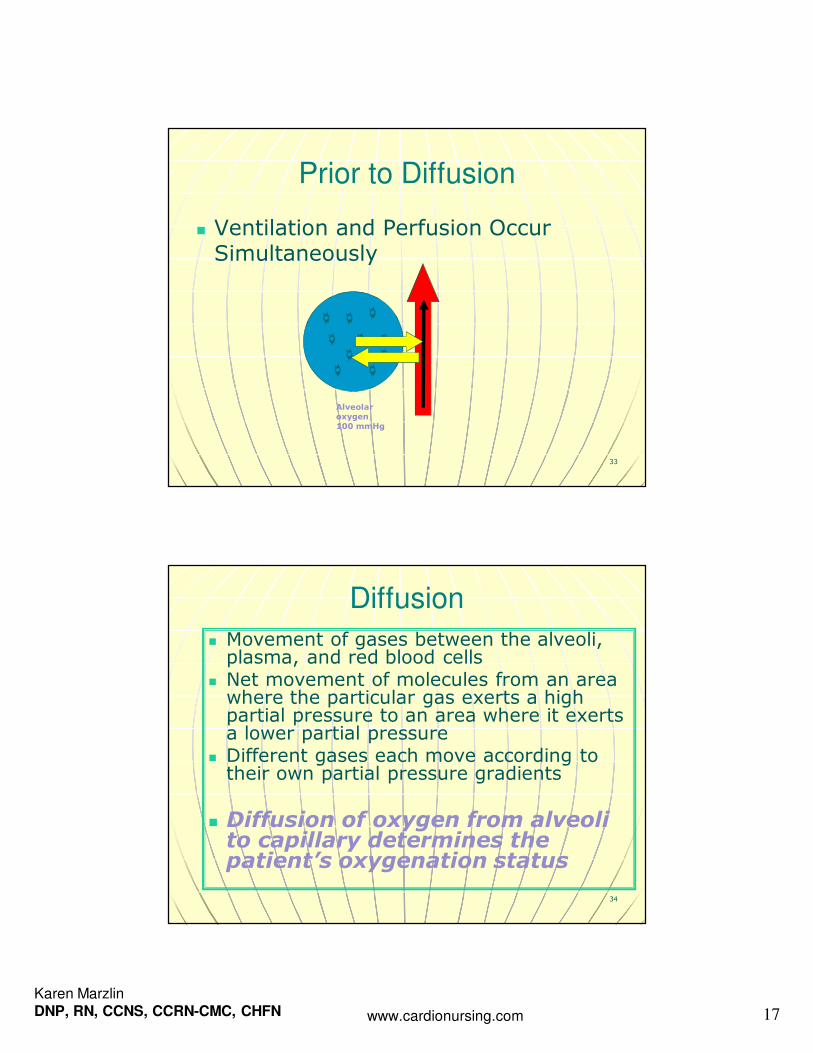
Prior to Diffusion
� Ventilation and Perfusion Occur Simultaneously
Alveolar oxygen 100 mmHg
34
Diffusion
� Movement of gases between the alveoli, plasma, and red blood cells
� Net movement of molecules from an area where the particular gas exerts a high partial pressure to an area where it exerts a lower partial pressure
� Different gases each move according to their own partial pressure gradients
� Diffusion of oxygen from alveoli to capillary determines the patient’s oxygenation status
Karen MarzlinDNP, RN, CCNS, CCRN-CMC, CHFN www.cardionursing.com 18
35
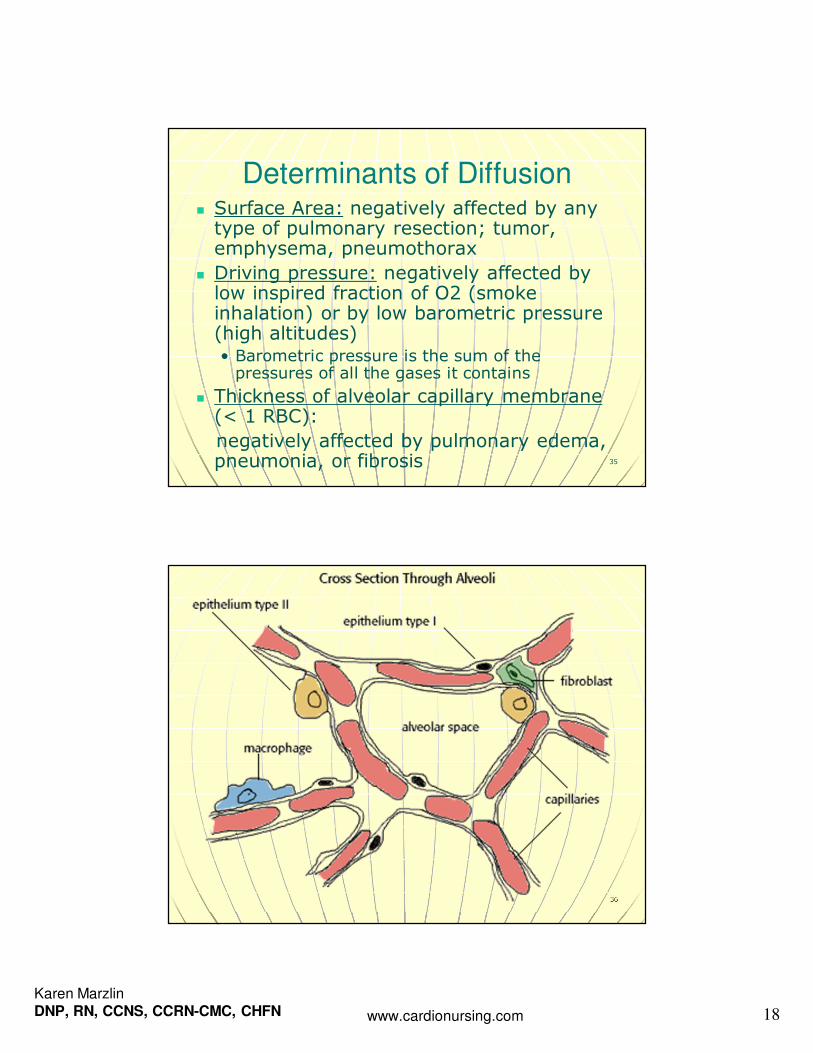
Determinants of Diffusion � Surface Area: negatively affected by any type of pulmonary resection; tumor, emphysema, pneumothorax
� Driving pressure: negatively affected by low inspired fraction of O2 (smoke inhalation) or by low barometric pressure (high altitudes) • Barometric pressure is the sum of the pressures of all the gases it contains
� Thickness of alveolar capillary membrane (< 1 RBC):
negatively affected by pulmonary edema, pneumonia, or fibrosis
36
Karen MarzlinDNP, RN, CCNS, CCRN-CMC, CHFN www.cardionursing.com 19
37
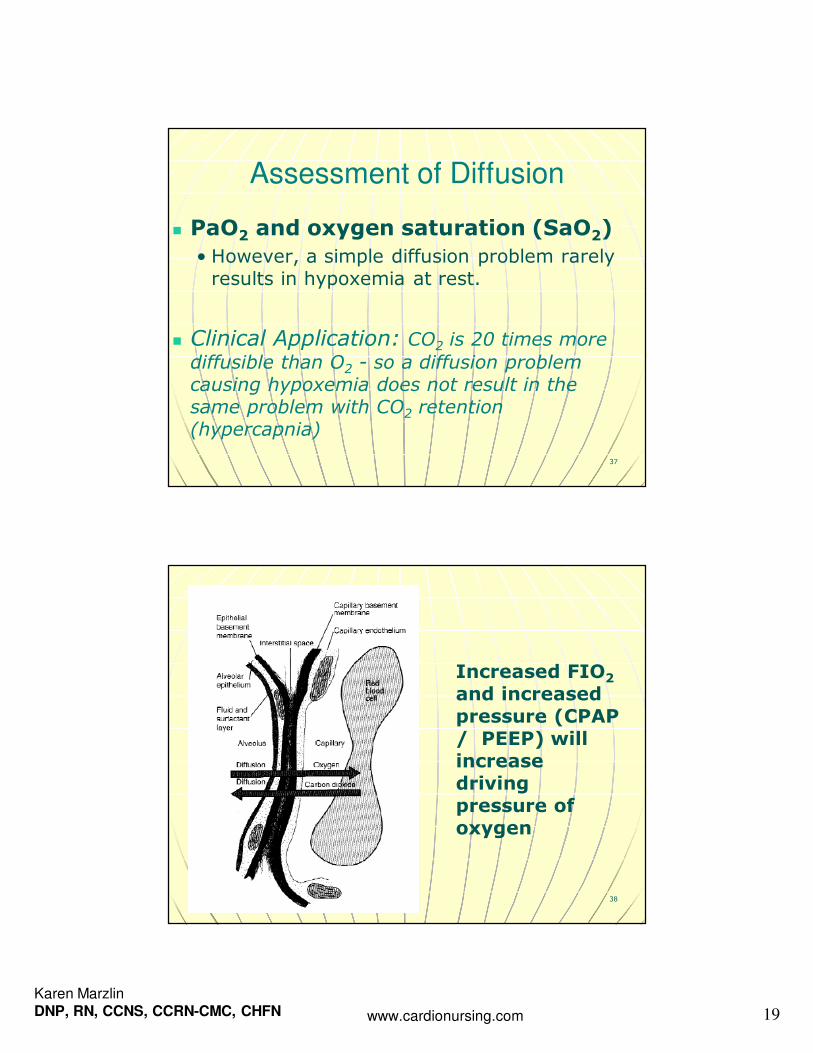
Assessment of Diffusion
� PaO2 and oxygen saturation (SaO2)
• However, a simple diffusion problem rarely results in hypoxemia at rest.
� Clinical Application: CO2 is 20 times more
diffusible than O2 - so a diffusion problem causing hypoxemia does not result in the same problem with CO2 retention (hypercapnia)
38
Increased FIO2
and increased pressure (CPAP / PEEP) will increase driving pressure of oxygen
Karen MarzlinDNP, RN, CCNS, CCRN-CMC, CHFN www.cardionursing.com 20
39
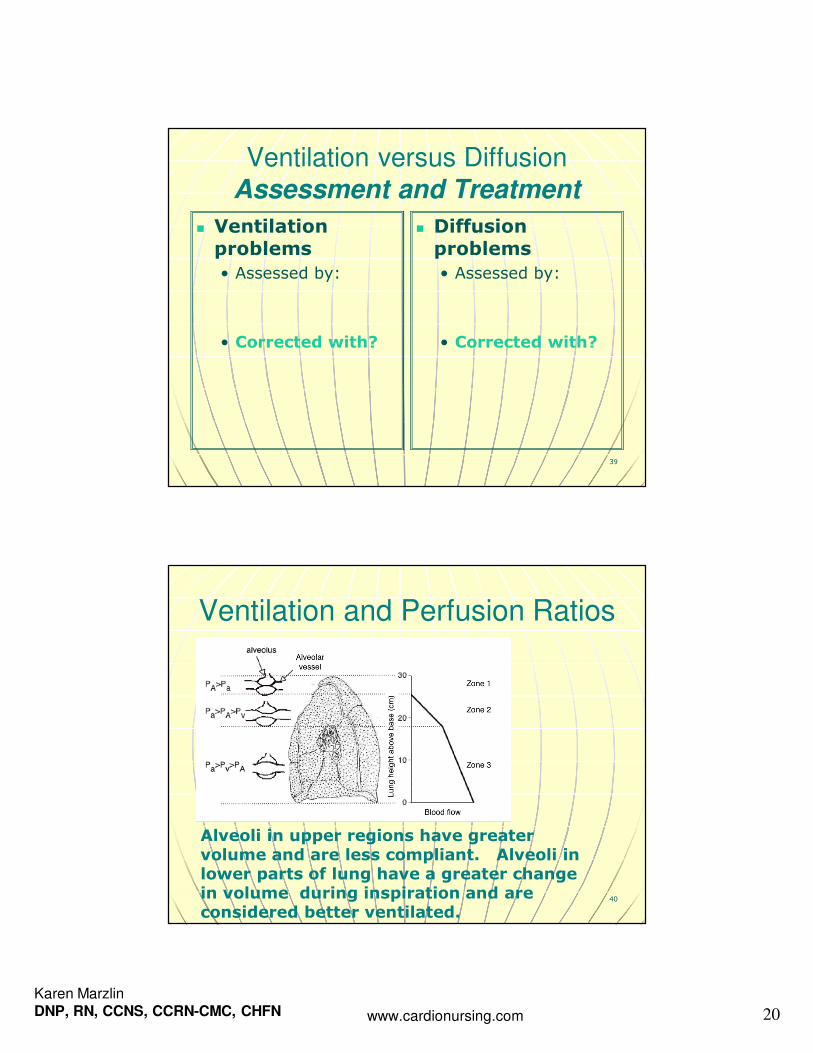
Ventilation versus Diffusion
Assessment and Treatment
� Ventilation problems
• Assessed by:
• Corrected with?
� Diffusion problems
• Assessed by:
• Corrected with?
40
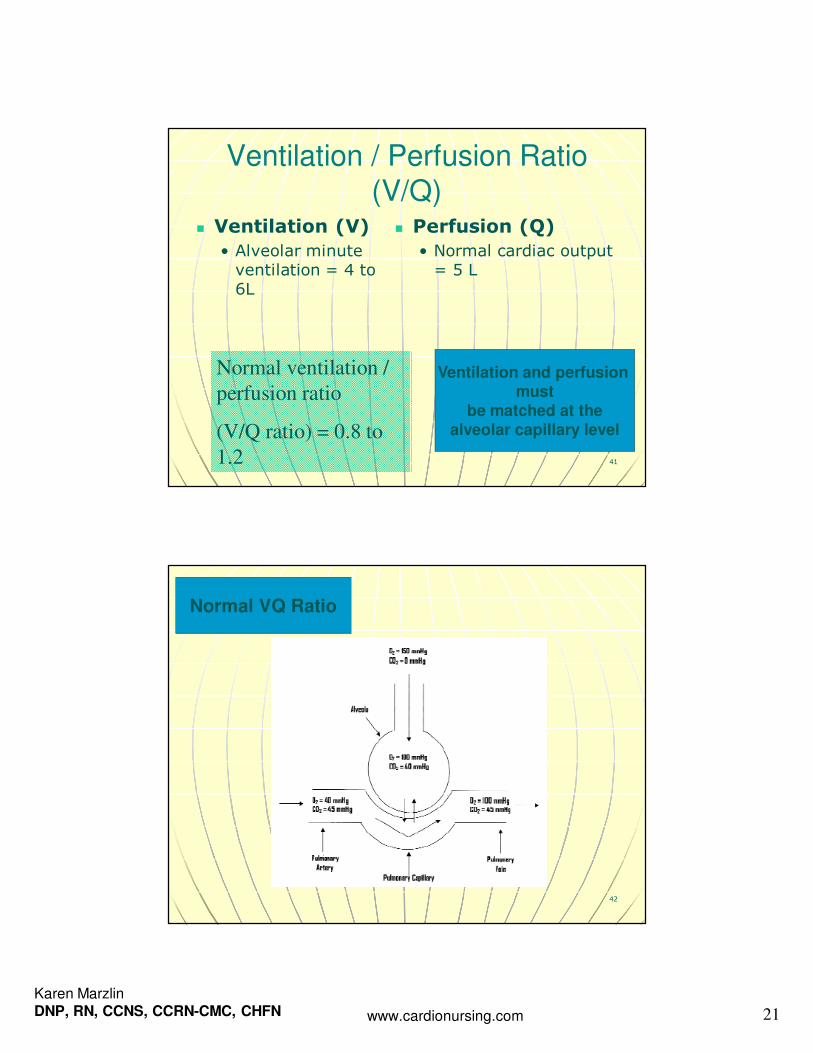
Ventilation and Perfusion Ratios
Alveoli in upper regions have greater volume and are less compliant. Alveoli in lower parts of lung have a greater change in volume during inspiration and are considered better ventilated.
Karen MarzlinDNP, RN, CCNS, CCRN-CMC, CHFN www.cardionursing.com 21
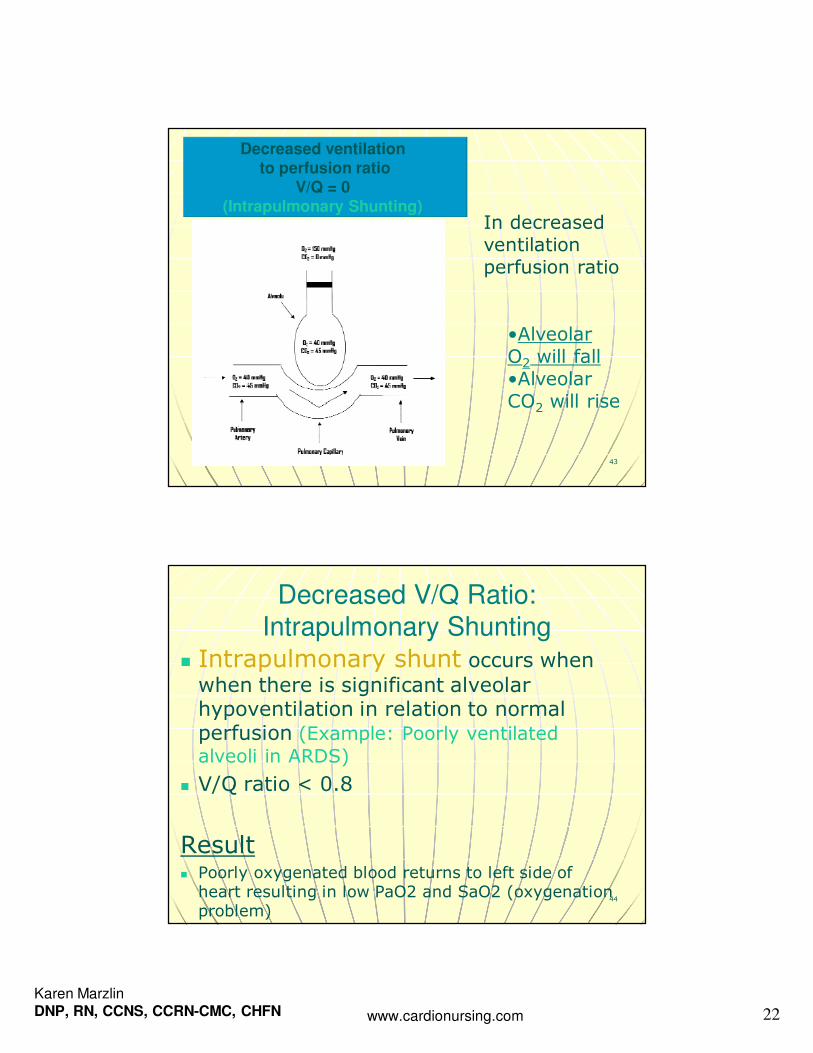
41
Ventilation / Perfusion Ratio (V/Q)
� Ventilation (V)
• Alveolar minute ventilation = 4 to 6L
� Perfusion (Q)
• Normal cardiac output = 5 L
Normal ventilation /
perfusion ratio
(V/Q ratio) = 0.8 to
1.2
Ventilation and perfusion must
be matched at the alveolar capillary level
42
Normal VQ Ratio
Karen MarzlinDNP, RN, CCNS, CCRN-CMC, CHFN www.cardionursing.com 22
43
Decreased ventilation
to perfusion ratio
V/Q = 0
(Intrapulmonary Shunting)In decreased ventilation perfusion ratio
•Alveolar O2 will fall•Alveolar CO2 will rise
44
Decreased V/Q Ratio:
Intrapulmonary Shunting � Intrapulmonary shunt occurs when when there is significant alveolar hypoventilation in relation to normal perfusion (Example: Poorly ventilated
alveoli in ARDS)
� V/Q ratio < 0.8
Result� Poorly oxygenated blood returns to left side of heart resulting in low PaO2 and SaO2 (oxygenation problem)
Karen MarzlinDNP, RN, CCNS, CCRN-CMC, CHFN www.cardionursing.com 23
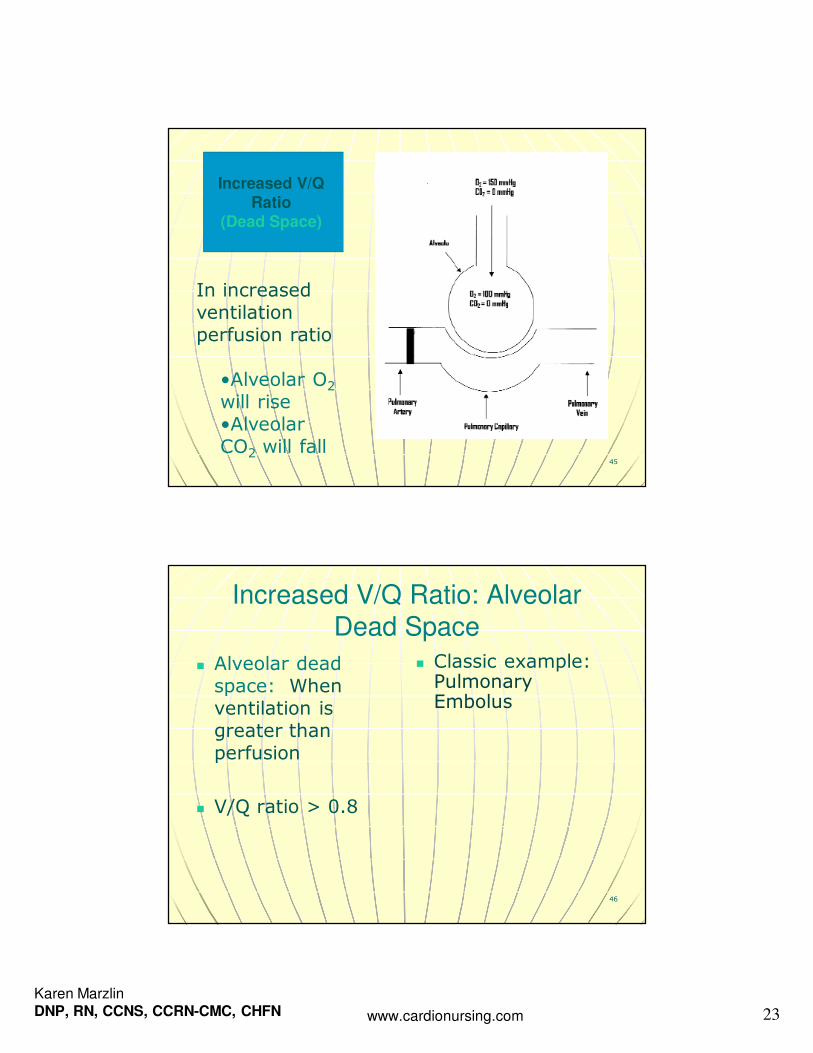
45
Increased V/Q
Ratio (Dead Space)
In increased ventilation perfusion ratio
•Alveolar O2
will rise•Alveolar CO2 will fall
46
Increased V/Q Ratio: Alveolar
Dead Space
� Alveolar dead space: When ventilation is greater than perfusion
� V/Q ratio > 0.8
� Classic example: Pulmonary Embolus
Karen MarzlinDNP, RN, CCNS, CCRN-CMC, CHFN www.cardionursing.com 24
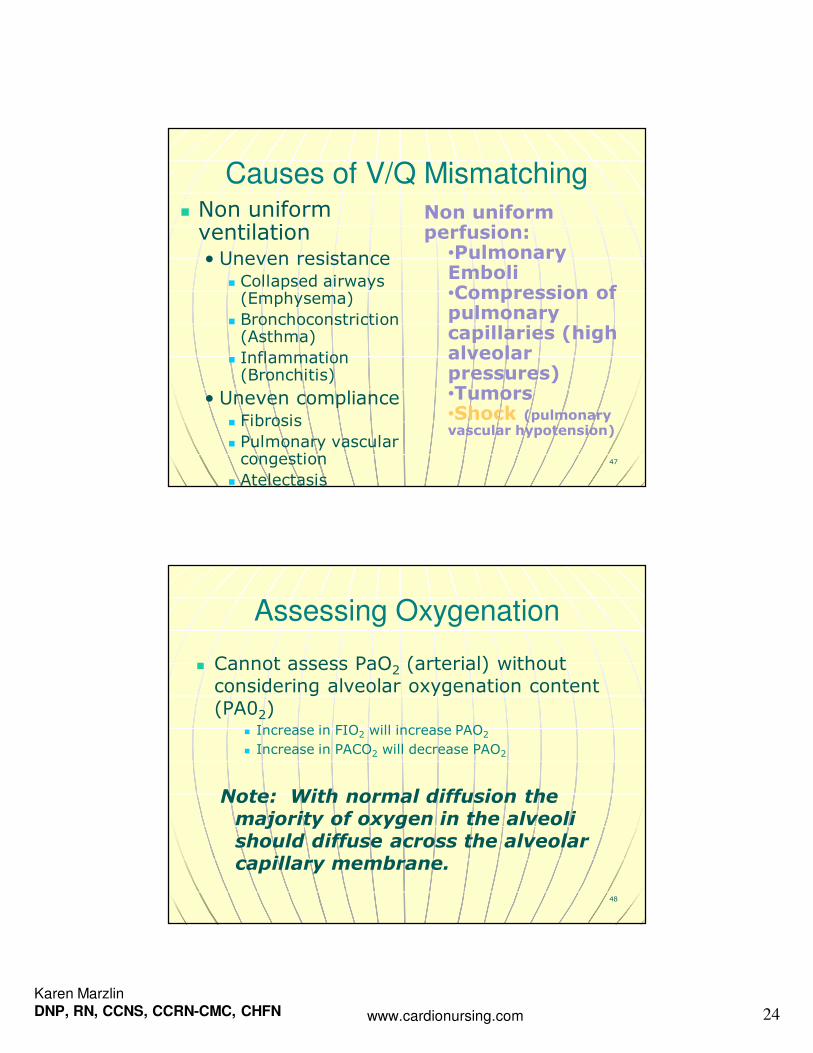
Causes of V/Q Mismatching� Non uniform ventilation • Uneven resistance
� Collapsed airways (Emphysema)
� Bronchoconstriction(Asthma)
� Inflammation (Bronchitis)
• Uneven compliance� Fibrosis
� Pulmonary vascular congestion
� Atelectasis
47
Non uniform perfusion:
•Pulmonary Emboli•Compression of pulmonary capillaries (high alveolar pressures)•Tumors •Shock (pulmonary vascular hypotension)
48
Assessing Oxygenation
� Cannot assess PaO2 (arterial) without considering alveolar oxygenation content (PA02)
� Increase in FIO2 will increase PAO2
� Increase in PACO2 will decrease PAO2
Note: With normal diffusion the majority of oxygen in the alveoli should diffuse across the alveolar capillary membrane.
Karen MarzlinDNP, RN, CCNS, CCRN-CMC, CHFN www.cardionursing.com 25
49
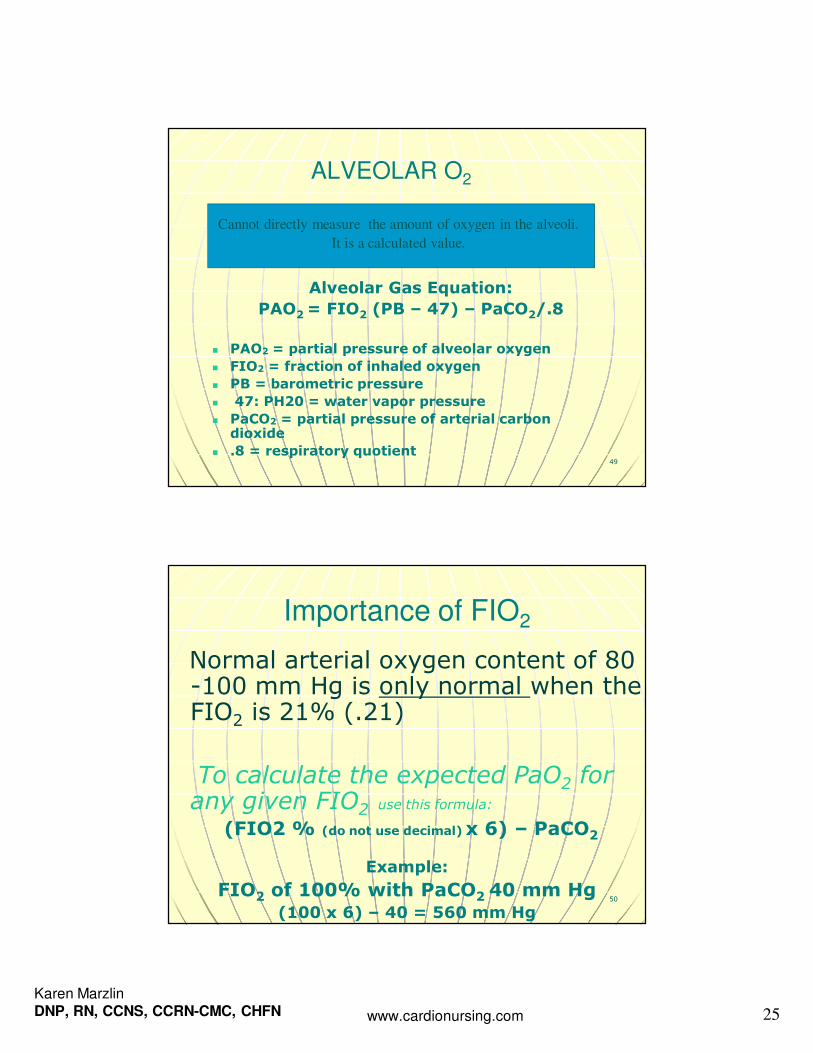
ALVEOLAR O2
Alveolar Gas Equation:
PAO2 = FIO2 (PB – 47) – PaCO2/.8
� PAO2 = partial pressure of alveolar oxygen
� FIO2 = fraction of inhaled oxygen
� PB = barometric pressure
� 47: PH20 = water vapor pressure
� PaCO2 = partial pressure of arterial carbon dioxide
� .8 = respiratory quotient
Cannot directly measure the amount of oxygen in the alveoli.
It is a calculated value.
50
Importance of FIO2
Normal arterial oxygen content of 80 -100 mm Hg is only normal when the FIO2 is 21% (.21)
To calculate the expected PaO2 for any given FIO2 use this formula:
(FIO2 % (do not use decimal) x 6) – PaCO2
Example:
FIO2 of 100% with PaCO2 40 mm Hg (100 x 6) – 40 = 560 mm Hg
Karen MarzlinDNP, RN, CCNS, CCRN-CMC, CHFN www.cardionursing.com 26
51
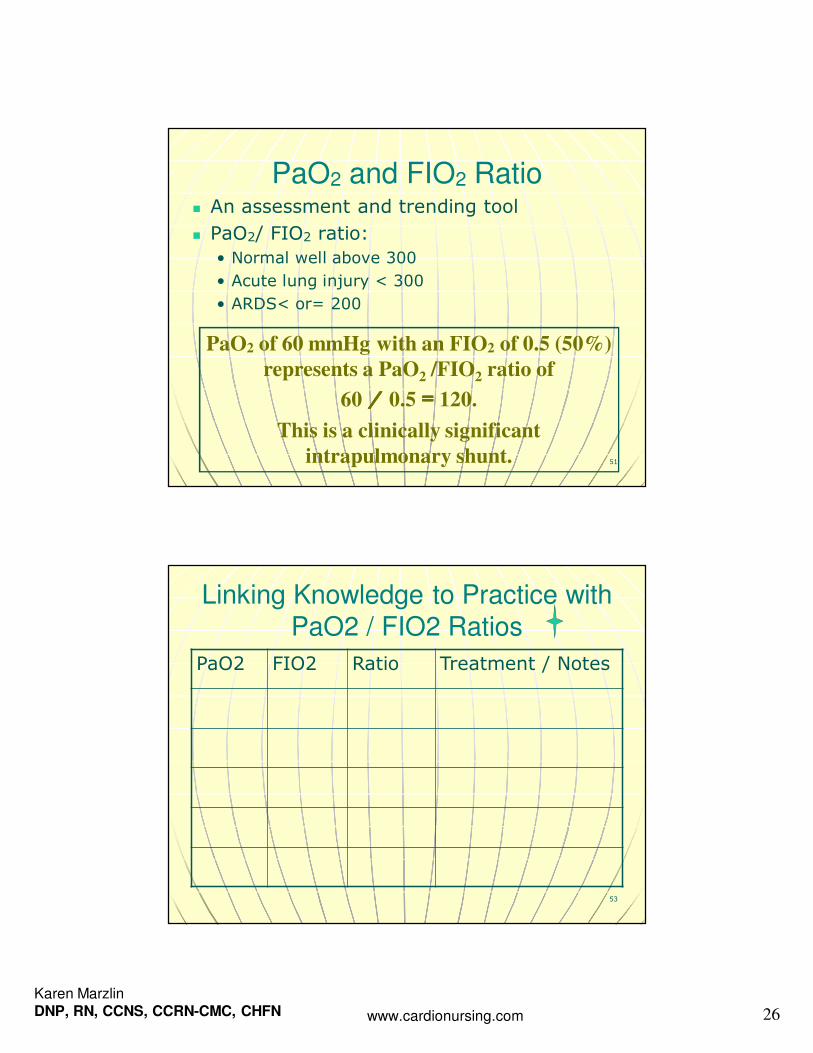
PaO2 and FIO2 Ratio � An assessment and trending tool
� PaO2/ FIO2 ratio:
• Normal well above 300
• Acute lung injury < 300
• ARDS< or= 200
PaO2 of 60 mmHg with an FIO2 of 0.5 (50%)
represents a PaO2 /FIO2 ratio of
60 / / / / 0.5 = = = = 120.
This is a clinically significant
intrapulmonary shunt.
53
Linking Knowledge to Practice with
PaO2 / FIO2 Ratios
PaO2 FIO2 Ratio Treatment / Notes
Karen MarzlinDNP, RN, CCNS, CCRN-CMC, CHFN www.cardionursing.com 27
54
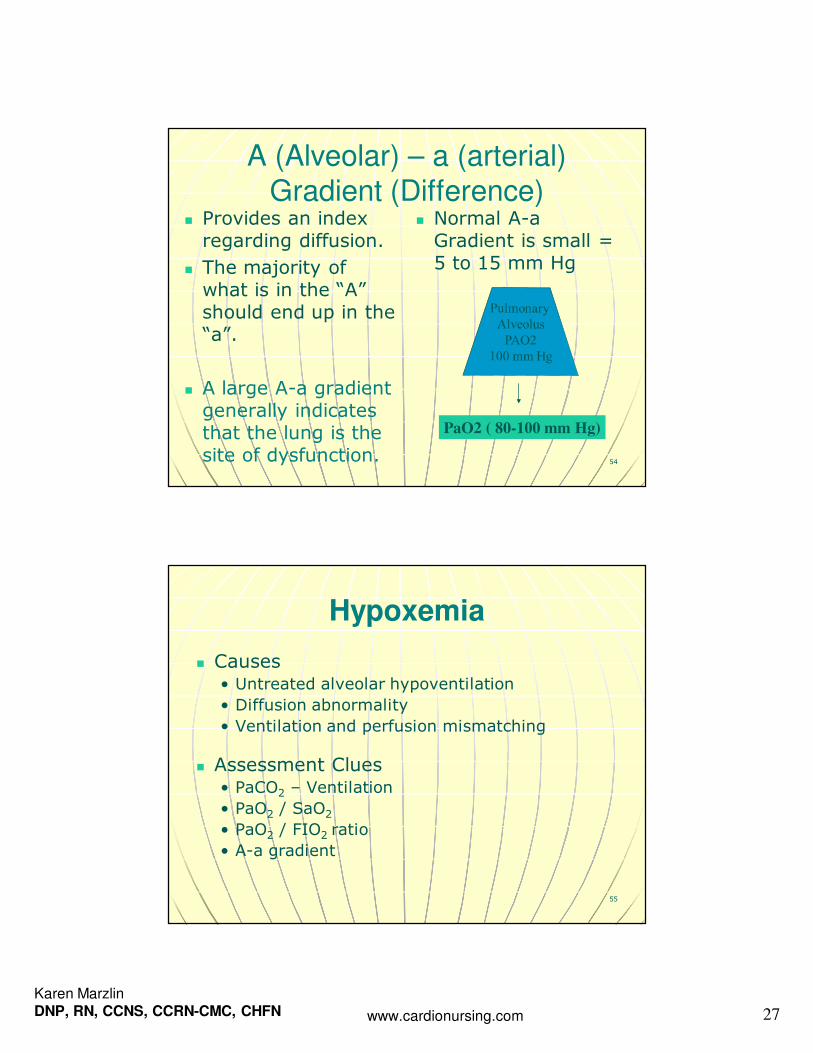
A (Alveolar) – a (arterial) Gradient (Difference)
� Provides an index regarding diffusion.
� The majority of what is in the “A” should end up in the “a”.
� A large A-a gradient generally indicates that the lung is the site of dysfunction.
� Normal A-a Gradient is small = 5 to 15 mm Hg
PaO2 ( 80-100 mm Hg)
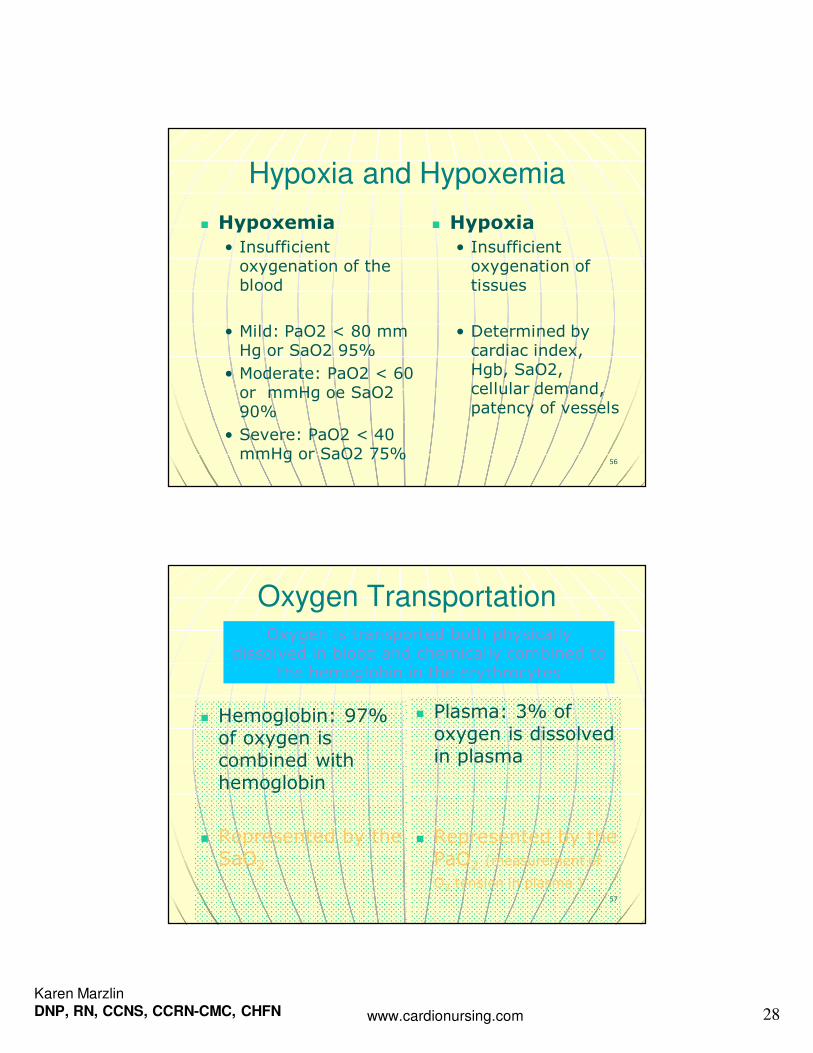
Hypoxemia
� Causes• Untreated alveolar hypoventilation
• Diffusion abnormality
• Ventilation and perfusion mismatching
� Assessment Clues • PaCO2 – Ventilation
• PaO2 / SaO2
• PaO2 / FIO2 ratio
• A-a gradient
55
Karen MarzlinDNP, RN, CCNS, CCRN-CMC, CHFN www.cardionursing.com 28
56
Hypoxia and Hypoxemia
� Hypoxemia
• Insufficient oxygenation of the blood
• Mild: PaO2 < 80 mm Hg or SaO2 95%
• Moderate: PaO2 < 60 or mmHg oe SaO2 90%
• Severe: PaO2 < 40 mmHg or SaO2 75%
� Hypoxia
• Insufficient oxygenation of tissues
• Determined by cardiac index, Hgb, SaO2, cellular demand, patency of vessels
57
Oxygen Transportation
� Hemoglobin: 97% of oxygen is combined with hemoglobin
� Represented by the SaO2
� Plasma: 3% of oxygen is dissolved in plasma
� Represented by the PaO2 (measurement of
O2 tension in plasma )
Oxygen is transported both physically dissolved in blood and chemically combined to
the hemoglobin in the erythrocytes
Karen MarzlinDNP, RN, CCNS, CCRN-CMC, CHFN www.cardionursing.com 29
58
Oxygen Delivery to Tissues
59
Transport of Gases in the Blood
� Definition: movement of oxygen and carbon dioxide through the circulatory system; oxygen being moved from the alveolus to the tissues for utilization and carbon dioxide being moved from the tissues back to the alveolus for exhalation
Karen MarzlinDNP, RN, CCNS, CCRN-CMC, CHFN www.cardionursing.com 30
60
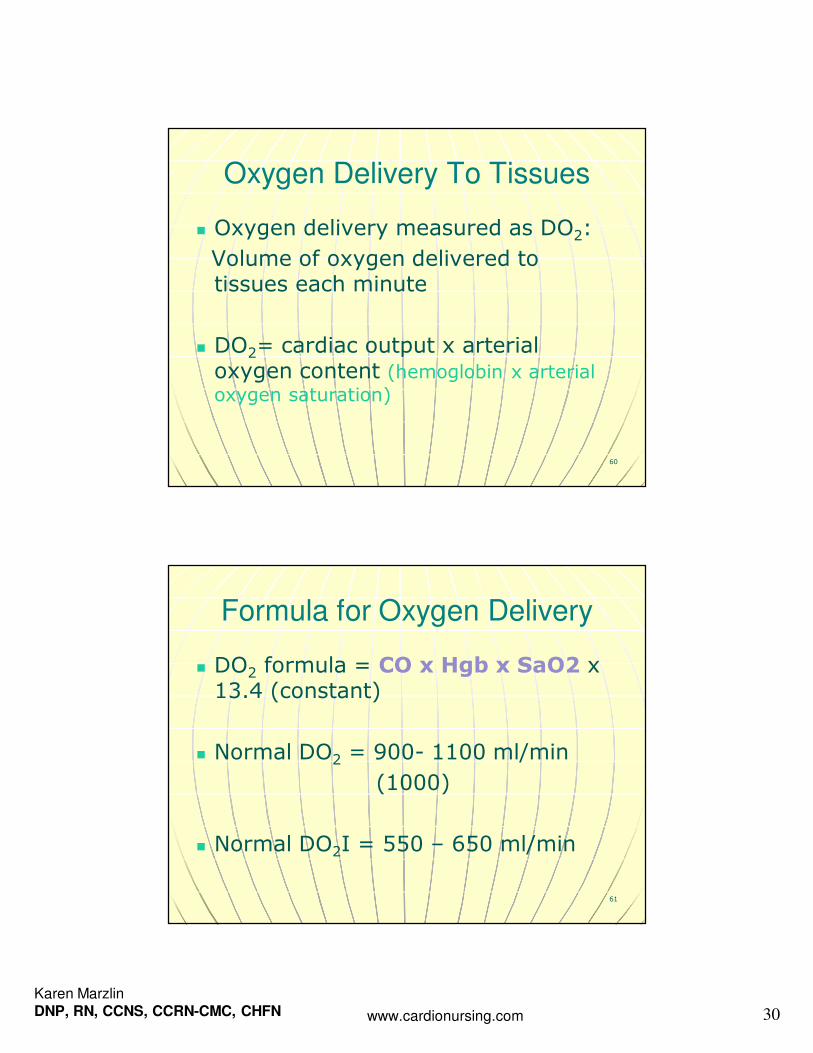
Oxygen Delivery To Tissues
� Oxygen delivery measured as DO2:
Volume of oxygen delivered to tissues each minute
� DO2= cardiac output x arterial oxygen content (hemoglobin x arterial
oxygen saturation)
61
Formula for Oxygen Delivery
� DO2 formula = CO x Hgb x SaO2 x 13.4 (constant)
� Normal DO2 = 900- 1100 ml/min
(1000)
� Normal DO2I = 550 – 650 ml/min
Karen MarzlinDNP, RN, CCNS, CCRN-CMC, CHFN www.cardionursing.com 31
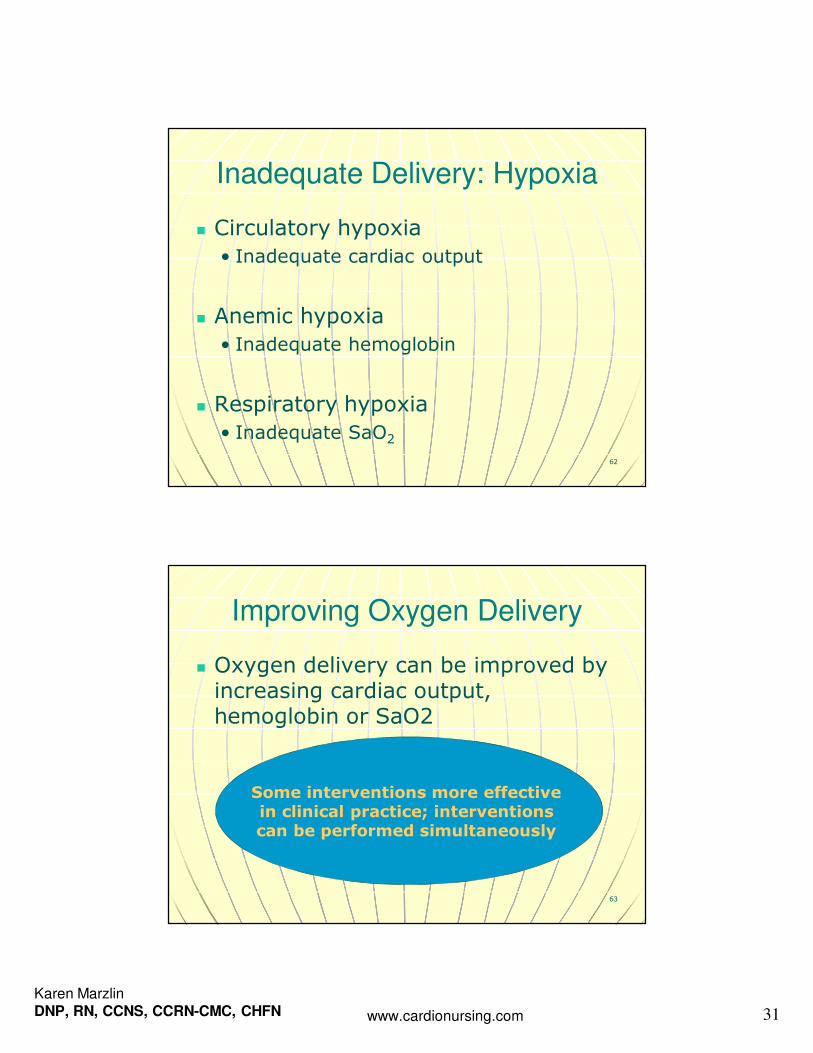
Inadequate Delivery: Hypoxia
� Circulatory hypoxia
• Inadequate cardiac output
� Anemic hypoxia
• Inadequate hemoglobin
� Respiratory hypoxia
• Inadequate SaO2
62
63
Improving Oxygen Delivery
� Oxygen delivery can be improved by increasing cardiac output, hemoglobin or SaO2
Some interventions more effective in clinical practice; interventions can be performed simultaneously
Karen MarzlinDNP, RN, CCNS, CCRN-CMC, CHFN www.cardionursing.com 32
64
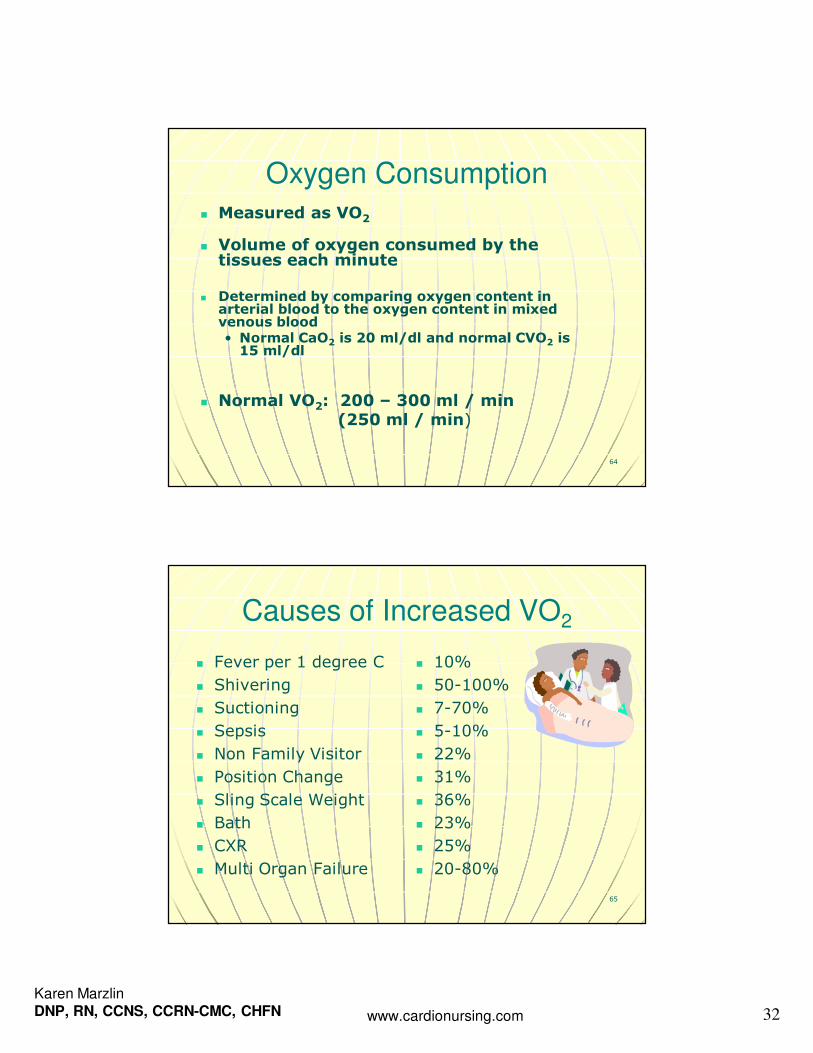
Oxygen Consumption � Measured as VO2
� Volume of oxygen consumed by the tissues each minute
� Determined by comparing oxygen content in arterial blood to the oxygen content in mixed venous blood• Normal CaO2 is 20 ml/dl and normal CVO2 is 15 ml/dl
� Normal VO2: 200 – 300 ml / min (250 ml / min)
65
Causes of Increased VO2
� Fever per 1 degree C
� Shivering
� Suctioning
� Sepsis
� Non Family Visitor
� Position Change
� Sling Scale Weight
� Bath
� CXR
� Multi Organ Failure
� 10%
� 50-100%
� 7-70%
� 5-10%
� 22%
� 31%
� 36%
� 23%
� 25%
� 20-80%
Karen MarzlinDNP, RN, CCNS, CCRN-CMC, CHFN www.cardionursing.com 33
66
Oxygen Reserve in Venous
Blood� Measured by mixed venous oxygen saturation (SVO2)
� Normal 60-80% (75%)
� Tissues were delivered 1000 ml / min (DO2)
� Tissues uses 250 ml / min (VO2)
� This leaves a 75% reserve in venous blood
� Oxygen Extraction Ratio (O2ER) = 25%
67
Oxygen Consumption and
Oxygen Delivery
� Oxygen delivery and oxygen consumption are independent until a critical point of oxygen delivery is reached
� Tissues will extract the amount of oxygen needed independent of delivery because delivery exceeds need
Karen MarzlinDNP, RN, CCNS, CCRN-CMC, CHFN www.cardionursing.com 34
68
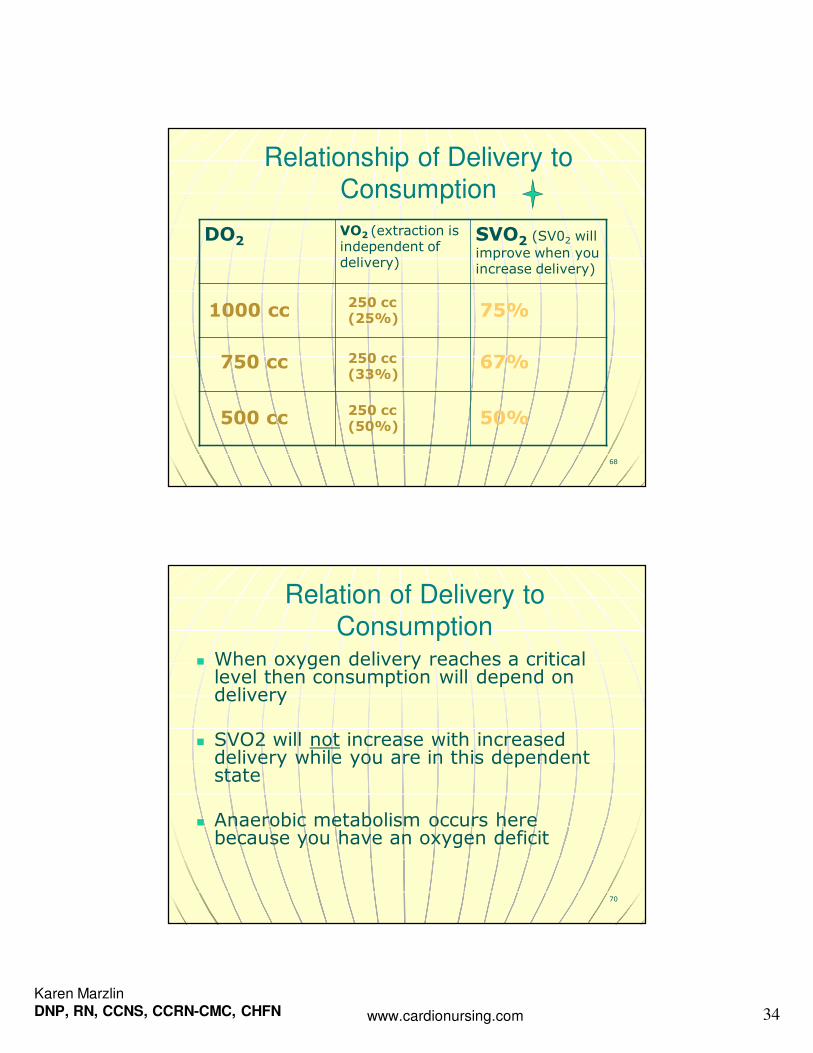
Relationship of Delivery to
Consumption
DO2VO2 (extraction is independent of delivery)
SVO2 (SV02 will
improve when you increase delivery)
1000 cc250 cc (25%) 75%
750 cc 250 cc (33%)
67%
500 cc250 cc(50%)
50%
70
Relation of Delivery to
Consumption� When oxygen delivery reaches a critical level then consumption will depend on delivery
� SVO2 will not increase with increased delivery while you are in this dependent state
� Anaerobic metabolism occurs here because you have an oxygen deficit
Karen MarzlinDNP, RN, CCNS, CCRN-CMC, CHFN www.cardionursing.com 35
71
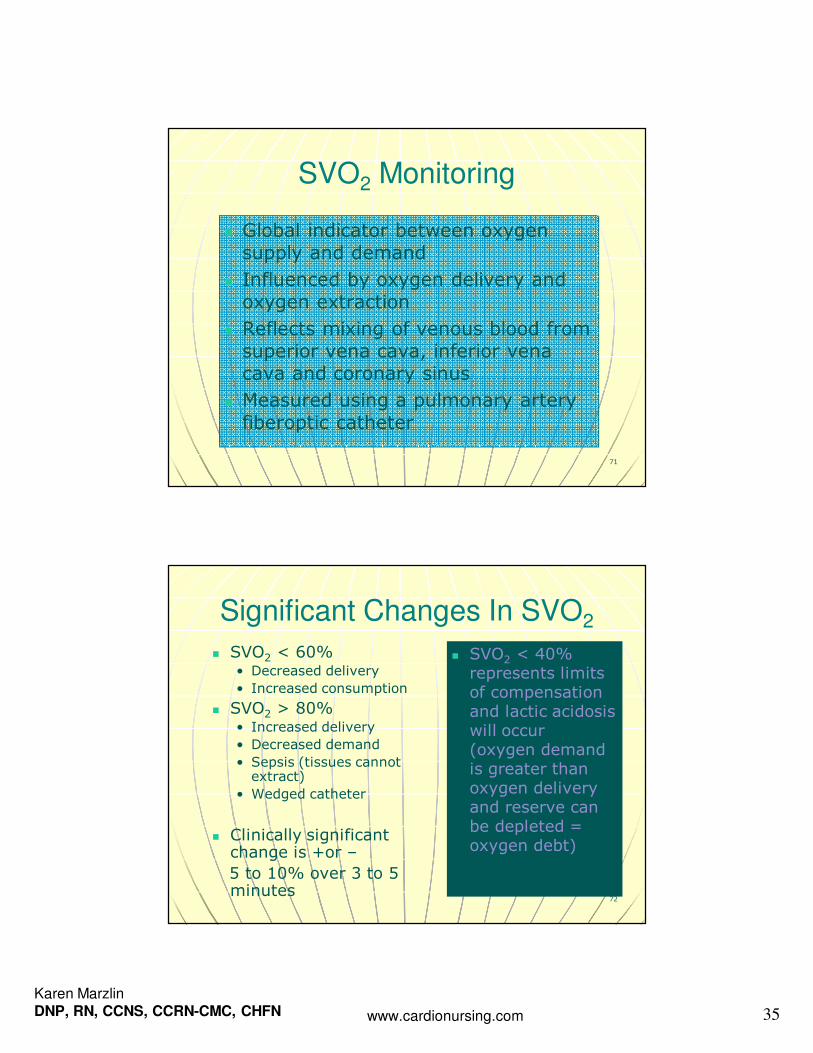
SVO2 Monitoring
� Global indicator between oxygen supply and demand
� Influenced by oxygen delivery and oxygen extraction
� Reflects mixing of venous blood from superior vena cava, inferior vena cava and coronary sinus
� Measured using a pulmonary artery fiberoptic catheter
72
Significant Changes In SVO2
� SVO2 < 60% • Decreased delivery
• Increased consumption
� SVO2 > 80%• Increased delivery
• Decreased demand
• Sepsis (tissues cannot extract)
• Wedged catheter
� Clinically significant change is +or –
5 to 10% over 3 to 5 minutes
� SVO2 < 40% represents limits of compensation and lactic acidosis will occur (oxygen demand is greater than oxygen delivery and reserve can be depleted = oxygen debt)
Karen MarzlinDNP, RN, CCNS, CCRN-CMC, CHFN www.cardionursing.com 36
73
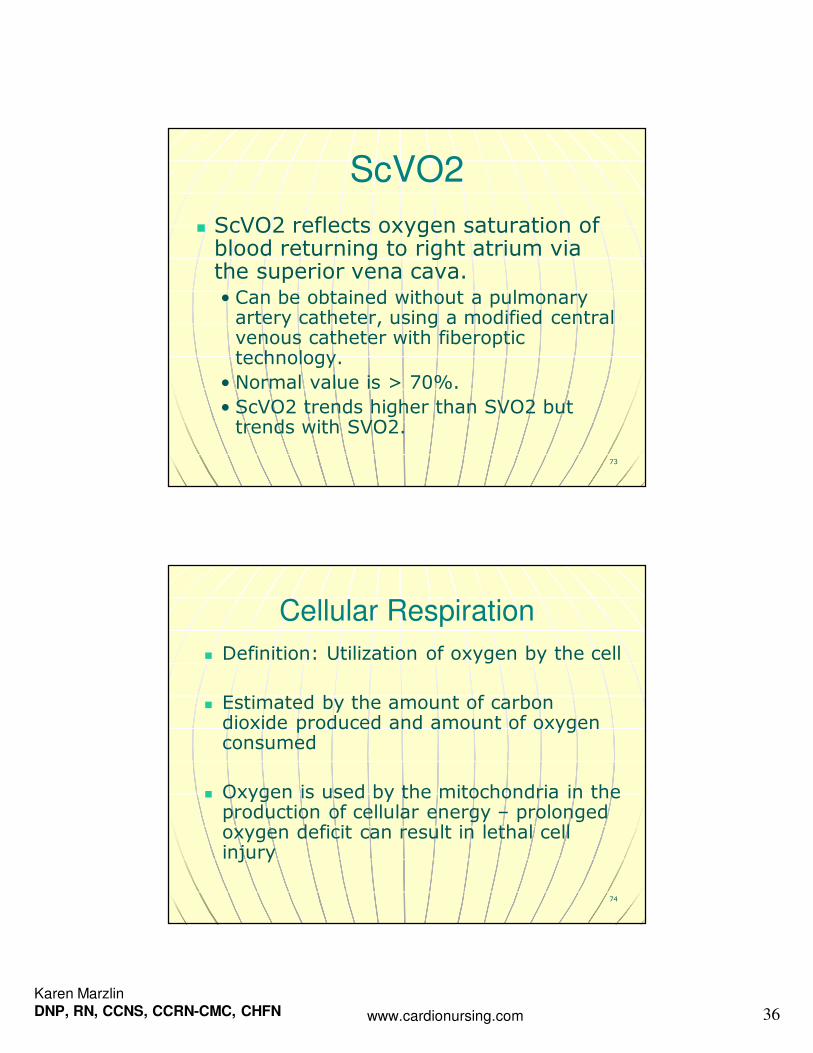
ScVO2
� ScVO2 reflects oxygen saturation of blood returning to right atrium via the superior vena cava. • Can be obtained without a pulmonary artery catheter, using a modified central venous catheter with fiberoptic technology.
• Normal value is > 70%.
• ScVO2 trends higher than SVO2 but trends with SVO2.
74
Cellular Respiration
� Definition: Utilization of oxygen by the cell
� Estimated by the amount of carbon dioxide produced and amount of oxygen consumed
� Oxygen is used by the mitochondria in the production of cellular energy – prolonged oxygen deficit can result in lethal cell injury
Karen MarzlinDNP, RN, CCNS, CCRN-CMC, CHFN www.cardionursing.com 37
75
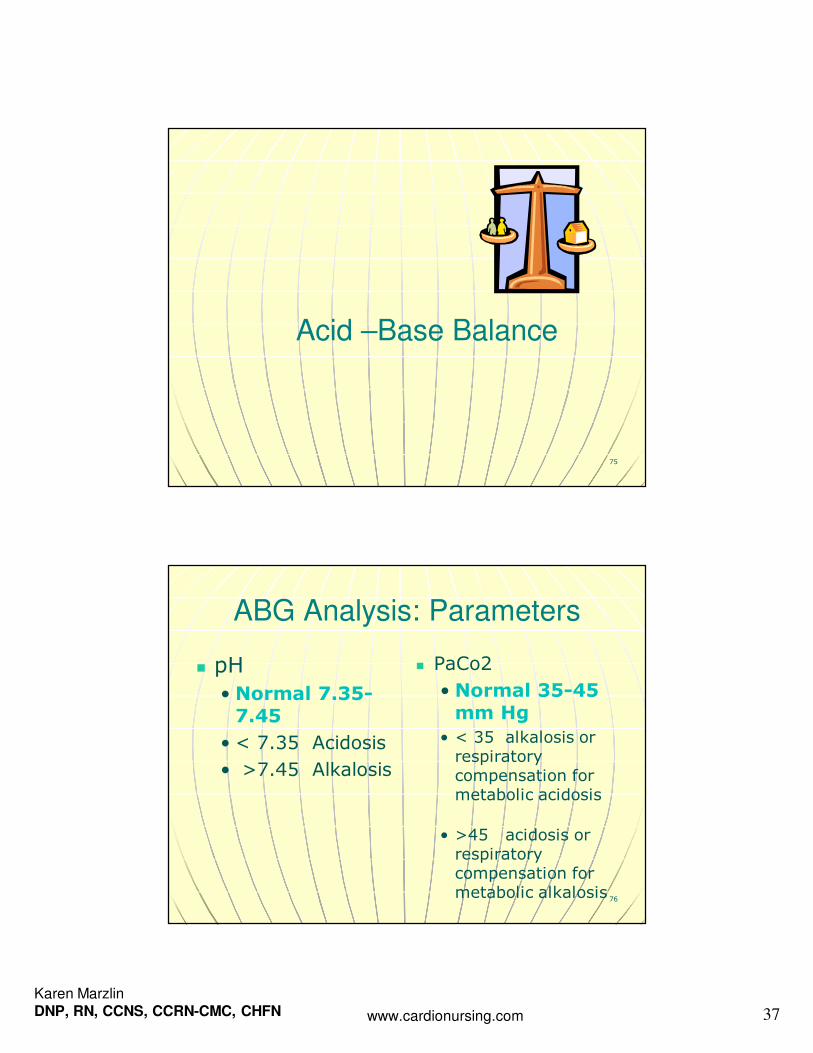
Acid –Base Balance
76
ABG Analysis: Parameters
� pH
• Normal 7.35-7.45
• < 7.35 Acidosis
• >7.45 Alkalosis
� PaCo2
• Normal 35-45 mm Hg
• < 35 alkalosis or respiratory compensation for metabolic acidosis
• >45 acidosis or respiratory compensation for metabolic alkalosis
Karen MarzlinDNP, RN, CCNS, CCRN-CMC, CHFN www.cardionursing.com 38
77
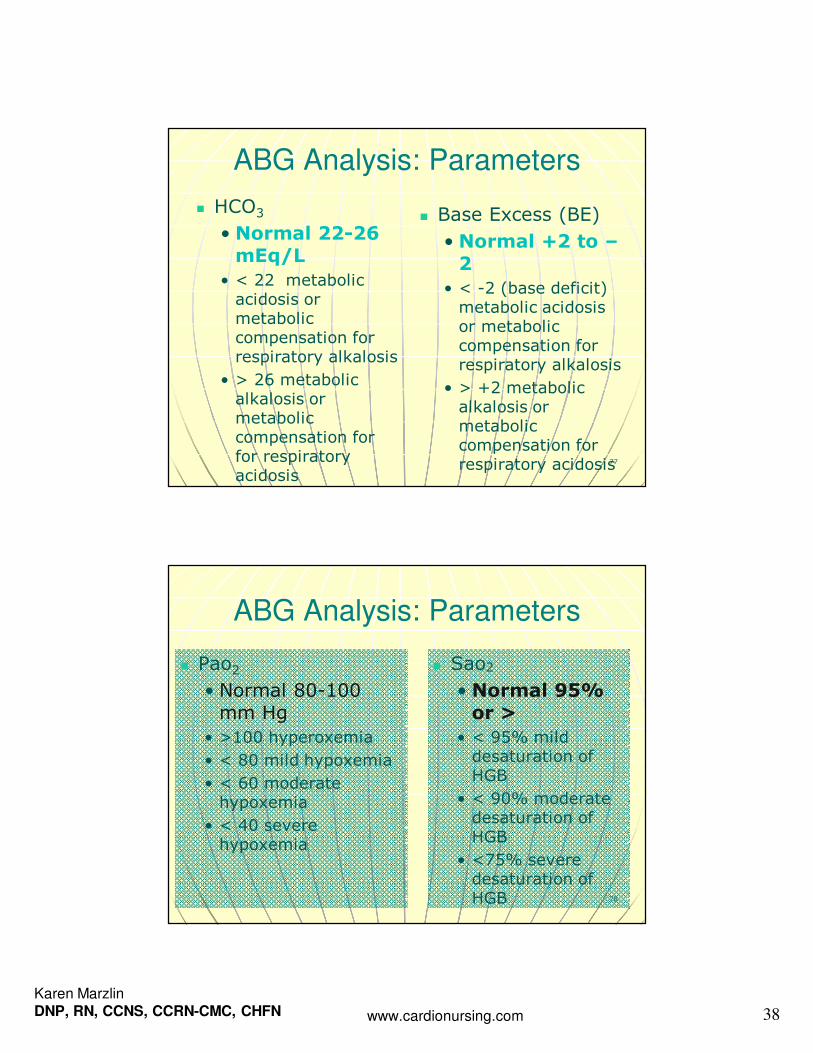
ABG Analysis: Parameters
� HCO3
• Normal 22-26 mEq/L
• < 22 metabolic acidosis or metabolic compensation for respiratory alkalosis
• > 26 metabolic alkalosis or metabolic compensation for for respiratory acidosis
� Base Excess (BE)
• Normal +2 to –2
• < -2 (base deficit) metabolic acidosis or metabolic compensation for respiratory alkalosis
• > +2 metabolic alkalosis or metabolic compensation for respiratory acidosis
78
ABG Analysis: Parameters
� Pao2• Normal 80-100 mm Hg
• >100 hyperoxemia
• < 80 mild hypoxemia
• < 60 moderate hypoxemia
• < 40 severe hypoxemia
� Sao2
• Normal 95% or >
• < 95% mild desaturation of HGB
• < 90% moderate desaturation of HGB
• <75% severe desaturation of HGB
Karen MarzlinDNP, RN, CCNS, CCRN-CMC, CHFN www.cardionursing.com 39
79
Compensation
An acidosis or alkolosis for which there has been compensation causes the pH to return to the normal range while leaning toward the initial disorder.
The body never overcompensates. A non leaning pH with two abnormal indicators suggests a mixed disorder (one alkalotic and one acidotic process).
80
Anion Gap
� The anion gap is used to help determine the cause of the patient’s metabolic acidosis.
� Anion Gap = Na+ - [Cl- +HCO3-]� A normal anion gap is 12 + or – 4 mEq/L.
� An increased anion gap typically indicates an increased concentration of anions other than Cl- and HCO3-. • Lactic acidosis • Ketoacidosis • Renal retention of anions
Karen MarzlinDNP, RN, CCNS, CCRN-CMC, CHFN www.cardionursing.com 40
More on Anion Gap
� Most common etiology of normal anion gap acidosis: Diarrhea.
� Second most common: Renal tubular acidosis.
� Both result in a loss of bicarbonate ions.
� To compensate there is an increase in plasma chloride.
� Normal ion gap acidosis is often referred to as hyperchloremic acidosis.
81
82
Common Causes of Respiratory
Acidosis
� Depression of respiratory control centers
� Neuromuscular disorders
� Chest wall restriction
� Lung restriction
� Airway obstruction
� Pulmonary parenchymal disease
Karen MarzlinDNP, RN, CCNS, CCRN-CMC, CHFN www.cardionursing.com 41
83
Common Causes of Respiratory
Alkalosis
� Central nervous system disorders
� Drugs
� Hormones
� Bacteremia
� High altitude
� Over mechanical ventilation
� Acute asthma
� Pulmonary embolism
84
Common Causes of Metabolic
Acidosis
� Ingested toxic substances
� Loss of bicarbonate ions
� Lactic acidosis
� Ketoacidosis
� Renal failure
Karen MarzlinDNP, RN, CCNS, CCRN-CMC, CHFN www.cardionursing.com 42
86
Practice ABGs
87
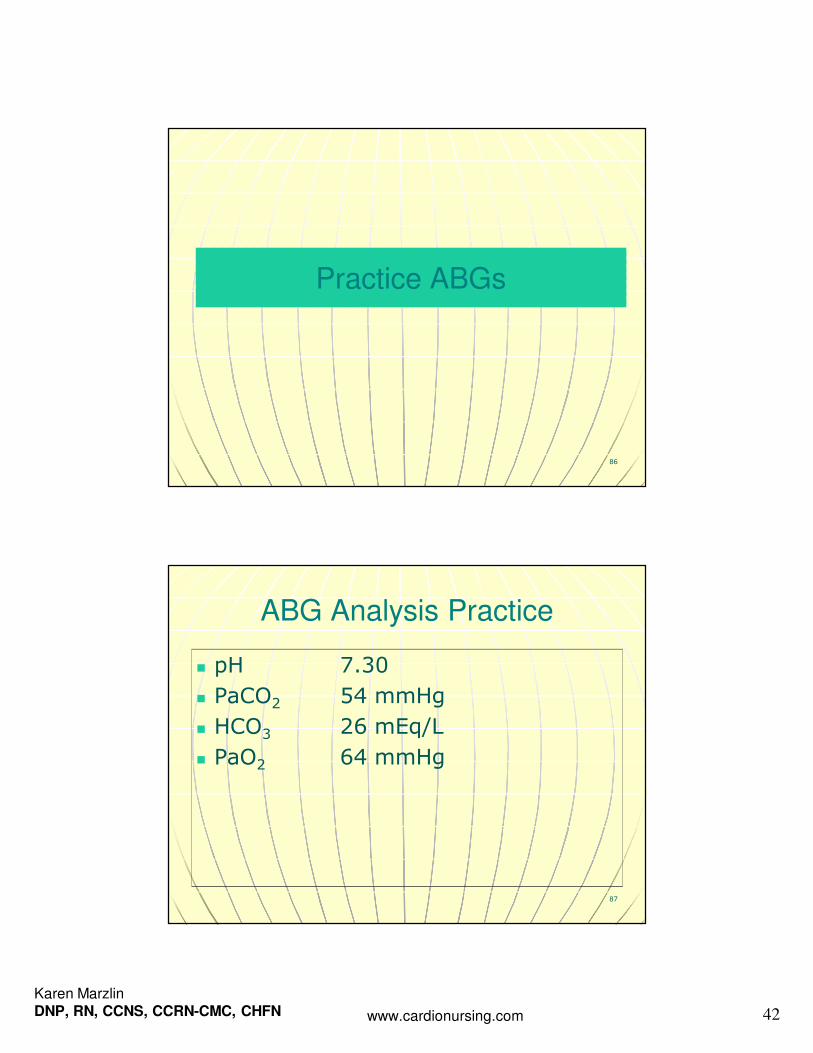
ABG Analysis Practice
� pH 7.30
� PaCO2 54 mmHg
� HCO3 26 mEq/L
� PaO2 64 mmHg

Karen MarzlinDNP, RN, CCNS, CCRN-CMC, CHFN www.cardionursing.com 43
88
ABG Analysis Practice
� pH 7.48
� PaCO2 30 mmHg
� HCO3 24 mEq/L
� PaO2 96 mmHg
89
ABG Analysis Practice
� pH 7.30
� PaCO2 40 mmHg
� HCO3 18 mEq/L
� PaO2 85 mmHg

Karen MarzlinDNP, RN, CCNS, CCRN-CMC, CHFN www.cardionursing.com 44
90
ABG Analysis Practice
� pH 7.50
� PaCO2 40 mmHg
� HCO3 33 mEq/L
� PaO2 92 mmHg
91
ABG Analysis Practice
� pH 7.35
� PaCO2 54 mmHg
� HCO3 30 mEq/L
� PaO2 55 mmHg
Karen MarzlinDNP, RN, CCNS, CCRN-CMC, CHFN www.cardionursing.com 45
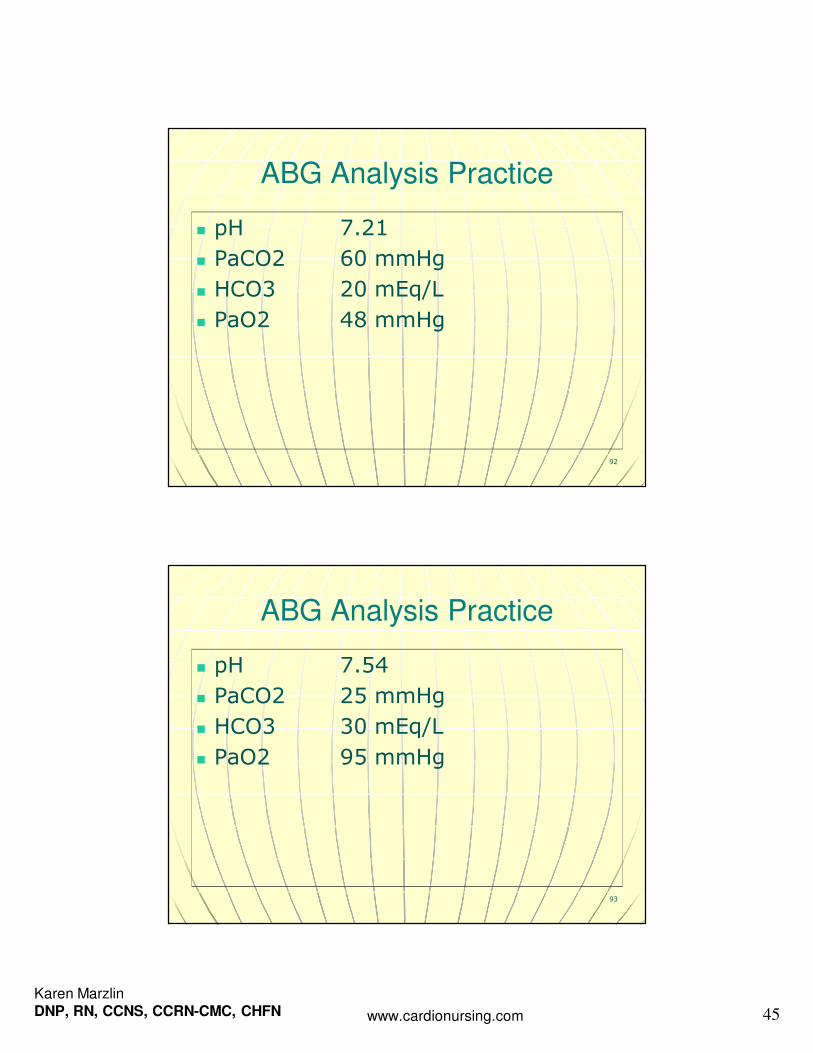
92
ABG Analysis Practice
� pH 7.21
� PaCO2 60 mmHg
� HCO3 20 mEq/L
� PaO2 48 mmHg
93
ABG Analysis Practice
� pH 7.54
� PaCO2 25 mmHg
� HCO3 30 mEq/L
� PaO2 95 mmHg

Karen MarzlinDNP, RN, CCNS, CCRN-CMC, CHFN www.cardionursing.com 46
94ReflectionReflectionReflectionReflection