Embed Size (px)
Citation preview
1
Key Drivers of Foreign Firms’ Locational Choice: Knowledge Nodes, Cross-Cultural
Differences and Investment Motivation
(A Quantitative Case Study for New York City)
CLIFF WYMBS
Baruch College/CUNY 123 Pearl Street
Beach Haven, N.J. 08008
May 1, 2001
(P) 609-492-0156 (F) 609-492-3493
(E-mail) [email protected]
DRAFT

2
Key Drivers of Foreign Firms’ Locational Choice: Knowledge Nodes, Cross-Cultural
Differences and Investment Motivation
(A Quantitative Case Study for New York City)
Abstract: We identified the sectors of finance, services and retail/wholesale as key
global “knowledge nodes” for New York City. We found that firms from
culturally distance countries that pursued “asset augmenting” behaviors
located closer to establish New York City knowledge nodes, than firms
from culturally similar countries that pursued asset exploiting behaviors.
The analysis of a micro-knowledge node, banking, revealed similar but
more precise results.
Key Words: Locational Choice
Knowledge Node
Culture
3
The concept of industrial clustering is grounded in the study of economic geography
Marshall (1916). In effect, positive knowledge externalities accrue to a region because no single
firm can fully capture all the returns associated with its innovation process. The resulting
knowledge spillovers attract new firms to the region and further perpetuate the knowledge
accumulation/spillover process. The realization that intellectual capital and innovation are the
main engine of wealth creation in today’s economy, and the fact that globalization is widening
the location options available to firms, has highlighted the need to simultaneously study
geography of knowledge creation and the strategic location choices of firms (Dunning, 1999).
Within the last decade, related concepts of industrial clustering, regional production systems,
learning regions and global innovation centers have been vigorously explored from many
academic disciplines: Industrial organization economists, (Porter, 1990; Enright, 1999); regional
economists (Florida, 1998; Storper, 1995); city and regional planners (Saxenian; 1998;
Markusen, 1994; Bagchi-Sen & Wheeler, 1989) and international business economists (Dunning,
1999; Audretsch, 1999). Depending on the discipline, the level of analysis has varied widely -
across sectors, across countries, Porter, (1990), to a particular section in a particular city,
Saxenian, (1998); however, the common threads observed in each were a spatial stickiness of
economic activity and the increased importance of innovative capacity within a limited
geographic confine. Because of conceptual difficulties and data constraints, the vast majority of
this research has focused on specific manufacturing sectors (Schoenberger, 1994; Coughlin,
1992; Shaver, 1995); and high tech, research-intensive areas (Saxenian, 1994, 1998; Florida,
1995; Dunning & Narula, 1995). Only recently has regional cluster analysis been applied to
explain knowledge intensive service sectors (Enright 1999; Moore & Birkinshaw 1998; Bagchi-
4
Sen & Sen, 1997, Nachum, 2000), the largest and fastest growing segment of developed
countries’ economies (Wymbs, 2000).
We want to extend these lines of research by performing a quantitative micro-regional
analysis that focuses on how certain characteristics of foreign firms (investment motivation and
culture) affect their attraction to certain knowledge nodes in a global city (New York). Existing
literature does not refer to such potential variation but usually treats all foreign firms alike, which
is, of course, a simplification of reality. The paper now discusses New York City knowledge
nodes, followed by theory and hypotheses, methods, results and future research.
KNOWLEDGE NODES
First we justify the choice of a New York City as a reasonable level of analysis, then we
broadly define the N.Y.C. knowledge nodes and finally we discuss the unit of analysis.
Level of Analysis
DelaMothe & Paquet (1994; 1996) observed that an economy is made more dynamic by
information flows, knowledge, competence and capabilities, and small communities of practices
and that the new relevant unit of analysis has to be the basis to understand innovation. It cannot
be at the firm level because it is too idiosyncratic, nor can it be at the national level because it
tends to mask more information than it reveals. Krugman (1991, 9. 57) observed that “States
aren’t really the right geographically units” because they also are at too high a level to capture
innovative activity. Florida (1998) finds that regions are becoming the focal point of knowledge
creation and learning in the new global, knowledge intensive, capitalism. Learning regions
become the collectors and repositories of knowledge and ideas, and provide an underlying
environment or infrastructure that facilitates the flow of knowledge ideas and learning.
Similarly, Saxenian (1998) argues that it is the region and its relationships, rather than the firm,
that defines opportunity for individual and collective advancement. Porter (1990) uses the more

5
geographically restrictive unit “clusters” to define innovative industry activities linked though
vertical (buyer/seller) or horizontal (common customers, technology, channels) relationships.
Audretsch, (1999) described an econometric model that supports a close relationship between the
availability of knowledge resources in a city and its innovative performance. Jacobs (1969)
found that cities themselves are a source of considerable innovation. With regard to specific
competitive enhancing factors: Wolfe (2000) and Dunning (1994) found that a skilled labor pool
is important and universities are a key contributor to knowledge node formation in service
industries: Amin & Thrift (1993) highlighted the importance of related industries, e.g., securities
and commodities, and common factors external to the firm but relevant to the industry, e.g.,
stock exchanges and MNE headquarters, as factors that add to the competitiveness of a node:
Etzioni (1996) found that inter-firm knowledge sharing within a node is facilitated by common
core values and objectives of a particular industry. Several studies cited the importance of
relational variables that enhance the competitiveness of a node: Nohria & Garcia-Pont discussed
strategic linkages, Chen & Chen (1998) referenced network linkages and Porter & Fuller (1994)
indicated the importance of reputation.
N.Y.C. Knowledge Nodes
We define knowledge nodes, similar to Enright (1995) and Porter (1990), as localized
centers of excellence where agglomeration economies and innovative capacity concentrates.
Identifying these nodes for New York City was more anecdotal than scientific, but we believe
the evidence presented below supports the above authors findings and thus provides a reasonable
justification for their inclusion.
In 1998, New York City was the United States’ single strongest magnet for foreign
investment and is generally regarded as the most influential business location in the world
(Directory, 1999). It has over 3.2 million skilled workers with twenty-five percent having at
6
least a four-year college degree. There are over 91 degree-credit institutions in NYC, over
360,000 students enrolled in N.Y.C. colleges and universities and over 22,000 masters and 1750
doctoral degrees granted each year (IDA, 1999). In 1996, the output per N.Y.C. worker was
$101,534, almost seventy percent higher than the average United States output per worker of
$63,902 (IDA, 1999).
In 1998, forty-six of the Fortune 500 companies located their headquarters in N.Y.C.
(Fortune, 1998). (This is more than the combined total of the next three largest cities.) In
service sectors, N.Y.C. dominance is even more evident.
“N.Y.C. is the undisputed global hub of the financial, new media, entertainment, services
and fashion industries” (IDA, 1999, p12). The following examples support this bold assertion:
Financial. New York is the corporate headquarters for four of the ten largest U.S.
insurance firms; four of the ten largest banks; nine of the ten largest United States securities
firms and six of the world’s top ten securities firms (Crains, 1998). In fact, the New York Stock
Exchange accounted for 27.8 percent of the world’s total in 1997.
Services. New York is the headquarters for three of the top five United States accounting
firms; six of the nations’ ten largest consulting firms; and the vast majority of the world’s largest
law firms (Crains, 1998). Also included as part of services is entertainment/communications/
media. New York is the home of all the major United States television networks – ABC, NBC,
CBS, and FOX, as well as 20 cable television companies and five of the top six music
companies; N.Y.C is the largest publishing center in the United States; its 2,601 new media
companies (concentrated in lower Manhattan) have doubled employment to 55,000 people since
1995 and now account for almost half of the region’s new media business of $5.7 billion.

7
Fashion industry. In 1997, this industry employed 225,000 people, accounted for $27
billion in annual revenues and helped to attract 23,000 wholesale buyers. New York is the home
to more than 5,100 showrooms and 10,000 retail stores (IDA, 1999).
Specialty manufacturing. New York accounts for more than 27,000 people employed in
the combined areas of fine and costume jewelry, the diamond trade and integrated
manufacturing, and other segments of the jewelry industry.
Construction. New York possesses both world-class skilled construction engineering
firms and almost 100,000 construction workers (IDA, 1999). Its firms have constructed three of
the largest building in the world.
Transportation. New York City’s transportation hub provides businesses with access to
world markets and permits them to easily tap into world markets (Directory, 1999). New York
City-area airports handled 2.8 million metric tons of cargo per year, more than any other airports
in 1997. New York area ports handle 55 percent of the U.S. North Atlantic containerized cargo.
Over 84 million passengers passed through New York City airports in 1997 and there are over
2,200 flights to 286 cities around the world every day.
In the late 1980s, Orr (1993) identified fdi as becoming an increasingly important source
of economic activity in N.Y.C. By the late 1990s, N.Y.C. received about one quarter of all fdi
flowing into retail trade in the United States, one third of the fdi in business services and 15
percent of foreign investment in finance, insurance and real estate (IDA, 1999). Clearly, N.Y.C.
has global knowledge nodes in services, finance, and wholesale/retail and regional knowledge
nodes in manufacturing, transportation and construction related activities.
Unit of Analysis
Building on Dunning & Morgan (1971), who studied the locational clustering of foreign
firms in London and Vernon (1960), who studied economic activity in the New York-New

8
Jersey metropolitan area, we perform a more detailed analysis that studies the factors that
influence individual firm’s choices to locate around established knowledge centers in N.Y.C.
The critical geographic inputs that drove the study were firm and knowledge node locations.
The physical locations of almost 2,000 foreign firms (the closest to the universe of
foreign firms in N.Y.C. ever collected) were collected in 1998 by the Weissman Center for
International Business at Baruch College, City University of New York (Directory, 1999).
Interns working in the Weissman Center undertook fax inquiries and follow-up calls to verify
all enterprises listed in their 1997-98 directory. Consultants and foreign government trade
offices were then asked to review and amend not only their own entries, but also the entries for
all companies from their country. Bi-national chambers were then requested to provide listings
of their foreign-based members in N.Y.C. Finally, numerous web-sites, trade associations lists
and even individual building directories were examined for firms that belonged in the directory.
Despite these efforts the directory recognizes that there may be errors and omissions (Directory,
1999). As part of this effort, company sector information was also obtained. Unique latitude
and longitude locations were then obtained for each foreign firm located in New York City by
the use of the Street Map Software Program.
Overall New York City geographic centers for knowledge nodes were obtained through a
modified Delphi Approach1 (Goldfinger, 1993) using New York City industry experts: An editor
from a major New York business magazine, a regional planner from a bi-state agency, a New
York City economic consultant and industry experts. Each was asked to provide their estimate
for the geographic center for the following major industry groups: Manufacturing; business
1 The Delphi Approach is an iterative estimation procedure where experts’ opinions are shared and recalibrated. Each Delphi expert can update his/her estimate based on the group’s estimate. Convergence is usually achieved after only a few iterations (Goldfinger, 1993).
9
services; finance, insurance and real estate, transportation and public utilities; construction;
wholesale/retail; government. After the first round of estimates was provided, they were
discussed and a consensus was obtained for each industry group. Industry experts were
consulted to obtain micro-knowledge locations for the banking, securities and insurance sectors.
We then calculated the latitude and longitude coordinates for the location of each foreign
firm in N.Y.C. and obtained estimates from city experts of specific N.Y.C. knowledge nodes.
The geographic distance between the foreign firm’s location and the center of the N.Y.C.
knowledge node was then calculated.
THEORY AND HYPOTHESES
Moore & Birkinshaw (1998) found that service firms, unlike manufacturing ones,
typically replicate the entire value chain in each country of operation, rather than centralizing
certain parts in low cost countries. The centrifugal force of value chain replication will attract
firms to knowledge centers, as opposed to the Shaver & Flyer (2000) finding that large
manufacturing firms will locate away from knowledge centers to improve profits. We have
previously demonstrated this effect when we described the creation of service-based knowledge-
nodes for N.Y.C. We believe this paper raises two interesting hypotheses to explain the variation
in attraction to knowledge nodes by foreign investors – the motivation for investment and the
cultural distance between home and host countries. It is novel in that it uses geographic distance
between knowledge nodes and firm sites as an operation for the dependent variable.
With regard to identifying culture as a factor that influences location choice, we first
reviewed the analyses of (Contractor & Kundu, 1998; Erramilli & Roa, 1993; Kogut & Singh,
1988; Adler, 1997); however, they focused mostly on the entry mode decision rather than the
firm’s current position that depends on entry mode, growth and possible relocation. Because we
were attempting to explain an outcome that occurred over time and wanted to avoid problems

10
associated with simultaneity estimation, we chose to use a time insensitive measure of culture
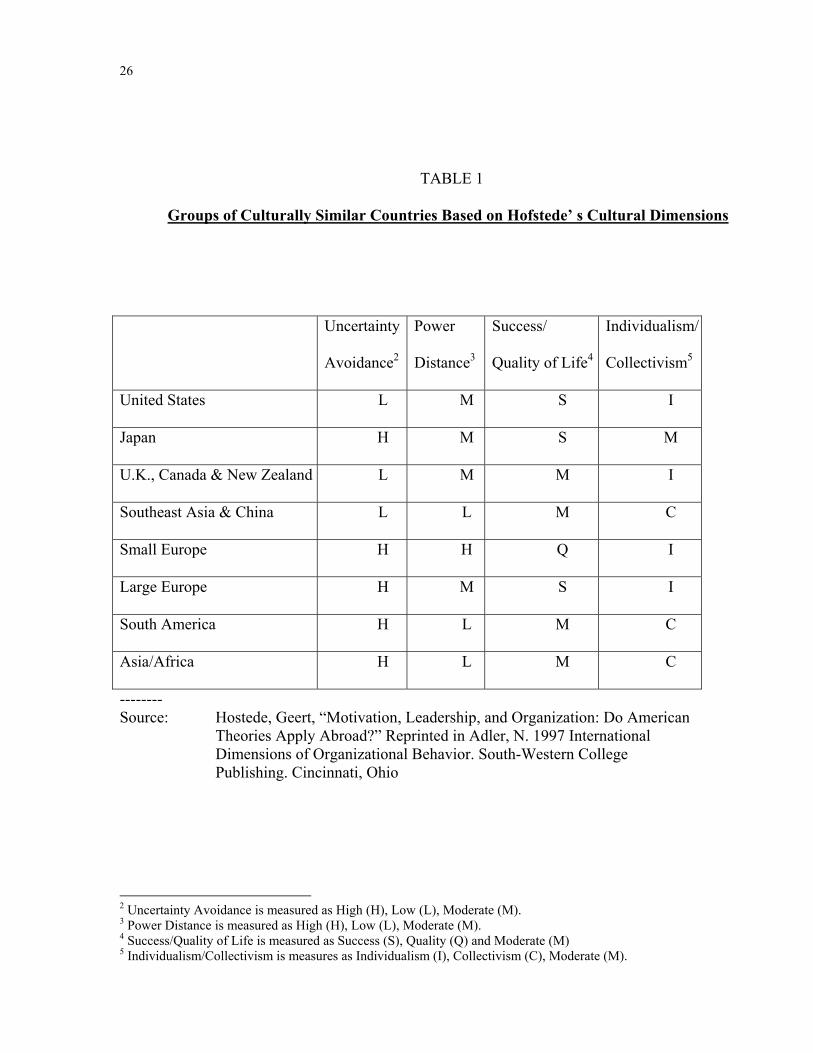
identified by Hofstede (1980) and enhanced by Adler (1997). The four dimensions in
Hofstede’s (1980) seminal work were: Individualism/collectivism (do people define themselves
as individuals or part of a group); Power distance (the extent to which less powerful members of
a group accept an unequal distribution of power); Uncertainty avoidance (the extent to which
people in a society feel threatened by ambiguity and avoid it); Career success/quality of life (the
dominant value in career success is assertiveness and materialism and not emphasizing people
concerns). These were used to create five relatively homogenous foreign country groups
(described below) with approximately an equal number of firms in each.
We believe that the uncertainty avoidance dimension is the most critical one to foreign
locational choice. Managers from high uncertainty avoidance countries feel threatened by
ambiguity, fear making wrong decisions and are risk averse. The safe choice for these
managers would be to have a foreign location close to an established knowledge node.
Alternatively, we would expect managers from countries who value the quality of life
dimension to be less influenced by business factors and to locate their businesses closer to
airports to travel home more easily or closer to city’s main center of social/cultural activities.
With regard to the individualism/collectivism and power distance dimensions, they relate more
to members’ status in the group, not between the group and the home office. Therefore, they
would have less direct effect on the foreign locational choice decision.
Though we could have used individual Hofstede measures for each country and each
dimension, we believe that the use of Adler (1997) grouping of countries would provide us
sufficient variation in the independent variable while minimizing the number of variables. An
explanation of each grouping follows. Managers within the United Kingdom, Australia, New
Zealand and Canada exhibited strong individualism, weak uncertainty avoidance and moderate

11
power distance tendencies and desire for career success. (These characteristics were very similar
to those of United States managers who exhibited weak uncertainty avoidance, strong desire for
success, strong individualistic tendencies and moderate power distance.) Managers from
oriental cultures (China, Taiwan, Singapore, Korea, Hong Kong and Southeast Asia) seemed to
show quite different tendencies, namely, they exhibited strong collectivistic behaviors, low
power distance, weak uncertainty avoidance and limited desire for career success. Managers
from the Large European countries of France, Germany and Italy exhibited strong uncertainty
avoidance, individualism and desire for success and moderate power distance. Managers from
the remaining European countries, labeled Small European, generally showed individualist
tendencies and strong uncertainty avoidance, power distance, and a desire for quality of life.
South American country managers exhibited collectivist tendencies, large power distance,
strong uncertainty avoidance and strong career success. Asians from the subcontinent and
African managers were the least homogenous group and the characteristics exhibited moderate
collectivist tendencies, large power distance, strong uncertainty avoidance and moderate career
success. Japanese managers showed strong uncertainty avoidance and desire for success and
moderate power distance and marginal collectivistic tendencies. Table 1 summarizes these
results.
********************
Put Table 1 here
********************
In general, we would expect firms from countries of different cultures than that of the
United States to locate their firms near knowledge nodes in order to gain the maximum tacit
knowledge transfer and compensate for cultural impediments associate with such transfers. The
Japanese culture met these criteria and the Japanese business practices are viewed as different
12
than the U.S. ones. Therefore, the Japanese cultural attributes were used as the baseline for
analysis. The other country cultural-distance measures were then compared with it.
H1: Firms that are the most culturally distant from the United States (particularly
with regard to the uncertainty avoidance dimension) will likely locate closer to
knowledge nodes to gain maximum knowledge spillover.
Dunning’s (1977) and Hymer (1980) were the first to point out that firms use fdi to
exploit firm’s ownership specific assets in foreign countries. Wesson (1993) drew an interesting
distinction between ownership advantages that are “asset exploiting” and those that are “asset
augmenting.” Ownership advantage which is asset exploiting involves firms extracting
monopoly profits from foreign markets by using their exclusive or privileged access to specific
intangible assets, e.g., technology, management skills, usually created in the home market. With
asset augmenting ownership advantage, the foreign investment upgrades the asset base of both
the recipient country and sending countries’ firms. Similarly, Nohria & Garcia-Pont (1991) put
forth strategic link theory and Johanson & Mattson (1987), network theory. Each asset
augmenting theory looks to enhance, maintain or restore the firm’s competitiveness in a global
market rather than attempting to maximize its extraction of monopolistic rents.
A precise way of identifying asset exploiting or asset augmenting firm behaviors would
be though a questionnaire. Also, a questionnaire would permit the collecting of interesting
control variable such as size and age of investment. However, we believe classifying industries
based on historical tendencies is a reasonable approximation to begin the analysis of motivation
variables. We are aware that finer levels of disaggregation, i.e., below the industry-level, will
likely provide more significant variables, but as a first cut we believe an industry-level analysis
will produce interesting and meaningful results.
13
Asset exploiting service firms: They seek out markets for their activities because these
firms have an ownership asset that uniquely differentiates their services, e.g., a world renowned
bridge designer. Asset exploiting firms are not required to collocate near other similar firms.
Asset exploiting sectors include firms in the following areas: wholesaling/retailing (firms selling
uniquely designed fashion products); transportation (firms bringing cargo or people to the
foreign market); construction (firms designing and or managing construction projects); and
manufacturing (firms making unique products).
Asset augmenting service firms: They seek to learn from or network with other firms
already present and dominant in the market. These firms depend on tacit knowledge transfer and
the importance of geographical proximity in the learning regions (Storper, 1995). Asset
augmenting sectors include firms in the following areas: business services that facilitate general
business activities (law, accounting, consulting, advertising, media) and finance that includes the
main business transactional areas of banking, insurance, investment banking, and securities.
H2: Foreign firms in N.Y.C. are more likely to locate closer to N.Y.C. knowledge
nodes if they are pursuing “asset augmenting” behaviors because tacit knowledge is
best transmitted through close personal contact.
METHODS
Measures
The data was obtained from the New York City Economic Development Agency (IDA,
1999), Crains’ Market Facts publications (Crains, 1998), and Weissman Center’s International
Business Directory (WCIBD).
Dependent Variable
The construction of the dependent variable, the distance (measured in miles) between a
foreign firm’s location and the New York City’s knowledge nodes required several steps. First,

14
the location of each firm from the WCIBD was converted into map coordinates. Next, the
modified Delphi estimates of the New York City knowledge nodes were converted to map
coordinates. Distance between each firm’s location and the appropriate knowledge node was
then calculated. The resulting distances are a continuous dependent variable.
Independent Variables
Country Culture. Country culture was a set of dummy variables. The most foreign
culture to the U.S., Japan, was coded “0” for each of the culture variables. A separate dummy
variable was created for English-based Countries, Large European Countries, Small European
Countries, South American Countries, Southeast Asian Countries and Asian/African Countries.
If Hypothesis 1 holds, we expect each dummy to be significant and positive because as the
degree of foreignness declines, the need to locate near to the knowledge node to obtain tacit
knowledge is reduced.
Asset Augmenting. The “asset augmenting” dummy variable was coded as a “1” if the
firm was in an “asset augmenting” industry group and a “0” if it represented a firm in an “asset
exploiting” group. If Hypothesis 2 holds, we would expect a negative sign for the “asset
augmenting” variable because the requirement to share tacit knowledge would be greater than
the requirement to locate close to markets that would be associated with “asset exploiting”
behavior (Wesson, 1993; Nelson & Winters 1981). The previously presented background
N.Y.C. data supports the designation of services and finance, insurance and real estate as “asset
augmenting” groups. Foreign firms recognize U.S. firms located here as being in the forefront
of knowledge creation and many of the U.S. firms are regarded as the best in the world.
Foreign firm behaviors in the remaining industry groups, i.e., wholesale/retail trade,
manufacturing, construction and transportation and public utilities, were classified as “asset
15
exploiting” because they are primarily seeking to exploit markets and earn a return on their
home country’s rare and unique assets (Barney, 1991).
Control Variable
A dummy variable was introduced for locations that were designated government. The
majority of government office locations in New York City are associated with city government
and are located downtown, while the majority of the foreign government locations are likely to
located near the United Nations. Therefore, we used a dummy variable to isolate this effect and
the intercept term represents non-government, Japanese, asset exploiting firms.
Estimation Method
A contingency table and chi square analysis were used to provide a better understanding
of the raw data. A comparison of mean distances (measured in miles from the established
knowledge nodes) was used to determine if there were significant differences between asset
augmenting and asset exploiting investment behaviors for each culturally similar country
grouping. Ordinary least squares (OLS) regression was used as an overall test of the hypotheses
and was used to measure interaction effects between culture and investment motivations.
RESULTS & DISCUSSION
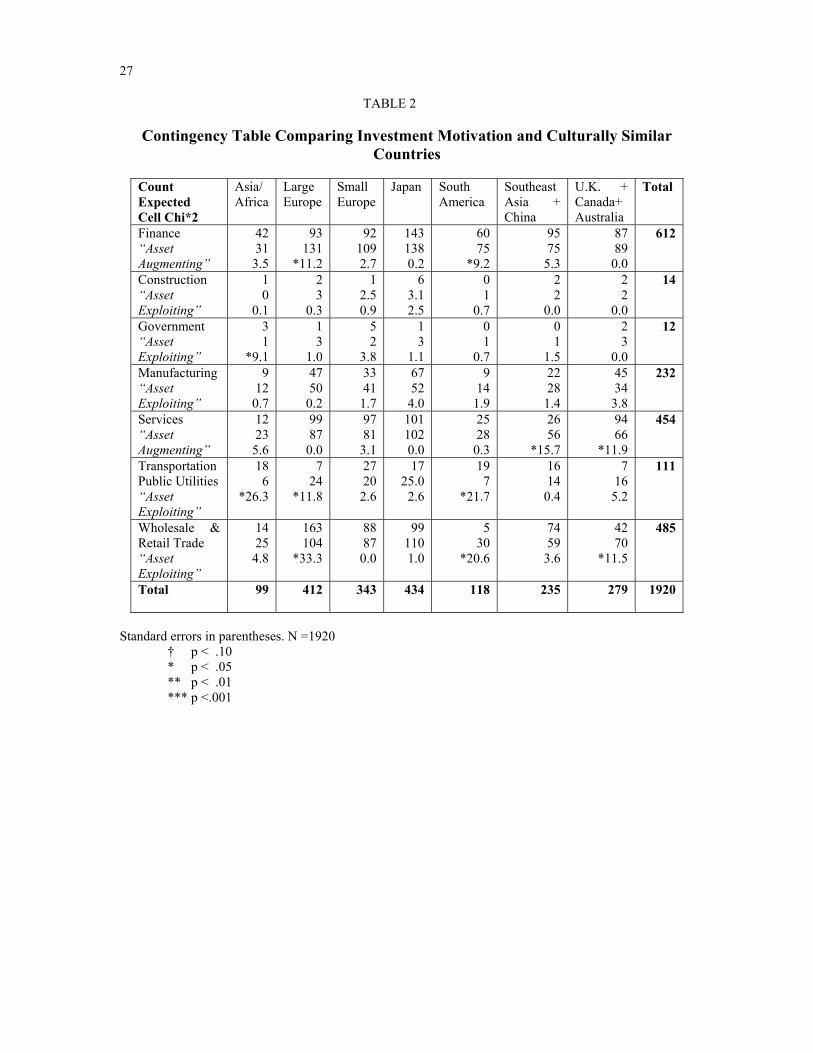
The results of the analysis are presented in Tables 2-5. In the first area, Descriptive Data,
Table 2 reports the number of firms for each of seven culturally similar country groups and for
each of the seven knowledge nodes for N.Y.C. It highlights areas where the actual number of
firms was significantly greater or less than was statistically expected. In the second area,
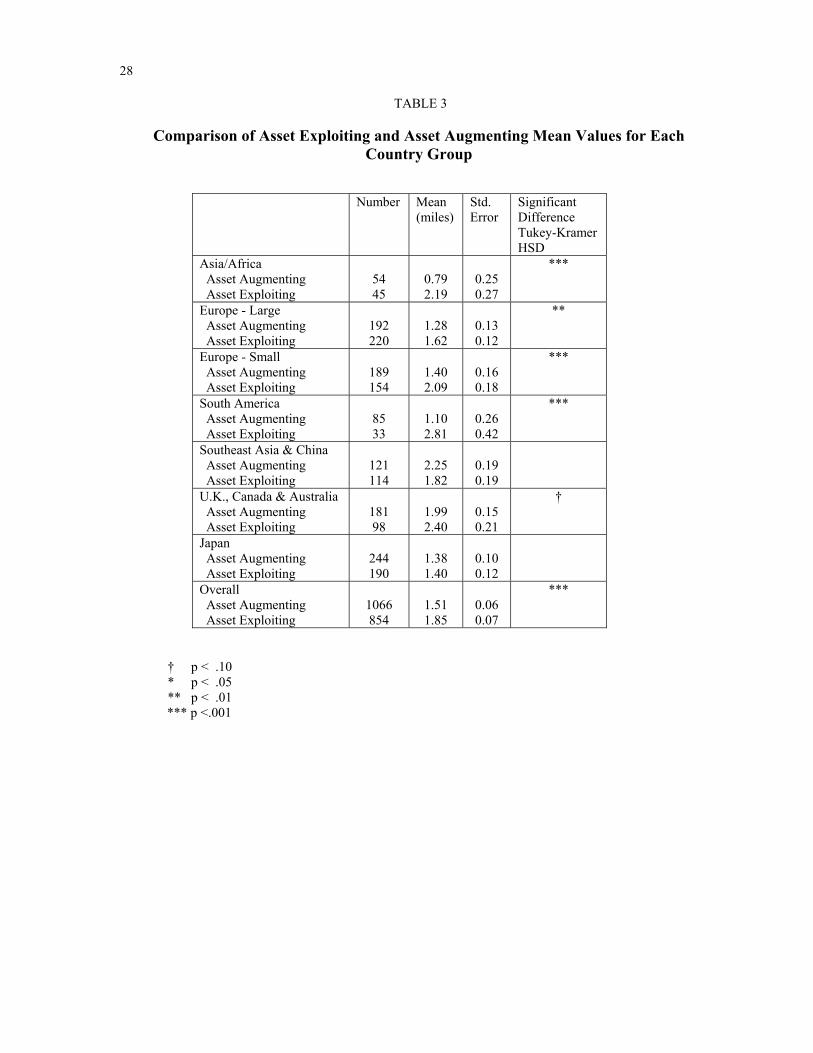
Investment Motivation, Table 3 compares for each country group the mean distance between the
foreign firm locations and the established N.Y.C. knowledge node based on investment
motivation, i.e., “asset exploiting” or “asset augmenting.” In the third area, Cultural Country
Effects, Table 4 presents statistics and correlations for each of the variables that are used in the
16
regression analysis. Table 5 presents these results. In the final area, a more micro-level of
analysis was performed to determine if this supported previous findings or indicated that the
previous models were misspecified.
Descriptive Data
The contingency analysis presented in Table 2 provides an indication of which categories
are either under or over-represented. For the services node classified as asset augmenting, firms
of the U.K., Canadian and Australian country group had a significantly greater number of firms
(94) than would be expected from chance alone (66). This is due to close cultural ties and a
similar common law structure as the U.S. that facilitates knowledge transfer in the following
micro-service sectors of advertising, consulting, and law. For the retail/wholesale knowledge
node that was classified as asset exploiting, the reverse was true. U.K. related countries had
significantly fewer firms (42) than were expected (70), primarily because consumer products is a
relatively weak domestic segment in these countries.
********************
Put Table 2 here
********************
For the finance node also classified as asset augmenting, Large European firms had
significantly fewer banking firms (93) than were expected (131). Partially explaining this effect
is that banks in Germany are relatively few and quite large and thus would limit their numbers in
the U.S. On the other hand, this group had significantly more retail/wholesale firms (163) than
were expected (104). The clothing/retail sectors, particularly in France and Italy, are regarded as
world centers of excellence and thus, we expected these firms attempt to use asset exploiting
behavior to extract monopolistic profits in one of the largest markets in the world, N.Y.C.
17
Firms from Southeast Asia were severely under-represented in services (26 observed vs.
56 expected) due to perceived differences between the Chinese and U.S. cultures and the desire
to rely on U.S.-based firms that are regarded as the best in the world. However, this country
group was over-represented in banking (60 observed vs. 75 expected) due to the desire of
Southeast Asian banks to have operations near one of the main banking center in the world so
that they could share knowledge quickly and coordinate operations with their home banking
office. These opposing trends complicate the estimation of the asset augmenting effect for
Southeast Asia.
South America and Asia both were over represented in the transportation category (19 vs.
7 and 18 vs. 6, respectively). This could be explained by the large number of small countries
within each of the groups maintaining their own national airline. Preferred access to these
countries home markets is the critical asset that they are exploiting.
Investment Motivation
In Table 3, we directly address the relationship between investment motivation and
country culture. The asset augmenting and asset exploiting investment motivation distance
measures (the distance measured in miles between foreign firm’s locations and the established
knowledge nodes) are generated and statistically compared for each of culture groupings. Six of
the seven culturally similar country categories reported the mean distance between the foreign
firm location and the knowledge node to less for asset augmenting firms than for asset
augmenting firms. The one category, Southeast Asia, that did not support this finding was not
significant, while four that did support it (Asia/Africa, Europe-Small, South America, Europe-
Large) were significant at less than the .05 level. Also, the overall difference between the two
tested motivations indicated significant differences at the .001 level. Clearly, H2: Foreign firms
in N.Y.C. are more likely to locate closer to N.Y.C. knowledge nodes if they are pursuing “asset

18
augmenting” behaviors because tacit knowledge is best transmitted through close personal
contact is supported by Tukey-Kramer HSD mean comparison test (SAS, 1995) presented in
Table 3.
********************
Put Table 3 here
********************
This data also shows that Japanese firms on average are located closer to the knowledge
centers than firms from any other countries. This partially confirms H1: Firms that are the
most culturally distant from the United States will likely locate closer to knowledge nodes to gain
maximum knowledge spillover and strongly suggests that Japan should be chosen as the base
country for the subsequent OLS regression analysis because it will particularly highlight
differences with other cultural country clusters.
Country Cultural Effects
Before we used OLS to estimate the country cultural effects, we removed the effect of the
control variable, government. This was required because there is fundamental difference
between foreign governments choosing to locate near the United Nations and local N.Y.C.
government choosing to locate at the lower east side of Manhattan. In this same equation, we
estimated the asset exploiting value to be 1.86 miles (vs. 1.85 miles in Table 3) and the asset
augmenting effect to be -.31 miles (vs. -.34 miles in Table 3).
********************
Put Table 4 here
********************
We use the data summarized in Table 4 to first estimated the country cultural effect in
isolation (labeled (CE) in Table 5); next we estimated it with the asset augmenting variable
19
(labeled (IM & CE) in Table 5) and finally we estimated the country cultural effects, asset
augmenting variable with the interaction effects of country and asset augmentation (labeled (IM,
CE & Cross Effects in Table 5). Note that coefficients in the equations translate directly into
miles from the knowledge node and that Japanese asset exploiting behavior is used as the base
and is reflected in the intercept term.
***********************
Put Table 5 here
********************
For both the CE and IM & CE equations the UK, Southeast Asian and Small Europe
country groups proved significant and positive. (The first two at the .001 level and the last at the
.05 level.) According to Table 1, the UK and Southeast Asian cultural groups had low
uncertainty avoidance, similar to the U.S but in stark contrast to Japan. Managers from
particularly the UK and Southeast Asia can deal better with uncertain situations and are likely to
be less uncomfortable with locating operations away from knowledge nodes. On average, UK
asset exploiting firms located over three quarters of a mile farther away from knowledge nodes
than Japanese firms, and Southeast Asia firms located almost two-thirds of a mile farther away.
The reason for the positive significant difference between Small European firms and Japanese
firms’ distance from knowledge node measures is mainly attributed to manager’s attitudes from
Small European countries to allow quality of life dimensions to enter into their location choice
process and not be solely driven by business success criteria. This would tend to increase the
distance from knowledge nodes. As expected, the asset augmenting variable was significant a
negative for the IM & CE equation.
In Table 3, there was considerable variation between country mean distances for both
asset augmenting and asset exploiting investment behaviors. This indicates a possible interaction
20
effect between investment motive and country cultural effect. When the asset augmenting
variable was crossed with the country cultural variables, the resulting equation R2 displayed in
Table 5 increased 50 percent to .048. All the previous significant country effects variables
remained so and the South America variable also proved significant. The Asia and Large Europe
variables were not significant, but had the correct positive sign.
With regard to the cross effects, the Asian/Asset augmenting variable proved significant
and negative. The Small Europe/asset augmenting and South America/asset augmenting
variables were also significant and negative. All the other cross-effect variables (except for
Southeast Asia/asset augmenting which was not significant) had the expected negative signs.
Clearly the above results support H1: Firms that are the most culturally distant from the
United States (particularly with regard to the uncertainty avoidance dimension) will likely
locate closer to knowledge nodes to gain maximum knowledge spillover.
Micro-Level of Analysis: Banking
If the knowledge nodes were too aggregated or if there were multiple micro-knowledge
nodes, then the distance between the foreign location and the knowledge could be dramatically
over-estimated and could change the county cultural effects. To test this potential model
misspecification, we obtained through the same Delphi Approach the micro-knowledge node for
banking in N.Y.C. We then calculated the distance between all foreign banking locations and
this new banking micro-knowledge node. The remaining foreign finance firms were measured
against the previous finance knowledge node and the foreign services firms against the N.Y.C.
service node. The banking micro-knowledge node was then used as the cross variable for all
the country cultural variables.
Unlike in the (IM, CE & Cross Effects) equation in Table 5 where the asset augmenting
variable for Japan was near zero and insignificant, the asset augmenting “banking” variable in
21
this equation was significant and negative. As expected, Japanese banks, on average, located .3
miles closer to their micro-knowledge node than Japanese asset exploiting firms. The
significant and positive sign associated with the remaining asset augmenting variable that
included services and insurance was surprising. One explanation is that Japanese service and
insurance firms sought to locate near their dominant banking presence and their cultural hub
dominated their knowledge hub. Primary research is required to better answer this question.
With regard to the country effects, all had the correct sign and all the ones that were
significant in the previous equation were also significant here. As expected, the UK countries
had the firms with the greatest distance from the knowledge centers. All of the banking/country
culture cross effects were negative; however, two more were significant at the .05 level, i.e.,
Southeast Asia and the UK. Clearly, the banking micro-knowledge node analysis provides
some usually insight and indicates that exploration in this area is useful. But equally important,
it shows that the results of more macro-model are relatively stable and can be relied upon as
providing reasonable estimates of the effect of investment motivation and country cultural effect
on the distance foreign firms locate from N.Y.C. knowledge nodes
FUTURE RESEARCH
We believe that the micro-level analytical approach developed here that calculates
geographic centers and variance for knowledge nodes is an exciting new way of analyzing
foreign firm’s locational choice decisions. Further sector disaggregation, e.g., the legal,
accounting, media, consulting sectors within business services, fashion within retail/wholesale
and insurance and securities within finance, combined with survey research will permit the
study of factors affecting in-depth micro-knowledge node location choices by foreign firms.
Also, comparisons of the results from New York City with other major cities will shed new
light on how geography affects the creation of knowledge around the world. Even though our
22
New York City analysis showed an extreme concentration of service activity in Manhattan, a
broader New York/New Jersey metropolitan analysis will likely reveal additional global
knowledge nodes for pharmaceuticals and telecommunications in Northern New Jersey
(Wymbs, 1998).
CONCLUSIONS
Our main objective was to answer the important business question: How does N.Y.C.’s
knowledge nodes, culture and investment motivation affect foreign firms’ locational choice
decisions?
We first identified New York City knowledge nodes and then collected micro-level
foreign firm locational data to test two hypotheses. We demonstrated that cultural aspects of a
country, particularly the uncertainty avoidance characteristics, influenced where firms from
foreign countries locate their operations relative to established knowledge centers. On average,
the more culturally dissimilar countries are to the U.S., the more constrained they feel in
locating closer to established N.Y.C. knowledge centers. We also have shown that firms
pursuing asset augmenting behavior, due to tacit knowledge barriers, usually locate closer to
knowledge nodes than those seeking asset exploiting behavior. In addition, we found that asset
augmenting behavior was dependent on the country culture through the testing of interaction
effects. Finally, we have shown that a more disaggregate micro-knowledge node analysis
improves the precision of the results and is a worthwhile future endeavor, but does not change
the key study findings.
23
BIBLIOGRAPHY Adler, N. 1997. International dimensions of organizational behavior. PWS-Kent, Boston. Amin, a. & Thrift, N. 1993. Neo-Marshallian Nodes in global networks. International
Journal of Urban Regional Research. V 16 (4) 571-87. Audretsch, D. 1999. Knowledge, globalization and regions. Eds. Dunning, J. H. Regions,
Globalization and the Knowledge-Based Economy. Oxford University Press. Oxford, England.
Bagchi-Sen, S. & Sen, J. 1997. The current state of knowledge in international business is in producer services. Environment and Planning, A, 29, 1153-1174.
Bagchi-Sen S. & Wheeler J.O. 1989. A spatial and temporal model of foreign direct investment in the United States. Economic Geography 65: 113-129
Barney. J. 1991. Firm resources and sustained competitive advantage. Journal of Management 17. 99-120.
Chen, H. & Chen T. 1998. Network linkages and locational choice in foreign direct investment. Journal of International Business Studies. V 29 (3) 445-466
Contractor, F. & Kundu, S. 1998. Modal choice in a world of alliances: Analyzing organizational forms in the international hotel sector. Journal of International Business Studies. V 29 (2). 325-358.
Coughlin, C. 1992. Foreign owned companies in the United States: Malign or benign? Federal Reserve Bank of St. Louis Review. 74(3): 17-31.
Crains. 1998. Crain’s New York Business: Book of Lists. New York DelaMothe, J. & Paquet, G. 1996. eds. Evolutionary Economics and the New
International Political Economy. London. Pinter. DelaMothe, J. & Paquet, G. 1994. The dispersive revolution. Optimum. 25,1, 42-48. Directory. 1999. International Business in New York City. Weissman Center of
International Business, Baruch College/CUNY. New York. Dunning, J. H. 1999. Regions, Globalization and Knowledge Centers. Oxford: Oxford
University Press. Dunning, J. H. 1993. Multinational Enterprise and the Global Economy. Addison-Wesley
Publishers Ltd. New York. Dunning, J. H. 1981. International Production and the Multinational Enterprise. London,
UK: Allen& Unwin Dunning, J. H. & Morgan, E. 1971. An economic study of the city of London. University
of Toronto Press. Toronto Canada. Dunning, J. H. & Narula, R. 1995. The R&D activities of foreign firms in the U.S.
International Studies of Management and Organizations. 25(1-2) 39-75. Enright, M. 1999. Globalization, regionalization and the knowledge-based economy of
Hong Kong. Eds. Dunning, J. H. Regions, Globalization and the Knowledge-Based Economy. Oxford University Press. Oxford, England.
Enright, M. 1995. Organization and coordination in Geographically concentrated industries In D. Raff and N. Lamoreux (eds.) Coordination and information: Historical Perspectives on the Organization of the Enterprise. Chicago: University of Chicago Press.
Erramilli, M. K. & Rao, C. P. 1993. Service firms’ international entry mode choice: A modified transactional cost analysis approach. Journal of Marketing. V 57. 19-38.
Etzioni, A. 1996. The New Golden Rule. New York, Basic Books.
24
Flordia, R. 1998. Calibrating the learning region. Eds. DelaMothe, J & Paquest, G. 1998. Local and Regional Systems of Innovation. Kluwer Academic Publishers. MA.
Florida, R. 1995. Towards a learning region. Futures. 27, (5), 527-36 Glaeser, E., Kallal, H., Scheinkman, J. Shleifer, A. 1992. Growth in cities. Journal of
Political Economy V 100 (6). 1126-1152 Goldfinger, K. 1993. Modified Delphi: A concept of new product forecasting. Journal of
Business Forecasting Methods ad Systems. Winter, 1992-1993 Hofstede, G. 1980. Culture’s consequences: International differences in work related
values. Beverly Hills: Sage Publications. Hyman, S. 1960. The international operations of the national firms: A study of foreign
direct investment. Ph.D. dissertation, MIT (published by MIT Press, 1966). IDA. 1999. N.Y.C. Industrial Development Corp. City of New York. Jacobs, J. 1969. The economy of cities, New York: Random House. Johanson, J. & Mattson, L. 1987. Internationalization in industry system: A network
approach. In N. Hood & Jan-Erik Vahle, editors, Strategies in global competition. London, UK: Rouledge.
Kogut, B. & Singh, H. 1988. The effect of national culture on the choice of entry mode. Journal of International Business Studies. V 19. 411-32.
Krugman, P. 1991. Geography and trade, Cambridge, MA: MIT Press. Markusen, A. 1994. Sticky places in slippery space: the political economy of post-war
fast growth regions. Rutgers University Working Paper No. 79. Newark, N.J. Marshall, A. 1890/1919. Principles of economics. An introductory volume. London:
Macmillan. Moore, K. & Birkinshaw, J. 1998. Managing knowledge in global service firms: Centers
of excellence. The Academy of Management Executive. V 12 (4). 81-92. Nachum, L. 2000. Economic geography and international business activity: Inward fdi to
the US in financial and professional services. Journal of International Business Studies. V 31 (3), 367-386
Nohria, N. & Garcia-Pont, C. 1991. Global strategic linkages and industry structure. Strategic Management Journal. V 12 (Special Issue). 105-124
Nelson, R. & Winters, S. 1981. An Evolutionary Theory of Economic Change. Cambridge, MA. Harvard University Press.
Orr. J. 1993. Foreign direct investment in New York City Final Report. Mimeo. Federal Reserve Bank of New York.
Porter, M. 1990. The competitive advantage of nations, New York: Free Press. SAS, 1995. Statistical and Graphical Guide. SAS Institute. Cary, NC. Saxenian, A. L. 1998. Regional systems of innovation and the blurred firm. Eds.
DelaMothe, J & Paquest, G. Local and Regional Systems of Innovation. Kluwer Academic Publishers. Mass.
Saxenian, A. L. 1994. Regional Advantage: Culture and competition in Silicon Valley and Route 128. Cambridge, Mass. Harvard University Press.
Schoenberger, E. 1994. Foreign manufacturing investment in the United States: Competitive Strategies and international location. Economic Geography. 61(3).
Shaver, M. 1995. Do foreign owned and U.S. owned establishments exhibit the same locational patterns in American manufacturing industries? Working paper Series No. IB-95-6 New York: Stern School of Business.
25
Shaver, M. & Flyer, F. (2000). Agglomeration economies, firm heterogeneity, and foreign direct investment in the United States. Strategic Management Journal V 21. 1175-1193.
Storper, M. 1995. The resurgence of regional economies, ten years later: The region as the nexus of untraded dependencies. European Urban and Regional Studies 2(3).
Vernon, R. 1960. Metropolis 1985, Cambridge, Harvard University Press. Wesson, T. J. 1993. An Alternative Motivation For Foreign Direct Investment.
Cambridge, MA. Ph.D. Dissertation. Harvard University. Wolfe, D. 2000. Social capital and cluster development in learning regions. Paper
presented to the XVIII World Congress of the International Political Science Association, Quebec City, Quebec August 5.
Wymbs, C. 1998. Telecoms in New Jersey: Spatial determinants of sectoral investments. Eds. DelaMothe, J & Paquest, G. Local and Regional Systems of Innovation. Kluwer Academic Publishers. Mass.
Wymbs, C. 2000. How e-commerce is transforming and internationalizing the service industries. Journal of Services Marketing. V 14 (6). 463-478
26
TABLE 1
Groups of Culturally Similar Countries Based on Hofstede’ s Cultural Dimensions
Uncertainty
Avoidance2
Power
Distance3
Success/
Quality of Life4
Individualism/
Collectivism5
United States L M S I
Japan H M S M
U.K., Canada & New Zealand L M M I
Southeast Asia & China L L M C
Small Europe H H Q I
Large Europe H M S I
South America H L M C
Asia/Africa H L M C
-------- Source: Hostede, Geert, “Motivation, Leadership, and Organization: Do American
Theories Apply Abroad?” Reprinted in Adler, N. 1997 International Dimensions of Organizational Behavior. South-Western College Publishing. Cincinnati, Ohio
2 Uncertainty Avoidance is measured as High (H), Low (L), Moderate (M). 3 Power Distance is measured as High (H), Low (L), Moderate (M). 4 Success/Quality of Life is measured as Success (S), Quality (Q) and Moderate (M) 5 Individualism/Collectivism is measures as Individualism (I), Collectivism (C), Moderate (M).
27
TABLE 2
Contingency Table Comparing Investment Motivation and Culturally Similar Countries
Count Expected Cell Chi*2
Asia/ Africa
Large Europe
Small Europe
Japan South America
Southeast Asia + China
U.K. + Canada+ Australia
Total
Finance “Asset Augmenting”
42 31
3.5
93 131
*11.2
92 109 2.7
143 138 0.2
60 75
*9.2
95 75
5.3
87 89
0.0
612
Construction “Asset Exploiting”
1 0
0.1
2 3
0.3
1 2.5 0.9
6 3.1 2.5
0 1
0.7
2 2
0.0
2 2
0.0
14
Government “Asset Exploiting”
3 1
*9.1
1 3
1.0
5 2
3.8
1 3
1.1
0 1
0.7
0 1
1.5
2 3
0.0
12
Manufacturing “Asset Exploiting”
9 12
0.7
47 50
0.2
33 41
1.7
67 52
4.0
9 14
1.9
22 28
1.4
45 34
3.8
232
Services “Asset Augmenting”
12 23
5.6
99 87
0.0
97 81
3.1
101 102 0.0
25 28
0.3
26 56
*15.7
94 66
*11.9
454
Transportation &Public Utilities “Asset Exploiting”
18 6
*26.3
7 24
*11.8
27 20
2.6
17 25.0
2.6
19 7
*21.7
16 14
0.4
7 16
5.2
111
Wholesale & Retail Trade “Asset Exploiting”
14 25
4.8
163 104
*33.3
88 87
0.0
99 110 1.0
5 30
*20.6
74 59
3.6
42 70
*11.5
485
Total
99 412 343 434 118 235 279 1920
Standard errors in parentheses. N =1920 † p < .10
* p < .05 ** p < .01 *** p <.001
28
TABLE 3
Comparison of Asset Exploiting and Asset Augmenting Mean Values for Each Country Group
Number Mean (miles)
Std. Error
Significant Difference Tukey-Kramer HSD
Asia/Africa Asset Augmenting Asset Exploiting
54 45
0.79 2.19
0.25 0.27
***
Europe - Large Asset Augmenting Asset Exploiting
192 220
1.28 1.62
0.13 0.12
**
Europe - Small Asset Augmenting Asset Exploiting
189 154
1.40 2.09
0.16 0.18
***
South America Asset Augmenting Asset Exploiting
85 33
1.10 2.81
0.26 0.42
***
Southeast Asia & China Asset Augmenting Asset Exploiting
121 114
2.25 1.82
0.19 0.19
U.K., Canada & Australia Asset Augmenting Asset Exploiting
181 98
1.99 2.40
0.15 0.21
†
Japan Asset Augmenting Asset Exploiting
244 190
1.38 1.40
0.10 0.12
Overall Asset Augmenting Asset Exploiting
1066 854
1.51 1.85
0.06 0.07
***
† p < .10 * p < .05 ** p < .01
*** p <.001

29
TABLE 4
Statistics and Correlations
X S.D. 1 2 3 4 5 6 7 8 9 10 11 12 1.Asia
.05 .22
2. Small Europe
.18 .38 -.10
3. Large Europe
.22 .41 -.12 -.24
4. Japan
.23 .42 -.13 -.25 -.28
5. South America
.06 .24 -.06 -.12 -.13 -.14
6. UK Canada Australia
.14 .35 -.10 -.02 -.22 -.22 -.11
7. SE Asia & China
.12 .33 -.09 -.02 -.20 -.20 -.10 -.15
8. Government
.01 .08 .07 .05 -.03 -.03 -.02 .00 -.03
9. Augment- Banking
.16 .37 .11 -.03 -.08 -.05 .11 -.08 .13 -.04
10.Augment- Non-Banking
.39 .49 -.09 .02 -.03 .05 .00 .14 -.13 -.06 -.35
11. Asset Augmenting
.56 .50 -.00 -.00 -.09 .01 .09 .08 -.03 -.09 .40 .72
12. Distance
-.03 .01 -.03 .01 -.05 -.08 -.01 .10 .07 .07 -.06 -.04 -.08
13. Distance with Banking
-.03 .01 .03 .01 -.05 -.08 -.01 .10 .08 .07 -.04 -.05 -.08 .99

30
TABLE 5
Results of OLS Regression Analysis For Knowledge Node Distance Investment
Motivation (IM)
Cultural Effect (CE)
IM & CE IM, CE & Cross Effects
IM, CE, Cross Effects & Banking
Intercept
1.86*** (0.06)
1.38*** (0.01)
1.57*** (0.11)
1.39*** (0.14)
1.46*** (0.11)
Government
1.54*** (0.57)
1.74** (0.57)
1.54** (0.57)
1.35** (0.57)
1.48** (0.58)
Asset Augmenting (A)
-0.31*** (0.09)
-0.35*** (0.09)
-.01 (0.19)
Asset Augmenting-Bank (AB)
-0.30** (0.10)
Asset Augmenting Non-Bank
0.61** (0.29)
Asia/Africa
-0.01 (0.22)
-0.01 (0.22)
0.71 (0.32)
0.23 (0.27)
Large Europe
0.07 (0.14)
0.04 (0.13)
0.23 (0.19)
0.13 (0.14)
Small Europe
0.30** (0.14)
0.30** (0.14)
0.66** (0.21)
0.51*** (.15)
South America
0.20 (0.20)
0.25 (0.20)
1.42*** (0.37)
0.63*** (0.24)
Southeast Asia + China
0.66*** (0.16)
0.64*** (0.16)
0.43† (0.24)
0.76*** (0.18)
UK+Canada+ Australia
0.74*** (0.15)
0.77*** (0.15)
0.99*** (0.24)
0.90*** (0.16)
Asia/Africa X (A)
-1.30** (0.43)
Large Europe X (A)
-0.33 (0.26)
Small Europe X (A)
-0.64** (0.28)
South America X (A)
-1.69*** (0.44)
Southeast Asia + China X (A)
0.45 (0.32)
UK+Canada+ Australia X (A)
-0.38 (0.31)
Asia/Africa X (AB)
-1.28 (0.51)
Large Europe X (AB)
-0.74 (0.42)
Small Europe X (AB)
-1.66*** (0.42)
South America X (AB)
-1.81*** (0.48)
Southeast Asia + China X (AB)
-0.85** (0.40
UK+Canada+ Australia X (AB)
-1.26** (0.50)
Adjusted R2 .011 .025 .032 .048 .043 Standard errors in parentheses. N =1920 † p < .10
* p < .05 ** p < .01 *** p <.001