Embed Size (px)
Citation preview
© OECD/IEA, 2018 International Energy Agency
KEY ELECTRICITY TRENDS 2017 BASED ON MONTHLY DATA1
ELECTRICITY 1PRODUCTION 2
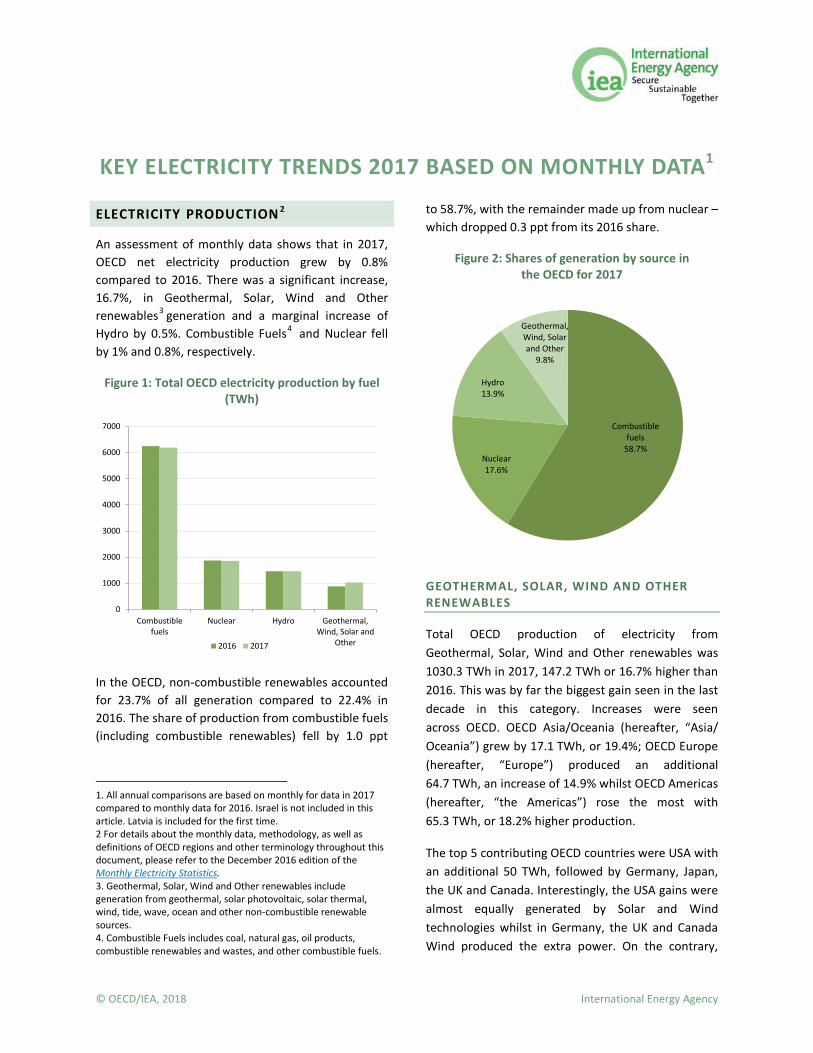
An assessment of monthly data shows that in 2017, OECD net electricity production grew by 0.8% compared to 2016. There was a significant increase, 16.7%, in Geothermal, Solar, Wind and Other renewables3 generation and a marginal increase of Hydro by 0.5%. Combustible Fuels4 and Nuclear fell by 1% and 0.8%, respectively.
Figure 1: Total OECD electricity production by fuel (TWh)
In the OECD, non-combustible renewables accounted for 23.7% of all generation compared to 22.4% in 2016. The share of production from combustible fuels (including combustible renewables) fell by 1.0 ppt
1. All annual comparisons are based on monthly for data in 2017 compared to monthly data for 2016. Israel is not included in this article. Latvia is included for the first time. 2 For details about the monthly data, methodology, as well as definitions of OECD regions and other terminology throughout this document, please refer to the December 2016 edition of the Monthly Electricity Statistics. 3. Geothermal, Solar, Wind and Other renewables include generation from geothermal, solar photovoltaic, solar thermal, wind, tide, wave, ocean and other non-combustible renewable sources. 4. Combustible Fuels includes coal, natural gas, oil products, combustible renewables and wastes, and other combustible fuels.
to 58.7%, with the remainder made up from nuclear – which dropped 0.3 ppt from its 2016 share.
Figure 2: Shares of generation by source in the OECD for 2017
GEOTHERMAL, SOLAR, WIND AND OTHER RENEWABLES
Total OECD production of electricity from Geothermal, Solar, Wind and Other renewables was 1030.3 TWh in 2017, 147.2 TWh or 16.7% higher than 2016. This was by far the biggest gain seen in the last decade in this category. Increases were seen across OECD. OECD Asia/Oceania (hereafter, “Asia/Oceania”) grew by 17.1 TWh, or 19.4%; OECD Europe (hereafter, “Europe”) produced an additional 64.7 TWh, an increase of 14.9% whilst OECD Americas (hereafter, “the Americas”) rose the most with 65.3 TWh, or 18.2% higher production.
The top 5 contributing OECD countries were USA with an additional 50 TWh, followed by Germany, Japan, the UK and Canada. Interestingly, the USA gains were almost equally generated by Solar and Wind technologies whilst in Germany, the UK and Canada Wind produced the extra power. On the contrary,
0
1000
2000
3000
4000
5000
6000
7000
Combustiblefuels
Nuclear Hydro Geothermal,Wind, Solar and
Other2016 2017
Combustible fuels
58.7%Nuclear17.6%
Hydro13.9%
Geothermal, Wind, Solar and Other
9.8%
2 KEY ELECRICITY TRENDS 2017 - BASED ON MONTHLY DATA
International Energy Agency © OECD/IEA, 2018
Japan benefited from solar energy. The highest growth rates were noticed in Luxembourg (primarily Wind) and Chile (both Wind and Solar over 50%)
Throughout the OECD, this category is mainly composed of generation from solar PV and wind. In 2017, electricity generation from wind in OECD countries showed its largest increase since our data begins, with an additional 97.7 TWh or 16.4% from the previous year. The majority of this increase occurred in Europe (53.2 TWh). Solar PV also had a record gain of 54.1 TWh in the OECD with the largest growth in the Americas (27.5 TWh).
Figure 3: Yearly Solar and Wind production in OECD (TWh)
HYDRO ELECTRICITY
Total OECD production of hydroelectricity in 2017 was 1 464.6 TWh, 6.9 TWh or 0.5% higher than 2016. However, generally hydro capacity has been almost constant across the OECD for the past 15 years because most of the available potential in OECD countries is already being used.
Hydroelectric production varied considerably across OECD regions. In the Americas, it recorded a significant increase of 7.9% as a result of heavy rainfall in Canada and the U.S., the top two Hydro producers in the OECD. In Asia/Oceania, Japan and Korea increases cancelled out falls in Australia and New Zealand whilst Hydro in Europe dropped by 8.4% with countries in the Mediterranean particularly affected. Specifically, Portugal and Spain experienced significant falls of 55.5% and 47.5% respectively due to much lower rainfall.
The largest increase in any OECD country was in Latvia with 73% compared to 2016, marking a historical high for electricity generation and Hydro (roughly 50% of production), which helped the country secure an electricity trade surplus.
NUCLEAR ELECTRICITY
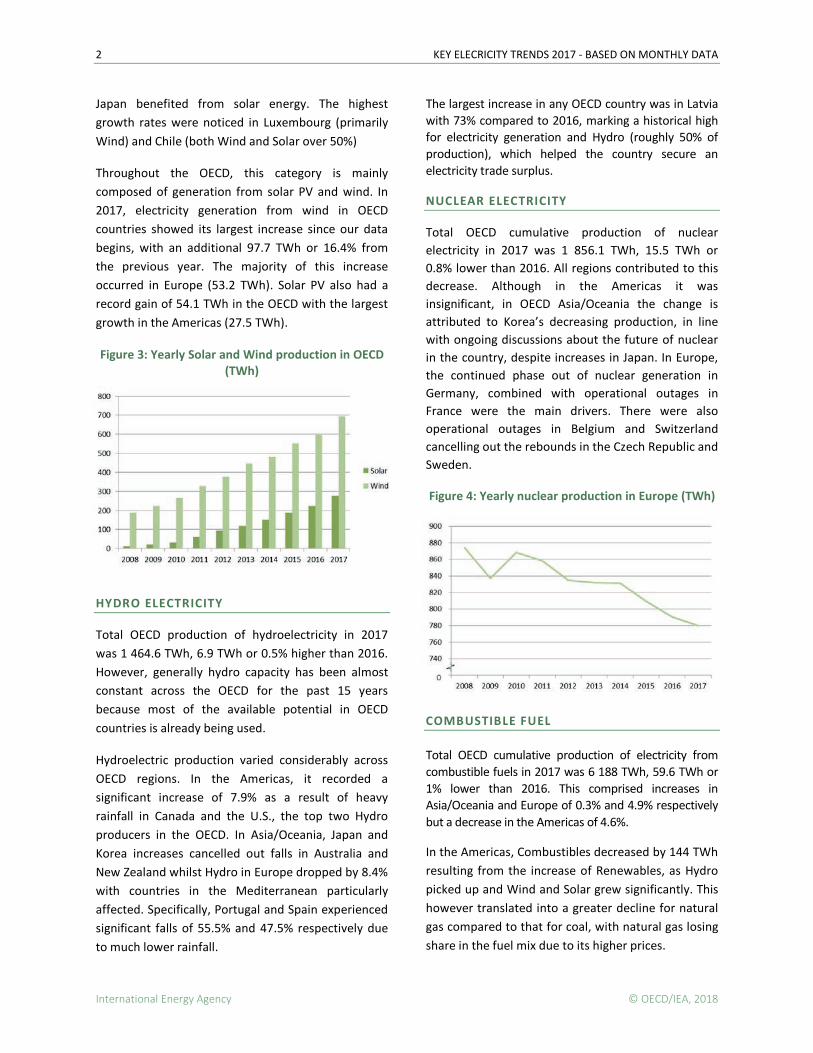
Total OECD cumulative production of nuclear electricity in 2017 was 1 856.1 TWh, 15.5 TWh or 0.8% lower than 2016. All regions contributed to this decrease. Although in the Americas it was insignificant, in OECD Asia/Oceania the change is attributed to Korea’s decreasing production, in line with ongoing discussions about the future of nuclear in the country, despite increases in Japan. In Europe, the continued phase out of nuclear generation in Germany, combined with operational outages in France were the main drivers. There were also operational outages in Belgium and Switzerland cancelling out the rebounds in the Czech Republic and Sweden.
Figure 4: Yearly nuclear production in Europe (TWh)
COMBUSTIBLE FUEL
Total OECD cumulative production of electricity from combustible fuels in 2017 was 6 188 TWh, 59.6 TWh or 1% lower than 2016. This comprised increases in Asia/Oceania and Europe of 0.3% and 4.9% respectively but a decrease in the Americas of 4.6%.
In the Americas, Combustibles decreased by 144 TWh resulting from the increase of Renewables, as Hydro picked up and Wind and Solar grew significantly. This however translated into a greater decline for natural gas compared to that for coal, with natural gas losing share in the fuel mix due to its higher prices.
KEY ELECTRICITY TRENDS 2017 - BASED ON MONTHLY DATA 3
© OECD/IEA, 2018 International Energy Agency
Figure 5: Natural Gas, Coal, and all other electricity production in OECD Americas (TWh)
In contrast, Europe Combustibles grew by 80 TWh, having to compensate for a low Hydro year and falling Nuclear. Decarbonisation and fuel switching from coal to natural gas continued, with the combustibles increase being met by natural gas fired generation, as shown in its growing shares in Figure 6.
Figure 6: Natural Gas, Coal, and all other electricity production in OECD Europe (TWh)
ELECTRICITY TRADE
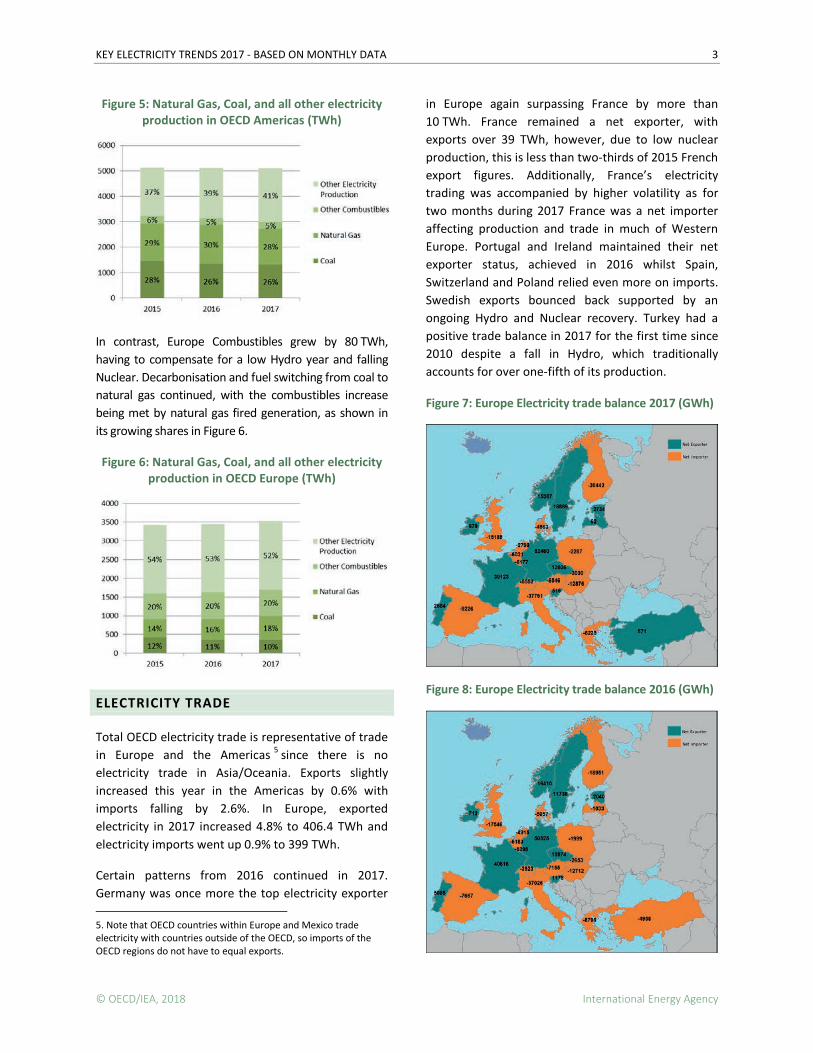
Total OECD electricity trade is representative of trade in Europe and the Americas 5 since there is no electricity trade in Asia/Oceania. Exports slightly increased this year in the Americas by 0.6% with imports falling by 2.6%. In Europe, exported electricity in 2017 increased 4.8% to 406.4 TWh and electricity imports went up 0.9% to 399 TWh.
Certain patterns from 2016 continued in 2017. Germany was once more the top electricity exporter 5. Note that OECD countries within Europe and Mexico trade electricity with countries outside of the OECD, so imports of the OECD regions do not have to equal exports.
in Europe again surpassing France by more than 10 TWh. France remained a net exporter, with exports over 39 TWh, however, due to low nuclear production, this is less than two-thirds of 2015 French export figures. Additionally, France’s electricity trading was accompanied by higher volatility as for two months during 2017 France was a net importer affecting production and trade in much of Western Europe. Portugal and Ireland maintained their net exporter status, achieved in 2016 whilst Spain, Switzerland and Poland relied even more on imports. Swedish exports bounced back supported by an ongoing Hydro and Nuclear recovery. Turkey had a positive trade balance in 2017 for the first time since 2010 despite a fall in Hydro, which traditionally accounts for over one-fifth of its production.
Figure 7: Europe Electricity trade balance 2017 (GWh)
Figure 8: Europe Electricity trade balance 2016 (GWh)
4 KEY ELECRICITY TRENDS 2017 - BASED ON MONTHLY DATA
International Energy Agency © OECD/IEA, 2018
REGIONAL PERSPECTIVE
Each OECD region has different generation totals and production shares by fuel type, largely driven by different hydrologic conditions. The Americas was the only OECD region to post a decrease of electricity production of 0.4%. In Americas, Combustible Fuels dropped by 4.6%, while Nuclear decreased only marginally by 0.1%. Hydro rose by 7.9% and Geothermal, Wind, Solar and Other renewables increased significantly by 18.2%.
In Asia/Oceania net electricity generation went up 0.9%. Combustible Fuels slightly increased by 0.3%, Nuclear declined 2.5% and Hydro rose by only 0.3% with Geothermal, Wind, Solar and Other renewables exhibiting again the highest increase by 19.4%.
Electricity generation in Europe increased 2.4% following a different trend. Despite significant growth of Geothermal, Wind, Solar and Other renewables by 14.9%, this was not sufficient to offset 8.4% and 1.3% drops in Hydro and Nuclear respectively, resulting in a 4.9% increase of Combustible Fuels. The common theme in all OECD regions was falling nuclear and the rise of Geothermal, Solar, Wind and Other renewables.
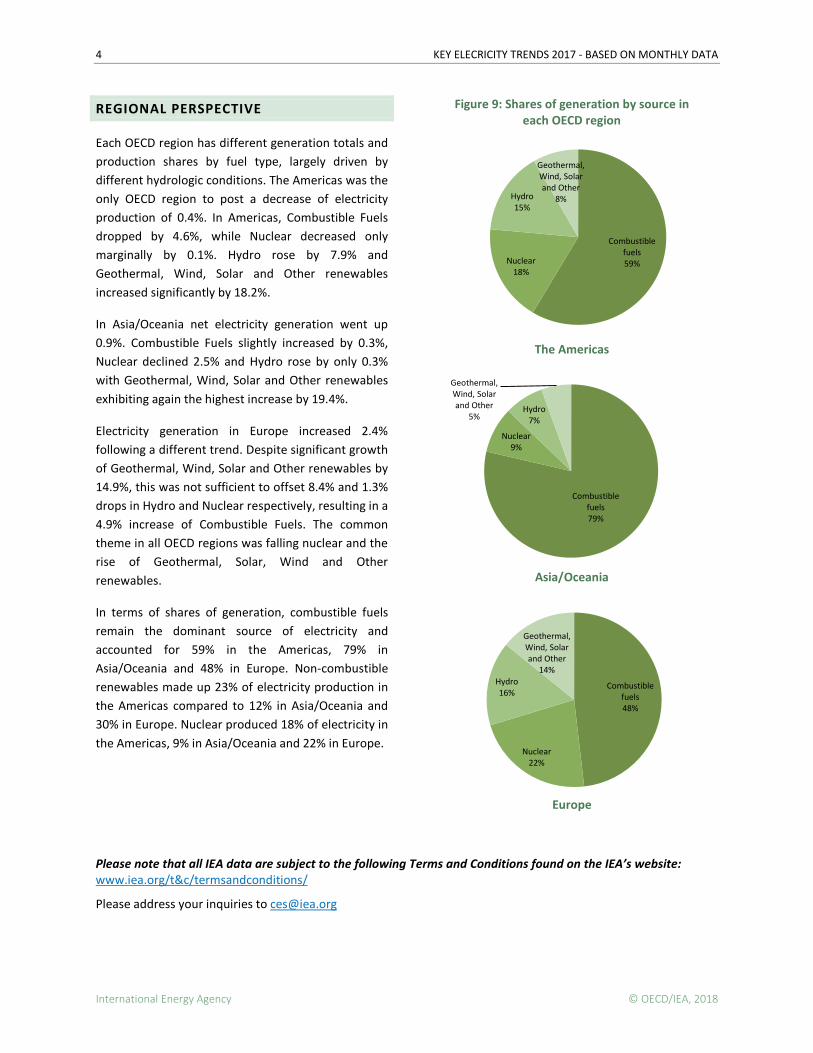
In terms of shares of generation, combustible fuels remain the dominant source of electricity and accounted for 59% in the Americas, 79% in Asia/Oceania and 48% in Europe. Non-combustible renewables made up 23% of electricity production in the Americas compared to 12% in Asia/Oceania and 30% in Europe. Nuclear produced 18% of electricity in the Americas, 9% in Asia/Oceania and 22% in Europe.
Figure 9: Shares of generation by source in each OECD region
The Americas
Asia/Oceania
Europe
Please note that all IEA data are subject to the following Terms and Conditions found on the IEA’s website: www.iea.org/t&c/termsandconditions/
Please address your inquiries to [email protected]
Combustible fuels59%Nuclear
18%
Hydro15%
Geothermal, Wind, Solar and Other
8%
Combustible fuels79%
Nuclear9%
Hydro7%
Geothermal, Wind, Solar and Other
5%
Combustible fuels48%
Nuclear22%
Hydro16%
Geothermal, Wind, Solar and Other
14%