Embed Size (px)
Citation preview

KEY ENABLING TECHNOLOGIES AND SMART SPECIALISATION
FOR A COMPETITIVE ITALY
PROF. GABRIEL M CREAN VICE-PRESIDENT FOR TECHNOLOGY, CEA, FRANCE,
HIGH LEVEL GROUP ON KEY ENABLING TECHNOLOGIES
Bari, 23th of July 2013

2 2
KETs: Global perspective
KETs: Why are they important 2
Outline
1

3
• 26,522 million men and women in the EU-27 were unemployed in May 2013 (Eurostat May 2013)
• 12.2% of total EU workforce
• 5,525 million young persons (under 25) were unemployed in the EU-27 (Eurostat May 2013)
• 23.1% of total workforce
• Italy: Unemployment rate 12.2% in 2013, ( 5.9% in 2007) 3,14 million people
= Pop Rome 2,7 million + pop Bari 320,475
• Italy: Youth unemployment rate 36.9% in 2013 (27.8% in 2010) 3
SMART Specialisation is NOT smart if it does not create jobs

4
“The new era of manufacturing will be marked by highly
agile, networked entreprises that use information and
analytics as skillfully as they employ talent and machinery
to deliver products and services to diverse global market.
In advanced economies, manufacturing will
continue to drive innovation, exports, and
productivity growth. In developing economies,
manufacturing continue to provide a pathway to higher
living standards. As long as companies and
countries understand the evolving nature of
manufacturing, and act on the powerful trends
shaping the global competitive environment,
they can thrive in this promising future”.
4
The strategic importance of manufacturing
McKinsey report Manufacturing the future: the next era of global growth and innovation. Nov 2012
5 5
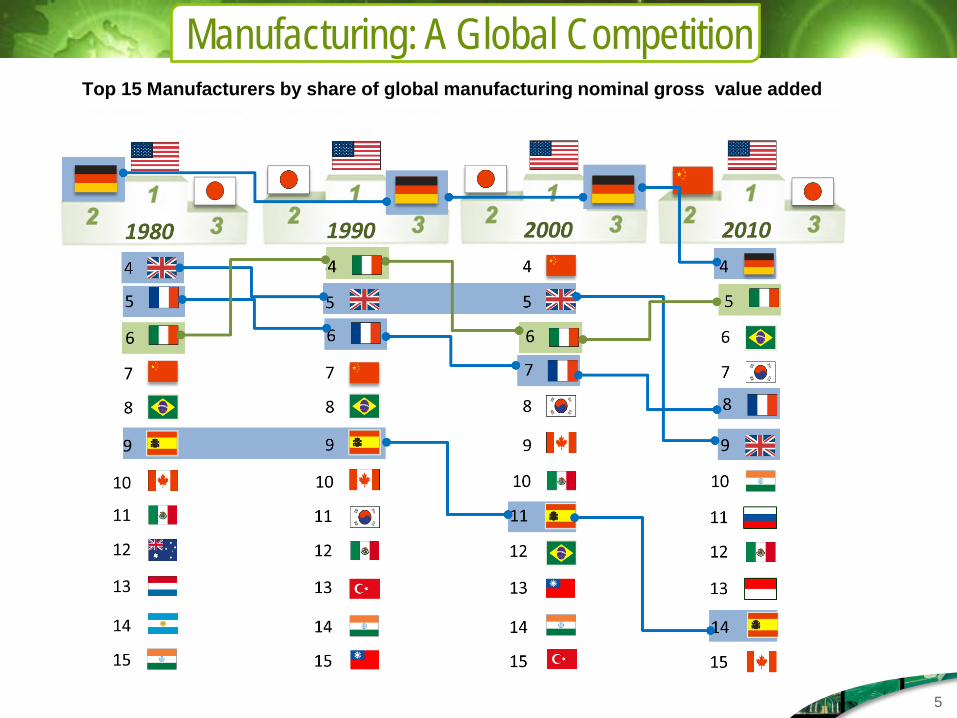
Manufacturing: A Global Competition Top 15 Manufacturers by share of global manufacturing nominal gross value added

6
McKinsey report Manufacturing the future: the next era of global growth and innovation. Nov 2012
Manufacturing drives innovation

Barack H. Obama, State of The Union 2011 speech, Jan 25
“At stake [right now] is whether new jobs and industries take root in this country, or somewhere else. […]
The rules have changed. In a single generation, revolutions in technology have transformed the way we live, work and do business. […]
The future is ours to win. But to get there, we can't just stand still.[…] We know what it takes to
compete for the jobs and industries of our time. We need to out-innovate, out-educate, and out-build the rest of the world. All these investments -- in innovation, education, and infrastructure -- will make America a better place to do business and create jobs.
The first step in winning the future is encouraging American innovation. […] In America,
innovation doesn't just change our lives. It is how we make our living. […] This is our generation's Sputnik moment. […] We'll invest in biomedical research, information technology, and especially clean energy technology an investment that will strengthen our security, protect our planet, and create countless new jobs for our people.”
7
New US Re-industrialisation Policy

8 8
US political focus on manufacturing

9 9
US political focus on manufacturing
The policy agenda for U.S. manufacturing is changing.
Five years ago the debate was mostly about how to
rescue and retain existing footholds in manufacturing,
but lately the debate is increasingly about how to
set the stage to lead the world in new technologies
and innovations that are changing the face of
manufacturing. That shift in direction was underscored
when eight states prepared new strategies based not on
the desire to “save manufacturing” but with the idea,
“Let’s lead in what lies ahead,” including robotics,
nanotechnology, and advanced materials.

10 10
0
20
40
60
80
100
2009 2012
47%
5%
44%
4%
62%
5%
31%
2%
Asia
Europe US
0
20
40
60
80
100
2009 2012
54%
6%
29%
11%
62%
11% 17% 10% Others
The share in Machine Tool production for the period 2009-2012
World Machine Tool consumption / geographical repartition for the period 2009-2012
“Once the manufacturing base is lost,
it never comes back”. CECIMO President
Europe competitiveness in advanced manufacturing is rapidly declining

11 11
45% 28% 24%
32%
38% 27%
0%
5%
10%
15%
20%
25%
30%
35%
40%
45%
50%
1991 1993 1995 1997 1999 2001 2003 2005 2007 2009
Europe
Asia
US
Patent share by competitor bloc for all KETs cumulated (2000-2010)
Europe is resilent - but the window of opportunity is reducing
2009
2012

12 12
The diffusion and exploitation of European generated IPRs outside Europe is accelerating
0 1 2 3 4 5 6 7
2010
2011
2012
Average growth of license and patent revenues from outside Europe (%)
Innovation Union Scoreboard 2013

13
Market Knowledge
The valley of death
The European “Valley of Death”

Global patent and Manufacturing shares: the case of Li-Ion Battery
Global patent and Manufacturing shares: the case of PV
2010 2012

High Level Group :Building a bridge to success for regions
© CEA. All rights reserved
| 15
Development of Technology building blocks within DG
CONNECT & DG Res
Re-industrialisation of Europe: KETs Pilot Lines & Deployment supported by
H2020 and Structural Funds
Capacity Build-out on a level playing field: KETs industrial Policy
Public
Financing
Private
Financing

16 16
US and Asia invest massively in development activities to sustain their industrial innovation

17 17
KETs: Global perspective
KETs: Why are they important 2
Outline
1

Advanced Materials
Electronics
Software
Optics Biotechnologies
Sensors
Nanotechnologies
Advanced Manufacturing
KETs are indispensable for advanced products

19
Camera
Photonics substrate
Advanced materials
Chip
Microelectronics
Mems
Nanotechnologies
Advanced Manufacturing
KETs are indispensable for advanced products

20
KETs: -Advanced materials -Nanotechnologies -Biotechnologies
KETs: -Advanced manufac turing Systems -Biotechnology KETs: -Nanoelectronics -Photonics Fr
om K
ETs
to fi
nal p
rodu
ct
Material
Equipment
Component
Fro
m p
rodu
ct
to so
ciet
al ch
alle
nge
Product
Solutions & services
Societal challenges
Biomass
Biolsoprene
Biobased Synthesis rubber,
Adhesives, elastomers
Car tyres
Biobased tyres
CO2 reduction Energy efficiency (Climate change)
Car industry
MOCVD reactor
Lighting
GaN
LED
Lamp
Lighting
Energy efficiency
(Climate change)
Nomadic communication
Nano component (Low power)
Litho scanner
Nanoelectronics
Knowledge society
SOI material
Mobile phone
20
KETs are strategic along all value chains

21 Source: Gartner, Own analysis
1980 - Production sites > 25,000 wspm 200mm eq.
Σ 299,953wspm 200mm eq.
Weight of semiconductors
production sites with respect to total semiconductor
production in Europe
GlenrothesGreenock
SwindonChippenham
Bedford
Kiev
ZelenogradMoscow
Vilnius
Bucharest
Zarnovica
Genoa
Catane
NantesTours
Toulouse
NijmegenStadskanaal
Hamburg
Freising
Kista-Stockholm
Munich
Cornaredo
Rennes
Oldham
Evolution de la production de semi-conducteurs en Europe
(k wspm éq 200’’)
0
200
400
600
800
1 000
1 200
1 400
1 600
1 800
1980 1985 1990 1995 2000 2005 2010
<100mm’100/125/150
200mm300mm
300mm RTO pilot line
Evolution of the semiconductor manufacturing landscape in Europe, by region, from 1980 to 2010
SMART SPECIALISATION: A CASE-STUDY