Embed Size (px)
Citation preview

Benefits
Key Features
and Results

XLSTAT-ADA’s functions

Canonical correlation analysis
� Studies the correlation between two sets of variables
� Extracts a set of canonical variables that are as closely correlated with both tables as possible and orthogonal to each other.
� Symmetrical method

Canonical correlation analysis
Recording of data on men in a training center,
Two sets of data:
� The physiological data:
• Weight
• Waist
• Pulse
� The exercises the men did:
• Chin-ups
• Sit-ups
• Jumps

Canonical correlation analysis
� Men doing sit-ups or chin-ups have usually a smaller waist.
� In general people training more have a smaller waist and weight.
� Jumping seems to have an impact on the weight but not as much on the waist.

Redundancy analysis
� Redundancy Analysis is an alternative to Canonical Correlation Analysis.
� Non-symmetric method.
� The components extracted from X are such that they are as closely correlated with the variables of Y as possible. Then, the components of Y are extracted so that they are as closely correlated with the components extracted from X as possible.

Redundancy analysis
� Same example as Canonical correlation analysis:
Recording of data on men in a training center,
Two sets of data:
� The physiological data:• Weight
• Waist
• Pulse
� The exercises the men did:• Chin-ups
• Sit-ups
• Jumps

Redundancy analysis
� Same relationships are observed:
• Men doing more sit-ups or chin-ups have usually a smaller waist.
• In general people training more have a smaller waist and weight.
• Jumping seems to have an impact on the weight but not as much on the waist.
Note that the first factor is explaining more variance than in canonical correlation
analysis (93,30)
� The larger the waist, the lower the pulse

Redundancy analysis
� It is possible to project the observations in the same graphic.
� It is easy to visualize which men are doing more exercises and the one being fitter.

Canonical Correspondence Analysis
� Canonical Correspondence Analysis (CCA) was developed to allow ecologists to relate the abundance of species to environmental variables.
� CCA � simultaneous representation of the sites, the objects, and the variables
describing the sites.
� Principles of Canonical Correspondence Analysis
T1n
sites
p
species
T2n
sites
q
descriptive variables
Contingency table
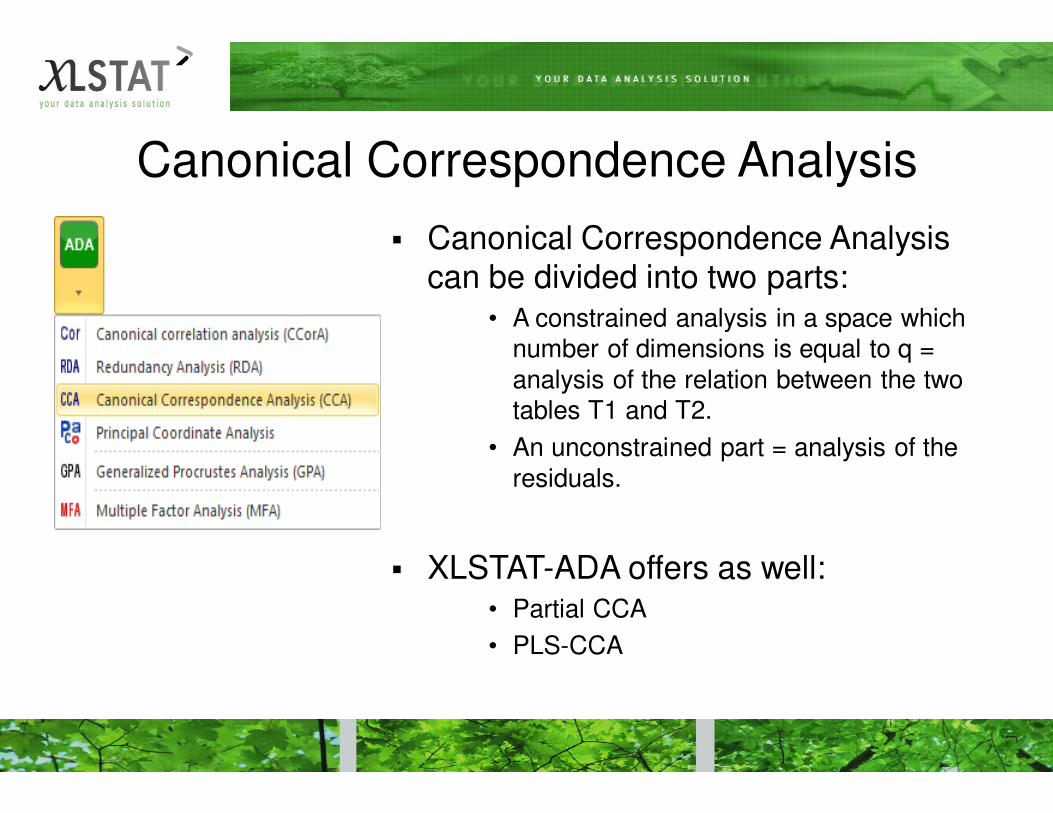
Canonical Correspondence Analysis
� Canonical Correspondence Analysis can be divided into two parts:
• A constrained analysis in a space which
number of dimensions is equal to q =
analysis of the relation between the two
tables T1 and T2.
• An unconstrained part = analysis of the
residuals.
� XLSTAT-ADA offers as well: • Partial CCA
• PLS-CCA

Canonical Correspondence Analysis
� Contingency table:
• the counts of 10 species of insects
• on 12 different sites in a tropical region.
� A second table includes 3 quantitative variables that describe the 12 sites:
• altitude,
• humidity,
• and distance to the lake.

Canonical Correspondence Analysis
� Some insects: insects 2, 4 and 5 prefer the humid sites, such as sites 7 to 12, while some prefer dry climates such as insects 1, 6, 8 and 10.
� Insect 9 prefers a climate with higher altitude

Principal coordinate analysis
� Principal Coordinate Analysis is aimed at graphically representing a resemblance matrix between p elements.
� The algorithm can be divided into three steps:

Principal coordinate analysis
� Principal Coordinate Analysis is aimed at graphically representing a resemblance
matrix between p elements.
� The algorithm can be divided into three
steps:
1. Computation of a distance matrix for
the p elementsp
n
x11 x12 x1p
xn1 xn2 xnp
p
p
0 d12 d1p
0
0
0
0
dp1 dp2 0

Principal coordinate analysis
� Principal Coordinate Analysis is aimed at graphically representing a resemblance
matrix between p elements.
� The algorithm can be divided into three
steps:
2. Centering of the matrix by rows and
columnsp
n
p
p
x11 x12 x1p
xn1 xn2 xnp
0 d12 d1p
0
0
0
0
dp1 dp2 0
p
p
-r1-c1 d1p-r1-cp
dij-ri-cj
dp1-rp-c1 -rp-cp

Principal coordinate analysis
� Principal Coordinate Analysis is aimed at graphically representing a resemblance
matrix between p elements.
� The algorithm can be divided into three
steps:
3. Eigen-decomposition of the centered distance matrix
p
n
p
p
x11 x12 x1p
xn1 xn2 xnp
0 d12 d1p
0
0
0
0
dp1 dp2 0
p p
pt
t
p
p
-r1-c1 d1p-r1-cp
dij-ri-cj
dp1-rp-c1 -rp-cp

Principal coordinate analysis
� Principal Coordinate Analysis is aimed at graphically representing a resemblance
matrix between p elements.
� The algorithm can be divided into three
steps:
� The rescaled eigenvectors correspond to
the principal coordinates that can be used
to display the p objects in a space with 1,
2, p-1 dimensions.
1. Computation of a distance matrix for the p elements
2. Centering of the matrix by rows and columns
3. Eigen-decomposition of the centered distance
matrix

Principal coordinate analysis
� 5 products are graded by 10 individuals
P1 P2 P3 P4 P5
Ind1 2 1 4 5 3
Ind2 3 1 2 5 4
Ind3 1 2 4 3 5
Ind4 3 2 4 5 1
Ind5 3 2 4 5 1
Ind6 2 1 3 5 4
Ind7 1 3 4 2 5
Ind8 3 1 2 4 5
Ind9 3 1 2 5 4
Ind10 1 4 5 2 1
Average 2,2 1,8 3,4 4,1 3,3
Note that product 4 is preferable.

Principal coordinate analysis
� The results is a map of the proximity of the 5 products.
� P1 and P3 are the most similar products.

Generalized Procrustes Analysis (GPA)
� GPA is a pretreatment used to:
• reduce the scale effects
• and obtain a consensual configuration
on data where products have been
graded by several judges.
� GPA compares the proximity between
the terms that are used by different
experts to describe products.

Generalized Procrustes Analysis (GPA)
� 10 experts graded 4 cheeses for 3 sensory attributes:
• Acidity
• Strangeness
• Hardness
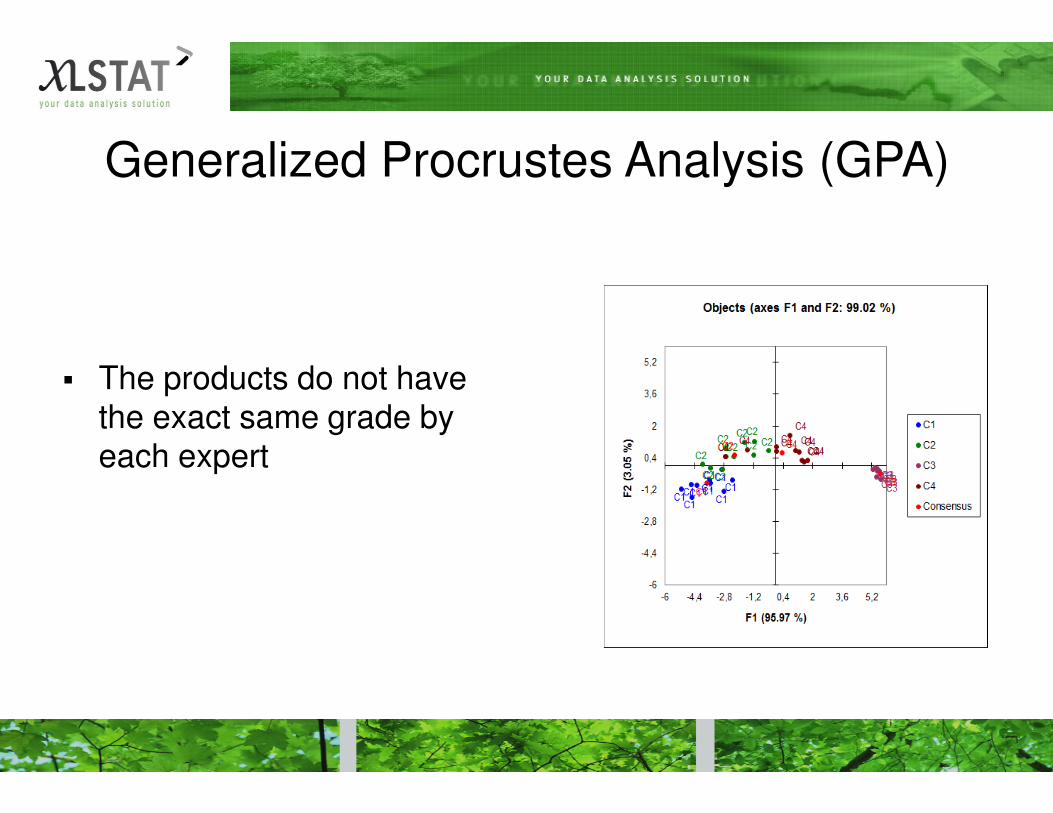
Generalized Procrustes Analysis (GPA)
� The products do not have the exact same grade by each expert

Generalized Procrustes Analysis (GPA)
� A consensus can be found for the position of each product
� Cheese 1 and 2 are the strangest
� Cheese 3 is the Hardest

Generalized Procrustes Analysis (GPA)
� Strangeness is not graded in the same way by the different experts
� Acidity and Hardness are quite reproducible

Multiple Factor Analysis (MFA)
� MFA is a generalization of PCA (Principal Component Analysis) and MCA (Multiple Correspondence Analysis).
� MFA makes it possible to:
• Analyze several tables of variables simultaneously,
• Obtain results that allow studying the
relationship between the observations,
the variables and tables.

� 36 experts have graded 21 wines analysed on several criteria:
• Olfactory (5 variables)
• Visual (3 variables)
• Taste (9 variables)
• Quality (2 variables)
Multiple Factor Analysis (MFA)

Multiple Factor Analysis (MFA)
� MFA groups the information on one chart

Multiple Factor Analysis (MFA)
� MFA groups the information on one chart

Multiple Factor Analysis (MFA)
� Wine 13 is in the direction of the two quality variables and is therefore the wine of preference.

Multiple Factor Analysis (MFA)
� The olfactory criteria are often increasing the distance between the wines.

Penalty analysis
� Identify potential directions for the improvement of products, on the basis of surveys performed on consumers or experts.
� Two types of data are used:
• Preference data (or liking scores) for a product or for a characteristic of a product
• Data collected on a JAR (Just About
Right) scale

Penalty analysis
A type of potato chips is evaluated:
� By 150 consumers
� On a JAR scale (1 to 5) for 4 attributes: • Saltiness, • Sweetness, • Acidity, • Crunchiness.
� And on an overall liking (1 to 10) score scale

Penalty analysis
Mean of Liking for JAR – Mean of Liking for too little
and too much

Semantic differential charts
� The semantic differential method is a visualization method to plot the differences between individuals' connotations for a given word.
� This method can be used for:
• Analyzing experts’ agreement on the perceptions of a product described by a
series of criteria on similar scales
• Analyzing customer satisfaction surveys
and segmentation
• Profiling products

Semantic differential charts
� 1 yoghurt
� 5 experts
� 6 attributes:
• Color
• Fruitiness
• Sweetness
• Unctuousness
• Taste
• Smell

Semantic differential charts
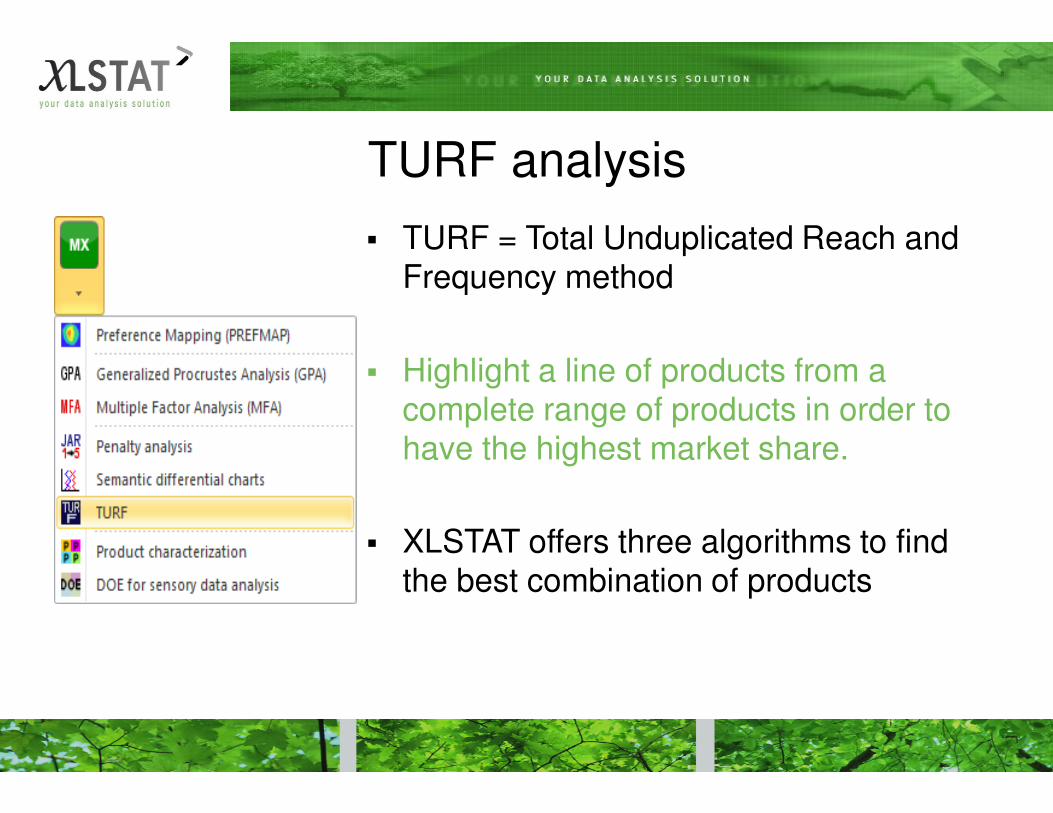
TURF analysis
� TURF = Total Unduplicated Reach and Frequency method
� Highlight a line of products from a complete range of products in order to have the highest market share.
� XLSTAT offers three algorithms to find the best combination of products

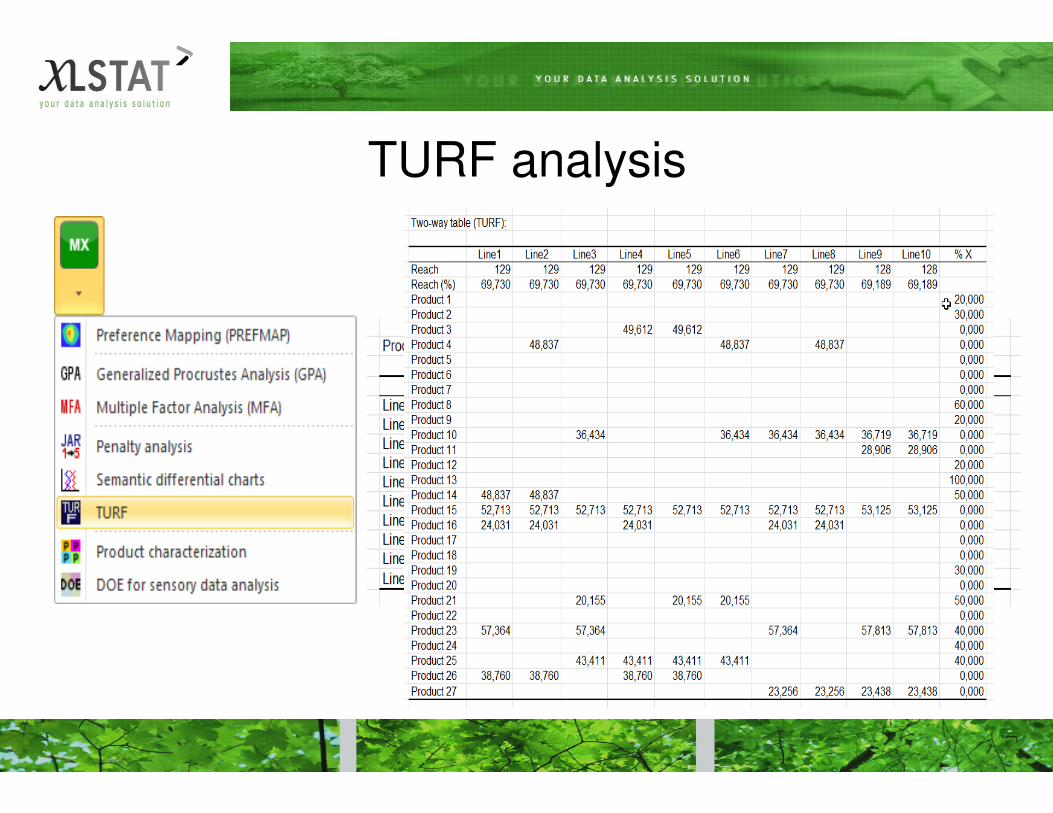
TURF analysis
� 27 possible dishes
� 185 customers
� "Would you buy this product?" (1: No, not at all to 5: Yes, quite sure).
� The goal is to obtain a product line of 5 dishes maximizing the reach
TURF analysis

Product characterization
� Find which descriptors are discriminating well a set of products and which the most important characteristics of each product are.
� All computations are based on the analysis of variance (ANOVA) model.
� Check the influence on the scores of attributes of:
• Product
• Judge
• Session
• Judge*Product

Product characterization
� 29 assessors
� 6 chocolate drinks
� 14 characteristics:
• Cocoa and milk taste and flavor
• Other flavors: Vanilla, Caramel
• Tastes: bitterness, astringency,
acidity, sweetness
• Texture: granular, crunchy, sticky, melting

Product characterization

DOE for sensory data analysis
� Designing an experiment is a fundamental step to ensure that the collected data will be statistically usable in the best possible way.

DOE for sensory data analysis
� Prepare a sensory evaluation where judges (experts and/or consumers) evaluate a set of products taking into account:
• Number of judges to involve
• Maximum number of products that a judge can evaluate during each session
• Which products will be evaluated by each of the consumers in each session, and in what order (carry-over)
� Complete plans or incomplete block designs, balanced or not.
� Search optimal designs with A- or D-efficiency

� 60 judges
� 8 products
� Saturation: 3 products / judge
DOE for sensory data analysis

DOE for sensory data analysis

DOE for sensory data analysis

Let XLSTAT-ADA complete your advanced analytical
needs
INFO:
GMSL s.r.l. - Scientific Software Distributor
Via Giovanni XXIII, 21- 20014
Nerviano (Mi) - ITALY
Tel: +39 0331587511
email: [email protected]