Embed Size (px)
Citation preview

"A4
rb_
sta
nd
ard
_b
an
d_p
ho
to" –
20
10
01
11 –
do
no
t d
ele
te th
is te
xt o
bje
ct!
Key Findings:
EFInA Access to Financial Services in Nigeria
(A2F) 2016 Survey
Updated July, 2017

"A4
rb_
sta
nd
ard
_b
an
d_p
ho
to" –
20
10
01
11 –
do
no
t d
ele
te th
is te
xt o
bje
ct!
2
A
B
C
D
F
Background
Financial Access Strands (FAS)
Deeper Analysis of Financial Sector Segments
Post Survey Focus Group Discussions
Closing Remarks
E Forecasts of Financial Access Strands (FAS)
Contents

"A4
rb_
sta
nd
ard
_b
an
d_p
ho
to" –
20
10
01
11 –
do
no
t d
ele
te th
is te
xt o
bje
ct!
A. Background
"A4
rb_
sta
nd
ard
_b
an
d_p
ho
to" –
20
10
01
11 –
do
no
t d
ele
te th
is te
xt o
bje
ct!
4
Background
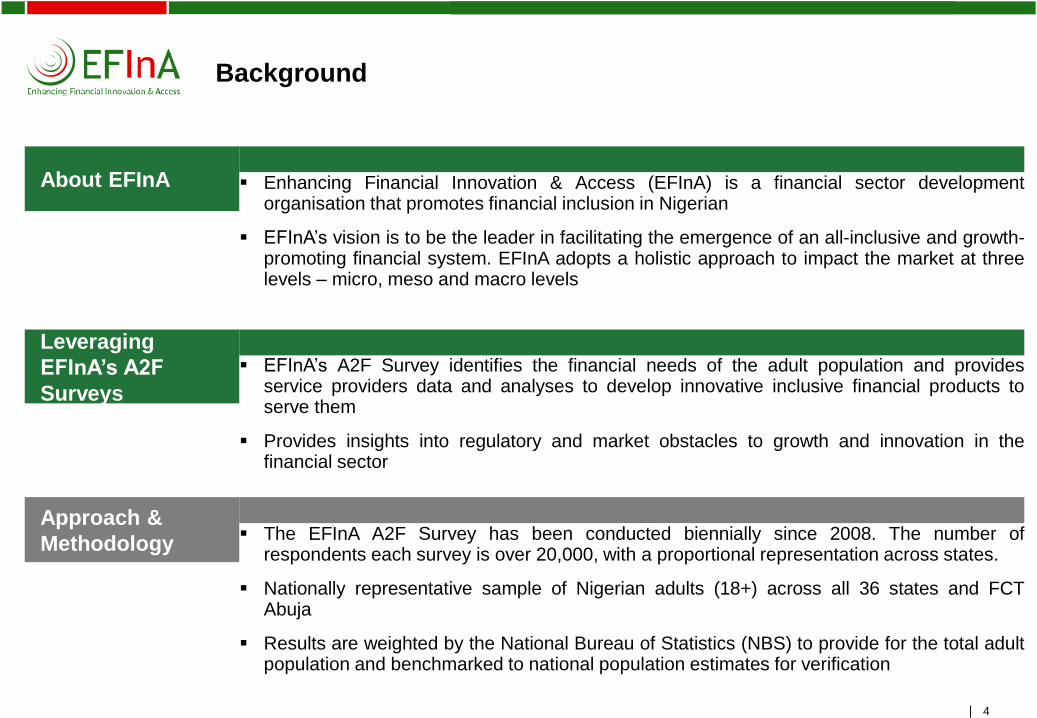
About EFInA ▪ Enhancing Financial Innovation & Access (EFInA) is a financial sector developmentorganisation that promotes financial inclusion in Nigerian
▪ EFInA’s vision is to be the leader in facilitating the emergence of an all-inclusive and growth-promoting financial system. EFInA adopts a holistic approach to impact the market at threelevels – micro, meso and macro levels
Leveraging
EFInA’s A2F
Surveys
▪ EFInA’s A2F Survey identifies the financial needs of the adult population and providesservice providers data and analyses to develop innovative inclusive financial products toserve them
▪ Provides insights into regulatory and market obstacles to growth and innovation in thefinancial sector
Approach &
Methodology▪ The EFInA A2F Survey has been conducted biennially since 2008. The number of
respondents each survey is over 20,000, with a proportional representation across states.
▪ Nationally representative sample of Nigerian adults (18+) across all 36 states and FCTAbuja
▪ Results are weighted by the National Bureau of Statistics (NBS) to provide for the total adultpopulation and benchmarked to national population estimates for verification

"A4
rb_
sta
nd
ard
_b
an
d_p
ho
to" –
20
10
01
11 –
do
no
t d
ele
te th
is te
xt o
bje
ct!
5
Coverage and Methodology for the A2F 2016 Survey
Design Provided by the National Bureau of Statistics (NBS)
• Sampling of respondents was based on proportional representation per State
Coverage Nationally representative sample of Nigerian adults (18+) across all 36 States and FCT Abuja
• Achieved 23,072 interviews (96% of target sample)
• Household listing and data collection was conducted from June to September 2016 by
Research Firm - Ipsos Nigeria, with supervision from the National Bureau of Statistics
(NBS)
Questionnaire The questionnaire (in English), was translated into and also administered in Hausa, Yoruba,
Igbo and Pidgin English
Results • Results were weighted by the NBS to provide for the total adult population.
• Also benchmarked to national population estimates for verification

"A4
rb_
sta
nd
ard
_b
an
d_p
ho
to" –
20
10
01
11 –
do
no
t d
ele
te th
is te
xt o
bje
ct!
Nigeria at a Glance

"A4
rb_
sta
nd
ard
_b
an
d_p
ho
to" –
20
10
01
11 –
do
no
t d
ele
te th
is te
xt o
bje
ct!
7Source: EFInA Access to Financial Services in Nigeria 2016 survey
Demographic Profile
The total adult population (18 years and above) of
Nigeria is 96.4 million
Of this adult population:
• 59.6m (61.9%) are based in rural areas
• 56.2m adults (58.3%) are under 35 years
• 18.4m adults (19.1%) get their main source of
income from subsistence/commercial farming
• 18.9m adults (19.6%) get their main source of
income from own business (non-farming)
• 7.9m adults (4.2%) get their main source of
income from the formal sector
• 21.8m adults (22.6%) have no formal education
19.1%
Rely mainly
on farming
58.3% under
35 years
60.4%
Own a mobile
phone
22.6% have
no formal
education
61.9% Rural
50.8% | 49.2%
Adult
Population
96.4m

"A4
rb_
sta
nd
ard
_b
an
d_p
ho
to" –
20
10
01
11 –
do
no
t d
ele
te th
is te
xt o
bje
ct!
8
Snapshot Of Key Economic Indicators – Nigeria (1 of 2)
157 156 168 197
310
100
200
300
400
2012 2013 2014 2015 2016
USD/Naira Exchange rate (Max. Selling Rate: Official)
Source: CBN
Source: CBN
114 111 100
53 41.8
10 30 50 70 90
110
2012 2013 2014 2015 2016
Crude Oil Price (US$/Barrel)
40.5 80.1 89.0 94.1 101.6
-
100.0
200.0
2012 2013 2014 2015 2016
Gross Domestic Product in Naira (Trillions)
Source: National Bureau Of Statistics (NBS)

"A4
rb_
sta
nd
ard
_b
an
d_p
ho
to" –
20
10
01
11 –
do
no
t d
ele
te th
is te
xt o
bje
ct!
9
Snapshot Of Key Economic Indicators – Nigeria (2 of 2)
24 25
26 27
27
22
24
26
28
2012 2013 2014 2015 2016
Maximum Lending Rate
135147
159173
190
100
125
150
175
200
2012 2013 2014 2015 2016
Average CPI
10.6 107.8 9.0
12.1
0
5
10
15
2012 2013 2014 2015 2016
Unemployment Rate
The Consumer Price Index (CPI) measures the average change over time in
prices of goods and services consumed by people for day-to-day living•
Source: National Bureau Of Statistics (NBS)
Source: National Bureau Of Statistics (NBS)
Source: CBN (Money Market Indicators In Percentage)

"A4
rb_
sta
nd
ard
_b
an
d_p
ho
to" –
20
10
01
11 –
do
no
t d
ele
te th
is te
xt o
bje
ct!
10
From 2015 Nigeria Started Experiencing an Economic Downturn to the Decline in Oil Prices
Household (HH) consumption fell year on year by 1.05% in the first of
2016 and by 6.00% in the second quarter of 2016.
In the same period, unemployment rose to 12.1% and 13.3%, compared
to 7.5% and 8.2% in the first and second quarters of 2015.
This reflects the difficulties that consumers faced in 2016, with
rising unemployment, and high inflation eroding purchasing power.
*according to the conventional definition of two consecutive quarters of negative growth
Source: NBS - Nigerian Gross Domestic Product Report (Expenditure and Income approach) Q1, Q2 2016
GDP EmploymentOil Revenue
SavingsCurrency Value
Population
Economy Population
Declining oil revenues
triggered a reduction in
the federal government
income and culminated
in a recession* in the first
half of 2016.

"A4
rb_
sta
nd
ard
_b
an
d_p
ho
to" –
20
10
01
11 –
do
no
t d
ele
te th
is te
xt o
bje
ct!
B. Financial Access Strands (FAS)

"A4
rb_
sta
nd
ard
_b
an
d_p
ho
to" –
20
10
01
11 –
do
no
t d
ele
te th
is te
xt o
bje
ct!
12
Definition of the Access Strand
Financially excluded: Adults who do not have or use
deposit money banks, other formal or any informal
financial services. If they borrow or remit they do this
through family and friends; if they save, they save at
home.
Banked: Adults who have/use deposit money banks (including adults who use products through somebody else) i.e.
they have/use traditional bank products such as ATM card, credit card, savings account, current account, fixed deposit
account, mortgage, overdraft, loan from a bank, or non-interest banking product.
Formal other: Adults who have or use financial products and/or services provided by
formal financial institutions which are not deposit money banks (including those adults
who use the products through somebody else) such as insurance companies,
microfinance banks, pension schemes or shares. It also includes remittances (through
formal channels).
Informal only: Adults who do not have or use deposit money banks or
formal financial products and services but use informal financial services
such as savings clubs/pools, esusu, ajo, or moneylenders; as well as
remittances (through informal channels such as via a transport service or
recharge card).
Adult Population
(96 Million)
Financially Served
Formal Inclusion
Banked Formal Other
Informal Inclusion
Financially Excluded
The access strand categories are mutually exclusive and hierarchical. Each adult can only be included in one segment.

"A4
rb_
sta
nd
ard
_b
an
d_p
ho
to" –
20
10
01
11 –
do
no
t d
ele
te th
is te
xt o
bje
ct!
13Source: EFInA Access to Financial Services in Nigeria 2016 survey
38.3% 10.3% 9.8% 41.6%
Financial Access Strand 2016
BankedFormal
other
Informal
only Financially excluded
48.6% Formally included
58.4% Financially served 41.6% Financially excluded
36.9m 40.1m9.4m10.0m
These four strands are mutually exclusive
96.4m
• A large proportion of the adult population are financially excluded

"A4
rb_
sta
nd
ard
_b
an
d_p
ho
to" –
20
10
01
11 –
do
no
t d
ele
te th
is te
xt o
bje
ct!
14Source: EFInA Access to Financial Services in Nigeria 2008/2010/2012/2014/ 2016 survey
Trends In Financial Access Strand – 2008 to 2016
93.5 m
Adult Population18+ Years
87.9 m
Between 2014 and 2016:• The adult population growth outpaced the growth in the banked population• The financially excluded population grew from 36.9 million to 40.1 million • Contribution of MFBs to formal financial inclusion declined, with adult users reducing from 2.6m to 1.8m
21.1%
30.0%
32.5%
36.3%
38.3%
2.5%
6.3%
10.5%
12.3%
10.3%
23.9%
17.4%
17.3%
11.9%
9.8%
52.5%
46.3%
39.7%
39.5%
41.6%
2008
2010
2012
2014
2016
Banked Formal other Informal only Financially excluded
Financially excluded
33.9m 36.9m11.3m11.5m
28.6m 34.9m15.2m9.2m
25.4m 39.2m14.8m5.3m
18.3m 45.4m20.7m2.2m
Financially excluded
36.9m 40.1m9.4m10.0m
96.4 m
84.7 m
86.6m

"A4
rb_
sta
nd
ard
_b
an
d_p
ho
to" –
20
10
01
11 –
do
no
t d
ele
te th
is te
xt o
bje
ct!
15
Financial Access - Cross Country Comparisons
Note: There are some differences in the classification of products/services in the categories of the access strand between the countries
Source: FinScope; FinAccess National Survey, Kenya; EFInA Access to Financial Services in Nigeria 2016 survey
12.0%
18.0%
21.4%
26.0%
36.0%
38.3%
42.3%
77.0%
17.0%
27.0%
16.8%
42.0%
22.0%
10.3%
33.0%
6.0%
30.0%
15.0%
21.1%
21.0%
17.0%
9.8%
7.2%
3.0%
41.0%
40.0%
40.7%
11.0%
25.0%
41.6%
17.4%
13.0%
Madagascar 2016
Togo 2016
Zambia 2015
Rwanda 2016
Ghana 2015
Nigeria 2016
Kenya 2016
South Africa 2015
Banked Formal other Informal only Financially excluded
• Compared to the selected countries, Nigeria has a fairly large banked population (38.3%), but also has the
highest proportion of financially excluded adults at 41.6%

"A4
rb_
sta
nd
ard
_b
an
d_p
ho
to" –
20
10
01
11 –
do
no
t d
ele
te th
is te
xt o
bje
ct!
16Source: EFInA Access to Financial Services in Nigeria 2016 survey
Emerging Trends
16
2.0% Increase in banked adults, but overall decrease in financially served adults• The financially served proportion of the Nigeria’s adult population grew by an average of 6.4% between 2008
and 2012. This growth slowed down to 0.2% in 2014, with an eventual decline of 2.1% in 2016• This decline was driven by a reduction in the proportion of adults accessing financial services through Other
formal providers (other than DMBs) and informal financial providers• Deposit money banks have been better able to withstand the economic crisis and maintain their customer
acquisition drive at the expense of formal other channels like MFBs most of which have struggled under theeconomic strain
• Banks have focused more on the population that already has some level of financial stability – this group isbetter able to cushion the effects of the economic hardship in the short term
Shrinking access through ‘Formal Other’ and ‘Informal’ segments• MFBs struggling under the burden of re-capitalisation during the tough economic climate• Lack of trust of MFBs – approx. 12.1% insolvent since Jan. 2016• Less income available to the B-O-P to save through cooperatives and other informal channels hence resorting
to keeping monies at home or on self
2.1% Increase in excluded adults• Effects of recession (loss of jobs, lower disposable income, increasing inflation) have an immediate negative
effect on the B-O-P population who do not have the means to cushion themselves against these shocks.• The most affected are the those aged 18 – 25 years, above 56 years and living in the rural areas

"A4
rb_
sta
nd
ard
_b
an
d_p
ho
to" –
20
10
01
11 –
do
no
t d
ele
te th
is te
xt o
bje
ct!
Financial Access Strands (FAS)Across Geopolitical Zones

"A4
rb_
sta
nd
ard
_b
an
d_p
ho
to" –
20
10
01
11 –
do
no
t d
ele
te th
is te
xt o
bje
ct!
18Source: EFInA Access to Financial Services in Nigeria 2012/2014/ 2016 survey
Financial Access Performance Across Geo-Political Zones
18
North East 2012 2014 2016
Total Adult
Population11M 11M 12M
Formally Included 26% 26% 25%
Informal Only 15% 5% 14%
Financially Excluded 60% 68% 62%
South South 2012 2014 2016
Total Adult
Population14M 15M 16M
Formally Included 52% 52% 55%
Informal Only 18% 15% 14%
Financially Excluded 30% 33% 31%
North West 2012 2014 2016
Total Adult
Population19M 21M 22M
Formally Included 23% 35% 24%
Informal Only 14% 9% 6%
Financially Excluded 64% 56% 70%
North Central 2012 2014 2016
Total Adult
Population13M 14M 14M
Formally Included 48% 49% 48%
Informal Only 20% 19% 14%
Financially Excluded 32% 33% 39%
South West 2012 2014 2016
Total Adult
Population19M 20M 21M
Formally Included 58% 63% 78%
Informal Only 18% 13% 4%
Financially Excluded 25% 25% 18%
South East 2012 2014 2016
Total Adult
Population12M 12M 12M
Formally Included 52% 63% 59%
Informal Only 22% 11% 13%
Financially Excluded 26% 25% 28%
Kogi
Adamawa
Akwa
Ibom
Bauchi
Baye-
lsa
Benue
Borno
Cross
RiverDelta
EbonyiEdo
Ekiti
Enugu
FCT
Gombe
Imo
Jigawa
Kaduna
Kano
Katsina
Kebbi
Kwara
Lagos
Nasarawa
Niger
Ogun
Ondo
Osun
Oyo
Plateau
Rivers
Sokoto
Taraba
YobeZamfara
Abia
Ana-
mbra
"A4
rb_
sta
nd
ard
_b
an
d_p
ho
to" –
20
10
01
11 –
do
no
t d
ele
te th
is te
xt o
bje
ct!
19
Summary of Findings By Geopolitical Zones
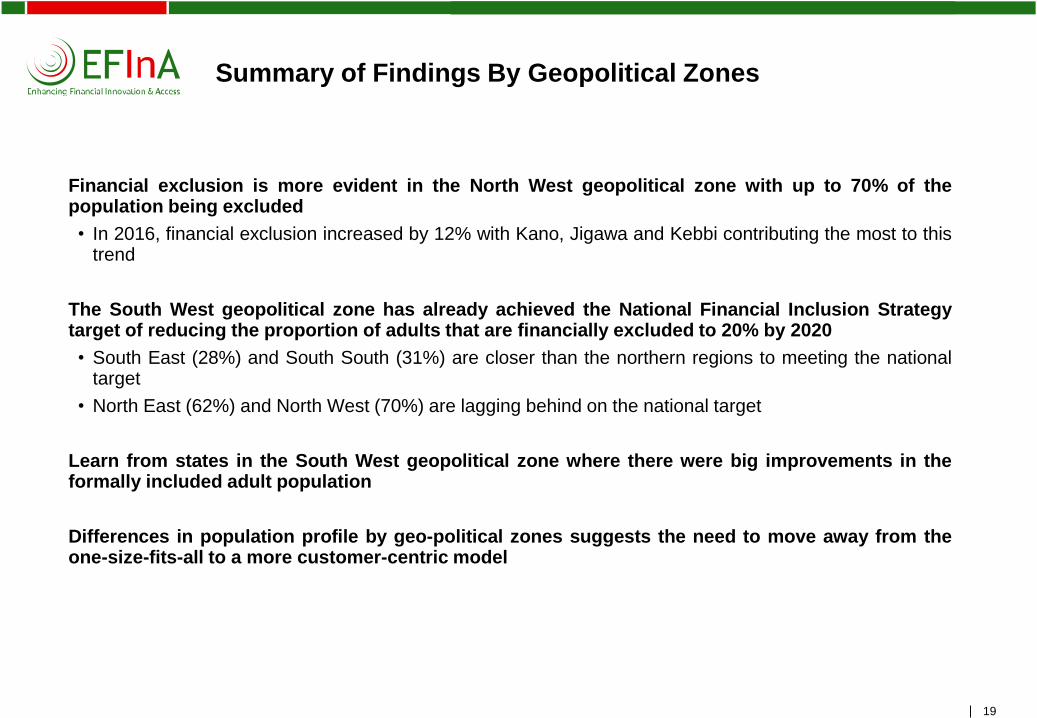
Financial exclusion is more evident in the North West geopolitical zone with up to 70% of thepopulation being excluded
• In 2016, financial exclusion increased by 12% with Kano, Jigawa and Kebbi contributing the most to thistrend
The South West geopolitical zone has already achieved the National Financial Inclusion Strategytarget of reducing the proportion of adults that are financially excluded to 20% by 2020
• South East (28%) and South South (31%) are closer than the northern regions to meeting the nationaltarget
• North East (62%) and North West (70%) are lagging behind on the national target
Learn from states in the South West geopolitical zone where there were big improvements in theformally included adult population
Differences in population profile by geo-political zones suggests the need to move away from theone-size-fits-all to a more customer-centric model

"A4
rb_
sta
nd
ard
_b
an
d_p
ho
to" –
20
10
01
11 –
do
no
t d
ele
te th
is te
xt o
bje
ct!
Financial Access Strands (FAS)Across Population Demographics

"A4
rb_
sta
nd
ard
_b
an
d_p
ho
to" –
20
10
01
11 –
do
no
t d
ele
te th
is te
xt o
bje
ct!
21Source: EFInA Access to Financial Services in Nigeria 2016 survey
Financial Access by Gender
21
46.3%
30.0%
38.3%
8.2%
12.6%
10.3%
8.7%
10.9%
9.8%
36.8%
46.6%
41.6%
Male
Female
Total
Banked Formal other
22.7m 18.0m4.3m
14.2m 22.1m5.2m
4.0m
6.0m
36.9m 40.1m9.4m10.0m
• Financial access is skewed towards male adults• Adult men are more likely to be banked than adult women• Adult women tend to use more formal other and informal financial services than adult men
"A4
rb_
sta
nd
ard
_b
an
d_p
ho
to" –
20
10
01
11 –
do
no
t d
ele
te th
is te
xt o
bje
ct!
22Source: EFInA Access to Financial Services in Nigeria 2016 survey
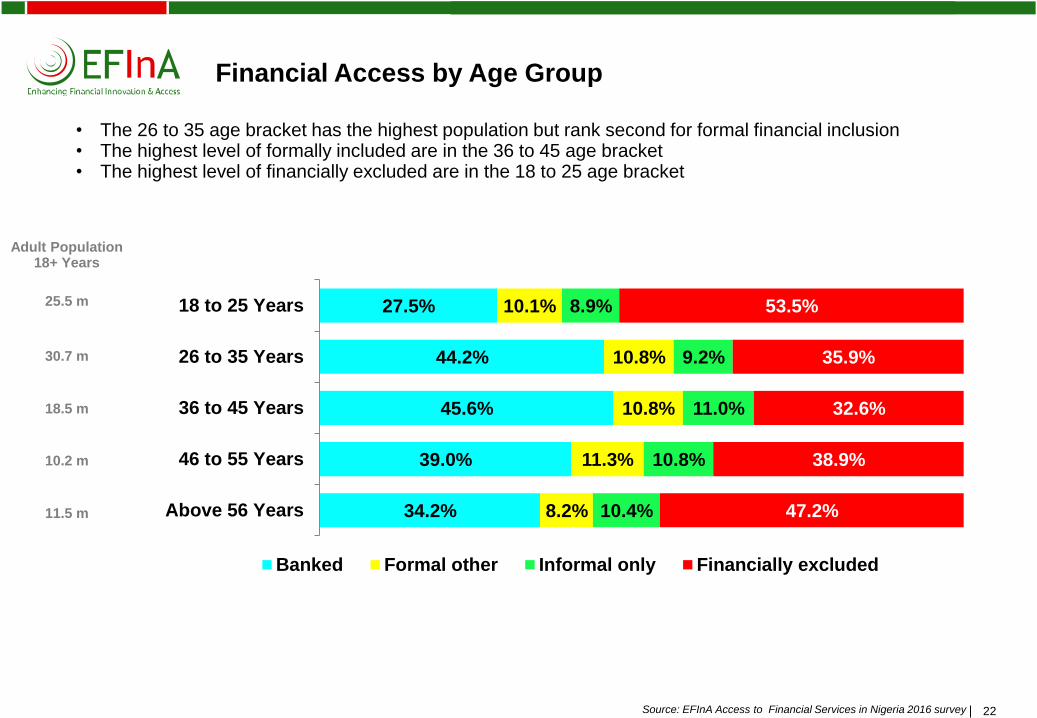
Financial Access by Age Group
22
27.5%
44.2%
45.6%
39.0%
34.2%
10.1%
10.8%
10.8%
11.3%
8.2%
8.9%
9.2%
11.0%
10.8%
10.4%
53.5%
35.9%
32.6%
38.9%
47.2%
18 to 25 Years
26 to 35 Years
36 to 45 Years
46 to 55 Years
Above 56 Years
Banked Formal other Informal only Financially excluded
• The 26 to 35 age bracket has the highest population but rank second for formal financial inclusion• The highest level of formally included are in the 36 to 45 age bracket• The highest level of financially excluded are in the 18 to 25 age bracket
30.7 m
Adult Population18+ Years
18.5 m
25.5 m
10.2 m
11.5 m

"A4
rb_
sta
nd
ard
_b
an
d_p
ho
to" –
20
10
01
11 –
do
no
t d
ele
te th
is te
xt o
bje
ct!
23Source: EFInA Access to Financial Services in Nigeria 2016 survey
Financial Access by Urban/Rural Setting
23
60.9%
24.4%
38.3%
10.4%
10.3%
10.3%
4.3%
13.1%
9.8%
24.4%
52.2%
41.6%
Urban
Rural
Total
Banked Formal other Informal only Financially excluded
22.4m 8.9m1.6m3.8m
14.6m 31.2m7.8m6.1m
36.9m 40.1m9.4m10.0m
36.7m
59.7m
96.4m
• Banking services are not getting to rural areas
• Informal financial services are more dominant in the rural areas
Adult Population18+ Years

"A4
rb_
sta
nd
ard
_b
an
d_p
ho
to" –
20
10
01
11 –
do
no
t d
ele
te th
is te
xt o
bje
ct!
24Source: EFInA Access to Financial Services in Nigeria 2016 survey
Profile of the Financially Excluded Adults (1 of 2)
40.1mFinancially
Excluded
F
M 44.9%
55.1%
18.3%
11.9%
38.2%
13.2%
9.8% 8.5%
Individuals Owning
Mobile phone(s)
35.2%96.4mTotal Adult Population
Main Income Source
Own business/trader (non-
farming/Services) 24.3%
Subsistence/small scale farming 19.6%
Own business/trader (Agric
products/Inputs) 12.0%
From HH member/Family/Friends 10.4%
Commercial/large scale farming 6.0%
Salary/Wages (Informal Sector) 3.1%
Salary/Wages (Formal Sector) 0.8%
Pension 0.0%
Others 23.8%
Urban22.3%
Rural77.7%
• 61.5% are under 35 years
• 56.6% are in NE and NW Nigeria
• 55.1% are female
• Only 4% are aware of MM
Women, the Youth (under 35 years), Rural residents and those in Northern Nigeria (North East and North West)
are the most financially excluded

"A4
rb_
sta
nd
ard
_b
an
d_p
ho
to" –
20
10
01
11 –
do
no
t d
ele
te th
is te
xt o
bje
ct!
25Source: EFInA Access to Financial Services in Nigeria 2016 survey
Profile of the Financially Excluded Adults (2 of 2)
Excluded
Population
40,092,008
Income
N250 or Less 8.4%
N251 - N1,000 8.4%
N1,001 - N3,000 17.9%
N3,001 - N6,000 18.7%
N6,001 - N13,000 19.6%
N13,001 - N20,000 11.0%
N20,001 - N40,000 9.2%
N40,001 - N70,000 3.9%
N70,001 - N100,000 1.5%
N100,001 - N200,000 0.9%
Above N200,000 0.7%
Highest Level of Education
Primary School 26.6%
Secondary School 32.2%
University/OND/HND 1.7%
Post University 0.2%
Non-formal education 18.4%
No education 21.0%
44.9%
Saved (Past 12 Months)
26.5%
Borrowed (Past 12 Months)
16.6%
Received money from Friends/ Family
In the past 12 months:
• 44.9% have saved at home
• 26.5% have borrowed from family

"A4
rb_
sta
nd
ard
_b
an
d_p
ho
to" –
20
10
01
11 –
do
no
t d
ele
te th
is te
xt o
bje
ct!
26
Implications for Financial Inclusion
Both challenges and opportunities exist for financial access, during the economic downturn
Challenges
• Financial institutions:
- With a downturn in the economic climate, institutions tend to focus on short-term, income generating
activities rather than long term innovations to drive financial inclusion
• Low-income population:
- Greater levels of poverty, less employment/income-generating opportunities
- Banking/formal financial access is not their priority
- They are more focused on survival & marginal economic activities
Opportunities
• Large numbers of unbanked people, not just at the base of the pyramid
• Develop a broad range of relevant products and services (micro-insurance, micro-pensions, etc.) that can be
provided through digital and non-digital channels
• Focus on SMEs, agricultural producers, households and individuals, especially those in the informal sector
• Focus on women and youth (under-served groups), to reverse loss of productivity to the economy
"A4
rb_
sta
nd
ard
_b
an
d_p
ho
to" –
20
10
01
11 –
do
no
t d
ele
te th
is te
xt o
bje
ct!
C. Deeper Analysis of Financial Sector Segments

"A4
rb_
sta
nd
ard
_b
an
d_p
ho
to" –
20
10
01
11 –
do
no
t d
ele
te th
is te
xt o
bje
ct!
28Source: EFInA Access to Financial Services in Nigeria 2016 survey
Overlaps in Financial Access
28
38.3%
31.9%
29.1%
41.6%
Banked
Formal Other
Informal
Excluded
Aggregate Levels of Financial Access*
Banked Formal Other
Informal Excluded
*Figures may include overlaps across access strands
Informal
9.8%
Formal Other
2.8%
Banked
13.7%
12.7%3.1%
Excluded 41.6%
7.5%
8.8%
• A large proportion of adults that use formal other services are also banked

"A4
rb_
sta
nd
ard
_b
an
d_p
ho
to" –
20
10
01
11 –
do
no
t d
ele
te th
is te
xt o
bje
ct!
29Source: EFInA Access to Financial Services in Nigeria 2016 survey
Savings: Majority of Nigerian Adults Set Aside Money
• 68.0% of Nigerian adults save
Banked40.7%
Other Formal0.7%
Informal Only
22.1% Save at Home36.5%
Savers Only (Base = 65.6m adults)
68.0% 32.0%
Saving (Base = 96.4m adults)
Saving Not Saving
"A4
rb_
sta
nd
ard
_b
an
d_p
ho
to" –
20
10
01
11 –
do
no
t d
ele
te th
is te
xt o
bje
ct!
30Source: EFInA Access to Financial Services in Nigeria 2016 survey
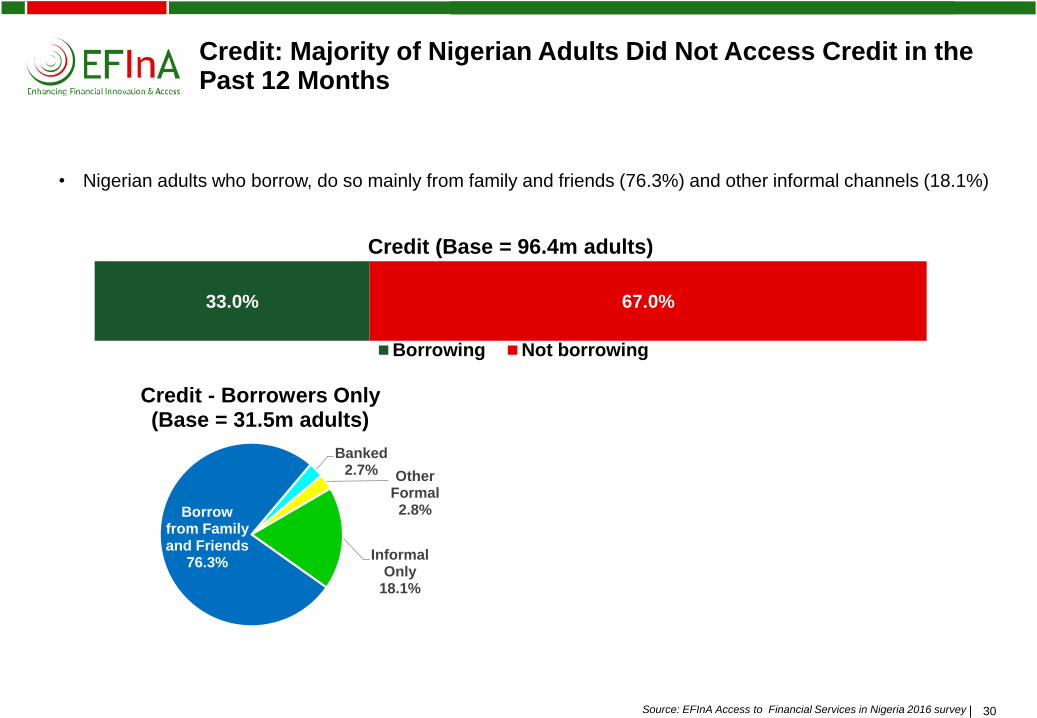
Credit: Majority of Nigerian Adults Did Not Access Credit in the Past 12 Months
• Nigerian adults who borrow, do so mainly from family and friends (76.3%) and other informal channels (18.1%)
Banked2.7% Other
Formal2.8%
Informal Only
18.1%
Borrow from Family and Friends
76.3%
Credit - Borrowers Only (Base = 31.5m adults)
33.0% 67.0%
Credit (Base = 96.4m adults)
Borrowing Not borrowing

"A4
rb_
sta
nd
ard
_b
an
d_p
ho
to" –
20
10
01
11 –
do
no
t d
ele
te th
is te
xt o
bje
ct!
31Source: EFInA Access to Financial Services in Nigeria 2014/ 2016 survey
Financial Segment Access
31
2.8% 1.1% 0.8%
36.3%
1.9% 1.9% 1.0%
38.3%
Microfinance Bank(MFB)
Insurance Mobile Money Deposit Money Bank(DMB)
Proportion of adult population that have access
2014 2016
Marginal changes in access over the past two years across financial segments

"A4
rb_
sta
nd
ard
_b
an
d_p
ho
to" –
20
10
01
11 –
do
no
t d
ele
te th
is te
xt o
bje
ct!
32Source: EFInA Access to Financial Services in Nigeria 2014/ 2016 survey
Mobile Money Usage
32
98.8%
0.4%
0.3%
0.5%
98.7%
0.3%
0.2%
0.8%
You are not registeredand have never used
mobile money services
You have used it beforebut not any more
You use mobile moneyservices but you are not
registered
You are a registeredmobile money user
Mobile Money Experience
2016
2014
Reasons for first time usage
To conduct fast transactions 55.2%
Easy to use 32.5%
Family/friends are using mobile money 22.0%
To store/save money 12.5%
Just to try or test mobile money 10.8%
To conduct safe transactions 8.5%
To pay bills 5.1%
• Mobile money usage is still very low and has not changed significantly since 2014

"A4
rb_
sta
nd
ard
_b
an
d_p
ho
to" –
20
10
01
11 –
do
no
t d
ele
te th
is te
xt o
bje
ct!
33Source: EFInA Access to Financial Services in Nigeria 2014/ 2016 survey
Mobile Money Usage – First Transaction
45.4%
25.0%
15.4%
7.8%
2.4%
2.3%
1.0%
0.7%
19.1%
37.5%
18.3%
7.3%
7.7%
0.4%
1.9%
4.2%
1.0%
2.4%
Sending money
Airtime purchases
Receiving money
Paying bills
Sports betting
Paying for goods or services
Storing/saving money
Receiving payments from customers
Receiving wages/salary
Receiving payments from government
Other, specify
First Transaction Using Mobile Money
2016 2014
• In 2014 more mobile moneyusers started their usagejourney with Airtime purchases
• In 2016, ‘sending money’ wasmore prominent for first timeusers

"A4
rb_
sta
nd
ard
_b
an
d_p
ho
to" –
20
10
01
11 –
do
no
t d
ele
te th
is te
xt o
bje
ct!
34Source: EFInA Access to Financial Services in Nigeria 2014/ 2016 survey
Mobile Money Services
70.8%
45.6%
40.6%
17.1%
11.4%
4.7%
2.7%
1.9%
1.6%
1.5%
0.1%
2.5%
0.2%
23.0%
23.6%
45.8%
19.5%
23.6%
1.7%
4.4%
6.2%
3.9%
3.4%
19.0%
2.5%
Sending money
Receiving money
Airtime purchases
Paying bills
Paying for goods or services
Sports betting
Storing/saving money
Purchasing bus tickets
Receiving wages/salary
Receiving payments from…
Receiving payments from…
Paying for insurance
Don’t know/can’t remember
Other, specify
What do you use mobile money services for?
2016 (Base = 0.9m)
2014 (Base = 0.7m)
• Mobile money transactions have transitioned from being dominated by airtime purchases in 2014 to Sending and receiving money in 2016
Use of Mobile Money agentshas declined marginally from19.5% of users in 2014 to16.2% of users in 2016

"A4
rb_
sta
nd
ard
_b
an
d_p
ho
to" –
20
10
01
11 –
do
no
t d
ele
te th
is te
xt o
bje
ct!
35Source: EFInA Access to Financial Services in Nigeria 2016 survey
Reasons for Not Using Mobile Money
35
0.6%
2.2%
3.7%
4.7%
6.2%
8.8%
16.0%
76.7%
Services I need are not available on mobile money
It is expensive
It is not easy to use
I use other ways to do the same transactions
I do not trust it
No reason
Don’t know where/ how to get mobile money
Don’t know what mobile money is
Reasons for not using Mobile Money
• Lack of awareness and access are the biggest obstacles to the adoption of mobile
money in Nigeria

"A4
rb_
sta
nd
ard
_b
an
d_p
ho
to" –
20
10
01
11 –
do
no
t d
ele
te th
is te
xt o
bje
ct!
D. Post Survey Focus Group Discussions*
*See detailed report at: http://www.efina.org.ng/assets/A2F/2016/Post-Survey-Focus-Group-Discussions.pdf

"A4
rb_
sta
nd
ard
_b
an
d_p
ho
to" –
20
10
01
11 –
do
no
t d
ele
te th
is te
xt o
bje
ct!
37Source: EFInA Post Survey Focus Group Discussions (FGDs) 2017
• The primary objective of the Post Survey Focus Group Discussions (FGD’s) was to identify factors
responsible for changes in the levels of access to financial services over the past two years in some
selected locations.
• For states where there was a significant increase in banked/formal other segments - what were the key
drivers for customers opening their accounts (DMB, MFB, and/or MMO) in the past 2 years?
• For states where there was a significant decrease in the banked/formal other segments - why did
customers close their accounts (DMB, MFB, and/or MMO) in the past 2 years? What can providers do to
encourage them to reopen these accounts?
• 12 FGDs were held between February 17 - 23, 2017 in the locations stated in the table below
Post Survey FGDs: Objectives and Coverage
Geo-political Zone States Rationale
(Comparison A2F 2016 vs. A2F 2014)
South West Ekiti (1) and Osun (1) Banked segment: Ekiti – 21.5%↑; Osun – 15.3%↑
North East Taraba (1) and Yobe (1) Banked segment: Taraba – 11.1%↑; Yobe – 20.5%↑
North West Jigawa (2) and Kano (2) Banked and Formal Other segments: Jigawa – 31.2%↓;
Kano – 28.7%↓
North Central Abuja (2) and Niger (2) Banked segment: Abuja – 21.6↓; Niger – 16.7%↓
"A4
rb_
sta
nd
ard
_b
an
d_p
ho
to" –
20
10
01
11 –
do
no
t d
ele
te th
is te
xt o
bje
ct!
38Source: EFInA Post Survey Focus Group Discussions (FGDs) 2017
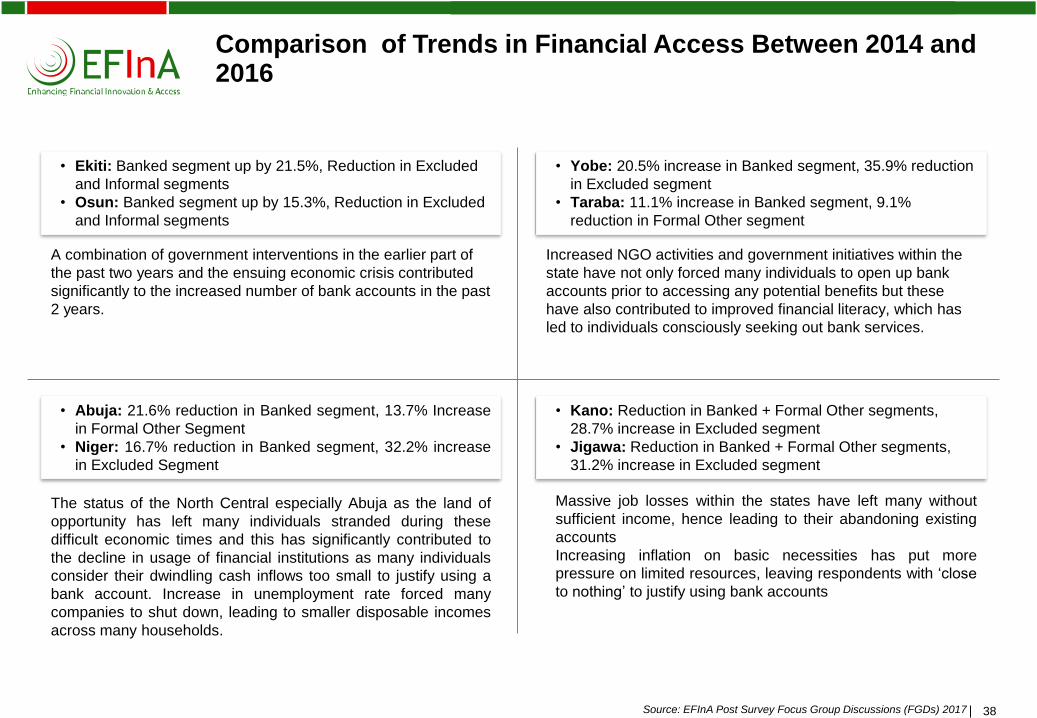
Comparison of Trends in Financial Access Between 2014 and 2016
38
• Ekiti: Banked segment up by 21.5%, Reduction in Excluded
and Informal segments
• Osun: Banked segment up by 15.3%, Reduction in Excluded
and Informal segments
• Yobe: 20.5% increase in Banked segment, 35.9% reduction
in Excluded segment
• Taraba: 11.1% increase in Banked segment, 9.1%
reduction in Formal Other segment
• Abuja: 21.6% reduction in Banked segment, 13.7% Increase
in Formal Other Segment
• Niger: 16.7% reduction in Banked segment, 32.2% increase
in Excluded Segment
• Kano: Reduction in Banked + Formal Other segments,
28.7% increase in Excluded segment
• Jigawa: Reduction in Banked + Formal Other segments,
31.2% increase in Excluded segment
A combination of government interventions in the earlier part of
the past two years and the ensuing economic crisis contributed
significantly to the increased number of bank accounts in the past
2 years.
Increased NGO activities and government initiatives within the
state have not only forced many individuals to open up bank
accounts prior to accessing any potential benefits but these
have also contributed to improved financial literacy, which has
led to individuals consciously seeking out bank services.
The status of the North Central especially Abuja as the land of
opportunity has left many individuals stranded during these
difficult economic times and this has significantly contributed to
the decline in usage of financial institutions as many individuals
consider their dwindling cash inflows too small to justify using a
bank account. Increase in unemployment rate forced many
companies to shut down, leading to smaller disposable incomes
across many households.
Massive job losses within the states have left many without
sufficient income, hence leading to their abandoning existing
accounts
Increasing inflation on basic necessities has put more
pressure on limited resources, leaving respondents with ‘close
to nothing’ to justify using bank accounts

"A4
rb_
sta
nd
ard
_b
an
d_p
ho
to" –
20
10
01
11 –
do
no
t d
ele
te th
is te
xt o
bje
ct!
39Source: EFInA Post Survey Focus Group Discussions (FGDs) 2017
Factors Contributing to Changes in Financial Access
39
Effects of recession (loss of jobs, lower disposable income, increasing inflation) have had an immediate negativeeffect especially on the B-O-P population who do not have the means to cushion themselves against these shocks
You’ll discover that recession in the economy has actually affected the people on the street because the group of people who are to receive salaries and
allowances from the government will equally go to the market, to spend it but once the salary is not forthcoming, there will be less patronage in the
marketplace
Opened DMB/ MFB/MMO account(s) in the past 2 years, 36-45 yrs, Ekiti state
I don’t even have money to feed myself, not to
talk of saving it somewhere. I have only been
coping with the help of a friend
Mentioned across all study locations
The difference is that the price of things/commodities we used to buy in
the past two years has skyrocketed. Some have doubled while some are
almost tripled & this is as a result of economic recession…meanwhile all
our income stays the same!”
Male Lapsed user, Jigawa rural
Getting extra money is difficult these days because
everything I make goes on daily spending
Mentioned across all study locations
Consideration is given to the amount or
available cash at hand before I choose the
number of times (frequency) or the sum of
money to save at a time…sometimes all of
us in the group will agree on a certain
amount
Mentioned across all study locations
It is an insult for me not to be able to
withdraw all my money as I like!? They will
say, you must leave some money in the
account….MY money!
Mentioned across all study locations

"A4
rb_
sta
nd
ard
_b
an
d_p
ho
to" –
20
10
01
11 –
do
no
t d
ele
te th
is te
xt o
bje
ct!
40Source: EFInA Post Survey Focus Group Discussions (FGDs) 2017
Key Drivers for Opening DMB Accounts in the Past Two Years
• I opened the account for my salary & to be able to keep some of
the profits from my business
• For me, it’s for nothing more than to be able to receive money
from my friends and relatives living afar
• Keeping money at home attracts theft but in the bank even when
they are robbed, they still will pay you your money back
Opened account in the past 2 years, 26-45yrs, female, Taraba
rural
I opened in order to have access to loan…was told that if you keep
money with them for a while & you are consistent…then maybe
you could get a loan
Mentioned across both North East & South West
Mine was opened because I started a new business (farming)…
Opened account in the past 2 years, 26-45yrs, male, Yobe
urban
So, that I can be keeping money for anytime I will need & so that I
don’t spend it on something else…
The government wants us to open bank account as civil servants
Mixed gender, 26-35yrs Opened account in the past 2 years,
Osun urban

"A4
rb_
sta
nd
ard
_b
an
d_p
ho
to" –
20
10
01
11 –
do
no
t d
ele
te th
is te
xt o
bje
ct!
41Source: EFInA Post Survey Focus Group Discussions (FGDs) 2017
I stopped using savings account in various DMBs. Before I
stopped, I could think of no benefit aside it only helps me to keep
my money
Mentioned across study locations
The financial institutions, banks in particular have gone far in terms
of technology. There is more security now with the BVN
introduced for depositors …I like the screening at the entrance as
well…& mobile app. I heard they also do ‘zero’ account opening…
Lapsed users of DBMs only, 26-45yrs, mixed gender, Abuja
urban
The situation of the country is getting tougher given that my income
cannot meet my expenses any longer. So my saving has gone down
because everything has changed and you have other responsibility to
take care of and so when you are saving you just have to save less in
order to meet up with other needs”
Male lapsed users, Kano Urban
I will rather keep my money under my carpet….or under the pillow
than go to the bank…it is too small to be taken there!
Mentioned across lapsed users of DMBs & FS, North central &
North West
There is increased rate of money doubling nowadays. People want
quick money to cater for their needs & that is why ‘MMM’ hit
everybody hard after its collapse…
Lapsed users of DBMs only, 26-45yrs, mixed gender, Abuja
Reasons for Lapsed Users

"A4
rb_
sta
nd
ard
_b
an
d_p
ho
to" –
20
10
01
11 –
do
no
t d
ele
te th
is te
xt o
bje
ct!
42Source: EFInA Post Survey Focus Group Discussions (FGDs) 2017
Across all the locations, the ‘must-dos’ to enthuse repeat patronage of formal financial institutions are:
• Cordial staff-customer relationship• Develop innovative & accessible loans especially for low income segments• Address challenges with IT platforms (systems availability & ATM proliferation)• Offer reasonable & transparent charges on products & services
Additional needs & expectations in rural areas include:
• Increasing the visibility of existing branches
• Opening additional branches
• Introducing non-interest banking products
Potential Action Points for Financial Institutions (FIs) to Regain Lapsed Users

"A4
rb_
sta
nd
ard
_b
an
d_p
ho
to" –
20
10
01
11 –
do
no
t d
ele
te th
is te
xt o
bje
ct!
E. Forecasts of Financial Access Strands (FAS)

"A4
rb_
sta
nd
ard
_b
an
d_p
ho
to" –
20
10
01
11 –
do
no
t d
ele
te th
is te
xt o
bje
ct!
44Source: EFInA Access to Financial Services in Nigeria 2008/2010/2012/2014/ 2016 survey
Forecast for the Financially Excluded Population
52.5%
46.3%
39.7% 39.5%41.6%
41.6%
36.8%34.2%
31.6%29.0%
26.4%23.8%
21.2%
41.6%
29.6%26.2%
22.8%19.5%
16.3%13.0%
9.8%
41.6%44.0% 42.2% 40.4% 38.5%
36.6%34.6%
32.6%
0.0%
10.0%
20.0%
30.0%
40.0%
50.0%
60.0%
2008 2010 2012 2014 2016 2018 2020 2022 2024 2026 2028 2030
Forecast for proportion of Financially Excluded Adults
Financially excluded Forecast (Financially excluded)
Best Case Scenario (Financially excluded) Worst Case Scenario (Financially excluded)
• Current target is to lower financial exclusion to 20% of the adult population by 2020• Projections based on current trends indicate that it could take up to 2030 before achieving this target• However, there exists a best case scenario of hitting the target between 2022 and 2024
Financially excluded proportion of adult population could lower to 20% between 2022 and 2024 on a best case scenario
Note: • Confidence interval set at 95%• The forecast predicts future values using existing 2008 to 2016 data and the AAA version of the Exponential
Smoothing (ETS) algorithm (Holt-Winters)

"A4
rb_
sta
nd
ard
_b
an
d_p
ho
to" –
20
10
01
11 –
do
no
t d
ele
te th
is te
xt o
bje
ct!
45Source: EFInA Access to Financial Services in Nigeria 2008/2010/2012/2014/ 2016 survey
Forecast for the Banked Population
• The proportion of banked adults is likely to rise to 47% by 2020 • There exists the potential of getting to 52.1% on a best case scenario, if mitigating factors such as reversing the
effects of the recession on the masses and providing a favorable regulatory environment are instigated
Note: • Confidence interval set at 95%• The forecast predicts future values using existing 2008 to 2016 data and the AAA version of the Exponential
Smoothing (ETS) algorithm (Holt-Winters)
21.1%
30.0%32.5%
36.3% 38.3%
38.3%43.0%
47.0%51.0%
55.0%58.9%
62.9%66.9%
38.3% 38.0%41.9%
45.7%49.6%
53.4%57.3%
61.1%
38.3%
47.9%52.1%
56.2%60.4%
64.5%68.6%
72.8%
0.0%
10.0%
20.0%
30.0%
40.0%
50.0%
60.0%
70.0%
80.0%
2008 2010 2012 2014 2016 2018 2020 2022 2024 2026 2028 2030
Forecast for proportion of Banked Adults
Banked Forecast (Banked) Worst Case Scenario (Banked) Best Case Scenario (Banked)

"A4
rb_
sta
nd
ard
_b
an
d_p
ho
to" –
20
10
01
11 –
do
no
t d
ele
te th
is te
xt o
bje
ct!
46Source: EFInA Access to Financial Services in Nigeria 2008/2010/2012/2014/ 2016 survey
Forecast for ‘Formal Other’ Adult Population
• The ‘Formal Other’ strand could move from the current 10.3% to 16% by 2020• Favorable initiatives could potentially raise this proportion to 20.9% in the same period on a best case scenario
Note: • Confidence interval set at 95%• The forecast predicts future values using existing 2008 to 2016 data and the AAA version of the Exponential
Smoothing (ETS) algorithm (Holt-Winters)
2.5%
6.3%
10.5%12.3%
10.3%
10.3%
14.0%16.0%
18.0%20.0%
22.0%24.0%
26.0%
10.3% 9.5%11.0%
12.5%14.1%
15.7%17.3%
18.9%10.3%
18.4%20.9%
23.4%25.9%
28.3%30.7%
33.0%
0.0%
5.0%
10.0%
15.0%
20.0%
25.0%
30.0%
35.0%
2008 2010 2012 2014 2016 2018 2020 2022 2024 2026 2028 2030
Forecast for proportion of ‘Formal Other’ Adults
Formal Other Forecast (Formal Other)
Worst Case Scenario (Formal Other) Best Case Scenario (Formal Other)

"A4
rb_
sta
nd
ard
_b
an
d_p
ho
to" –
20
10
01
11 –
do
no
t d
ele
te th
is te
xt o
bje
ct!
F. Closing Remarks

"A4
rb_
sta
nd
ard
_b
an
d_p
ho
to" –
20
10
01
11 –
do
no
t d
ele
te th
is te
xt o
bje
ct!
48Source: EFInA Access to Financial Services in Nigeria 2010/2012/2014/ 2016 survey
Progress on National Financial Inclusion Targets
48
* Reduce financial exclusion rate of adults to 20% by 2020
Status as at
Focus
Areas
Target by
20202010 2012 2014 2016
Variance to
2020 Target
% of Total
Adult
Population
Payments 70% 22% 20% 24% 38% -32%
Savings 60% 24% 25% 32% 36% -24%
Credit 40% 2% 2% 3% 3% -37%
Insurance 40% 1% 3% 1% 2% -38%
Pension 40% 5% 2% 5% 5% -35%
Financial
Exclusion20% 46.3% 39.7% 39.5% 41.6% -21.6%
DEFINITION OF INDICATORS
Payments:% of adult population that has a transaction account with a regulated financial institution and/or has made an electronic payment through a regulated financial institution in
the last 12 months
Savings: % of adult population that has a savings-related product at a regulated financial institution and/or has saved through a regulated financial institution in the last 12 months
Credit: % of adult population that has had a credit product through a regulated financial institution in the last 12 months
Insurance: % of adult population that is covered by a regulated insurance policy
Pension: % of adult population that is contributing to a regulated pension scheme or receiving a pension through a regulated pension scheme
"A4
rb_
sta
nd
ard
_b
an
d_p
ho
to" –
20
10
01
11 –
do
no
t d
ele
te th
is te
xt o
bje
ct!
49Source: EFInA Access to Financial Services in Nigeria 2016 survey
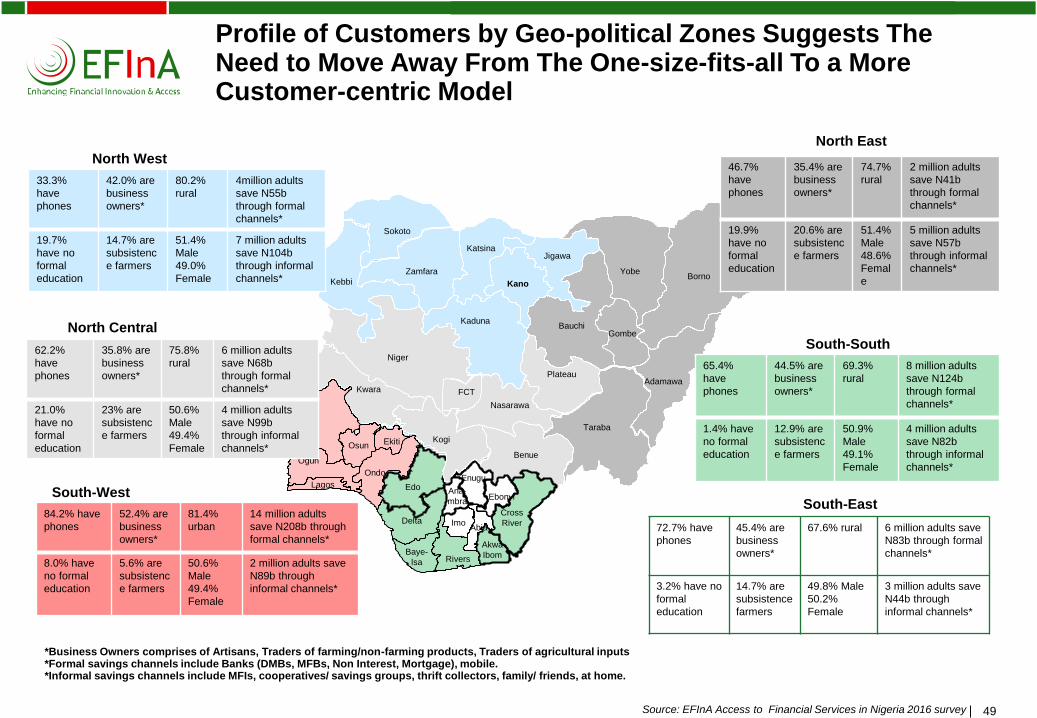
Profile of Customers by Geo-political Zones Suggests The Need to Move Away From The One-size-fits-all To a More Customer-centric Model
49
Niger
Adamawa
Akwa
Ibom
Bauchi
Baye-
lsa
Benue
Borno
Cross
RiverDelta
EbonyiEdo
Ekiti
Enugu
FCT
Gombe
Imo
Jigawa
Kaduna
Kano
Katsina
Kebbi
Kogi
Kwara
Lagos
Nasarawa
Ogun
Ondo
Osun
Oyo
Plateau
Rivers
Sokoto
Taraba
YobeZamfara
Abia
Ana-
mbra
33.3%
have
phones
42.0% are
business
owners*
80.2%
rural
4million adults
save N55b
through formal
channels*
19.7%
have no
formal
education
14.7% are
subsistenc
e farmers
51.4%
Male
49.0%
Female
7 million adults
save N104b
through informal
channels*
62.2%
have
phones
35.8% are
business
owners*
75.8%
rural
6 million adults
save N68b
through formal
channels*
21.0%
have no
formal
education
23% are
subsistenc
e farmers
50.6%
Male
49.4%
Female
4 million adults
save N99b
through informal
channels*
84.2% have
phones
52.4% are
business
owners*
81.4%
urban
14 million adults
save N208b through
formal channels*
8.0% have
no formal
education
5.6% are
subsistenc
e farmers
50.6%
Male
49.4%
Female
2 million adults save
N89b through
informal channels*
46.7%
have
phones
35.4% are
business
owners*
74.7%
rural
2 million adults
save N41b
through formal
channels*
19.9%
have no
formal
education
20.6% are
subsistenc
e farmers
51.4%
Male
48.6%
Femal
e
5 million adults
save N57b
through informal
channels*
65.4%
have
phones
44.5% are
business
owners*
69.3%
rural
8 million adults
save N124b
through formal
channels*
1.4% have
no formal
education
12.9% are
subsistenc
e farmers
50.9%
Male
49.1%
Female
4 million adults
save N82b
through informal
channels*
72.7% have
phones
45.4% are
business
owners*
67.6% rural 6 million adults save
N83b through formal
channels*
3.2% have no
formal
education
14.7% are
subsistence
farmers
49.8% Male
50.2%
Female
3 million adults save
N44b through
informal channels*
*Business Owners comprises of Artisans, Traders of farming/non-farming products, Traders of agricultural inputs*Formal savings channels include Banks (DMBs, MFBs, Non Interest, Mortgage), mobile.*Informal savings channels include MFIs, cooperatives/ savings groups, thrift collectors, family/ friends, at home.
South-WestSouth-East
South-South
North Central
North West
North East

"A4
rb_
sta
nd
ard
_b
an
d_p
ho
to" –
20
10
01
11 –
do
no
t d
ele
te th
is te
xt o
bje
ct!
50Source: EFInA Access to Financial Services in Nigeria 2010/2012/2014/ 2016 survey
There is Huge Potential to Increase Financial Inclusion by Attracting the Population that ‘Save At Home’
52.8
23.8
20.5
19.6
6.0
1.7
58.6
23.0
20.6
24.5
12.4
4.9
2.4
59.1
25.5
23.1
17.7
9.4
4.7
1.8
65.6
26.4
26.7
11.5
10.5
7.0
0.8
-
10.0
20.0
30.0
40.0
50.0
60.0
70.0
Total Number ofAdults who
save/keep moneyaside
Save at home Save with DMBs Save with group(such as a co-
operative, savingsgroup or
village/communityassociation)
Save with thriftcollector/savings
collector (e.g.Esusu, Ajo,
Save withfamily/friends
Save with MFBs
2010
2012
2014
2016
Nu
mb
er
of
Ad
ult
s w
ho
save (
in m
illi
on
)
Note: In 2010, “save with group” and “save with thrift/savings collector” were reported together
Number of Adults who save/keep money (in
millions)
• The total number of adults who save money increased from 52.8 million in 2010 to 65.6 million in 2016
• However, between 2012 and 2016 there was a significant reduction in the number of people who save in
MFBs; whilst there was increase in those who saved in DMBs
"A4
rb_
sta
nd
ard
_b
an
d_p
ho
to" –
20
10
01
11 –
do
no
t d
ele
te th
is te
xt o
bje
ct!
51Source: EFInA Access to Financial Services in Nigeria 2010/2012/2014/ 2016 survey
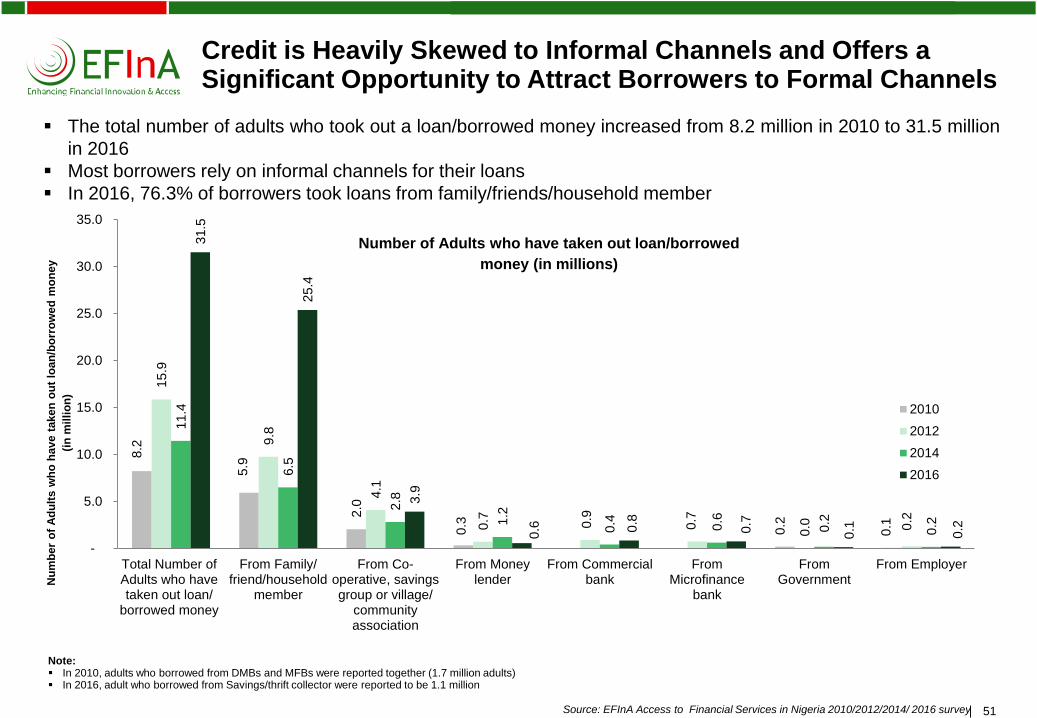
Credit is Heavily Skewed to Informal Channels and Offers a Significant Opportunity to Attract Borrowers to Formal Channels
8.2
5.9
2.0
0.3
0.2
0.1
15.9
9.8
4.1
0.7
0.9
0.7
0.0
0.2
11.4
6.5
2.8
1.2
0.4
0.6
0.2
0.2
31.5
25.4
3.9
0.6 0.8
0.7
0.1
0.2
-
5.0
10.0
15.0
20.0
25.0
30.0
35.0
Total Number ofAdults who havetaken out loan/
borrowed money
From Family/friend/household
member
From Co-operative, savingsgroup or village/
communityassociation
From Moneylender
From Commercialbank
FromMicrofinance
bank
FromGovernment
From Employer
2010
2012
2014
2016
Nu
mb
er
of
Ad
ult
s w
ho
have t
aken
ou
t lo
an
/bo
rro
we
d m
on
ey
(in
mil
lio
n)
Note: ▪ In 2010, adults who borrowed from DMBs and MFBs were reported together (1.7 million adults)▪ In 2016, adult who borrowed from Savings/thrift collector were reported to be 1.1 million
Number of Adults who have taken out loan/borrowed
money (in millions)
▪ The total number of adults who took out a loan/borrowed money increased from 8.2 million in 2010 to 31.5 million
in 2016
▪ Most borrowers rely on informal channels for their loans
▪ In 2016, 76.3% of borrowers took loans from family/friends/household member
"A4
rb_
sta
nd
ard
_b
an
d_p
ho
to" –
20
10
01
11 –
do
no
t d
ele
te th
is te
xt o
bje
ct!
52Source: EFInA Access to Financial Services in Nigeria 2014/ 2016 survey52
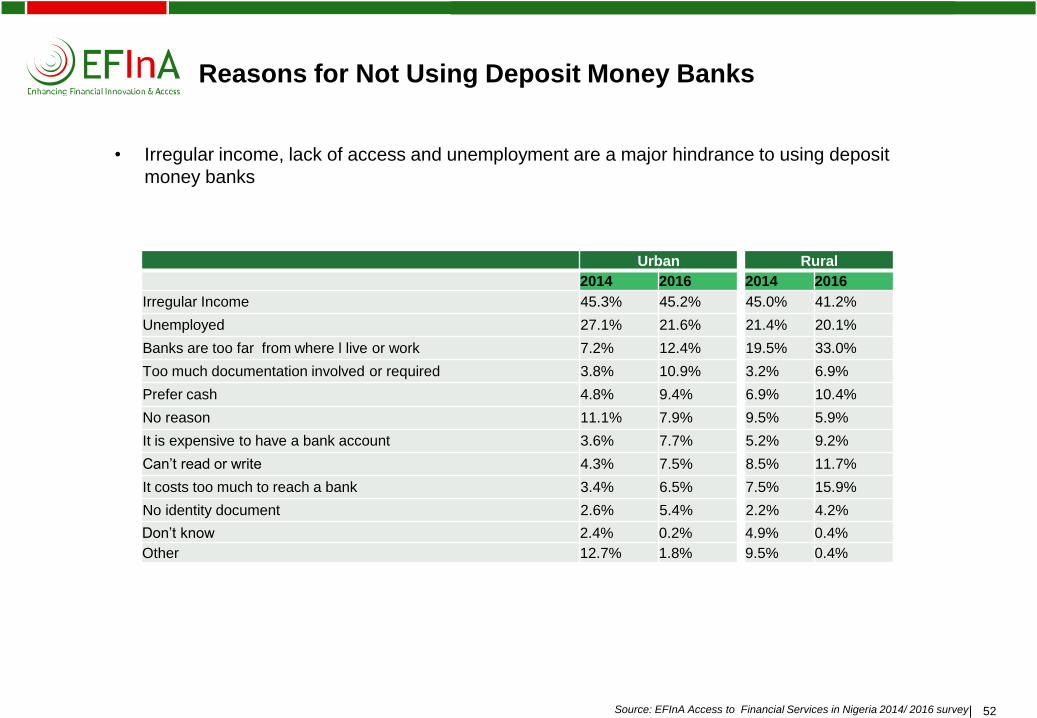
Urban Rural
2014 2016 2014 2016
Irregular Income 45.3% 45.2% 45.0% 41.2%
Unemployed 27.1% 21.6% 21.4% 20.1%
Banks are too far from where l live or work 7.2% 12.4% 19.5% 33.0%
Too much documentation involved or required 3.8% 10.9% 3.2% 6.9%
Prefer cash 4.8% 9.4% 6.9% 10.4%
No reason 11.1% 7.9% 9.5% 5.9%
It is expensive to have a bank account 3.6% 7.7% 5.2% 9.2%
Can’t read or write 4.3% 7.5% 8.5% 11.7%
It costs too much to reach a bank 3.4% 6.5% 7.5% 15.9%
No identity document 2.6% 5.4% 2.2% 4.2%
Don’t know 2.4% 0.2% 4.9% 0.4%
Other 12.7% 1.8% 9.5% 0.4%
Reasons for Not Using Deposit Money Banks
• Irregular income, lack of access and unemployment are a major hindrance to using deposit
money banks

"A4
rb_
sta
nd
ard
_b
an
d_p
ho
to" –
20
10
01
11 –
do
no
t d
ele
te th
is te
xt o
bje
ct!
53Source: EFInA Access to Financial Services in Nigeria 2016 survey
Current Projections Towards Achieving 20% Financial Exclusion Target by 2020
53
Scenario 1:Based on Current Scenario Forecast
Scenario 2: Based on “Best Case” Scenario Forecast
With the right financial education, lower-income consumers will benefit from credit, savings, insurance and payments
products that help them invest in economic opportunities, better manage their money, reduce risks and plan for the future.
Counter Effects of recession (Loss of jobs, lower disposable income, increasing inflation)
• Provide a cushion through micro credit, input subsidies to lower cost ofliving for the low income earners
Regulatory environment(Mandatory charges – Discouraging especially the low income earners from using formal FS)
* Consider reviewing or suspending application of fees for B-O-P segments
Product and service mapping(Currently informal channels are popularly used for savings and credits –Cooperatives, Group contributions, thrift collectors)
• Create formal products that mirror the benefits enjoyed through current informal channels
Other potential initiatives• Address trust and liquidity issues especially among MFBs• Consider disruptive initiatives to promote MM usage
38.3%
43.0%
47.0%
10.3%
14.0%
16.0%
9.8%
5.0%
4.6%
41.6%
36.8%
34.2%
2016
2018
2020
38.3%
47.9%
52.1%
10.3%
18.4%
20.9%
9.8%
6.4%
5.9%
41.6%
27.0%
21.0%
2016
2018
2020

"A4
rb_
sta
nd
ard
_b
an
d_p
ho
to" –
20
10
01
11 –
do
no
t d
ele
te th
is te
xt o
bje
ct!
54
How EFInA Intends to Deepen Financial Inclusion in Nigeria
Research
Enhance collaborative efforts through EFInA’s pillars
Advocacy Innovation Fund Capacity Building
• Continue to provide crediblemarket information on theNigerian financial sector
• Disseminate bespoke resultsat EFInA breakfast series,working groups and atstakeholders' events
• Work closely with regulators& policy makers in Nigeria tofoster an enablingenvironment for innovativeinclusive financial servicesand products for the un-banked and under-bankedsegments
• Host and facilitate innovationfora to trigger debate andideas about pertinent issues.
• Financial support for newideas and approaches toexpanding financial access tothe un-banked and under-banked segments
• Provide linkages betweenlocal stakeholders andexperts who can help with thedevelopment andimplementation of inclusiveproducts
• Facilitate skills acquisitionthrough opportunities toattend training sessions orinteract with success storieswithin and beyond Nigeria
Review status, understand challenges, leverage
opportunities
Support stakeholder linkages for an enabling
environment
Provide incentives for developing innovative products and services
Support capacity to implement
Primary efforts will target selected thematic areas
Women, Northern Nigeria, Mobile Money, Non-Interest Finance, Micro Savings, Micro Loans & Micro
Insurance, Financial Literacy

"A4
rb_
sta
nd
ard
_b
an
d_p
ho
to" –
20
10
01
11 –
do
no
t d
ele
te th
is te
xt o
bje
ct!
55
Data Dissemination Options
EFInA Access to Financial Services in Nigeria 2008 / 2010 / 2012 / 2014 / 2016 surveys
▪ Comprehensive database where information can be segmented in multiple dimensions, e.g., gender,
geopolitical zone, age, education, etc.
▪ Data will be provided in SPSS or Ms Excel format
▪ Key findings can be downloaded from the EFInA website
Data Options
▪ Data request form can be downloaded from the EFInA website
▪ Full dataset
▪ Limited number of variables
▪ Customised analysis
Contact
Website
www.efina.org.ng

"A4
rb_
sta
nd
ard
_b
an
d_p
ho
to" –
20
10
01
11 –
do
no
t d
ele
te th
is te
xt o
bje
ct!
56
Disclaimer
To the best of our knowledge, the information contained herein is accurate and reliable as of the date of
publication; however, we do not assume any liability whatsoever for the accuracy and completeness of the
above information and we provide no warranty, expressed or implied, in respect thereof.
The provision of the information contained in this report does not constitute legal or financial advice or opinions
of any kind. No advisory, fiduciary or other relationship is created between EFInA and any person accessing or
otherwise using any of the information provided in this report. EFInA and any of its directors, officers,
employees, agents or contributors will not be liable for any damages, losses or causes of action of any nature
arising from any use of any of the said information.
The content of this report does not necessarily reflect the views or official position of the UK Department for
International Development with regard to financial inclusion in Nigeria.