Embed Size (px)
Citation preview
Addressing Nurse Workforce Issues for the Health of Florida
KEY FINDINGS Florida’s Licensed Practical Nurse (LPN)
Workforce Supply: 2018-2019
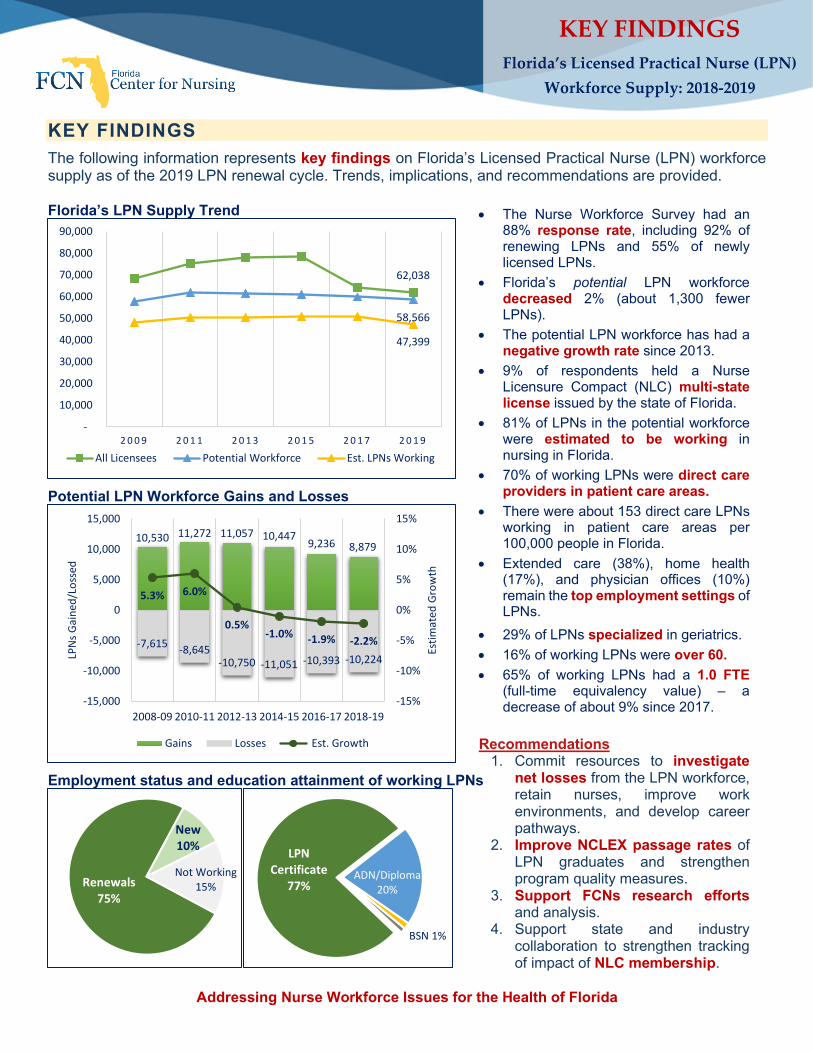
KEY FINDINGS The following information represents key findings on Florida’s Licensed Practical Nurse (LPN) workforce supply as of the 2019 LPN renewal cycle. Trends, implications, and recommendations are provided. Florida’s LPN Supply Trend
Potential LPN Workforce Gains and Losses
Employment status and education attainment of working LPNs
10,530 11,272 11,057 10,447 9,236 8,879
-7,615 -8,645-10,750 -11,051 -10,393 -10,224
5.3% 6.0%
0.5%-1.0% -1.9% -2.2%
-15%
-10%
-5%
0%
5%
10%
15%
-15,000
-10,000
-5,000
0
5,000
10,000
15,000
2008-09 2010-11 2012-13 2014-15 2016-17 2018-19
Estim
ated
Gro
wth
LPN
s Gai
ned/
Loss
ed
Gains Losses Est. Growth
Renewals75%
New10%
Not Working15%
LPN Certificate
77%ADN/Diploma
20%
BSN 1%
62,038
58,566
47,399
-
10,000
20,000
30,000
40,000
50,000
60,000
70,000
80,000
90,000
2 0 0 9 2 0 1 1 2 0 1 3 2 0 1 5 2 0 1 7 2 0 1 9
All Licensees Potential Workforce Est. LPNs Working
• The Nurse Workforce Survey had an 88% response rate, including 92% of renewing LPNs and 55% of newly licensed LPNs.
• Florida’s potential LPN workforce decreased 2% (about 1,300 fewer LPNs).
• The potential LPN workforce has had a negative growth rate since 2013.
• 9% of respondents held a Nurse Licensure Compact (NLC) multi-state license issued by the state of Florida.
• 81% of LPNs in the potential workforce were estimated to be working in nursing in Florida.
• 70% of working LPNs were direct care providers in patient care areas.
• There were about 153 direct care LPNs working in patient care areas per 100,000 people in Florida.
• Extended care (38%), home health (17%), and physician offices (10%) remain the top employment settings of LPNs.
• 29% of LPNs specialized in geriatrics.
• 16% of working LPNs were over 60.
• 65% of working LPNs had a 1.0 FTE (full-time equivalency value) – a decrease of about 9% since 2017.
Recommendations 1. Commit resources to investigate
net losses from the LPN workforce, retain nurses, improve work environments, and develop career pathways.
2. Improve NCLEX passage rates of LPN graduates and strengthen program quality measures.
3. Support FCNs research efforts and analysis.
4. Support state and industry collaboration to strengthen tracking of impact of NLC membership.
Addressing Nurse Workforce Issues for the Health of Florida Visit our site at: www.FlCenterForNursing.org
Florida’s 2018-2019 Licensed Practical Nurse (LPN) Workforce Supply:
Characteristics and Trends
June 2020

June 2020 Florida LPN Nursing Workforce Supply (2018-2019) i
CONTENTS Background ......................................................................................................................................... 1
Florida’s LPN Supply as of December 2019 ........................................................................................ 1
Nurse Licensure Compact (NLC) Multi-State License ...................................................................... 2
Potential LPN Workforce gains and losses .......................................................................................... 2
Potential LPN Workforce Gains ........................................................................................................ 3
Potential LPN Workforce Losses ...................................................................................................... 4
Characteristics of Newly Licensed Nurses ....................................................................................... 4
Employment Characteristics ................................................................................................................ 6
Employment Settings ....................................................................................................................... 6
Occupational Titles and Practice Areas ............................................................................................ 7
Employment Detail ........................................................................................................................... 8
Nurse Workforce by State Population .............................................................................................. 8
Full Time Equivalency (FTE) Status ..................................................................................................... 9
FTE by Age Group ........................................................................................................................... 9
FTE by Employment Setting ........................................................................................................... 10
Unemployment .................................................................................................................................. 10
Unemployment Reasons ................................................................................................................ 11
Demographics ................................................................................................................................... 11
LPN Workforce Diversity ................................................................................................................ 11
Age Distribution .............................................................................................................................. 12
Academic Achievement ..................................................................................................................... 13
Highest Education in Nursing ......................................................................................................... 13
Highest Education (All Degrees) .................................................................................................... 13
Discussion ......................................................................................................................................... 13
Recommendations ............................................................................................................................. 15
References ........................................................................................................................................ 16
June 2020 Florida LPN Nursing Workforce Supply (2018-2019) 1
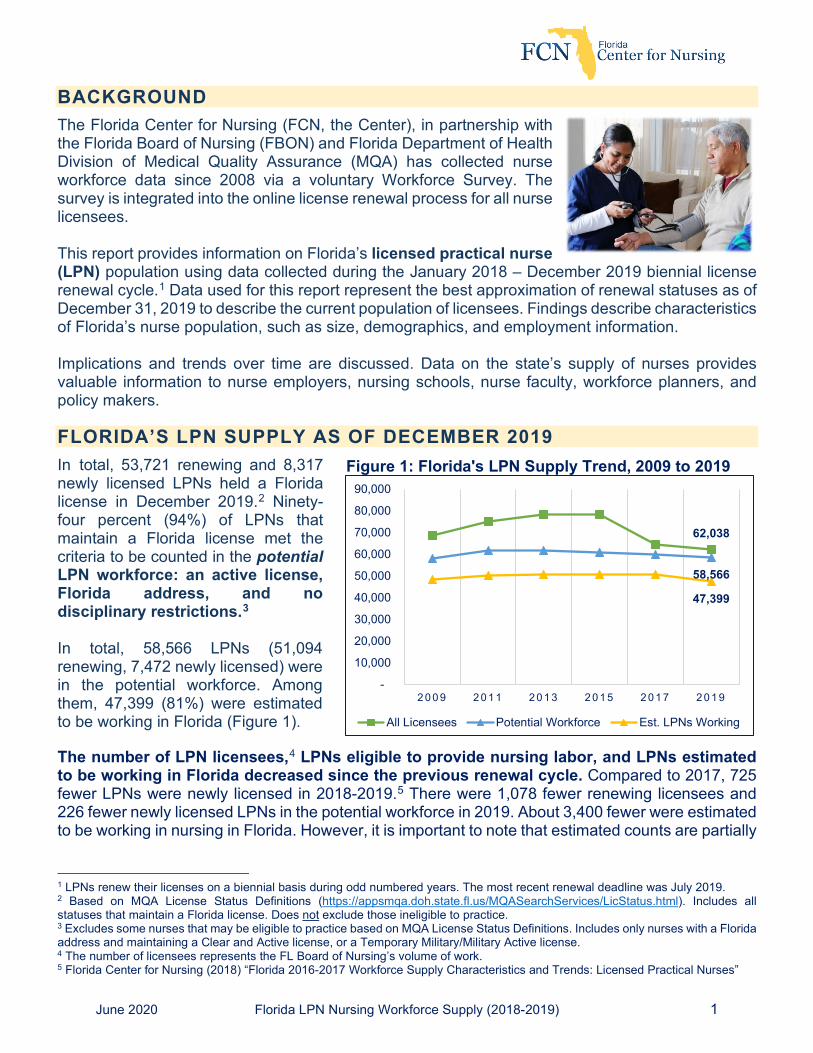
BACKGROUND The Florida Center for Nursing (FCN, the Center), in partnership with the Florida Board of Nursing (FBON) and Florida Department of Health Division of Medical Quality Assurance (MQA) has collected nurse workforce data since 2008 via a voluntary Workforce Survey. The survey is integrated into the online license renewal process for all nurse licensees. This report provides information on Florida’s licensed practical nurse (LPN) population using data collected during the January 2018 – December 2019 biennial license renewal cycle.1 Data used for this report represent the best approximation of renewal statuses as of December 31, 2019 to describe the current population of licensees. Findings describe characteristics of Florida’s nurse population, such as size, demographics, and employment information. Implications and trends over time are discussed. Data on the state’s supply of nurses provides valuable information to nurse employers, nursing schools, nurse faculty, workforce planners, and policy makers. FLORIDA’S LPN SUPPLY AS OF DECEMBER 2019 In total, 53,721 renewing and 8,317 newly licensed LPNs held a Florida license in December 2019.2 Ninety-four percent (94%) of LPNs that maintain a Florida license met the criteria to be counted in the potential LPN workforce: an active license, Florida address, and no disciplinary restrictions.3 In total, 58,566 LPNs (51,094 renewing, 7,472 newly licensed) were in the potential workforce. Among them, 47,399 (81%) were estimated to be working in Florida (Figure 1). The number of LPN licensees,4 LPNs eligible to provide nursing labor, and LPNs estimated to be working in Florida decreased since the previous renewal cycle. Compared to 2017, 725 fewer LPNs were newly licensed in 2018-2019.5 There were 1,078 fewer renewing licensees and 226 fewer newly licensed LPNs in the potential workforce in 2019. About 3,400 fewer were estimated to be working in nursing in Florida. However, it is important to note that estimated counts are partially
1 LPNs renew their licenses on a biennial basis during odd numbered years. The most recent renewal deadline was July 2019. 2 Based on MQA License Status Definitions (https://appsmqa.doh.state.fl.us/MQASearchServices/LicStatus.html). Includes all statuses that maintain a Florida license. Does not exclude those ineligible to practice. 3 Excludes some nurses that may be eligible to practice based on MQA License Status Definitions. Includes only nurses with a Florida address and maintaining a Clear and Active license, or a Temporary Military/Military Active license. 4 The number of licensees represents the FL Board of Nursing’s volume of work. 5 Florida Center for Nursing (2018) “Florida 2016-2017 Workforce Supply Characteristics and Trends: Licensed Practical Nurses”
62,038
58,566
47,399
-
10,000
20,000
30,000
40,000
50,000
60,000
70,000
80,000
90,000
2 0 0 9 2 0 1 1 2 0 1 3 2 0 1 5 2 0 1 7 2 0 1 9
All Licensees Potential Workforce Est. LPNs Working
Figure 1: Florida's LPN Supply Trend, 2009 to 2019

June 2020 Florida LPN Nursing Workforce Supply (2018-2019) 2
based on last known practicing/mailing address provided to the Board of Nursing, the accuracy of which is not known. Nurse Licensure Compact (NLC) Multi-State License
The Nurse Licensure Compact allows nurses to become licensed to practice in any member state without obtaining a separate license in each state (National Council of State Boards of Nursing, Inc., 2020). Florida joined the Nurse Licensure Compact in 2018. As a result, the current renewal cycle is the first where nurses whose home state is Florida could renew or become newly licensed with a compact/multistate license.
In the 2019 renewal cycle, about 9% of responding LPNs reported that they held a multistate license – representing an estimated 5,312 LPNs in the potential workforce.6 Among those with a multi-state license, 87% reported working the most hours per week in Florida, followed by Georgia (1.9%) and New York (1.6%).7 Only 8% of those who held a multistate license reported working in two or more states/territories in the two years prior to renewal. This suggests that only a small number of LPNs with an NLC license based in Florida are utilizing the mobility that it offers. Georgia and New York remained the most reported states where nurses in the potential workforce worked, other than Florida. Tracking compact licensure and out of state employment among Florida nurses holding a multistate license remains preliminary and should be interpreted with caution. Since Florida joined the NLC, 576 LPNs deactivated their Florida license to obtain a multistate license with primary residence in another state. These nurses remain eligible to practice in Florida but do not maintain residency in Florida. They were not exposed to the nurse workforce survey as they no longer renew their license through the Florida system. Although they are eligible to practice with an NLC license, they are not included in the potential workforce.
POTENTIAL LPN WORKFORCE GAINS AND LOSSES The estimated growth of the LPN workforce is defined as the overall difference between a given renewal cycle’s potential workforce and the previous cycle’s potential workforce. In 2018-2019, Florida gained nearly 8,900 LPNs but lost more than 10,000, resulting in a 2.2% net decrease to the potential LPN workforce (Figure 2, next page).
The potential LPN workforce had a negative growth rate for the third consecutive year. Between 2013 and 2015, the potential LPN workforce decreased about 1%. The following renewal cycle, the loss to the potential workforce doubled (-2%). The rate of decline slowed somewhat (-2.2%) relative to previous declines, yet remains a clear indicator of a continually shrinking potential LPN workforce
6 Proportion based on self-reported counts among survey respondents only. Estimated numerical count determined by multiplying potential workforce counts by proportion of survey respondents reporting multistate license. Only includes nurses renewing/becoming licensed through the state of Florida. Will not include nurses working in Florida under a multi-state license with another home state. 7 3% of multi-state respondents did not provide a response to this question. Proportions should be interpreted with caution. Less than 1% of responding participants reported working the most hours in each state other than those listed above.
58,566 Renewing LPNs & New Licensees in the Potential Workforce
June 2020 Florida LPN Nursing Workforce Supply (2018-2019) 3
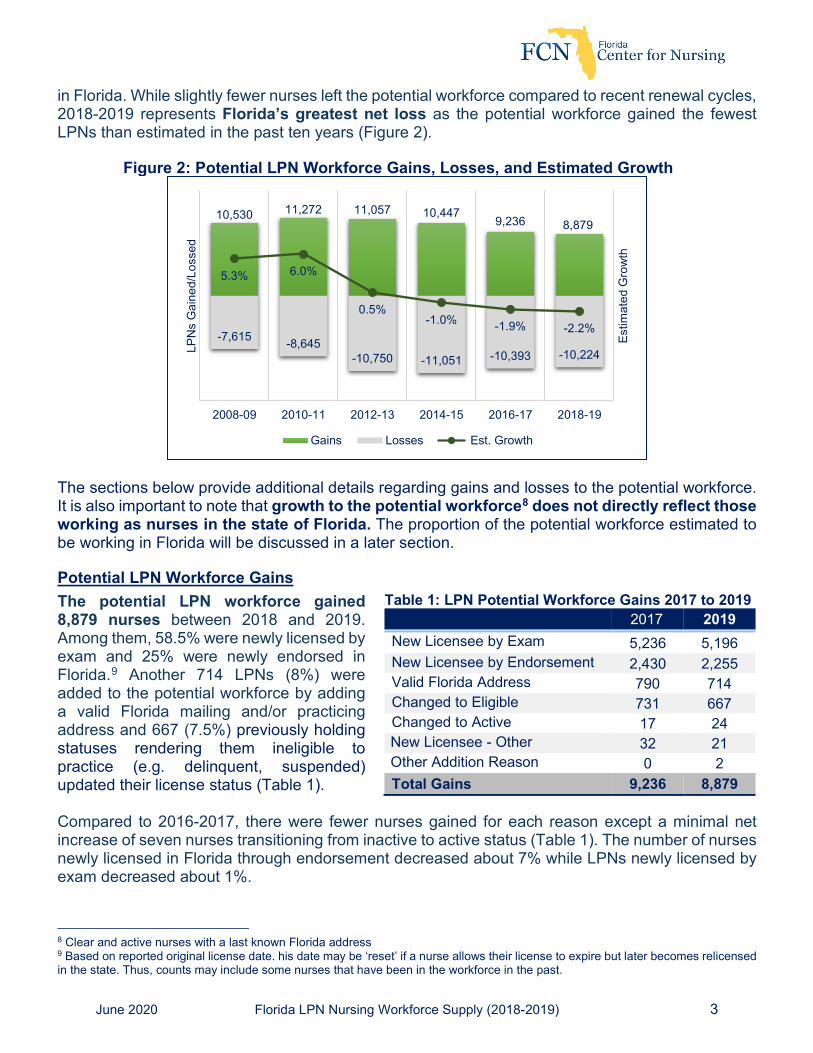
in Florida. While slightly fewer nurses left the potential workforce compared to recent renewal cycles, 2018-2019 represents Florida’s greatest net loss as the potential workforce gained the fewest LPNs than estimated in the past ten years (Figure 2).
The sections below provide additional details regarding gains and losses to the potential workforce. It is also important to note that growth to the potential workforce8 does not directly reflect those working as nurses in the state of Florida. The proportion of the potential workforce estimated to be working in Florida will be discussed in a later section. Potential LPN Workforce Gains The potential LPN workforce gained 8,879 nurses between 2018 and 2019. Among them, 58.5% were newly licensed by exam and 25% were newly endorsed in Florida.9 Another 714 LPNs (8%) were added to the potential workforce by adding a valid Florida mailing and/or practicing address and 667 (7.5%) previously holding statuses rendering them ineligible to practice (e.g. delinquent, suspended) updated their license status (Table 1). Compared to 2016-2017, there were fewer nurses gained for each reason except a minimal net increase of seven nurses transitioning from inactive to active status (Table 1). The number of nurses newly licensed in Florida through endorsement decreased about 7% while LPNs newly licensed by exam decreased about 1%.
8 Clear and active nurses with a last known Florida address 9 Based on reported original license date. his date may be ‘reset’ if a nurse allows their license to expire but later becomes relicensed in the state. Thus, counts may include some nurses that have been in the workforce in the past.
10,530 11,272 11,057 10,4479,236 8,879
-7,615 -8,645-10,750 -11,051 -10,393 -10,224
5.3% 6.0%
0.5%-1.0% -1.9% -2.2%
2008-09 2010-11 2012-13 2014-15 2016-17 2018-19
Estim
ated
Gro
wth
LPN
s G
aine
d/Lo
ssed
Gains Losses Est. Growth
Table 1: LPN Potential Workforce Gains 2017 to 2019 2017 2019 New Licensee by Exam 5,236 5,196 New Licensee by Endorsement 2,430 2,255 Valid Florida Address 790 714 Changed to Eligible 731 667 Changed to Active 17 24 New Licensee - Other 32 21 Other Addition Reason 0 2 Total Gains 9,236 8,879
Figure 2: Potential LPN Workforce Gains, Losses, and Estimated Growth
June 2020 Florida LPN Nursing Workforce Supply (2018-2019) 4
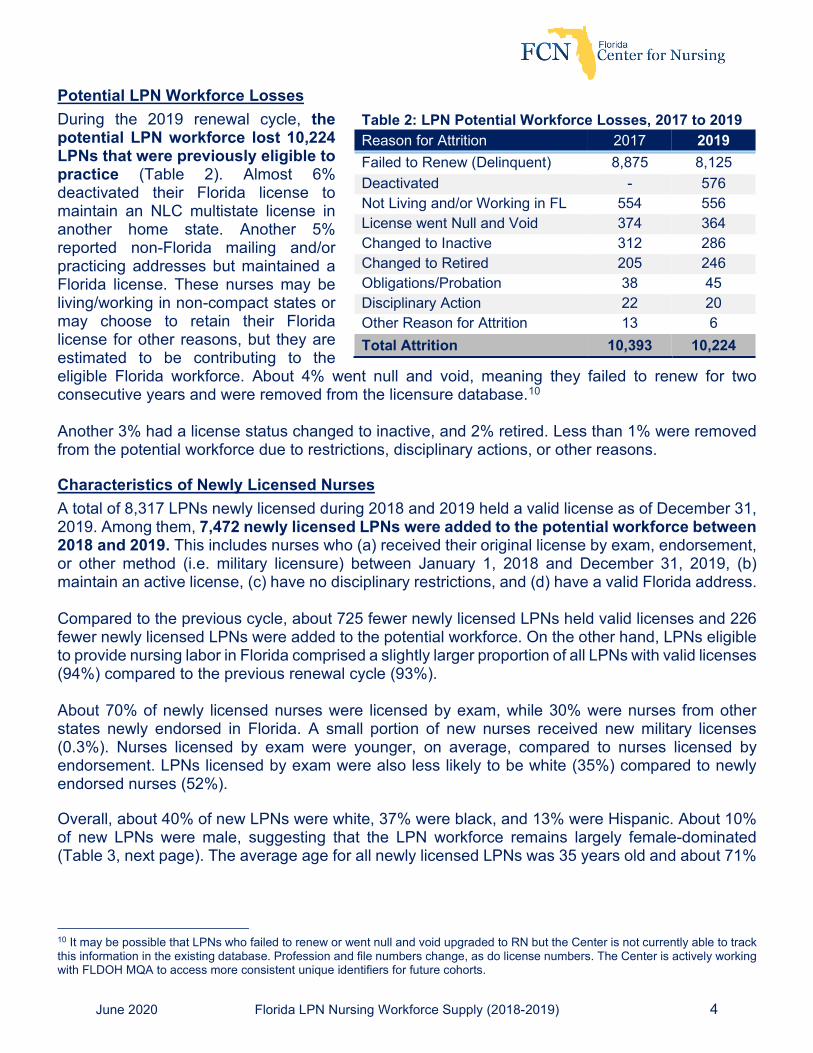
Potential LPN Workforce Losses During the 2019 renewal cycle, the potential LPN workforce lost 10,224 LPNs that were previously eligible to practice (Table 2). Almost 6% deactivated their Florida license to maintain an NLC multistate license in another home state. Another 5% reported non-Florida mailing and/or practicing addresses but maintained a Florida license. These nurses may be living/working in non-compact states or may choose to retain their Florida license for other reasons, but they are estimated to be contributing to the eligible Florida workforce. About 4% went null and void, meaning they failed to renew for two consecutive years and were removed from the licensure database.10 Another 3% had a license status changed to inactive, and 2% retired. Less than 1% were removed from the potential workforce due to restrictions, disciplinary actions, or other reasons. Characteristics of Newly Licensed Nurses A total of 8,317 LPNs newly licensed during 2018 and 2019 held a valid license as of December 31, 2019. Among them, 7,472 newly licensed LPNs were added to the potential workforce between 2018 and 2019. This includes nurses who (a) received their original license by exam, endorsement, or other method (i.e. military licensure) between January 1, 2018 and December 31, 2019, (b) maintain an active license, (c) have no disciplinary restrictions, and (d) have a valid Florida address. Compared to the previous cycle, about 725 fewer newly licensed LPNs held valid licenses and 226 fewer newly licensed LPNs were added to the potential workforce. On the other hand, LPNs eligible to provide nursing labor in Florida comprised a slightly larger proportion of all LPNs with valid licenses (94%) compared to the previous renewal cycle (93%). About 70% of newly licensed nurses were licensed by exam, while 30% were nurses from other states newly endorsed in Florida. A small portion of new nurses received new military licenses (0.3%). Nurses licensed by exam were younger, on average, compared to nurses licensed by endorsement. LPNs licensed by exam were also less likely to be white (35%) compared to newly endorsed nurses (52%). Overall, about 40% of new LPNs were white, 37% were black, and 13% were Hispanic. About 10% of new LPNs were male, suggesting that the LPN workforce remains largely female-dominated (Table 3, next page). The average age for all newly licensed LPNs was 35 years old and about 71%
10 It may be possible that LPNs who failed to renew or went null and void upgraded to RN but the Center is not currently able to track this information in the existing database. Profession and file numbers change, as do license numbers. The Center is actively working with FLDOH MQA to access more consistent unique identifiers for future cohorts.
Table 2: LPN Potential Workforce Losses, 2017 to 2019 Reason for Attrition 2017 2019 Failed to Renew (Delinquent) 8,875 8,125 Deactivated - 576 Not Living and/or Working in FL 554 556 License went Null and Void 374 364 Changed to Inactive 312 286 Changed to Retired 205 246 Obligations/Probation 38 45 Disciplinary Action 22 20 Other Reason for Attrition 13 6 Total Attrition 10,393 10,224
June 2020 Florida LPN Nursing Workforce Supply (2018-2019) 5
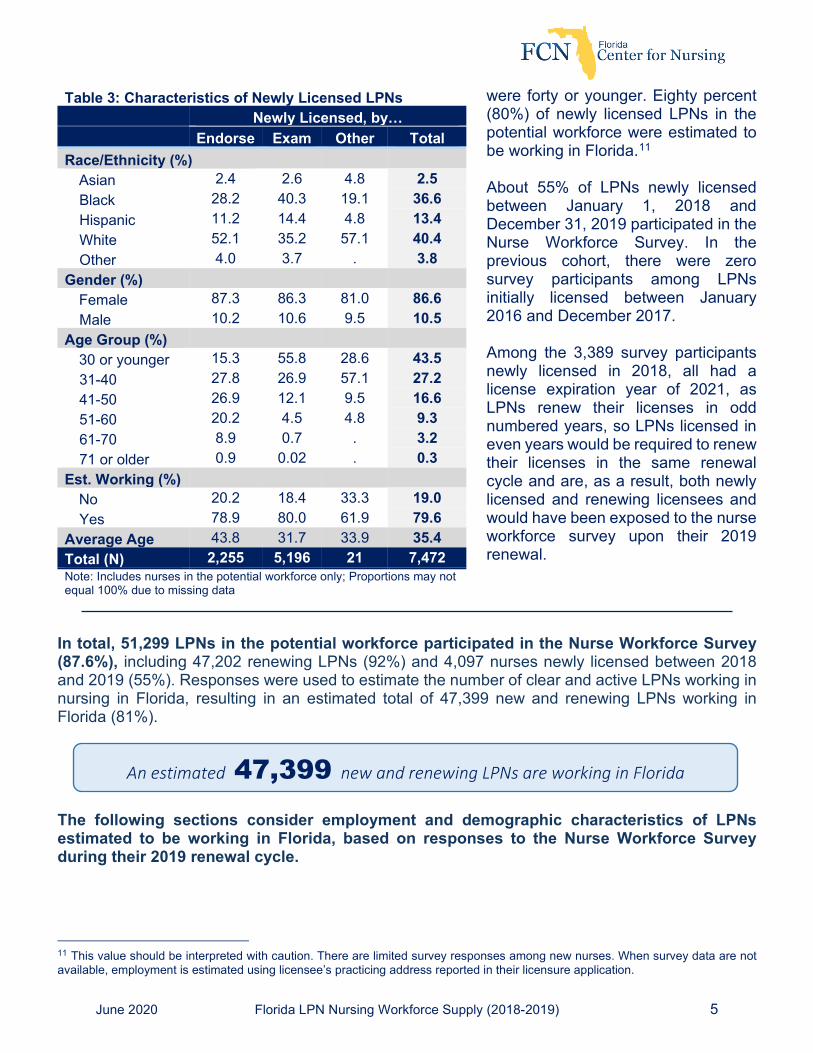
were forty or younger. Eighty percent (80%) of newly licensed LPNs in the potential workforce were estimated to be working in Florida.11 About 55% of LPNs newly licensed between January 1, 2018 and December 31, 2019 participated in the Nurse Workforce Survey. In the previous cohort, there were zero survey participants among LPNs initially licensed between January 2016 and December 2017. Among the 3,389 survey participants newly licensed in 2018, all had a license expiration year of 2021, as LPNs renew their licenses in odd numbered years, so LPNs licensed in even years would be required to renew their licenses in the same renewal cycle and are, as a result, both newly licensed and renewing licensees and would have been exposed to the nurse workforce survey upon their 2019 renewal.
In total, 51,299 LPNs in the potential workforce participated in the Nurse Workforce Survey (87.6%), including 47,202 renewing LPNs (92%) and 4,097 nurses newly licensed between 2018 and 2019 (55%). Responses were used to estimate the number of clear and active LPNs working in nursing in Florida, resulting in an estimated total of 47,399 new and renewing LPNs working in Florida (81%).
The following sections consider employment and demographic characteristics of LPNs estimated to be working in Florida, based on responses to the Nurse Workforce Survey during their 2019 renewal cycle.
11 This value should be interpreted with caution. There are limited survey responses among new nurses. When survey data are not available, employment is estimated using licensee’s practicing address reported in their licensure application.
Table 3: Characteristics of Newly Licensed LPNs Newly Licensed, by…
Endorse Exam Other Total Race/Ethnicity (%)
Asian 2.4 2.6 4.8 2.5 Black 28.2 40.3 19.1 36.6 Hispanic 11.2 14.4 4.8 13.4 White 52.1 35.2 57.1 40.4 Other 4.0 3.7 . 3.8
Gender (%) Female 87.3 86.3 81.0 86.6 Male 10.2 10.6 9.5 10.5
Age Group (%) 30 or younger 15.3 55.8 28.6 43.5 31-40 27.8 26.9 57.1 27.2 41-50 26.9 12.1 9.5 16.6 51-60 20.2 4.5 4.8 9.3 61-70 8.9 0.7 . 3.2 71 or older 0.9 0.02 . 0.3
Est. Working (%) No 20.2 18.4 33.3 19.0 Yes 78.9 80.0 61.9 79.6
Average Age 43.8 31.7 33.9 35.4 Total (N) 2,255 5,196 21 7,472 Note: Includes nurses in the potential workforce only; Proportions may not equal 100% due to missing data
An estimated 47,399 new and renewing LPNs are working in Florida

June 2020 Florida LPN Nursing Workforce Supply (2018-2019) 6
EMPLOYMENT CHARACTERISTICS An estimated 81% of all LPNs in the potential workforce are working in Florida (Figure 3), including 41,448 renewing and 5,951 newly licensed LPNs.12 The proportion of renewing LPNs estimated to be working decreased five percentage points since 2017.
Employment Settings Extended care, assisted living, and/or nursing homes continue to employ the largest portion of LPNs (38%). Another 17% worked in home health, and 10% worked in the offices of physicians or other health providers (Table 4). Zero (0) LPNs reported employment in policy or planning settings. Occupational health, telehealth, staffing agencies, consulting, and academic settings were also among the least common employment settings. About 6% reported working in other settings not listed. Table 4: LPNs Employed by Setting, 2011 to 2019 Employment Setting 2011 2013 2015 2017 2019 Academic Setting 0.3% 0.3% 0.3% 0.2% 0.5% Ambulatory Care 2.1% 2.2% 2.3% 2.0% 2.1% Corrections Facility 4.4% 4.4% 4.0% 3.4% 4.1% Dialysis Center † - - - - 0.7% Healthcare Consulting / Product Sales 0.3% 0.3% 0.3% 0.2% 0.5% Home Health Care 16.0% 17.0% 15.4% 12.8% 16.7% Hospice * - - 5.7% 4.7% 3.7% Hospital 12.4% 10.1% 7.8% 6.2% 6.1% Insurance Claims/Benefits 1.1% 1.3% 1.8% 1.6% 2.0% Nursing Home, Extended Care, Assisted Living 40.8% 40.6% 38.8% 32.3% 38.2% Occupational Health 0.3% 0.2% 0.2% 0.2% 0.2% Other 7.1% 7.8% 6.6% 5.5% 5.9% Physician or other Health Provider Office 9.9% 10.3% 10.6% 9.3% 10.3% Policy, Planning, Regulatory, Licensing Agency * - - 0.1% 0.1% 0.0% Public/Community Health 2.3% 2.4% 2.2% 2.0% 3.1% School Health Services 2.1% 2.3% 2.4% 2.2% 2.3% Telehealth † - - - - 0.4% Temporary/Staffing Agency 0.9% 0.8% 0.6% 0.5% 0.4% Urgent Care/Walk-in Clinic * - - 0.9% 0.7% 0.8% Note: Beginning in 2016-2017, data represents working survey respondents in potential workforce only, totals may not equal 100% due to missing data/non-response, * Categories added in 2014-15 cycle; † Categories added in 2018-19 cycle
12 Working status is estimated using survey responses to employment variables, reported addresses, and statistical imputation methods among non-responders to most closely approximate the total workforce in Florida.
Renewals71%
New10%
Not Working17%
Figure 3: Estimated Employment of Potential LPN Workforce, 2019
June 2020 Florida LPN Nursing Workforce Supply (2018-2019) 7
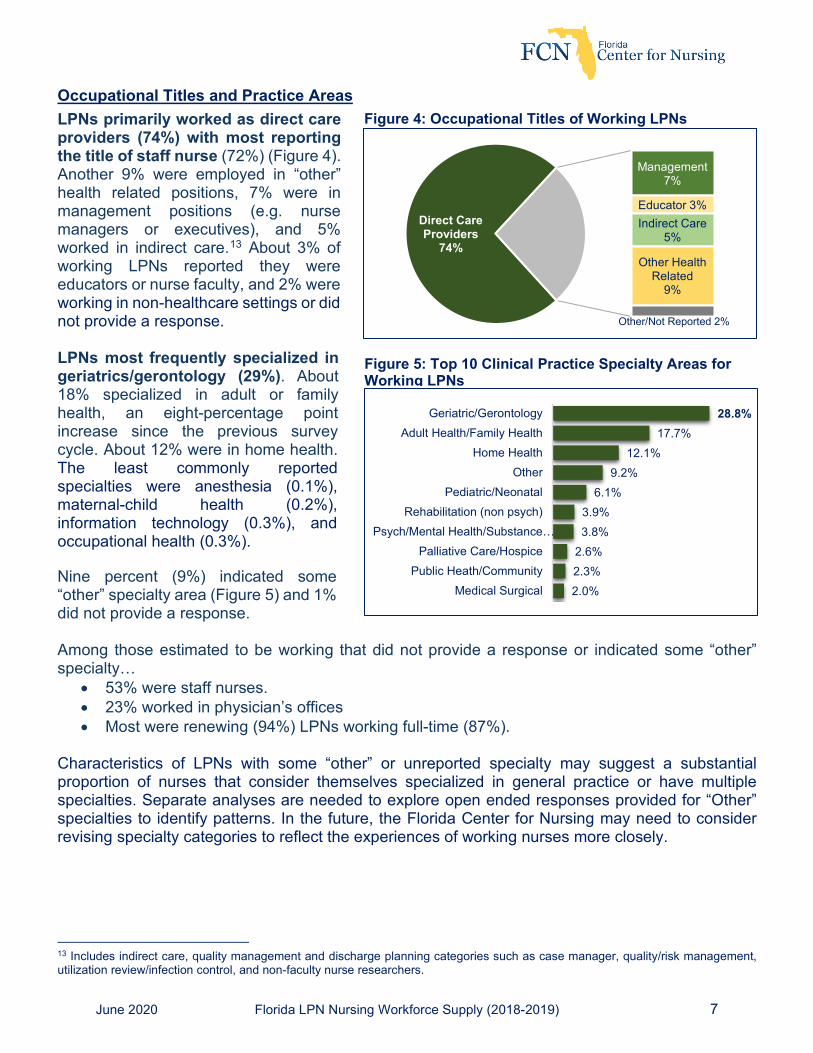
Occupational Titles and Practice Areas LPNs primarily worked as direct care providers (74%) with most reporting the title of staff nurse (72%) (Figure 4). Another 9% were employed in “other” health related positions, 7% were in management positions (e.g. nurse managers or executives), and 5% worked in indirect care.13 About 3% of working LPNs reported they were educators or nurse faculty, and 2% were working in non-healthcare settings or did not provide a response. LPNs most frequently specialized in geriatrics/gerontology (29%). About 18% specialized in adult or family health, an eight-percentage point increase since the previous survey cycle. About 12% were in home health. The least commonly reported specialties were anesthesia (0.1%), maternal-child health (0.2%), information technology (0.3%), and occupational health (0.3%). Nine percent (9%) indicated some “other” specialty area (Figure 5) and 1% did not provide a response. Among those estimated to be working that did not provide a response or indicated some “other” specialty…
• 53% were staff nurses. • 23% worked in physician’s offices • Most were renewing (94%) LPNs working full-time (87%).
Characteristics of LPNs with some “other” or unreported specialty may suggest a substantial proportion of nurses that consider themselves specialized in general practice or have multiple specialties. Separate analyses are needed to explore open ended responses provided for “Other” specialties to identify patterns. In the future, the Florida Center for Nursing may need to consider revising specialty categories to reflect the experiences of working nurses more closely.
13 Includes indirect care, quality management and discharge planning categories such as case manager, quality/risk management, utilization review/infection control, and non-faculty nurse researchers.
2.0%2.3%2.6%3.8%3.9%
6.1%9.2%
12.1%17.7%
28.8%
Medical SurgicalPublic Heath/Community
Palliative Care/HospicePsych/Mental Health/Substance…
Rehabilitation (non psych)Pediatric/Neonatal
OtherHome Health
Adult Health/Family HealthGeriatric/Gerontology
Figure 5: Top 10 Clinical Practice Specialty Areas for Working LPNs
Management7%
Direct Care Providers
74%
Educator 3%Indirect Care
5%
Other Health Related
9%
Other/Not Reported 2%
Figure 4: Occupational Titles of Working LPNs
June 2020 Florida LPN Nursing Workforce Supply (2018-2019) 8
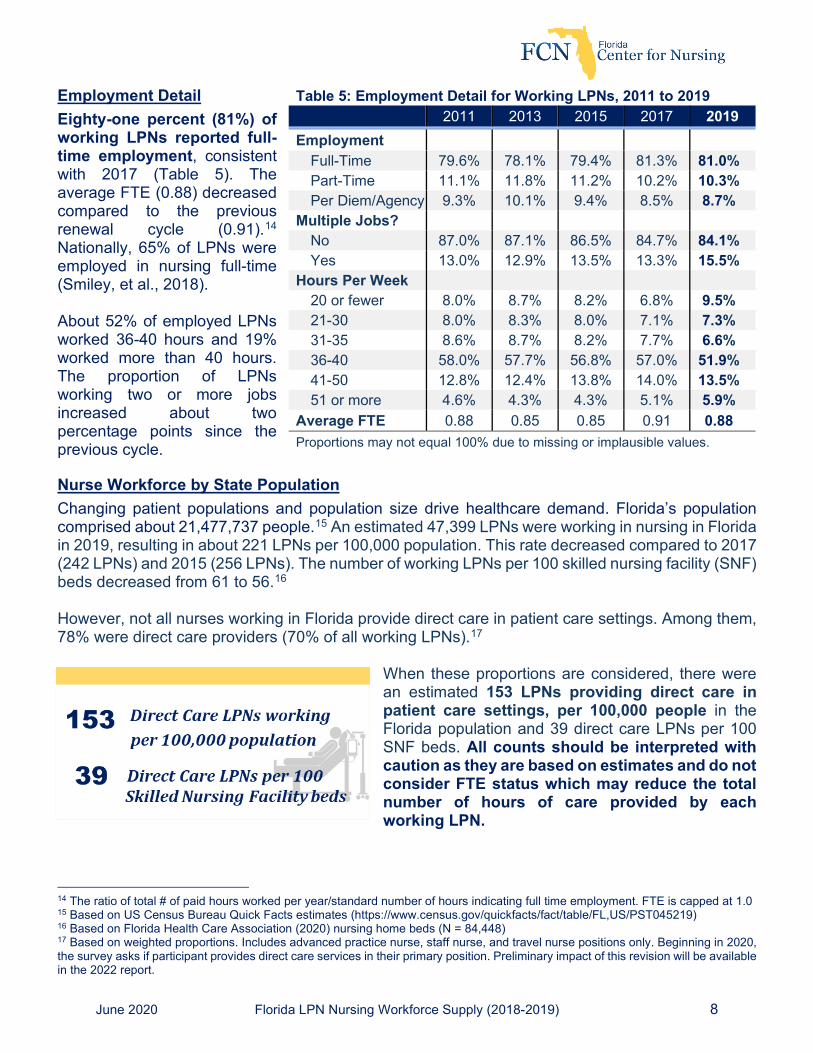
Employment Detail Eighty-one percent (81%) of working LPNs reported full-time employment, consistent with 2017 (Table 5). The average FTE (0.88) decreased compared to the previous renewal cycle (0.91).14 Nationally, 65% of LPNs were employed in nursing full-time (Smiley, et al., 2018). About 52% of employed LPNs worked 36-40 hours and 19% worked more than 40 hours. The proportion of LPNs working two or more jobs increased about two percentage points since the previous cycle. Nurse Workforce by State Population Changing patient populations and population size drive healthcare demand. Florida’s population comprised about 21,477,737 people.15 An estimated 47,399 LPNs were working in nursing in Florida in 2019, resulting in about 221 LPNs per 100,000 population. This rate decreased compared to 2017 (242 LPNs) and 2015 (256 LPNs). The number of working LPNs per 100 skilled nursing facility (SNF) beds decreased from 61 to 56.16 However, not all nurses working in Florida provide direct care in patient care settings. Among them, 78% were direct care providers (70% of all working LPNs).17
When these proportions are considered, there were an estimated 153 LPNs providing direct care in patient care settings, per 100,000 people in the Florida population and 39 direct care LPNs per 100 SNF beds. All counts should be interpreted with caution as they are based on estimates and do not consider FTE status which may reduce the total number of hours of care provided by each working LPN.
14 The ratio of total # of paid hours worked per year/standard number of hours indicating full time employment. FTE is capped at 1.0 15 Based on US Census Bureau Quick Facts estimates (https://www.census.gov/quickfacts/fact/table/FL,US/PST045219) 16 Based on Florida Health Care Association (2020) nursing home beds (N = 84,448) 17 Based on weighted proportions. Includes advanced practice nurse, staff nurse, and travel nurse positions only. Beginning in 2020, the survey asks if participant provides direct care services in their primary position. Preliminary impact of this revision will be available in the 2022 report.
Table 5: Employment Detail for Working LPNs, 2011 to 2019 2011 2013 2015 2017 2019
Employment
Full-Time 79.6% 78.1% 79.4% 81.3% 81.0% Part-Time 11.1% 11.8% 11.2% 10.2% 10.3% Per Diem/Agency 9.3% 10.1% 9.4% 8.5% 8.7%
Multiple Jobs? No 87.0% 87.1% 86.5% 84.7% 84.1% Yes 13.0% 12.9% 13.5% 13.3% 15.5%
Hours Per Week 20 or fewer 8.0% 8.7% 8.2% 6.8% 9.5% 21-30 8.0% 8.3% 8.0% 7.1% 7.3% 31-35 8.6% 8.7% 8.2% 7.7% 6.6% 36-40 58.0% 57.7% 56.8% 57.0% 51.9% 41-50 12.8% 12.4% 13.8% 14.0% 13.5% 51 or more 4.6% 4.3% 4.3% 5.1% 5.9%
Average FTE 0.88 0.85 0.85 0.91 0.88 Proportions may not equal 100% due to missing or implausible values.
June 2020 Florida LPN Nursing Workforce Supply (2018-2019) 9
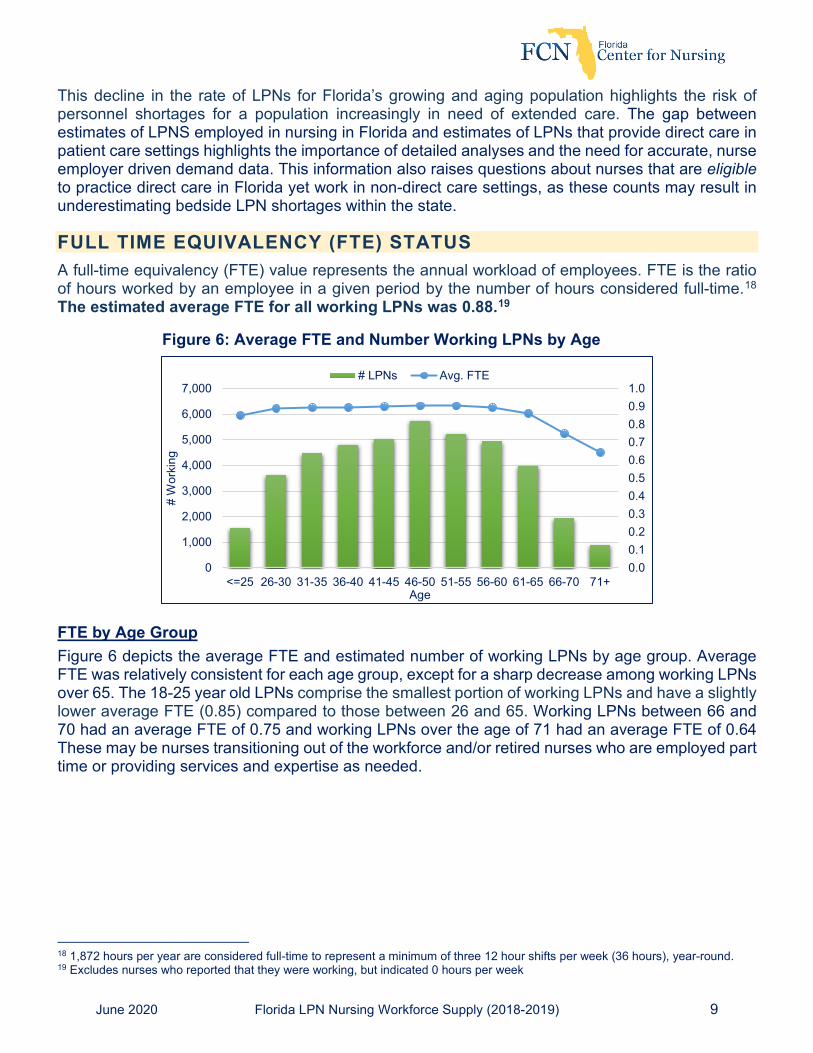
This decline in the rate of LPNs for Florida’s growing and aging population highlights the risk of personnel shortages for a population increasingly in need of extended care. The gap between estimates of LPNS employed in nursing in Florida and estimates of LPNs that provide direct care in patient care settings highlights the importance of detailed analyses and the need for accurate, nurse employer driven demand data. This information also raises questions about nurses that are eligible to practice direct care in Florida yet work in non-direct care settings, as these counts may result in underestimating bedside LPN shortages within the state. FULL TIME EQUIVALENCY (FTE) STATUS A full-time equivalency (FTE) value represents the annual workload of employees. FTE is the ratio of hours worked by an employee in a given period by the number of hours considered full-time.18 The estimated average FTE for all working LPNs was 0.88.19
FTE by Age Group Figure 6 depicts the average FTE and estimated number of working LPNs by age group. Average FTE was relatively consistent for each age group, except for a sharp decrease among working LPNs over 65. The 18-25 year old LPNs comprise the smallest portion of working LPNs and have a slightly lower average FTE (0.85) compared to those between 26 and 65. Working LPNs between 66 and 70 had an average FTE of 0.75 and working LPNs over the age of 71 had an average FTE of 0.64 These may be nurses transitioning out of the workforce and/or retired nurses who are employed part time or providing services and expertise as needed.
18 1,872 hours per year are considered full-time to represent a minimum of three 12 hour shifts per week (36 hours), year-round. 19 Excludes nurses who reported that they were working, but indicated 0 hours per week
Figure 6: Average FTE and Number Working LPNs by Age
0.00.10.20.30.40.50.60.70.80.91.0
0
1,000
2,000
3,000
4,000
5,000
6,000
7,000
<=25 26-30 31-35 36-40 41-45 46-50 51-55 56-60 61-65 66-70 71+
# W
orki
ng
Age
# LPNs Avg. FTE
June 2020 Florida LPN Nursing Workforce Supply (2018-2019) 10
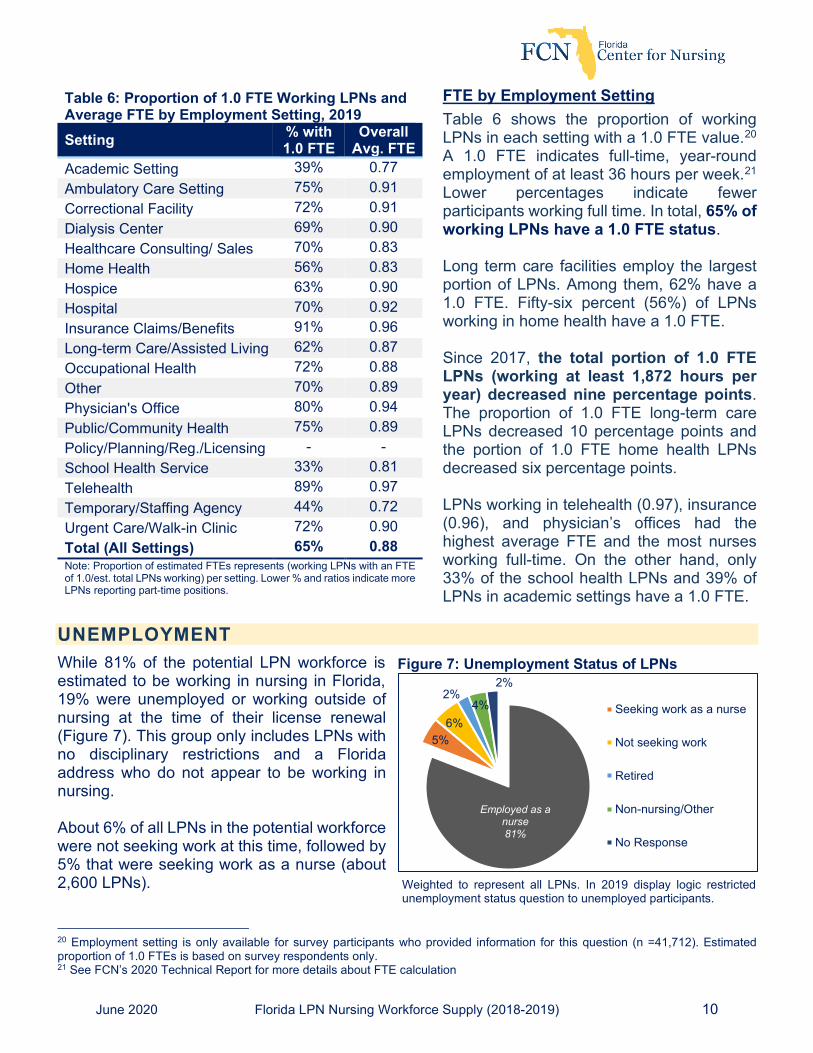
FTE by Employment Setting Table 6 shows the proportion of working LPNs in each setting with a 1.0 FTE value.20 A 1.0 FTE indicates full-time, year-round employment of at least 36 hours per week.21 Lower percentages indicate fewer participants working full time. In total, 65% of working LPNs have a 1.0 FTE status. Long term care facilities employ the largest portion of LPNs. Among them, 62% have a 1.0 FTE. Fifty-six percent (56%) of LPNs working in home health have a 1.0 FTE. Since 2017, the total portion of 1.0 FTE LPNs (working at least 1,872 hours per year) decreased nine percentage points. The proportion of 1.0 FTE long-term care LPNs decreased 10 percentage points and the portion of 1.0 FTE home health LPNs decreased six percentage points. LPNs working in telehealth (0.97), insurance (0.96), and physician’s offices had the highest average FTE and the most nurses working full-time. On the other hand, only 33% of the school health LPNs and 39% of LPNs in academic settings have a 1.0 FTE.
UNEMPLOYMENT While 81% of the potential LPN workforce is estimated to be working in nursing in Florida, 19% were unemployed or working outside of nursing at the time of their license renewal (Figure 7). This group only includes LPNs with no disciplinary restrictions and a Florida address who do not appear to be working in nursing. About 6% of all LPNs in the potential workforce were not seeking work at this time, followed by 5% that were seeking work as a nurse (about 2,600 LPNs).
20 Employment setting is only available for survey participants who provided information for this question (n =41,712). Estimated proportion of 1.0 FTEs is based on survey respondents only. 21 See FCN’s 2020 Technical Report for more details about FTE calculation
Table 6: Proportion of 1.0 FTE Working LPNs and Average FTE by Employment Setting, 2019 Setting % with
1.0 FTE Overall
Avg. FTE Academic Setting 39% 0.77 Ambulatory Care Setting 75% 0.91 Correctional Facility 72% 0.91 Dialysis Center 69% 0.90 Healthcare Consulting/ Sales 70% 0.83 Home Health 56% 0.83 Hospice 63% 0.90 Hospital 70% 0.92 Insurance Claims/Benefits 91% 0.96 Long-term Care/Assisted Living 62% 0.87 Occupational Health 72% 0.88 Other 70% 0.89 Physician's Office 80% 0.94 Public/Community Health 75% 0.89 Policy/Planning/Reg./Licensing - - School Health Service 33% 0.81 Telehealth 89% 0.97 Temporary/Staffing Agency 44% 0.72 Urgent Care/Walk-in Clinic 72% 0.90 Total (All Settings) 65% 0.88 Note: Proportion of estimated FTEs represents (working LPNs with an FTE of 1.0/est. total LPNs working) per setting. Lower % and ratios indicate more LPNs reporting part-time positions.
Employed as a nurse81%
5%6%
2%4%
2%
Seeking work as a nurse
Not seeking work
Retired
Non-nursing/Other
No Response
Weighted to represent all LPNs. In 2019 display logic restricted unemployment status question to unemployed participants.
Figure 7: Unemployment Status of LPNs
June 2020 Florida LPN Nursing Workforce Supply (2018-2019) 11
Almost 4% were employed in non-nursing settings or unemployed for some other reason. About 2% were retired but still maintain an active license and remain in the potential workforce. Unemployment Reasons Among unemployed LPNs that were not seeking employment (5.6%) at the time of their renewal…
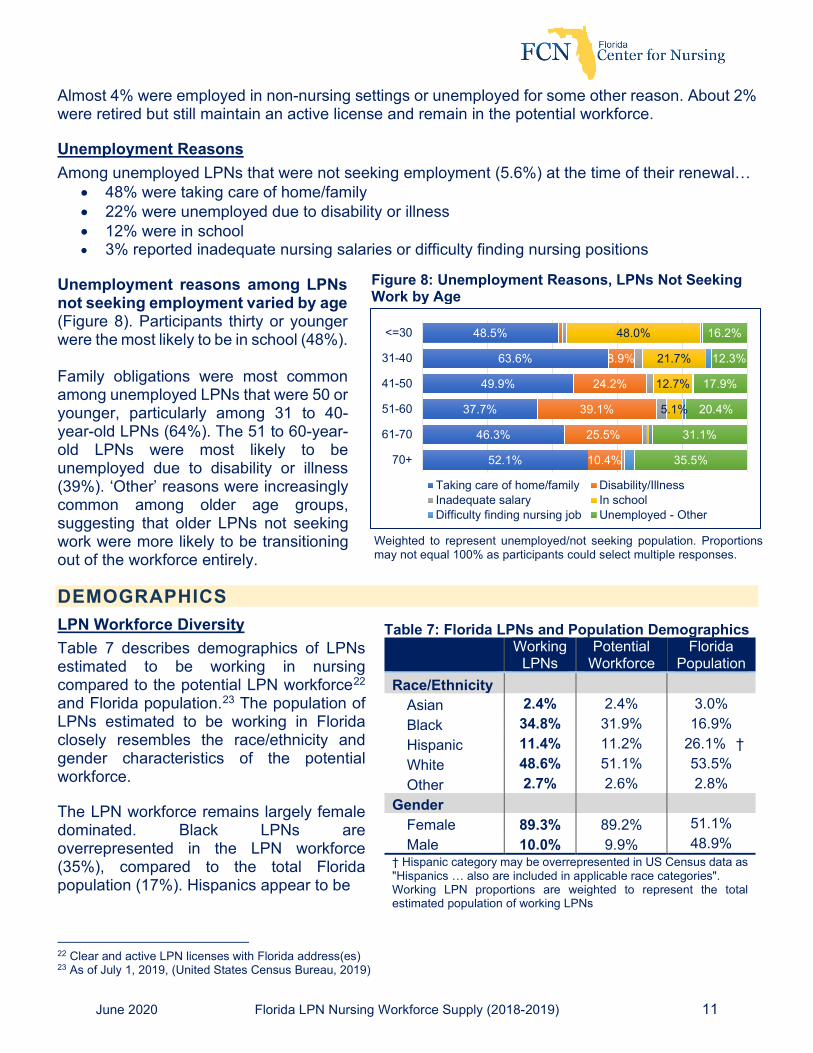
• 48% were taking care of home/family • 22% were unemployed due to disability or illness • 12% were in school • 3% reported inadequate nursing salaries or difficulty finding nursing positions
Unemployment reasons among LPNs not seeking employment varied by age (Figure 8). Participants thirty or younger were the most likely to be in school (48%). Family obligations were most common among unemployed LPNs that were 50 or younger, particularly among 31 to 40-year-old LPNs (64%). The 51 to 60-year-old LPNs were most likely to be unemployed due to disability or illness (39%). ‘Other’ reasons were increasingly common among older age groups, suggesting that older LPNs not seeking work were more likely to be transitioning out of the workforce entirely. DEMOGRAPHICS LPN Workforce Diversity Table 7 describes demographics of LPNs estimated to be working in nursing compared to the potential LPN workforce22 and Florida population.23 The population of LPNs estimated to be working in Florida closely resembles the race/ethnicity and gender characteristics of the potential workforce. The LPN workforce remains largely female dominated. Black LPNs are overrepresented in the LPN workforce (35%), compared to the total Florida population (17%). Hispanics appear to be
22 Clear and active LPN licenses with Florida address(es) 23 As of July 1, 2019, (United States Census Bureau, 2019)
Table 7: Florida LPNs and Population Demographics
Working
LPNs Potential
Workforce Florida
Population Race/Ethnicity
Asian 2.4% 2.4% 3.0% Black 34.8% 31.9% 16.9% Hispanic 11.4% 11.2% 26.1% † White 48.6% 51.1% 53.5% Other 2.7% 2.6% 2.8%
Gender Female 89.3% 89.2% 51.1% Male 10.0% 9.9% 48.9%
† Hispanic category may be overrepresented in US Census data as "Hispanics … also are included in applicable race categories". Working LPN proportions are weighted to represent the total estimated population of working LPNs
Figure 8: Unemployment Reasons, LPNs Not Seeking Work by Age
48.5%
63.6%
49.9%
37.7%
46.3%
52.1%
8.9%
24.2%
39.1%
25.5%
10.4%
48.0%
21.7%
12.7%
5.1%
16.2%
12.3%
17.9%
20.4%
31.1%
35.5%
<=30
31-40
41-50
51-60
61-70
70+
Taking care of home/family Disability/IllnessInadequate salary In schoolDifficulty finding nursing job Unemployed - Other
Weighted to represent unemployed/not seeking population. Proportions may not equal 100% as participants could select multiple responses.
June 2020 Florida LPN Nursing Workforce Supply (2018-2019) 12
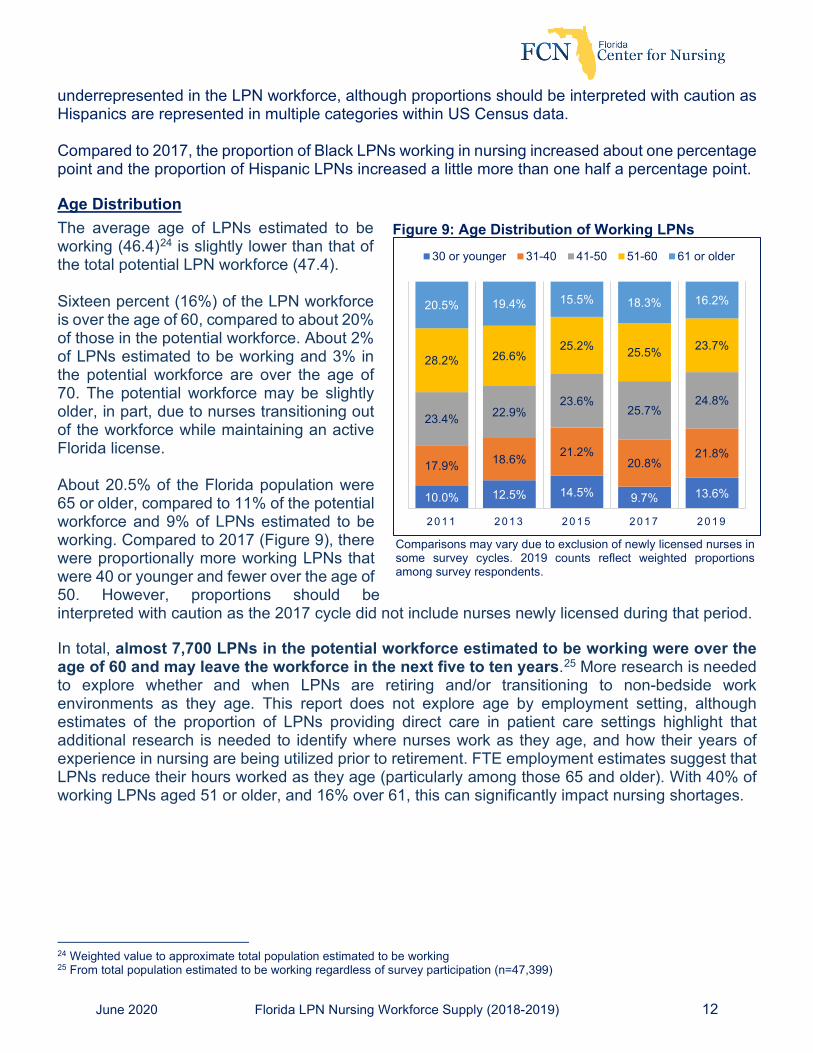
underrepresented in the LPN workforce, although proportions should be interpreted with caution as Hispanics are represented in multiple categories within US Census data. Compared to 2017, the proportion of Black LPNs working in nursing increased about one percentage point and the proportion of Hispanic LPNs increased a little more than one half a percentage point. Age Distribution The average age of LPNs estimated to be working (46.4)24 is slightly lower than that of the total potential LPN workforce (47.4). Sixteen percent (16%) of the LPN workforce is over the age of 60, compared to about 20% of those in the potential workforce. About 2% of LPNs estimated to be working and 3% in the potential workforce are over the age of 70. The potential workforce may be slightly older, in part, due to nurses transitioning out of the workforce while maintaining an active Florida license. About 20.5% of the Florida population were 65 or older, compared to 11% of the potential workforce and 9% of LPNs estimated to be working. Compared to 2017 (Figure 9), there were proportionally more working LPNs that were 40 or younger and fewer over the age of 50. However, proportions should be interpreted with caution as the 2017 cycle did not include nurses newly licensed during that period. In total, almost 7,700 LPNs in the potential workforce estimated to be working were over the age of 60 and may leave the workforce in the next five to ten years.25 More research is needed to explore whether and when LPNs are retiring and/or transitioning to non-bedside work environments as they age. This report does not explore age by employment setting, although estimates of the proportion of LPNs providing direct care in patient care settings highlight that additional research is needed to identify where nurses work as they age, and how their years of experience in nursing are being utilized prior to retirement. FTE employment estimates suggest that LPNs reduce their hours worked as they age (particularly among those 65 and older). With 40% of working LPNs aged 51 or older, and 16% over 61, this can significantly impact nursing shortages.
24 Weighted value to approximate total population estimated to be working 25 From total population estimated to be working regardless of survey participation (n=47,399)
10.0% 12.5% 14.5% 9.7% 13.6%
17.9% 18.6% 21.2%20.8%
21.8%
23.4% 22.9%23.6%
25.7%24.8%
28.2% 26.6%25.2% 25.5% 23.7%
20.5% 19.4% 15.5% 18.3% 16.2%
2 0 1 1 2 0 1 3 2 0 1 5 2 0 1 7 2 0 1 9
30 or younger 31-40 41-50 51-60 61 or older
Comparisons may vary due to exclusion of newly licensed nurses in some survey cycles. 2019 counts reflect weighted proportions among survey respondents.
Figure 9: Age Distribution of Working LPNs
June 2020 Florida LPN Nursing Workforce Supply (2018-2019) 13
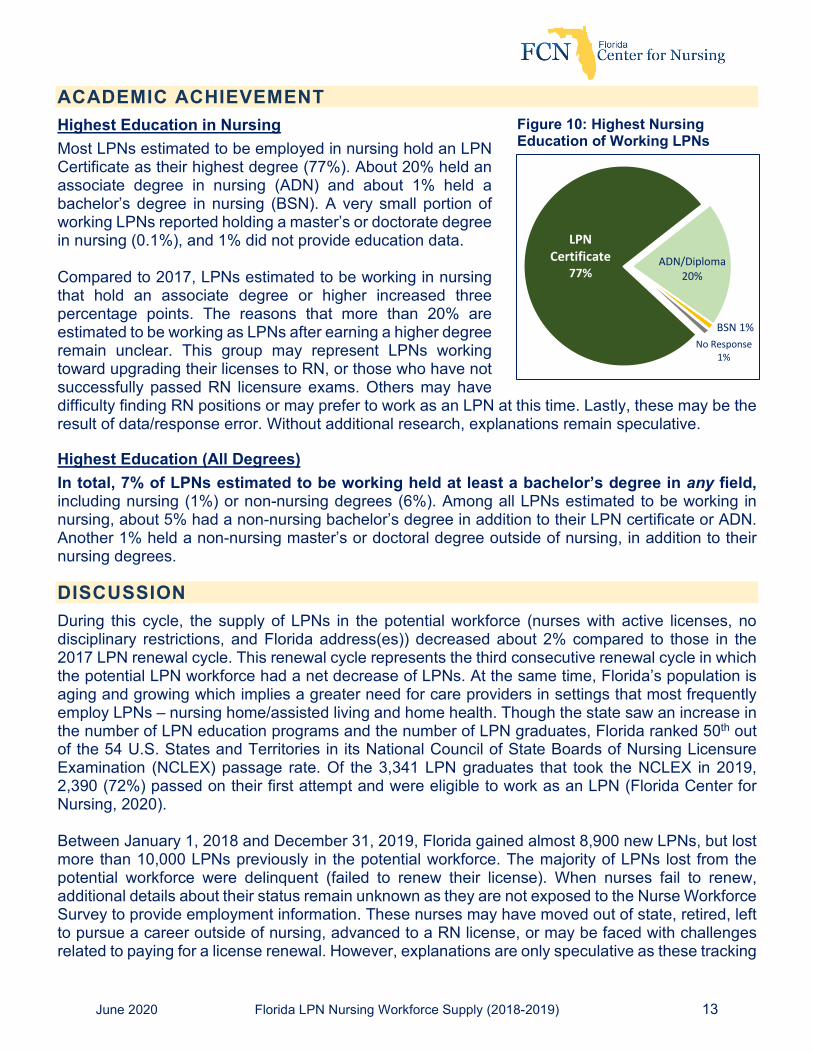
ACADEMIC ACHIEVEMENT Highest Education in Nursing Most LPNs estimated to be employed in nursing hold an LPN Certificate as their highest degree (77%). About 20% held an associate degree in nursing (ADN) and about 1% held a bachelor’s degree in nursing (BSN). A very small portion of working LPNs reported holding a master’s or doctorate degree in nursing (0.1%), and 1% did not provide education data. Compared to 2017, LPNs estimated to be working in nursing that hold an associate degree or higher increased three percentage points. The reasons that more than 20% are estimated to be working as LPNs after earning a higher degree remain unclear. This group may represent LPNs working toward upgrading their licenses to RN, or those who have not successfully passed RN licensure exams. Others may have difficulty finding RN positions or may prefer to work as an LPN at this time. Lastly, these may be the result of data/response error. Without additional research, explanations remain speculative. Highest Education (All Degrees) In total, 7% of LPNs estimated to be working held at least a bachelor’s degree in any field, including nursing (1%) or non-nursing degrees (6%). Among all LPNs estimated to be working in nursing, about 5% had a non-nursing bachelor’s degree in addition to their LPN certificate or ADN. Another 1% held a non-nursing master’s or doctoral degree outside of nursing, in addition to their nursing degrees. DISCUSSION During this cycle, the supply of LPNs in the potential workforce (nurses with active licenses, no disciplinary restrictions, and Florida address(es)) decreased about 2% compared to those in the 2017 LPN renewal cycle. This renewal cycle represents the third consecutive renewal cycle in which the potential LPN workforce had a net decrease of LPNs. At the same time, Florida’s population is aging and growing which implies a greater need for care providers in settings that most frequently employ LPNs – nursing home/assisted living and home health. Though the state saw an increase in the number of LPN education programs and the number of LPN graduates, Florida ranked 50th out of the 54 U.S. States and Territories in its National Council of State Boards of Nursing Licensure Examination (NCLEX) passage rate. Of the 3,341 LPN graduates that took the NCLEX in 2019, 2,390 (72%) passed on their first attempt and were eligible to work as an LPN (Florida Center for Nursing, 2020). Between January 1, 2018 and December 31, 2019, Florida gained almost 8,900 new LPNs, but lost more than 10,000 LPNs previously in the potential workforce. The majority of LPNs lost from the potential workforce were delinquent (failed to renew their license). When nurses fail to renew, additional details about their status remain unknown as they are not exposed to the Nurse Workforce Survey to provide employment information. These nurses may have moved out of state, retired, left to pursue a career outside of nursing, advanced to a RN license, or may be faced with challenges related to paying for a license renewal. However, explanations are only speculative as these tracking
LPN Certificate
77%ADN/Diploma
20%
BSN 1%No Response
1%
Figure 10: Highest Nursing Education of Working LPNs
June 2020 Florida LPN Nursing Workforce Supply (2018-2019) 14
details are not available. Efforts to reduce the number of delinquent licensees indicate a need for further research to achieve a better understanding of the reasons for not renewing. Florida is faced with population growth and an aging population both of which increase the demand for health workers, particularly LPNs, as they are the primary licensed care provider in home health and long-term care settings. Yet, the supply of LPNs is decreasing through a loss of practitioners and unsuccessful licensure exam passage rates of new graduates. The Florida Legislature implemented changes to increase the number of education programs with the hope that would produce more LPNs. However, the completion of an education program is not enough to assume the role of a licensed practitioner. One must also achieve a passing score on the NCLEX which only 72% of Florida’s LPN graduates do on their first attempt. The impact of a decreasing supply on an increasing demand is evident through the number of LPNs providing direct care in patient care settings in Florida and declines in the number of LPNs per 100 skilled nursing facility beds in long-term care settings. This trend must be reversed. An adequate, qualified workforce must be available to provide the needed care to our most dependent Floridians, those who are aged and/or disabled. In 2018, Florida joined the Nurse Licensure Compact (NLC). This enables nurses to be eligible to work in any participating member state via a multi-state license. However, the license must be issued by the state in which a nurse maintains their primary residence. According to survey responses, 9% of the potential workforce (an estimated 5,312 LPNs) maintain multistate licenses issued in the state of Florida. On the other hand, 576 LPNs deactivated their Florida license in favor of a multistate license issued by another state. These nurses remain eligible to practice in Florida but would not be considered in the potential workforce, as they do not maintain residency in the state of Florida. Florida’s NLC membership increases the possibility for nurses not primarily licensed in Florida to be eligible to become employed within this state. However, current tracking processes do not allow for the Center to estimate how many additional nurses are contributing to Florida’s workforce while maintaining a multistate license based in another member state. The Center does not know if a portion of deactivated nurses are actively employed in Florida with a multistate license based in another state. Nor do we know if NLC nurses licensed in Florida are likely to leave the state in favor of employment in another member state. More information is needed to identify the impact of Florida’s NLC membership on a shrinking LPN workforce. An estimated 81% of LPNs in the potential workforce were working in nursing in Florida as of the end of 2019. Additionally, about 5% of LPNs in the potential workforce were not employed in nursing but were seeking work as a nurse. Almost 6% were not employed and not seeking work as a nurse, citing reasons such as taking care of home and family (48%), disabilities/illnesses (22%), or schooling (12%). Citing some ‘other’ reason for not seeking work as a nurse (22%) was more common as nurses aged, suggesting that these may be nurses transitioning out of the workforce while maintaining an active Florida license. More information is needed about the 5% seeking work as a nurse (an estimated 2,928 LPNs in the potential workforce) to identify potential barriers toward their employment goal. The Florida Department of Economic Opportunity workforce statistics (Florida Department of Economic Opportunity, 2019) identified Nursing and Residential Care Facilities as the 10th highest industry gaining new jobs between 2019 and 2027 and the 12th fastest growing industry. During the same period, Licensed Practical Nurses are expected to experience a 10.7% increase in jobs for a total of 5,133 new jobs. Additionally, Florida holds the second highest proportion of persons 65 and
June 2020 Florida LPN Nursing Workforce Supply (2018-2019) 15
older (Himes & Kilduff, 2019) in the US. The data clearly show the need for more LPNs now and in the future. Yet, it is evident that the supply has decreased. Further, about 16% of the LPN workforce is 61 or older compared to about 14% that are 30 or younger suggesting that, at current rates, the youngest age group of LPNs is less than adequate to replace the increasing counts of nurses in the oldest age group. Additionally, in 2018, Florida’s first-time LPN NCLEX passage rate was 76% (Florida Center for Nursing, 2019) and in 2019 the passage rate was 72% (Florida Center for Nursing, 2020) suggesting that even among those seeking LPN careers, a substantial number are not achieving licensure. Additional support is needed to increase the proportion of LPN graduates that are eligible to work and improve work environments to accommodate an intergenerational workforce and the potential burdens of greater patient care expectations due to a growing and aging population while older nurses continue to be eligible for and pursue retirement. RECOMMENDATIONS Recommendation 1. Healthcare worker shortage is a public health crisis. Florida must be equipped
with an adequate, qualified, engaged and resilient (Florida Center for Nursing, n.d.) LPN workforce to meet current employer needs and prepare for Florida’s growing and aging population. Employers and industry stakeholders must commit resources to investigate net losses from the LPN workforce and why those who could be working are not. Efforts to improve work environments, retain nurses and develop career pathways for LPNs should be implemented.
Recommendation 2. LPN education administrators must implement changes to improve the NCLEX
passage rates of graduates. Florida’s elected leadership should strengthen the measures for program quality with the goal of increasing the supply of future nurses in a cost-effective way. Encourage academic and industry collaboration to ensure appropriate curriculum content in preparation to meet industry needs, specifically in geriatric/gerontology and home health and implement best practices to achieve the minimum standard NCLEX passage rates or better.
Recommendation 3. Support the Center’s research efforts and analysis of workforce trends to
ensure the Center obtains the best data on the supply of all types of nurses, and to maximize the use of limited resources. Continue to require the Florida Department of Health and Board of Nursing to support the Center’s data collection efforts and Nurse Workforce Survey revisions designed to increase clarity and efficiency for participants and minimize errors in responses.
Recommendation 4. Florida’s involvement in the National Licensure Compact creates opportunities
for non-Florida residents to work in our state, and for Florida residents to work out of state. However, “there is no clear picture about the implications of NLC on comprehensive state nursing workforce data or policy planning” (Reichhardt & Bitton, 2020, p. 6). State and industry leaders must collaborate to gather data on the work patterns of nurses with a multi-state license regardless of their home state.
June 2020 Florida LPN Nursing Workforce Supply (2018-2019) 16
ACKNOWLEDGEMENTS The Florida Center for Nursing wishes to thank all nurses who provided this valuable information via the Center’s survey, as well as those that contributed to the Center’s record high donations during this renewal cycle. We also wish to thank our partner entities, the Florida Board of Nursing and Medical Quality Assurance for their assistance with survey revisions and data collection. This research would not be possible without these valuable contributions.
REFERENCES Florida Center for Nursing. (2016). Florida's Demand for Nurses: 2015 Employer Survey. Retrieved from
https://www.flcenterfornursing.org/DesktopModules/Bring2mind/DMX/Download.aspx?Command=Core_Download&EntryId=1011&PortalId=0&TabId=151
Florida Center for Nursing. (2018). Florida’s 2016-2017 Workforce Supply Characteristics and Trends: Licensed Practical Nurses (LPN). Retrieved from https://www.flcenterfornursing.org/DesktopModules/Bring2mind/DMX/API/Entries/Download?Command=Core_Download&EntryId=1610&PortalId=0&TabId=151
Florida Center for Nursing. (2019). Review of Florida Nurse Education Program Graduate Passage Rates on the National Council of State Boards of Nursing Licensure Examination: Calendar Year 2018. Retrieved from https://www.flcenterfornursing.org/DesktopModules/Bring2mind/DMX/API/Entries/Download?Command=Core_Download&EntryId=1790&PortalId=0&TabId=151
Florida Center for Nursing. (2020). Review of Florida Nurse Education Program Graduate Passage Rates on the National Council of State Boards of Nursing Licensure Examination: Calendar Year 2019. Retrieved from https://www.flcenterfornursing.org/DesktopModules/Bring2mind/DMX/API/Entries/Download?Command=Core_Download&EntryId=1840&PortalId=0&TabId=151
Florida Center for Nursing. (n.d.). Call to Action: Addressing Healthcare Workforce Shortages. Retrieved from https://www.flcenterfornursing.org/DesktopModules/Bring2mind/DMX/API/Entries/Download?Command=Core_Download&EntryId=1815&PortalId=0&TabId=151
Florida Department of Economic Opportunity. (2019, December 2). 2019-2027 Employment Projections. Retrieved from https://floridajobs.org/workforce-statistics/data-center/statistical-programs/employment-projections
Florida Health Care Association. (2020). Facts about Long Term Care in Florida. Retrieved from http://www.fhca.org/media_center/long_term_health_care_facts
Himes, C. L., & Kilduff, L. (2019, March 16). One Quarter of Older Americans Live in California, Florida, and Texas. Retrieved from Population Reference Bureau: https://www.prb.org/which-us-states-are-the-oldest/
National Council of State Boards of Nursing, Inc. (2020). Licensure Compacts. Retrieved from NCSBN: https://www.ncsbn.org/compacts.htm
Reichhardt, L., & Bitton, J. (2020). Implications of the Nurse Licensure Compact on Nursing Workforce Planning: Identifying Barriers and Recommendations for Investigation. The National Forum of State Nursing Workforce Centers.
Smiley, R. A., Lauer, P., Bienemy, C., Berg, J. G., Shireman, E., Reneau, K. A., & Alexander, M. (2018, October (Supplement)). The 2017 National Nursing Workforce. Journal of Nursing Regulation, 9(3), S1-S88.
United States Census Bureau. (2019). QuickFacts, Florida. Retrieved from https://www.census.gov/quickfacts/fl