Embed Size (px)
Citation preview
Key Findings from Research and Analysis 21
RESEARCH
Key Findings from the OFR’s Research and Analysis of the Financial System
The OFR has continued to work throughout the year on
data and research projects to fulfill its mission. This chapter
describes key findings from our research and analysis. The
chapter focuses on cybersecurity and operational risk, reducing
regulatory reporting burdens, an alternative reference rate, the
Legal Entity Identifier (LEI) data standard, a multifactor approach
to assessing the systemic importance of banks, and financial
data services initiatives. The chapter also discusses selected
findings in our research papers during the fiscal year.
Network Analysis to Identify Cybersecurity and Operational Risk
Cybersecurity incidents and other operational risks are growing threats to financial stability. Financial firms are connected through complex, intercon-nected networks. Disruptions to the operations of a key institution in the financial system could be transmitted through these networks and lead to a systemic crisis (see Financial Stability Threats).
To understand this threat, officials can combine network analysis with maps of the financial system to identify cybersecurity vulnerabilities and other operational risks. Networks can be mapped out in a visualization of
Indicates an OFR Key Finding
22 2017 | OFR Annual Report to Congress
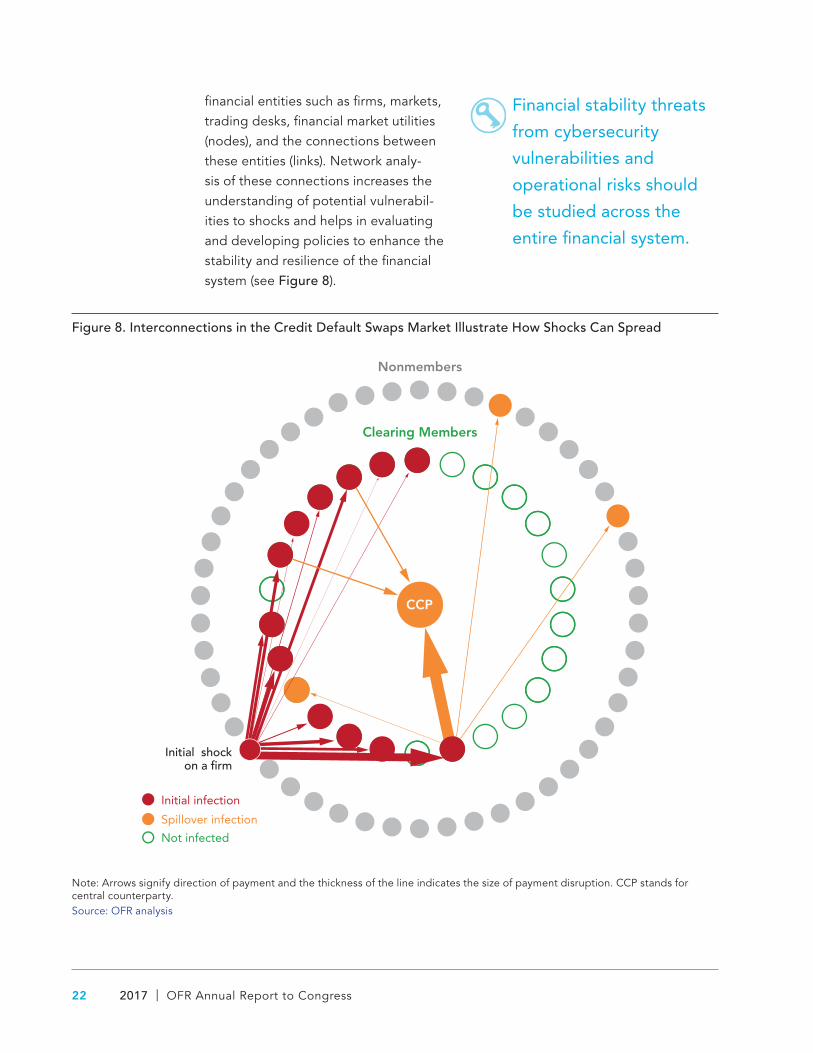
financial entities such as firms, markets, trading desks, financial market utilities (nodes), and the connections between these entities (links). Network analy-sis of these connections increases the understanding of potential vulnerabil-ities to shocks and helps in evaluating and developing policies to enhance the stability and resilience of the financial system (see Figure 8).
Financial stability threats
from cybersecurity
vulnerabilities and
operational risks should
be studied across the
entire financial system.
Figure 8. Interconnections in the Credit Default Swaps Market Illustrate How Shocks Can Spread
J
D
I
E
G
H
F
K
CCP
V
Q
U
T
R
X
S
BZY C
A
N MOP L
CCP
A
J
E
G
H
F
K
CCP
V
Q
U
T
S
Y
A
NOP L
CCP
A
CCPCCP
Nonmembers
Clearing Members
Initial shockon a �rm
Initial infection
Spillover infection
Not infected
Note: Arrows signify direction of payment and the thickness of the line indicates the size of payment disruption. CCP stands for central counterparty.Source: OFR analysis
Key Findings from Research and Analysis 23
The OFR’s broad financial stability mandate gives us a unique perspec-tive for studying threats to the finan-cial system from cybersecurity risks and other operational risks. The OFR has the authority to collect data from federal financial regulators and market participants. This authority allows the OFR to analyze a wide range of detailed transaction-level datasets. Using these data, researchers can develop detailed maps that show the financial transac-tions among market participants and identify the participants most important to a particular part of the U.S. financial system.
The OFR’s current research on cyberse-curity and other operational risks is in two main areas. The first analyzes past operational and cybersecurity incidents involving financial entities. We review event studies, recent experiences, and other information to understand events and how they might threaten the finan-cial system. Researchers evaluate the efficacy and scope of regulations and gaps in policy that could affect the finan-cial system’s resilience. We draw lessons from tabletop exercises, which bring together industry participants and regu-lators to examine potential scenarios.
The second major area of OFR research focuses on applying network analysis to potential cybersecurity risks and other operational risks. The OFR is develop-ing maps that highlight connections throughout the financial sector. We use these maps to identify key vulnerabilities and critical institutions across different markets.
Network analysis
combined with maps of
the financial system
populated by real-world
data may help identify
potential vulnerabilities to
cybersecurity threats.
Network analysis of these maps identifies the most centrally connected compa-nies in a financial market. This analysis offers several key lessons for improving defenses. One lesson is that a network’s resilience can vary greatly against differ-ent types of threats. Targeted attacks by sophisticated adversaries can cause much more damage than random fail-ures, and these attacks necessitate a much higher level of network resil-ience. Another lesson is that coordinat-ing defense strategies among network participants is vital in preventing weak-nesses in defense systems. A lack of coordination between market partici-pants and regulators can compromise network stability and leave key institu-tions under-defended.
As real-world data is added to these maps, network analysis yields more valuable insights. The maps hold the potential to allow policymakers, market participants, and the public to see specific ways cybersecurity and opera-tional risks could threaten the stability of the financial system. Those insights help bolster network defenses.
24 2017 | OFR Annual Report to Congress
Reducing Regulatory Reporting Burdens
Regulation and oversight of finan-cial institutions and markets is divided among federal and state agencies. Banks, brokers, and other U.S. financial institutions and markets are governed
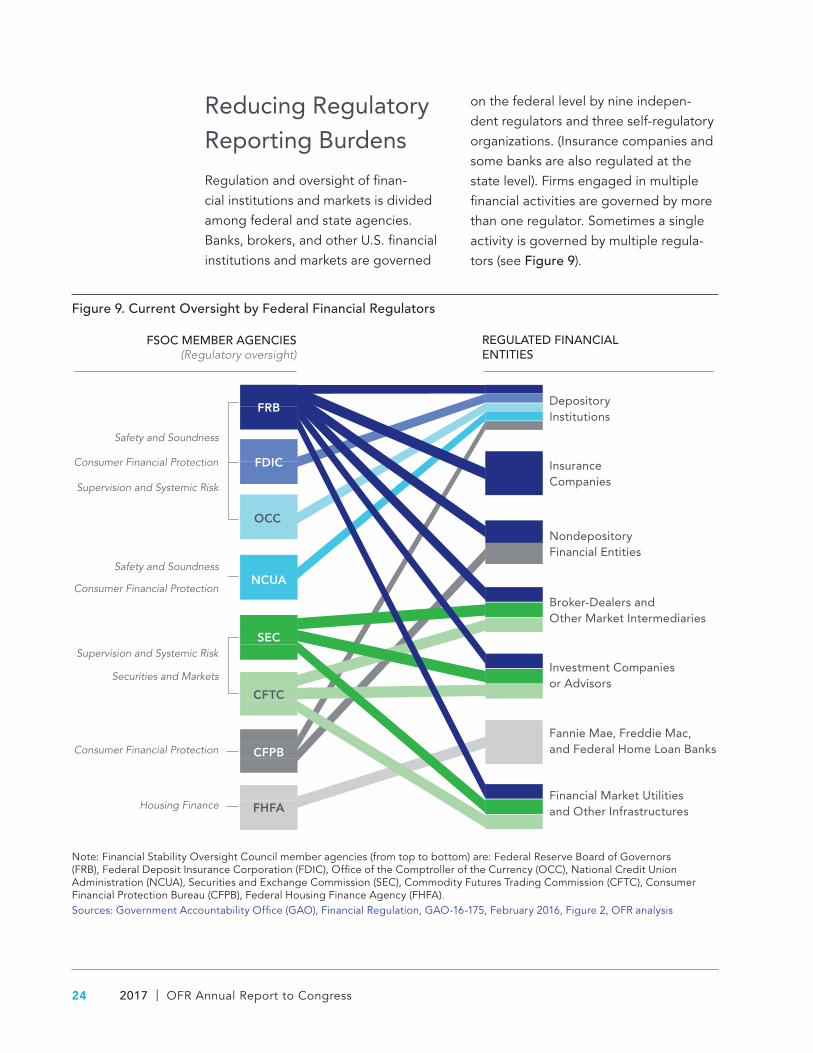
on the federal level by nine indepen-dent regulators and three self-regulatory organizations. (Insurance companies and some banks are also regulated at the state level). Firms engaged in multiple financial activities are governed by more than one regulator. Sometimes a single activity is governed by multiple regula-tors (see Figure 9).
Figure 9. Current Oversight by Federal Financial Regulators
DepositoryInstitutions
InsuranceCompanies
NondepositoryFinancial Entities
Broker-Dealers and Other Market Intermediaries
Investment Companies or Advisors
Fannie Mae, Freddie Mac, and Federal Home Loan Banks
Financial Market Utilities and Other Infrastructures
Securities and Markets
Supervision and Systemic Risk
Supervision and Systemic Risk
Housing Finance
Consumer Financial Protection
Safety and Soundness
Consumer Financial Protection
Safety and Soundness
Consumer Financial Protection
OCC
NCUA
CFPB
SEC
CFTC
FHFA
FRB
FDIC
FSOC MEMBER AGENCIES(Regulatory oversight)
REGULATED FINANCIALENTITIES
Note: Financial Stability Oversight Council member agencies (from top to bottom) are: Federal Reserve Board of Governors (FRB), Federal Deposit Insurance Corporation (FDIC), Office of the Comptroller of the Currency (OCC), National Credit Union Administration (NCUA), Securities and Exchange Commission (SEC), Commodity Futures Trading Commission (CFTC), Consumer Financial Protection Bureau (CFPB), Federal Housing Finance Agency (FHFA).Sources: Government Accountability Office (GAO), Financial Regulation, GAO-16-175, February 2016, Figure 2, OFR analysis
Key Findings from Research and Analysis 25
This fragmented approach enables tailored regulation and enforcement, but can also result in inefficient oversight and reporting. The current regulatory structure has led to inconsistencies in agencies’ data collection activities. U.S. financial institutions report that they are often required to submit the same data to more than one U.S. regulator using different calculations, classifications, and formats.
Duplicative, conflicting, or inconsis-tent reporting requirements have the potential to increase costs, undermine the efficiency and quality of data collec-tions, and impede data comparison and integration. Duplicative, conflicting, or inconsistent reporting requirements can also misalign regulatory reports from the data that firms use for their risk manage-ment. Likewise, these requirements could impair the ability of government officials to assess and monitor threats to financial stability and assure the functionality and integrity of financial markets. Finally, duplicative and incon-sistent requirements can erode public confidence in government.
Preliminary OFR analysis
indicates that examples
cited by industry about
duplicative, conflicting,
and inconsistent
regulatory reporting
requirements merit
further exploration.
To better understand this issue, we asked a handful of financial institutions and industry groups for examples. During these initial discussions, firms focused on reports to member agencies of the Financial Stability Oversight Council. Information came from asset manag-ers, banks, and financial services trade associations.
We analyzed a selection of these exam-ples identified by industry to determine the general validity of industry concerns about regulatory burden and identify ways the OFR might help address these issues. For each example, we compared multiple data fields to identify dupli-cative, conflicting, or inconsistent data requirements and found that the indus-try’s concerns warrant further analysis, as discussed in the next section.
Private Fund Reporting
Preliminary OFR analysis found validity in the assertions from industry about duplicative, conflicting, or inconsistent reporting requirements. Discrepancies generally fell into three categories:
1. identical information sought in different data formats or classifications,
2. similar information sought using different methodologies or metrics, and
3. different information sought for simi-larly situated filers or scenarios.
26 2017 | OFR Annual Report to Congress
The OFR found evidence
of duplicative, conflicting,
and inconsistent
requirements between
the two forms that
investment advisors use
to report information
about private funds to
federal agencies.
For example, the reporting requirements of Forms PF and CPO-PQR demonstrate at least some of these characteristics. The Dodd-Frank Act directed the SEC to establish reporting requirements for investment advisers to private funds. The law requires that the reports include data such as counterparty credit risk expo-sure, trading and investment exposures, and types of assets held.
To collect the data, the SEC and the CFTC jointly implemented a rule requir-ing certain private fund advisors and commodity pool operators (CPOs) to submit information through Form PF. Separately, the CFTC implemented Form CPO-PQR. Large CPOs, as members of the National Futures Association, must also submit the association’s Form PQR, an abbreviated version of the CFTC form. These forms require CPOs to file confidential reports on holdings, transac-tions, and certain trading strategies and characteristics. Based on size, certain pools file more frequently and file more information than others.
These reporting forms contain examples of identical information being sought. By filing Form PF or CPO-PQR, a respon-dent might not be required to file all or part of the other forms or schedules of forms. CPOs whose pools qualify as hedge funds might report quarterly on Form PF, exempting themselves from filing all but one year-end CPO- PQR schedule. However, large CPOs are still required to report quarterly on Schedule A of the association’s Form PQR. The association’s Form PQR contains a subset of the information in the CFTC’s Form CPO-PQR. As a result, the large CPOs might be required to file Form PF, an abbreviated but duplicative Form CPO-PQR, and a duplicative asso-ciation Form PQR at the end of the year.
Although the agencies and association attempt to limit reporting duplication, the attempts fall short of preventing all overlap.
In another example, both forms request information on assets under manage-ment but have different definitions. Form CPO-PQR defines assets under manage-ment as the amount of all assets under the control of the CPO. The SEC defines regulatory assets under management to include securities portfolios that receive supervisory or management services from the report filer. The difference in the definitions could require CPOs to calculate separate types of assets under management for reporting on each of the forms.
Key Findings from Research and Analysis 27
Findings and Next Steps
The OFR’s initial analysis found that concerns raised by the industry may be justified. Further analysis is necessary to better understand the reasons for the discrepancies. Future analysis should consider whether individual discrepan-cies cause burden, or burden exists only in the aggregate.
If further analysis confirms that these concerns are justified, we will work to ease these burdens through the FSOC and its member agencies and by pursu-ing our data-related mandates.
LIBOR Alternative
For years, the LIBOR interest rate bench-mark has played a central role in global financial markets and the economy. U.S. dollar LIBOR has been used to set inter-est rates on trillions of dollars of retail mortgages, private student loans, corpo-rate loans, derivatives, and other financial products. LIBOR, formerly the London Interbank Offered Rate, is now known as ICE LIBOR (Intercontinental Exchange LIBOR).
A new interest rate
benchmark would be
more reliable and viable
than LIBOR.
The LIBOR benchmark’s past reliance on survey submissions rather than trans-actions led to widespread manipula-tion. Traders submitted responses to the LIBOR survey intending to increase returns on derivatives positions, and during the 2007-09 financial crisis, intending to minimize appearances of riskiness of their banks.
Although reforms to LIBOR have made manipulation less likely, a shift in senti-ment among banks about the advan-tages of LIBOR and increasing reluctance by banks to participate in LIBOR surveys, along with the longer-term trend from unsecured to secured funding markets, have raised serious questions about the viability of LIBOR as a benchmark.
Doubts about LIBOR’s future prompted the Federal Reserve to begin an effort to identify an alternative benchmark for funding costs in U.S. financial markets.
Approaches to improve data quality and reduce reporting burden include:
■ helping agencies agree on common standards for defini-tions, identifiers, and formats;
■ using statutory authority to impose common stan-dards by brokering agree-ments between industry and regulators on essential data elements;
■ promoting and adhering to best practices in data collec-tion; and
■ facilitating effective data shar-ing among regulators.
28 2017 | OFR Annual Report to Congress
The OFR joined the effort, and we have worked closely with the Federal Reserve to create a set of benchmarks based on data on overnight repurchase agree-ments, or repos.
The Federal Reserve Board and the Federal Reserve Bank of New York convened the Alternative Reference Rates Committee, made up of banks active in the derivatives market, to inform the process.
The repo market is a key source of secured short-term funding for the finan-cial system. In a repo transaction, a secu-rity owner sells a security to raise cash. The agreement requires the seller of the security to repurchase it on a specific date for a prearranged price. If the seller is unable to repurchase the security, the cash provider is entitled to liquidate the security for repayment.
In late August 2017, the Federal Reserve sought public comment on three daily rates based on repo transactions with U.S. Treasury securities that would be published by the Federal Reserve Bank of New York in cooperation with the OFR (see Key Benchmarks for Alternative Rates).
The Alternative Reference Rates Committee selected the Secured Overnight Financing Rate in June 2017 as its preferred alternative to U.S. dollar LIBOR.
The new benchmarks would be more reliable and viable than LIBOR because they are based on actual secured trans-actions, rather than quotes, and would bring necessary transparency to the repo market.
Key Benchmarks for Alternative Rates
Triparty General Collateral Rate
This rate would be calculated based on overnight repur-chase agreement (repo) transactions against Treasury securities in the triparty repo market. The market is called triparty because each transaction between a secu-rity seller and buyer also involves a clearing bank. The Federal Reserve Bank of New York collects data about repo transactions from the two clearing banks in this market.
Broad General Collateral Rate
This rate would be a broader benchmark based on trades in triparty repo and the general collateral financ-ing (GCF) overnight repo market. Trades in the GCF repo market are made against a pool of general collateral rather than a specific security. The market is run by the Fixed Income Clearing Corporation (FICC), which acts as a central counterparty. To calculate daily rates, data will be obtained about interest rates and the value of funds borrowed in GCF repo.
Secured Overnight Financing Rate
This rate would be the broadest measure of the repo-based rates. It covers the two markets included in the broad general collateral rate, plus centrally cleared bilat-eral repo transactions. Bilateral transactions are arranged and settled between borrower and lender. Bilateral repo transactions generally fall into two categories: (1) trades cleared through FICC’s service, and (2) uncleared trades completed without a third party. Because not much data about uncleared bilateral trades is available, this benchmark would be calculated with data about interest rates and the value of funds borrowed in trades cleared through the FICC service.
Key Findings from Research and Analysis 29
The OFR plans to establish an ongo-ing data collection covering some repo transactions. Some of these data might be useful in calculating these rates. This work builds on the OFR’s 2015 pilot proj-ect conducted with the Federal Reserve and the SEC to collect data on bilateral repo transactions.
The OFR is uniquely
situated to collect data
across multiple markets
that may lie beyond the
reach of other regulators.
We expect to begin with cleared trades so the data can support calculation of the Secured Overnight Financing Rate. Currently, data to support that rate are provided on a voluntary basis — not suitable for establishing a rate on which potentially trillions of dollars in contracts are based.
Selection of the preferred LIBOR alter-native is only a first step. The transition period brings risks. New benchmarks will require broad market acceptance. For example, to achieve a smooth transition, officials and market participants must help develop active derivatives markets that use the new rate. Market partici-pants say substantial time might pass before all types of financial contracts now using LIBOR make the transition to a new benchmark rate. Even then, some existing contracts do not specifically allow an alternative reference rate to be selected, so amending their terms could be difficult. In some cases, amending a financial contract may require the agree-ment of all bondholders.
Legal Entity Identifier
The global LEI system is a cornerstone for financial data standards that bene-fits industry and government. Like a bar code for precisely identifying parties to financial transactions, the LEI helps make the vast amounts of data in the financial system more comparable. The LEI can generate efficiencies for financial compa-nies in internal reporting and in collect-ing, cleaning, and aggregating data.
The LEI can ease companies’ regulatory reporting burdens by reducing overlap and duplication. Many financial firms report data to more than one govern-ment regulator, and different regulators have different reporting requirements and data identifiers. This lack of unifor-mity can lead to inefficient, costly, and overlapping requirements for reporting and data management that create costs for industry. Estimated costs for industry of managing data without common stan-dards run into the billions of dollars.
The OFR’s goal is adoption
of the LEI broad enough to
serve the needs of the OFR,
the FSOC, and FSOC member
agencies to conduct financial
stability monitoring and
analysis. To achieve such a
network effect, private firms
must voluntarily adopt the LEI.
30 2017 | OFR Annual Report to Congress
When broadly adopted,
the LEI will drive
efficiency and gains in
data quality for industry
and government.
Because of these problems, industry groups have called on regulators to broadly adopt the LEI. The same case can be made for adopting other uniform standards for regulatory reporting, espe-cially about common metrics for instru-ments and accounting.
Organizations reap substantial direct benefits from adopting the LEI, includ-ing reductions in manual processes to check identifiers, efficiency gains when integrating data sources, and improve-ments in data quality. These benefits can save man-hours and reduce costs. Broad adoption of LEIs for client onboarding and client documentation could produce operational efficiencies for individ-ual banks and clients as well as entire markets.
The LEI can also help industry, regula-tors, and policymakers trace exposures and connections across the financial system. If the LEI system had been in place during the financial crisis, the breadth and depth of exposures to the failing Lehman Brothers would have been easier to assess and potentially manage.
The OFR led the design and deployment of the global LEI system. The system is now complete, with a three-tier gover-nance structure, more than 700,000 LEIs assigned, and reliance on the LEI in scores of regulations in the United States and abroad.
But full adoption of the LEI — necessary for the LEI to produce the most effi-ciencies for government and the private sector and to keep the system self- sustaining — has not yet happened. The OFR’s goal is adoption of the LEI broad enough to serve the needs of the OFR, the FSOC, and FSOC member agencies to conduct financial stability monitoring and analysis.
To achieve such a network effect, private firms must voluntarily adopt the LEI. Recent discussions and surveys show that mandating the LEI in appropriate cases also remains necessary.
At its February 2017 meeting, the OFR’s Financial Research Advisory Committee recommended that the OFR hold discus-sions with industry executives and government officials about the current and future benefits of the LEI, associated costs, and barriers to broader adop-tion. The committee also recommended that the OFR share the results of its inquiry with selected industry executives who could help identify practical ways to overcome the barriers. Finally, the committee suggested meetings between regulators, industry, and the OFR to further explore potential solutions.
Strategic regulatory
mandating of the LEI is
required, according to
industry advocates.
The OFR has determined that regulationrequiring use of the LEI (as opposed to making LEI use optional) are effec-tive and necessary to drive adoption. For example, the Markets in Financial
s
Key Findings from Research and Analysis 31
Instruments Regulation in Europe, set to take effect in January 2018, requires LEIs for all counterparties to all trades under a rule known as “no LEI, no trade.” This rule helped drive LEI adoption in Europe, and notable increases in LEI issu-ance have occurred in the run-up to the compliance deadline.
In Europe, regulators concluded that the benefits justified requiring the LEI in this way. In the United States, many market participants will not obtain an LEI unless it is mandated.
Our fact-gathering found that regula-tors are reluctant to mandate use of the LEI if they already have an identifier that serves the needs of their own reporting, even if they would benefit from increased interoperability of their data with data from other regulators.
Regulators also view the $75 cost of obtaining an LEI as a burden on smaller businesses without more compelling and direct benefits. Smaller organizations are often reluctant to obtain LEIs, claiming that LEI acquisition would be an additive regulatory burden without a clear, direct benefit. These organizations may not have data operations, do not appreciate the potential for productivity gains, do not appreciate the indirect benefits, or do not believe their organizations affect financial stability.
Although the cost of obtaining an LEI is low, the administrative costs of main-taining LEIs in internal systems can be a factor, especially systems with more complex data.
Larger firms have more hurdles to clear in changing their processes to obtain, maintain, and renew their LEIs. Firms with internal databases that rely on propri-etary identifiers also incur costs to map their databases to the LEI. However, some firms have already made infrastruc-ture investments and implemented data-base improvements to use LEIs.
The next step in the evolution of the LEI standard, the introduction of corporate hierarchy data (also known as level 2 data), can create challenges because of the complexity of many organizational structures. These data answer the ques-tion of “who owns whom” in the financial system and offer insights about the full risk exposures of large, complex financial entities.
Consistent with statements several years ago by the FSOC and G-20 (the Group of 20, a forum of finance ministers and heads of central banks from 19 countries and the European Union), the OFR has found that the LEI offers indirect bene-fits relating to market stability. Repeated confirmation of these benefits by govern-ment regulators remains critical to reach the number of adopters needed to make the system self-sustaining and achieve the network effects necessary to conduct dynamic and effective financial stability monitoring and analysis. So does the identification of quantifiable cost savings and efficiency gains, as cited by recent industry reports.
The OFR has determined that
regulations that require use
of the LEI are effective and
necessary to drive adoption.
32 2017 | OFR Annual Report to Congress
Substitutability means providing
important services that
customers would have difficulty
replacing if the bank failed.
Assessing Systemic Importance of Banks
What is the best way to determine the systemic importance of a U.S. bank? Many U.S. regulations categorize banks based on asset size. However, size alone does not fully capture the risks a bank may pose to financial stability.
A multifactor approach
that captures risk is
superior to using asset
size alone to determine
the systemic footprint of
U.S. banks.
OFR research supports an alternative approach that relies on multiple factors, not just asset size.
The Dodd-Frank Act created an asset-size threshold of $50 billion to identify banks to be subject to enhanced regula-tion. That threshold could subject some large U.S. banks with traditional busi-ness models to enhanced regulation that creates compliance costs unaligned with their risks. It could also exclude some U.S. operations of foreign banks.
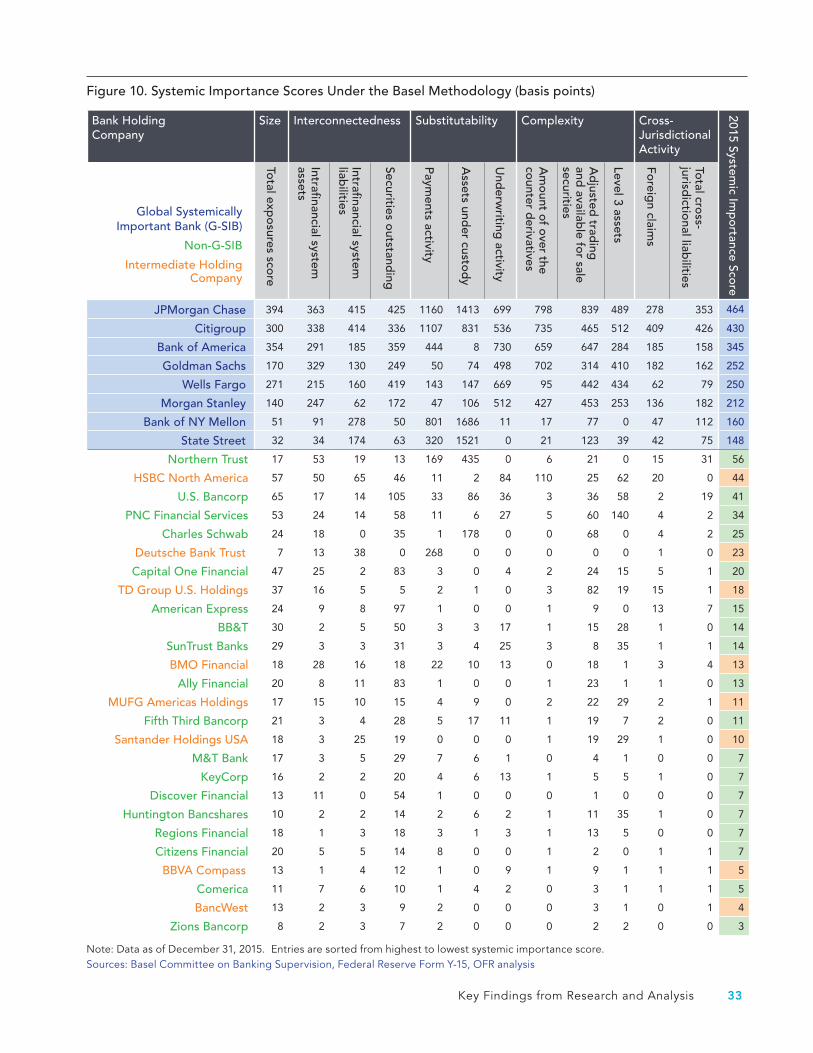
As of the end of 2015, a total of 34 U.S. banks each had more than $50 billion in assets. Eight of those are banks iden-tified as global systemically important banks (G-SIBs), banks whose distress or disorderly failure would cause significant disruption to the global financial system (see Figure 10).
A multifactor approach could replace the $50 billion asset-size threshold used in some U.S. bank regulations. A multifactor
approach would be similar to the approach used internationally to identify G-SIBs.
G-SIB identification is currently based on an evaluation of five factors: (1) size, (2) complexity, (3) interconnectedness to other financial companies, (4) foreign activities, and (5) lack of substitutabil-ity (providing important services that customers would have difficulty replac-ing if the bank failed).
For identifying systemically important U.S. banks, the G-SIB methodology could be extended and applied to iden-tify large U.S. banks that are not G-SIBs, but merit extra regulatory scrutiny.
For U.S. banks with
traditional business
models, an asset-size
threshold for determining
whether to apply
heightened regulatory
standards could create
misaligned regulatory
compliance costs.
The first improvement would be to better incorporate risks arising from a lack of substitutes, particularly for banks that provide payments, settlement, custody, and other unique services central to the functioning of financial markets.
The second improvement would better account for the complexity of some foreign banking organizations operating in the United States. The U.S. operations of foreign banks tend to be more active in U.S. capital markets and rely more on wholesale funding than comparably sized domestic banks.
Key Findings from Research and Analysis 33
Figure 10. Systemic Importance Scores Under the Basel Methodology (basis points)
Bank Holding Company
Size Interconnectedness Substitutability Complexity Cross-Jurisdictional Activity
2015 Systemic Im
po
rtance Score
Global Systemically Important Bank (G-SIB)
Non-G-SIB
Intermediate Holding Company
Total exp
osures sco
re
Intrafinancial system
assets
Intrafinancial system
liabilities
Securities outstand
ing
Payments activity
Assets und
er custod
y
Und
erwriting
activity
Am
ount of over the counter d
erivatives
Ad
justed trad
ing
and availab
le for sale
securities
Level 3 assets
Foreig
n claims
Total cro
ss-jurisd
ictional liab
ilities
JPMorgan Chase 394 363 415 425 1160 1413 699 798 839 489 278 353 464
Citigroup 300 338 414 336 1107 831 536 735 465 512 409 426 430
Bank of America 354 291 185 359 444 8 730 659 647 284 185 158 345
Goldman Sachs 170 329 130 249 50 74 498 702 314 410 182 162 252
Wells Fargo 271 215 160 419 143 147 669 95 442 434 62 79 250
Morgan Stanley 140 247 62 172 47 106 512 427 453 253 136 182 212
Bank of NY Mellon 51 91 278 50 801 1686 11 17 77 0 47 112 160
State Street 32 34 174 63 320 1521 0 21 123 39 42 75 148
Northern Trust 17 53 19 13 169 435 0 6 21 0 15 31 56
HSBC North America 57 50 65 46 11 2 84 110 25 62 20 0 44
U.S. Bancorp 65 17 14 105 33 86 36 3 36 58 2 19 41
PNC Financial Services 53 24 14 58 11 6 27 5 60 140 4 2 34
Charles Schwab 24 18 0 35 1 178 0 0 68 0 4 2 25
Deutsche Bank Trust 7 13 38 0 268 0 0 0 0 0 1 0 23
Capital One Financial 47 25 2 83 3 0 4 2 24 15 5 1 20
TD Group U.S. Holdings 37 16 5 5 2 1 0 3 82 19 15 1 18
American Express 24 9 8 97 1 0 0 1 9 0 13 7 15
BB&T 30 2 5 50 3 3 17 1 15 28 1 0 14
SunTrust Banks 29 3 3 31 3 4 25 3 8 35 1 1 14
BMO Financial 18 28 16 18 22 10 13 0 18 1 3 4 13
Ally Financial 20 8 11 83 1 0 0 1 23 1 1 0 13
MUFG Americas Holdings 17 15 10 15 4 9 0 2 22 29 2 1 11
Fifth Third Bancorp 21 3 4 28 5 17 11 1 19 7 2 0 11
Santander Holdings USA 18 3 25 19 0 0 0 1 19 29 1 0 10
M&T Bank 17 3 5 29 7 6 1 0 4 1 0 0 7
KeyCorp 16 2 2 20 4 6 13 1 5 5 1 0 7
Discover Financial 13 11 0 54 1 0 0 0 1 0 0 0 7
Huntington Bancshares 10 2 2 14 2 6 2 1 11 35 1 0 7
Regions Financial 18 1 3 18 3 1 3 1 13 5 0 0 7
Citizens Financial 20 5 5 14 8 0 0 1 2 0 1 1 7
BBVA Compass 13 1 4 12 1 0 9 1 9 1 1 1 5
Comerica 11 7 6 10 1 4 2 0 3 1 1 1 5
BancWest 13 2 3 9 2 0 0 0 3 1 0 1 4
Zions Bancorp 8 2 3 7 2 0 0 0 2 2 0 0 3
Note: Data as of December 31, 2015. Entries are sorted from highest to lowest systemic importance score.Sources: Basel Committee on Banking Supervision, Federal Reserve Form Y-15, OFR analysis
34 2017 | OFR Annual Report to Congress
During the financial crisis in 2007-09, stress on foreign banks spilled into the U.S. financial system and the U.S. opera-tions of some of these banks were large beneficiaries of Federal Reserve credit programs.
Financial Data Services Initiatives
The OFR has a statutory mandate to standardize the types and formats of financial data, expand the scope of data suitable for financial stability analysis, foster appropriate data sharing, and make data accessible while protecting data security.
Financial data services
initiatives could reduce
regulatory reporting
burdens.
One of the OFR’s challenges is to achieve this mandate while serving the needs of the FSOC, FSOC members, and other stakeholders. To meet this challenge, the OFR is considering financial data services initiatives the FSOC could adopt to streamline financial data purchasing, collection, integration, and access.
One potential financial data services initiative could offer one-stop shopping for detailed information — like an index or card catalog — about the data held by FSOC member agencies.
Another initiative would foster data sharing among FSOC member agencies by helping stakeholders apply standard formats to financial data and access
analytic tools and related code, while protecting data security.
Financial data services
initiatives could serve the
FSOC and its member
agencies by increasing
efficiency, facilitating
appropriate data sharing,
and reducing the indirect
and direct costs of
financial data acquisition.
A repository of metadata, the detailed descriptions of the data regulators collect, will enable linking of financial datasets. In collaboration with FSOC member agencies, the OFR maintains a limited version of this repository today, the Interagency Data Inventory.
A third financial data services initiative would expand on the current inventory by including richer detail on the descrip-tions of regulatory data collections, down to the granular data-element level.
This detail is analogous to the column headings and formats in a spreadsheet. The heading displays the column name and each cell in the column is in a certain format, such as text, number, currency, or percentage.
A metadata repository captures these types of descriptive details. By compar-ing the details in a catalog of metadata, we can address questions of duplica-tion, overlap, and inconsistencies among FSOC members’ datasets — an essential step toward reducing regulatory report-ing burdens.
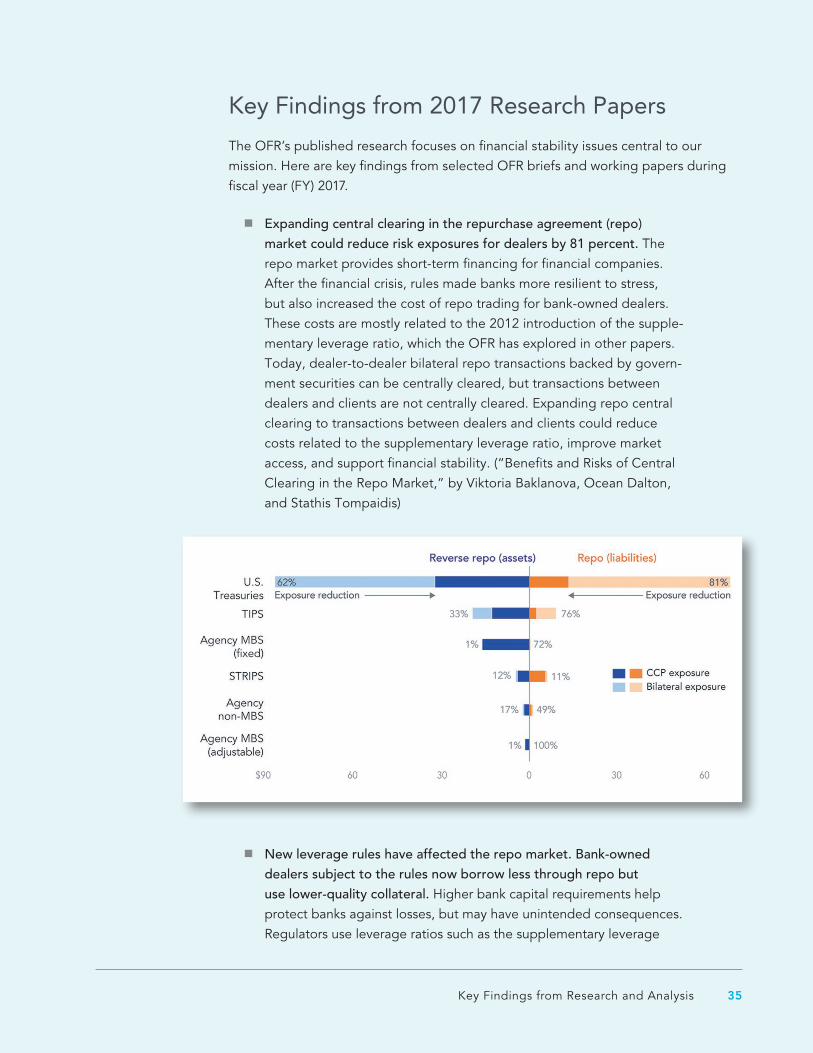
■ Expanding central clearing in the repurchase agreement (repo) market could reduce risk exposures for dealers by 81 percent. The repo market provides short-term financing for financial companies. After the financial crisis, rules made banks more resilient to stress, but also increased the cost of repo trading for bank-owned dealers. These costs are mostly related to the 2012 introduction of the supple-mentary leverage ratio, which the OFR has explored in other papers. Today, dealer-to-dealer bilateral repo transactions backed by govern-ment securities can be centrally cleared, but transactions between dealers and clients are not centrally cleared. Expanding repo central clearing to transactions between dealers and clients could reduce costs related to the supplementary leverage ratio, improve market access, and support financial stability. (“Benefits and Risks of Central Clearing in the Repo Market,” by Viktoria Baklanova, Ocean Dalton, and Stathis Tompaidis)
■ New leverage rules have affected the repo market. Bank-owned dealers subject to the rules now borrow less through repo but use lower-quality collateral. Higher bank capital requirements help protect banks against losses, but may have unintended consequences. Regulators use leverage ratios such as the supplementary leverage
Key Findings from 2017 Research Papers
The OFR’s published research focuses on financial stability issues central to our mission. Here are key findings from selected OFR briefs and working papers during fiscal year (FY) 2017.
Key Findings from Research and Analysis 35
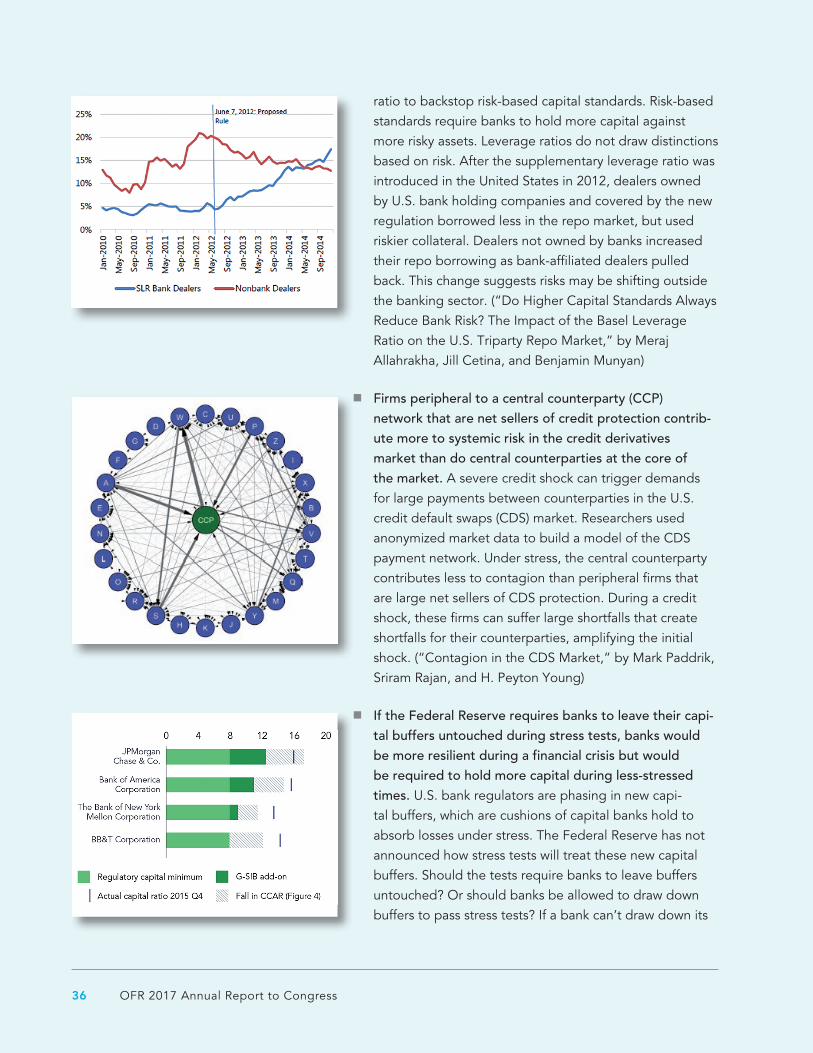
ratio to backstop risk-based capital standards. Risk-based standards require banks to hold more capital against more risky assets. Leverage ratios do not draw distinctions based on risk. After the supplementary leverage ratio was introduced in the United States in 2012, dealers owned by U.S. bank holding companies and covered by the new regulation borrowed less in the repo market, but used riskier collateral. Dealers not owned by banks increased their repo borrowing as bank-affiliated dealers pulled back. This change suggests risks may be shifting outside the banking sector. (“Do Higher Capital Standards Always Reduce Bank Risk? The Impact of the Basel Leverage Ratio on the U.S. Triparty Repo Market,” by Meraj Allahrakha, Jill Cetina, and Benjamin Munyan)
■ Firms peripheral to a central counterparty (CCP) network that are net sellers of credit protection contrib-ute more to systemic risk in the credit derivatives market than do central counterparties at the core of the market. A severe credit shock can trigger demands for large payments between counterparties in the U.S. credit default swaps (CDS) market. Researchers used anonymized market data to build a model of the CDS payment network. Under stress, the central counterparty contributes less to contagion than peripheral firms that are large net sellers of CDS protection. During a credit shock, these firms can suffer large shortfalls that create shortfalls for their counterparties, amplifying the initial shock. (“Contagion in the CDS Market,” by Mark Paddrik, Sriram Rajan, and H. Peyton Young)
■ If the Federal Reserve requires banks to leave their capi-tal buffers untouched during stress tests, banks would be more resilient during a financial crisis but would be required to hold more capital during less-stressed times. U.S. bank regulators are phasing in new capi-tal buffers, which are cushions of capital banks hold to absorb losses under stress. The Federal Reserve has not announced how stress tests will treat these new capital buffers. Should the tests require banks to leave buffers untouched? Or should banks be allowed to draw down buffers to pass stress tests? If a bank can’t draw down its
36 OFR 2017 Annual Report to Congress
Key Findings from Research and Analysis 37
buffer, the U.S. G-SIBs would have to hold more capital. Without the change, however, stress tests could affect less-systemic banks more than G-SIBs. (“Capital Buffers and the Future of Bank Stress Tests,” by Jill Cetina, Bert Loudis, and Charles Taylor)
■ Regulators could create systemwide stress tests of CCPs at minimal cost to companies by building on exist-ing stress test results at individual CCPs. A better U.S. systemwide stress test could be built to measure the strength of all CCPs based on existing stress tests by U.S. and European regulators. Models that combine existing data with statistical techniques and computer model-ing would broaden and deepen the tests. Regulators would get a clearer view of systemwide risks from banks that work through multiple CCPs. This approach would require regulators to collaborate in sharing and analyz-ing data. (“Measuring Systemwide Resilience of Central Counterparties,” by Stathis Tompaidis)
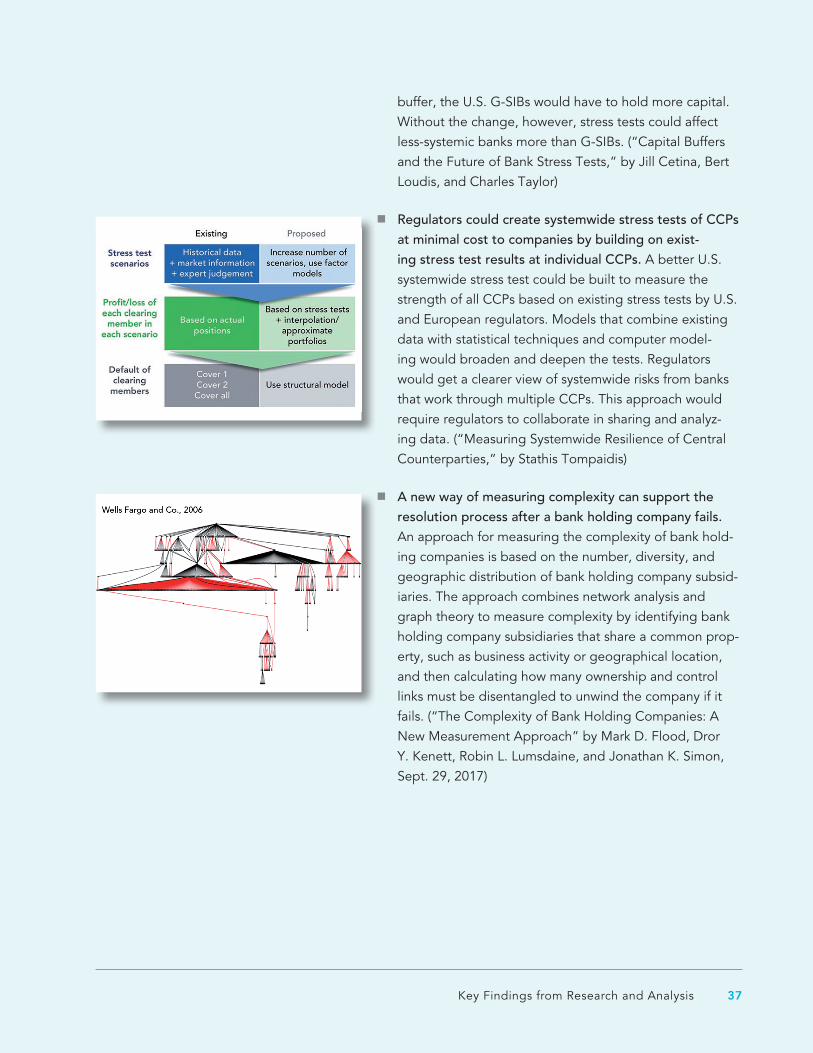
■ A new way of measuring complexity can support the resolution process after a bank holding company fails. An approach for measuring the complexity of bank hold-ing companies is based on the number, diversity, and geographic distribution of bank holding company subsid-iaries. The approach combines network analysis and graph theory to measure complexity by identifying bank holding company subsidiaries that share a common prop-erty, such as business activity or geographical location, and then calculating how many ownership and control links must be disentangled to unwind the company if it fails. (“The Complexity of Bank Holding Companies: A New Measurement Approach” by Mark D. Flood, Dror Y. Kenett, Robin L. Lumsdaine, and Jonathan K. Simon, Sept. 29, 2017)