Embed Size (px)
Citation preview

Key findings of the report
The Value of an Open Internet for India
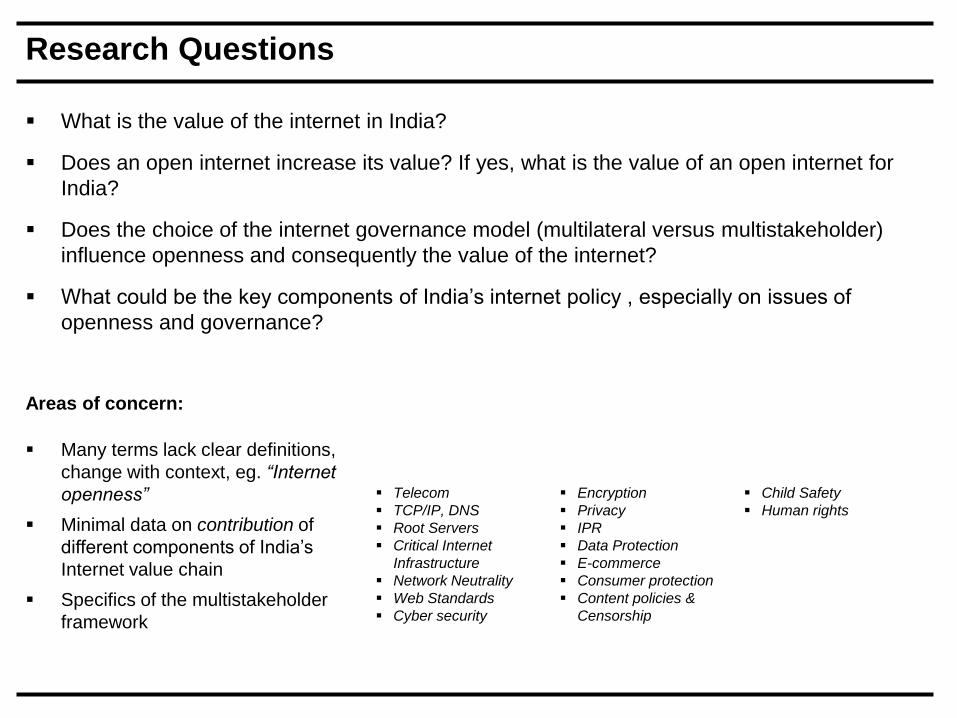
Research Questions
What is the value of the internet in India?
Does an open internet increase its value? If yes, what is the value of an open internet for
India?
Does the choice of the internet governance model (multilateral versus multistakeholder)
influence openness and consequently the value of the internet?
What could be the key components of India’s internet policy , especially on issues of
openness and governance?
Telecom
TCP/IP, DNS
Root Servers
Critical Internet
Infrastructure
Network Neutrality
Web Standards
Cyber security
Encryption
Privacy
IPR
Data Protection
E-commerce
Consumer protection
Content policies &
Censorship
Child Safety
Human rights
Areas of concern:
Many terms lack clear definitions,
change with context, eg. “Internet
openness”
Minimal data on contribution of
different components of India’s
Internet value chain
Specifics of the multistakeholder
framework
Discussion Structure
Methods and Estimates for the valuation of the Internet in India
Definitions for Openness and its impact on value
Governance Models
Part I:
Value of the Internet in India
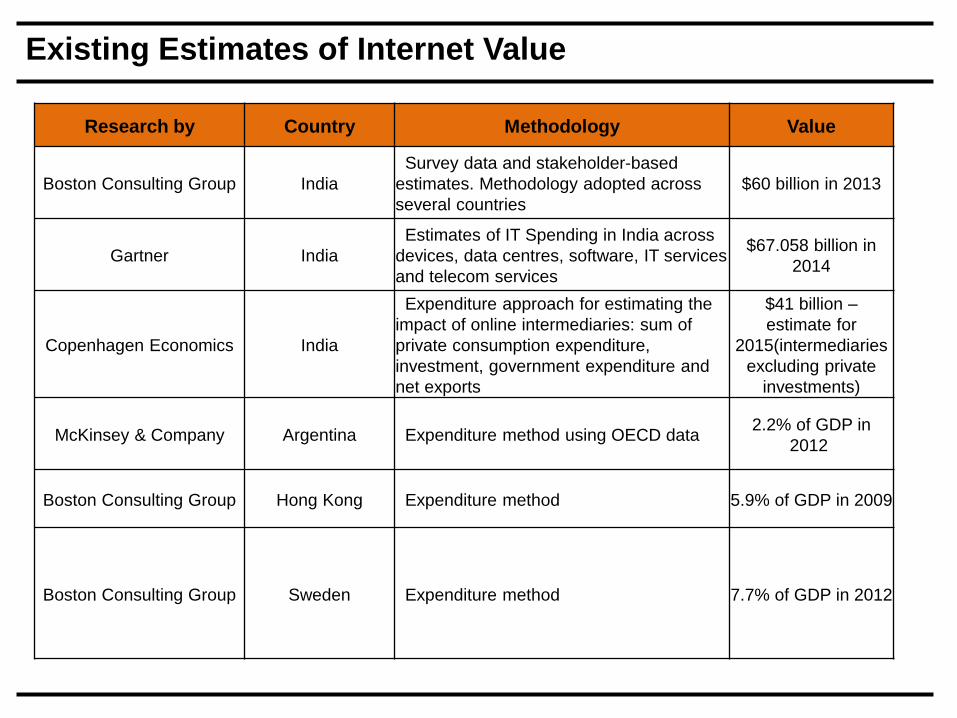
Existing Estimates of Internet Value
Research by Country Methodology Value
Boston Consulting Group India
Survey data and stakeholder-based
estimates. Methodology adopted across
several countries
$60 billion in 2013
Gartner India
Estimates of IT Spending in India across
devices, data centres, software, IT services
and telecom services
$67.058 billion in
2014
Copenhagen Economics India
Expenditure approach for estimating the
impact of online intermediaries: sum of
private consumption expenditure,
investment, government expenditure and
net exports
$41 billion –
estimate for
2015(intermediaries
excluding private
investments)
McKinsey & Company Argentina Expenditure method using OECD data2.2% of GDP in
2012
Boston Consulting Group Hong Kong Expenditure method 5.9% of GDP in 2009
Boston Consulting Group Sweden Expenditure method 7.7% of GDP in 2012
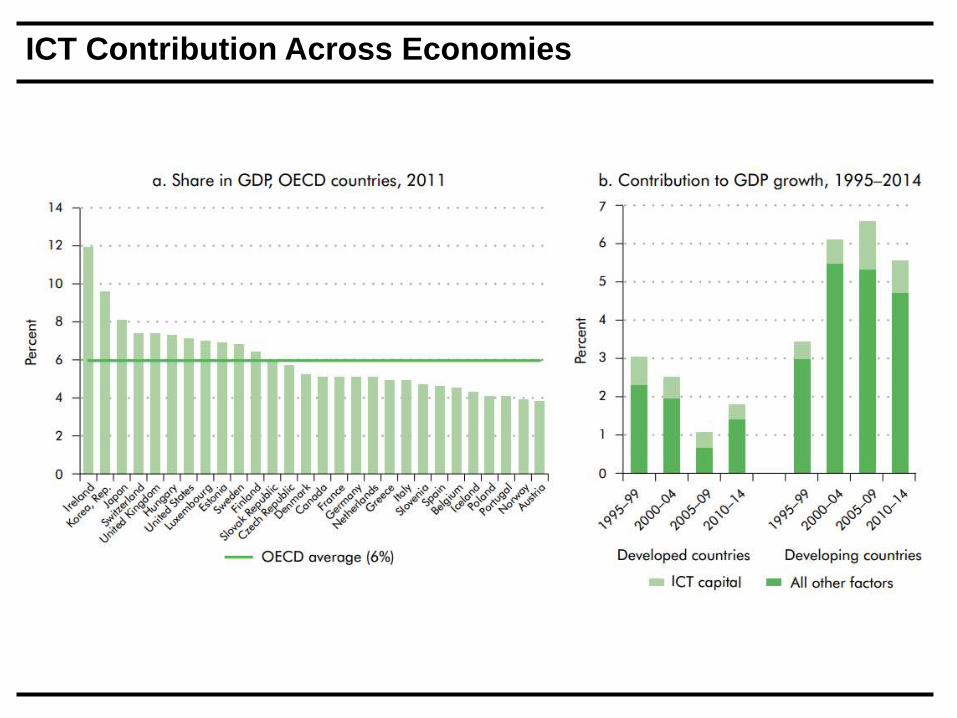
ICT Contribution Across Economies
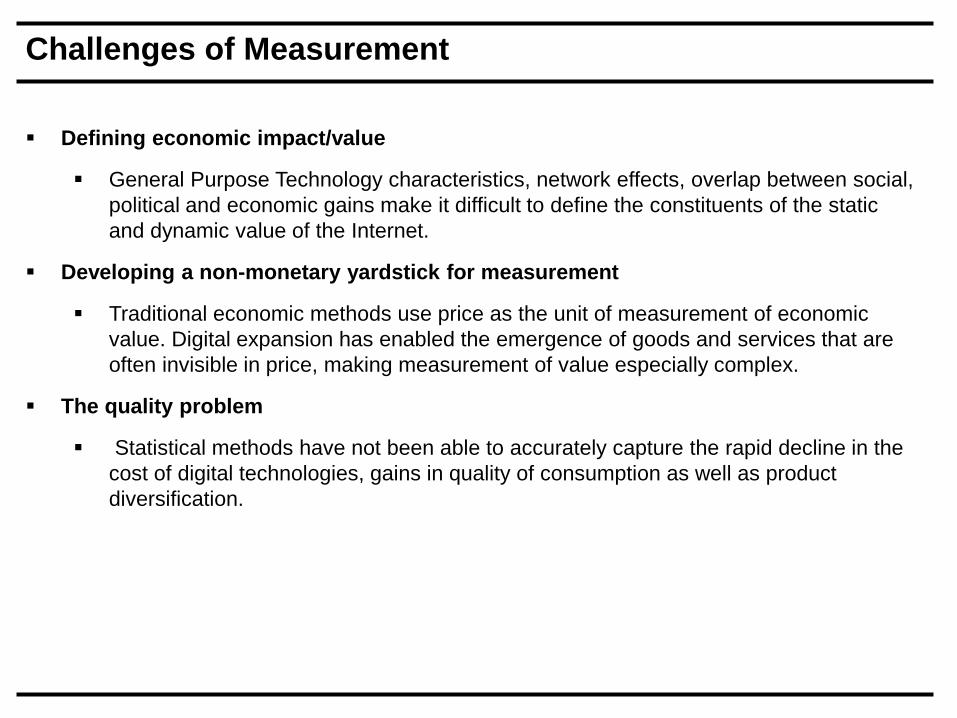
Challenges of Measurement
Defining economic impact/value
General Purpose Technology characteristics, network effects, overlap between social,
political and economic gains make it difficult to define the constituents of the static
and dynamic value of the Internet.
Developing a non-monetary yardstick for measurement
Traditional economic methods use price as the unit of measurement of economic
value. Digital expansion has enabled the emergence of goods and services that are
often invisible in price, making measurement of value especially complex.
The quality problem
Statistical methods have not been able to accurately capture the rapid decline in the
cost of digital technologies, gains in quality of consumption as well as product
diversification.
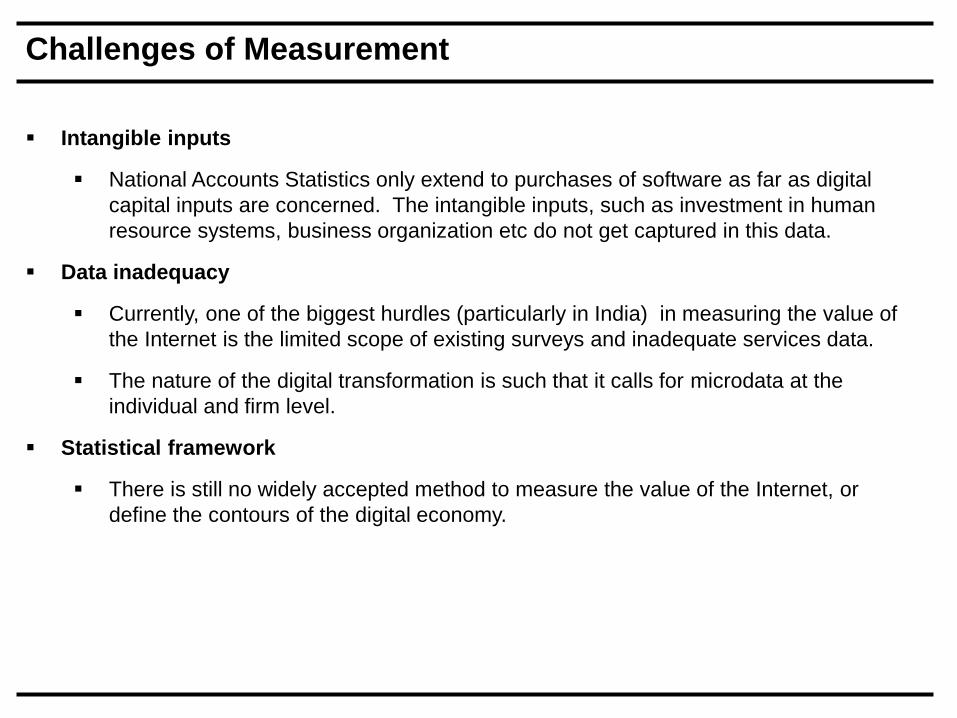
Challenges of Measurement
Intangible inputs
National Accounts Statistics only extend to purchases of software as far as digital
capital inputs are concerned. The intangible inputs, such as investment in human
resource systems, business organization etc do not get captured in this data.
Data inadequacy
Currently, one of the biggest hurdles (particularly in India) in measuring the value of
the Internet is the limited scope of existing surveys and inadequate services data.
The nature of the digital transformation is such that it calls for microdata at the
individual and firm level.
Statistical framework
There is still no widely accepted method to measure the value of the Internet, or
define the contours of the digital economy.
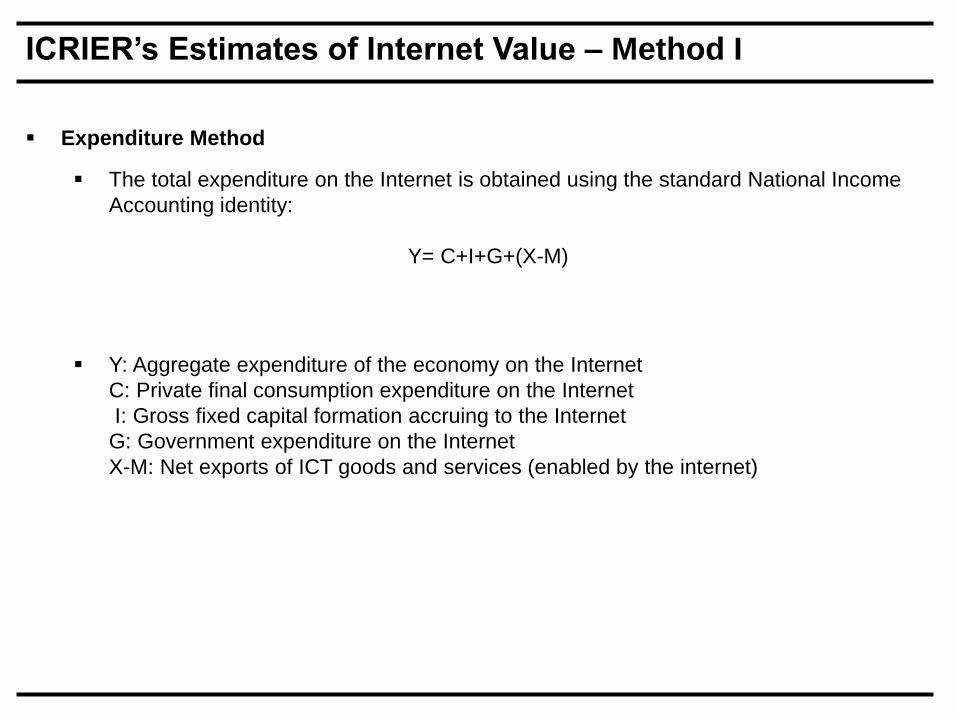
ICRIER’s Estimates of Internet Value – Method I
Expenditure Method
The total expenditure on the Internet is obtained using the standard National Income
Accounting identity:
Y= C+I+G+(X-M)
Y: Aggregate expenditure of the economy on the Internet
C: Private final consumption expenditure on the Internet
I: Gross fixed capital formation accruing to the Internet
G: Government expenditure on the Internet
X-M: Net exports of ICT goods and services (enabled by the internet)

Private Final Consumption Expenditure (PFCE)
We use “Household Consumption of Various Goods and Services in India”, 2011-12, 68th round, NSSO,
and the Reserve Bank of India Database on the Indian Economy (RBI-DBIE) to determine the PFCE
accruing to the Internet.
The PFCE on the Internet consists of four components:
Total household expenditure on mobile data
NSSO data records the total mobile phone charges incurred by households. Since only a part of
this accrues to data usage, we weigh this data by the average share of service provider revenue
accruing to data usage to estimate the total expenditure on mobile data (20% in 2011-12). The
average share of service provider revenue from data usage is based on data from TRAI.
Internet expenses
The annual expenditure of households on accessing the Internet is recorded in the NSSO data.
Mobile handset expenditure
The survey data records the total expenditure of households on mobile handsets. We weigh this
by the proportion of mobile subscribers using wireless internet to arrive at an estimate of mobile
handset expenditure accruing to the Internet (49% in 2011-12).
PC/Laptop expenditure
The annual household expenditure on PC/Laptops is obtained from the NSSO data. No robust
methodology was found to estimate the expenditure accruing only to the Internet.

Private Final Consumption Expenditure (PFCE)
Limitations of the NSSO survey on household expenditure:
Discrepancies between estimates of aggregate consumption expenditure obtained from the
survey data and from national account statistics.
Estimates obtained from national account statistics typically exceed those obtained from the
survey data.
Most commonly identified reason for this is underreporting of consumption by richer households
(concentrated in urban areas) in surveys.
Recognizing the risk of underestimation , instead of estimating the total consumption expenditure
of households on the internet, we use the survey data to measure the share of the total
household expenditure that is spent on obtaining access to the Internet. (0.78% for 2011-
12)
Estimating PFCE for the Internet:
We weigh the aggregate PFCE for the economy (obtained from RBI-DBIE) by the share of the
total household expenditure spent on obtaining access to the Internet (obtained from the NSSO
survey) to estimate the aggregate PFCE accruing to the Internet .
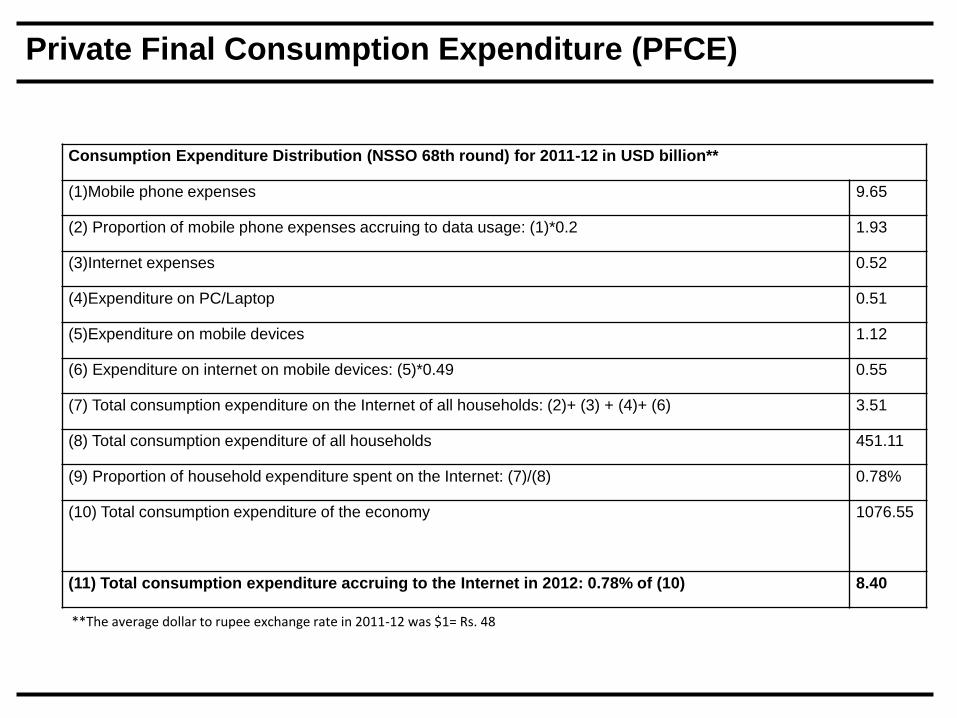
Private Final Consumption Expenditure (PFCE)
Consumption Expenditure Distribution (NSSO 68th round) for 2011-12 in USD billion**
(1)Mobile phone expenses 9.65
(2) Proportion of mobile phone expenses accruing to data usage: (1)*0.2 1.93
(3)Internet expenses 0.52
(4)Expenditure on PC/Laptop 0.51
(5)Expenditure on mobile devices 1.12
(6) Expenditure on internet on mobile devices: (5)*0.49 0.55
(7) Total consumption expenditure on the Internet of all households: (2)+ (3) + (4)+ (6) 3.51
(8) Total consumption expenditure of all households 451.11
(9) Proportion of household expenditure spent on the Internet: (7)/(8) 0.78%
(10) Total consumption expenditure of the economy 1076.55
(11) Total consumption expenditure accruing to the Internet in 2012: 0.78% of (10) 8.40
**The average dollar to rupee exchange rate in 2011-12 was $1= Rs. 48
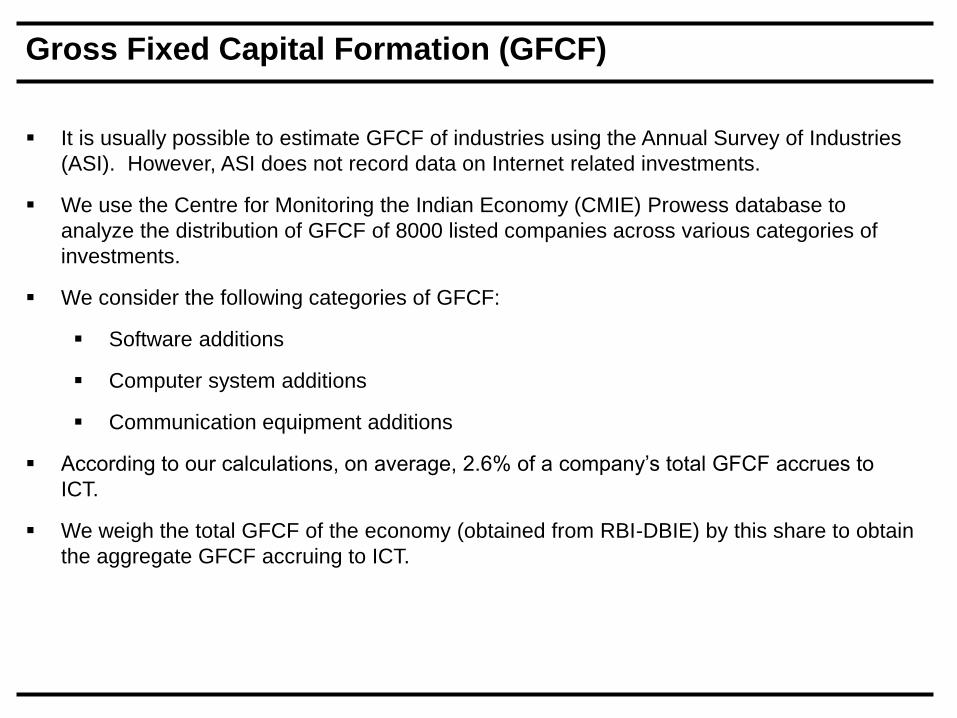
Gross Fixed Capital Formation (GFCF)
It is usually possible to estimate GFCF of industries using the Annual Survey of Industries
(ASI). However, ASI does not record data on Internet related investments.
We use the Centre for Monitoring the Indian Economy (CMIE) Prowess database to
analyze the distribution of GFCF of 8000 listed companies across various categories of
investments.
We consider the following categories of GFCF:
Software additions
Computer system additions
Communication equipment additions
According to our calculations, on average, 2.6% of a company’s total GFCF accrues to
ICT.
We weigh the total GFCF of the economy (obtained from RBI-DBIE) by this share to obtain
the aggregate GFCF accruing to ICT.

Gross Fixed Capital Formation (GFCF)
Gross Fixed Capital Formation (GFCF) in 2011-12 in USD billion**
(1) Total GFCF in the economy 619.01
(2) GFCF accruing to the Internet in 2011-12: 0.026*(1) 16.09
**The average dollar to rupee exchange rate in 2011-12 was $1= Rs. 48
Government Expenditure on IT
There is a dearth of publicly available data for government expenditure on IT, especially
the Internet
We use estimates from Gartner’s report “Enterprise IT Spending for the Government and
Education Markets, Worldwide” for government expenditure on IT.
Gartner includes spending on internal services, software, IT services, data center, devices
and telecom services by both local and national governments.
The estimate for 2011-12 is $5.98 billion.
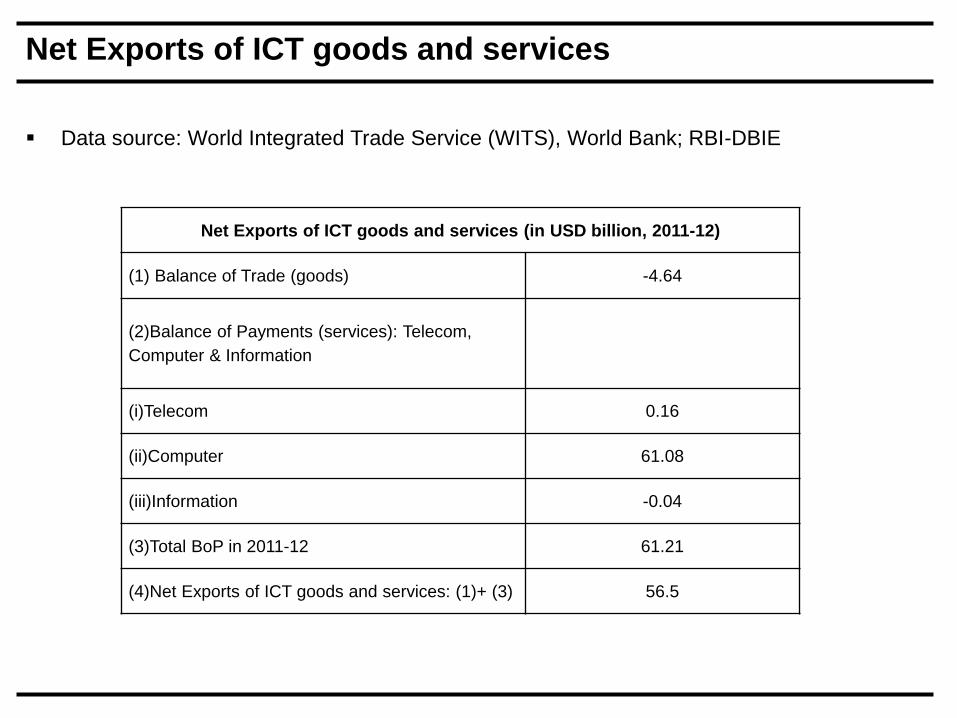
Net Exports of ICT goods and services
Data source: World Integrated Trade Service (WITS), World Bank; RBI-DBIE
Net Exports of ICT goods and services (in USD billion, 2011-12)
(1) Balance of Trade (goods) -4.64
(2)Balance of Payments (services): Telecom,
Computer & Information
(i)Telecom 0.16
(ii)Computer 61.08
(iii)Information -0.04
(3)Total BoP in 2011-12 61.21
(4)Net Exports of ICT goods and services: (1)+ (3) 56.5

Net Exports of ICT goods and services
Attributing the balance of payments in ICT goods and services entirely to the Internet
would lead to an overestimate.
There is a distinction between the ICT exports made possible through connectivity
(dedicated channels) and those made possible by the Internet. If the Internet were to shut
down, only a small part of the net exports would be affected.
Industry experts have suggested that approximately $10 billion of the total net exports of
ICT goods and services can be attributed to the Internet.
We have estimated the total expenditure on the Internet using both these estimates of net
exports to provide a range.

Total Expenditure on the Internet in India (2011-12)
Aggregate Expenditure on the Internet in 2011-12Upper Bound(USD
billion)Internet+ Connectivity
Lower Bound(USD
billion)Internet
(1)Private Final Consumption Expenditure 8.4 8.4
(2)Gross Fixed Capital formation 16.09 16.09
(3)Government Expenditure 5.98 5.98
(4)Net Exports 56.6 10
(5)Total expenditure on the Internet:
(1)+(2)+(3)+(4)87.07 40.47

ICRIER’s Estimates of Internet Value – Method II
We use a fixed effects instrumental variable regression to estimate the impact of the Internet for India . This is a sub-
national estimation using panel data regression. The data pertains to 19 states in India for the period 2001 to 2014
SGDPit = αo+ α1Kit + α2Lit + α3ISubit + εit
Kit is gross capital formation excluding investments in telecom in ith state in year t;
Litis the total number of persons engaged in telecom in state i for year t;
ISubitis the number of internet subscribers in the ithstate in year t;
SGDPitis per capita GDP for ith state in year t;
eit is the error term
We use a two period lead of the natural log of Internet Subscribers as an instrument for Internet
penetration

Results
Using state data from 2001-2014, the model estimates –
A 10% increase in rate of growth of Internet subscribers will result in a 2.4%
increase in rate of growth of state per capita income.
In terms of levels, the model implies that a 16% increase in the number of
internet subscribers in 2011-12 led to an increase in the GDP in that year by
$62.2 billion.
Difference in results of the two methods measures the spillover benefits of the
Internet-
(1)Expenditure Method (direct value)$40.5 billion (2.5% of nominal
GDP)
(2)Barro's Growth Model (direct and indirect
value)
$62.2 billion (3.8% of nominal
GDP)
(3)Spillovers: (2)-(1)$21.7 billion (1.3% of
nominal GDP)

Part II:
Openness

Understanding Openness
The Internet’s growth is often attributed in large part to its openness.
Many consider the characteristic fundamental – Since 2007, 7 IGFs have featured openness as a
primary theme
Economic benefits
Coupled with greater access –
“Permission-less innovation” / Light-touch regulation
Buyers and sellers can access international customer bases
Reduce transactions costs
Efficient firms can jump to GVCs
On the other hand, policies suppressing openness can create redundant requirements/costs
Incentivize large firms to reduce investments, prevent small firms from expanding
Lack of concrete, universal definition
Openness may then be technical, economic, political, legal, institutional…
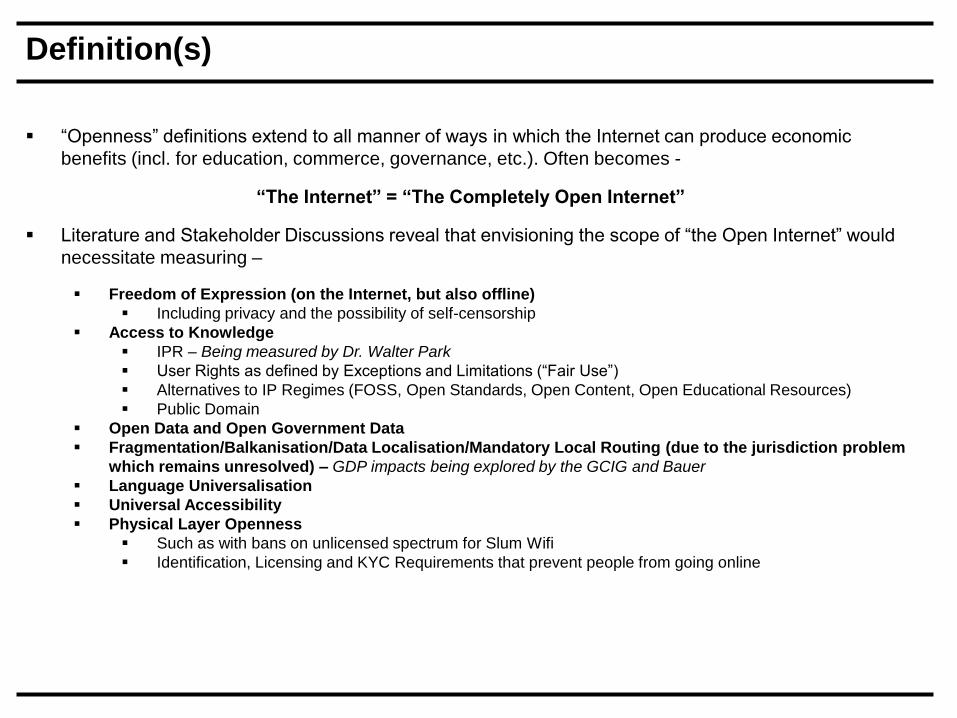
Definition(s)
“Openness” definitions extend to all manner of ways in which the Internet can produce economic
benefits (incl. for education, commerce, governance, etc.). Often becomes -
“The Internet” = “The Completely Open Internet”
Literature and Stakeholder Discussions reveal that envisioning the scope of “the Open Internet” would
necessitate measuring –
Freedom of Expression (on the Internet, but also offline)
Including privacy and the possibility of self-censorship
Access to Knowledge
IPR – Being measured by Dr. Walter Park
User Rights as defined by Exceptions and Limitations (“Fair Use”)
Alternatives to IP Regimes (FOSS, Open Standards, Open Content, Open Educational Resources)
Public Domain
Open Data and Open Government Data
Fragmentation/Balkanisation/Data Localisation/Mandatory Local Routing (due to the jurisdiction problem
which remains unresolved) – GDP impacts being explored by the GCIG and Bauer
Language Universalisation
Universal Accessibility
Physical Layer Openness
Such as with bans on unlicensed spectrum for Slum Wifi
Identification, Licensing and KYC Requirements that prevent people from going online

Definition(s)
Dalberg Internet Openness Framework

Definition(s)
OECD Internet Openness Framework

Definition(s)
An alternate policy exercise suggests measuring the costs of targeted, individual closed
policies – without attempting to define the entirety of the Internet’s form
Rob Atkinson at the ITIF lists some of these costs as possibly including –
Network Inefficiency
Limitations on Access to Information –
Costs in themselves but also
Reduce the perceived value of the Internet itself, disincentivise activity
Increased transactions costs
Reduced Possibilities for the use of Big Data (including by Governments)
Redundant Duplication Costs (eg. Hardware)
But these again become nebulous – consequently, attempting to put a number on the
exact value of “openness” or the total cost of “closedness” is nearly impossible
Made worse by a lack of data and dependence on counterfactual reasoning
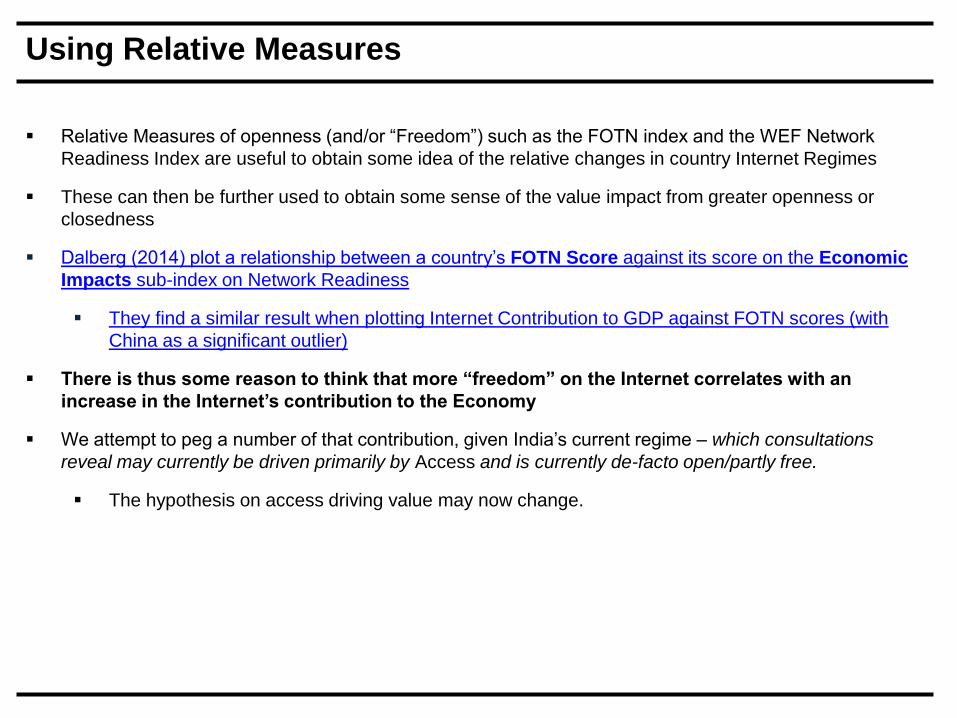
Using Relative Measures
Relative Measures of openness (and/or “Freedom”) such as the FOTN index and the WEF Network
Readiness Index are useful to obtain some idea of the relative changes in country Internet Regimes
These can then be further used to obtain some sense of the value impact from greater openness or
closedness
Dalberg (2014) plot a relationship between a country’s FOTN Score against its score on the Economic
Impacts sub-index on Network Readiness
They find a similar result when plotting Internet Contribution to GDP against FOTN scores (with
China as a significant outlier)
There is thus some reason to think that more “freedom” on the Internet correlates with an
increase in the Internet’s contribution to the Economy
We attempt to peg a number of that contribution, given India’s current regime – which consultations
reveal may currently be driven primarily by Access and is currently de-facto open/partly free.
The hypothesis on access driving value may now change.
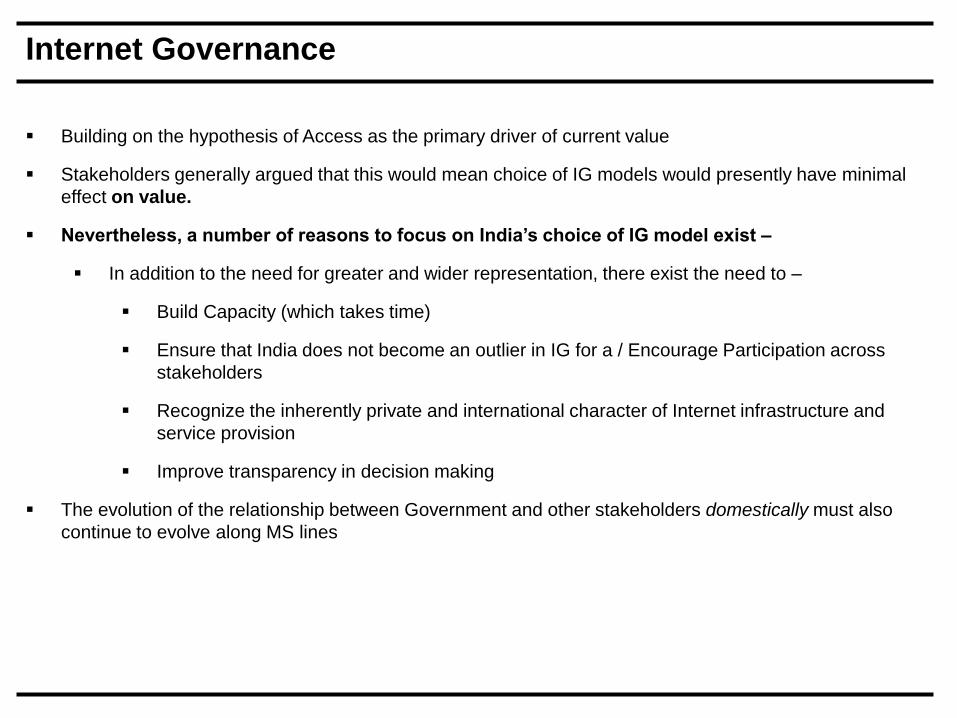
Internet Governance
Building on the hypothesis of Access as the primary driver of current value
Stakeholders generally argued that this would mean choice of IG models would presently have minimal
effect on value.
Nevertheless, a number of reasons to focus on India’s choice of IG model exist –
In addition to the need for greater and wider representation, there exist the need to –
Build Capacity (which takes time)
Ensure that India does not become an outlier in IG for a / Encourage Participation across
stakeholders
Recognize the inherently private and international character of Internet infrastructure and
service provision
Improve transparency in decision making
The evolution of the relationship between Government and other stakeholders domestically must also
continue to evolve along MS lines
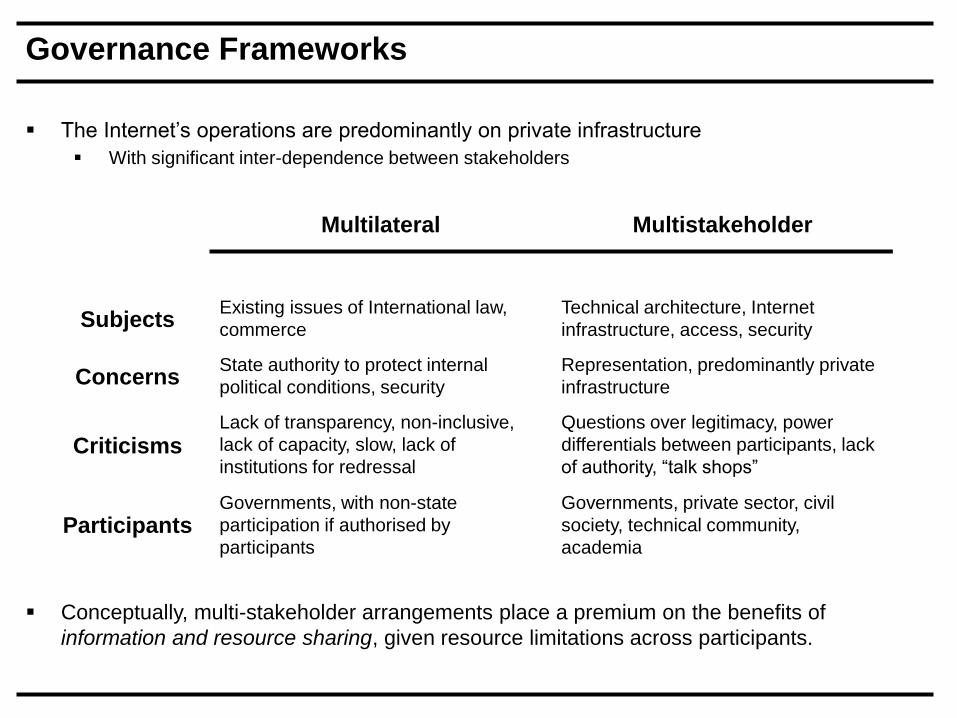
Governance Frameworks
The Internet’s operations are predominantly on private infrastructure
With significant inter-dependence between stakeholders
Conceptually, multi-stakeholder arrangements place a premium on the benefits of
information and resource sharing, given resource limitations across participants.
Multilateral Multistakeholder
SubjectsExisting issues of International law,
commerce
Technical architecture, Internet
infrastructure, access, security
ConcernsState authority to protect internal
political conditions, security
Representation, predominantly private
infrastructure
CriticismsLack of transparency, non-inclusive,
lack of capacity, slow, lack of
institutions for redressal
Questions over legitimacy, power
differentials between participants, lack
of authority, “talk shops”
ParticipantsGovernments, with non-state
participation if authorised by
participants
Governments, private sector, civil
society, technical community,
academia

Governance Frameworks (Domestic)
International IG Institutions are relatively easier to build up in a manner that allows non-
state participation – no supreme institution internationally
Domestically, this is not the case.
Top-down regulatory regimes beset by Transaction Costs
Need for reiterative regulation/Trial and Error
Information Asymmetry
Coordination Problems
The markers of inclusive, open and multistakeholder institutions include –
Robust consultative components within the decision making framework
Where access is a precondition for unlocking the value of Internet openness, ensuring
representation from underrepresented groups is essential
Local level fora for discussing IG
Capacity building
Government assistance for participation
Coordinating Umbrella Institutions – IIGF, Brazil’s CGI.br
Internet Governance and Openness
As a GPT, the Internet’s value is best unlocked when unconstrained by overregulation
Tempering factors include user safety, privacy, cybersecurity
Widening gap between number of ways Internet can be used / institutional capacity to
rapidly absorb changes and evolve balanced responses
As regulation lags behind innovation, institutions limited to a single perspective can find it difficult
to evolve regulatory regimes that are balanced / pro-growth
Other difficulty – implementation
Multistakeholder institutions better placed to address these
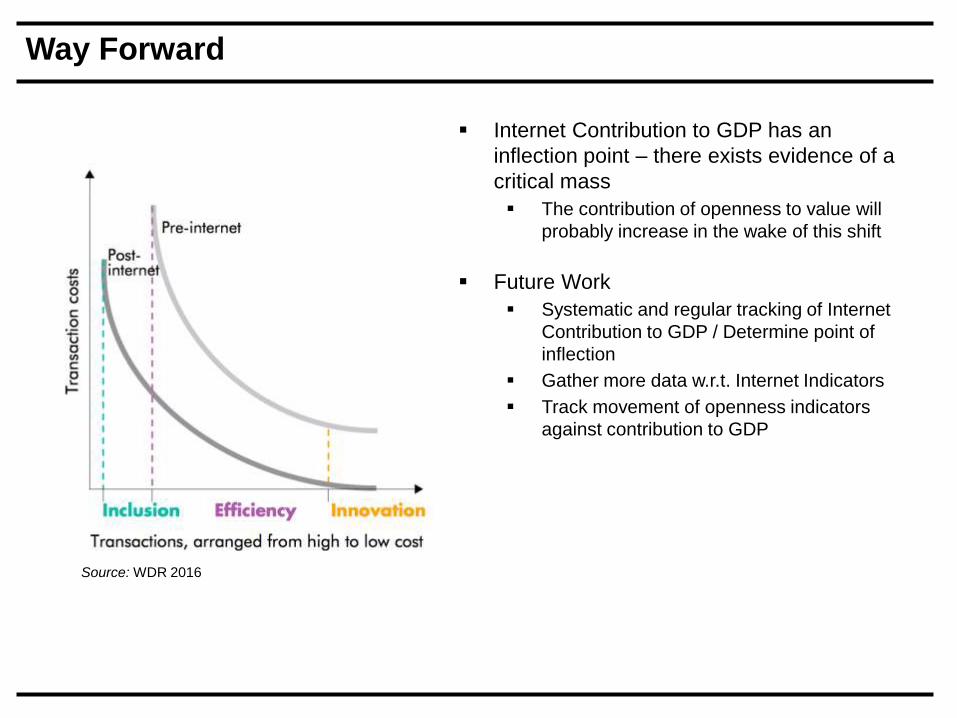
Way Forward
Source: WDR 2016
Internet Contribution to GDP has an
inflection point – there exists evidence of a
critical mass
The contribution of openness to value will
probably increase in the wake of this shift
Future Work
Systematic and regular tracking of Internet
Contribution to GDP / Determine point of
inflection
Gather more data w.r.t. Internet Indicators
Track movement of openness indicators
against contribution to GDP