Embed Size (px)
Citation preview
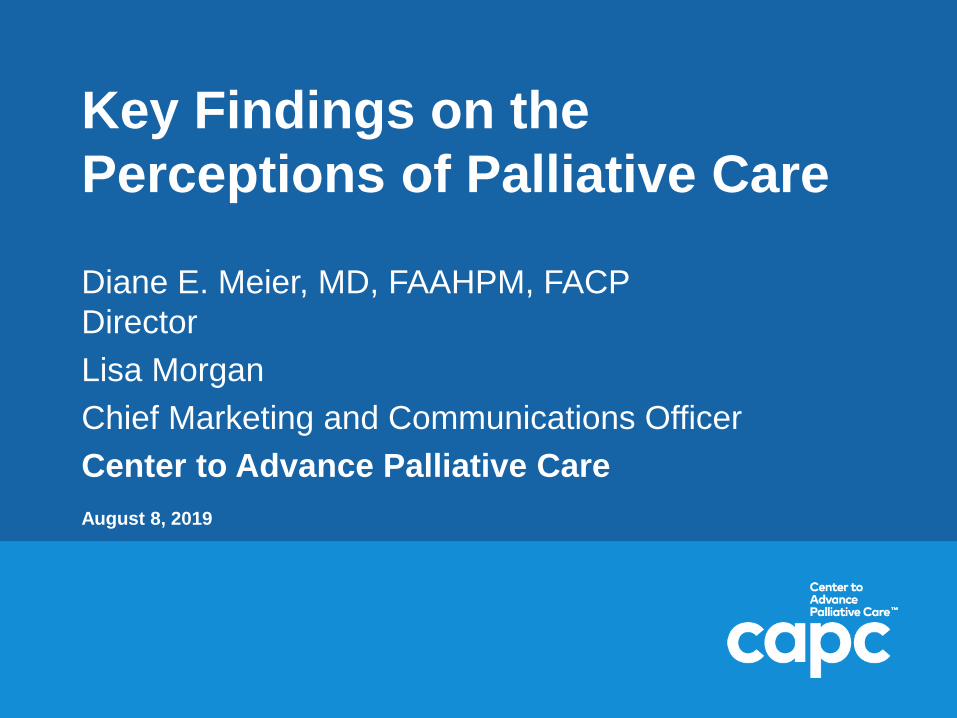
Key Findings on the
Perceptions of Palliative Care
Diane E. Meier, MD, FAAHPM, FACP
Director
Lisa Morgan
Chief Marketing and Communications Officer
Center to Advance Palliative Care
August 8, 2019
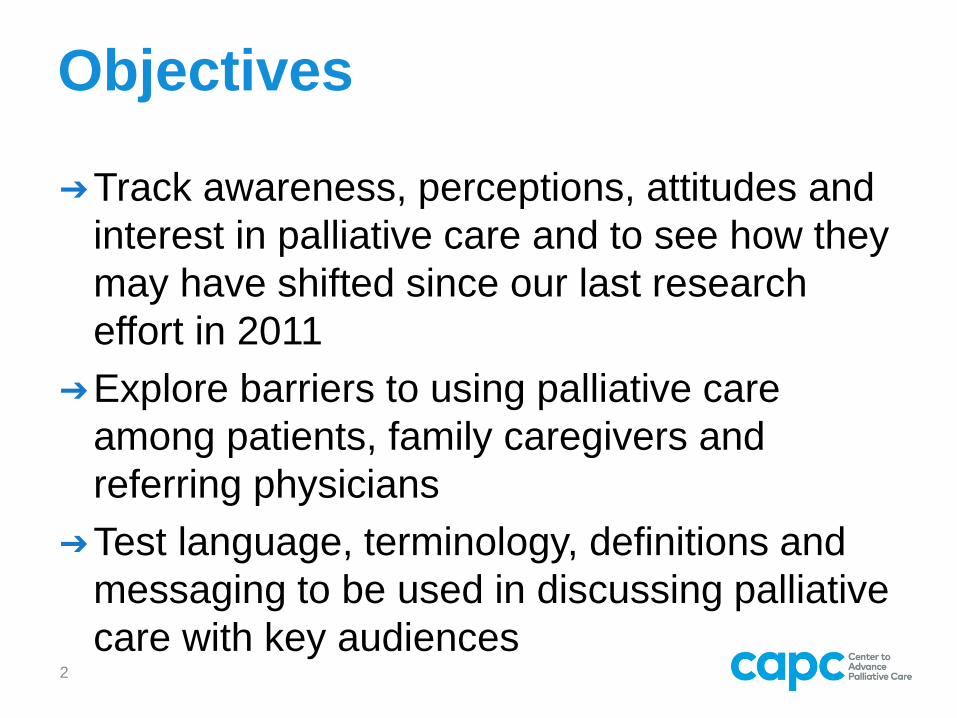
Objectives
➔Track awareness, perceptions, attitudes and
interest in palliative care and to see how they
may have shifted since our last research
effort in 2011
➔Explore barriers to using palliative care
among patients, family caregivers and
referring physicians
➔Test language, terminology, definitions and
messaging to be used in discussing palliative
care with key audiences2
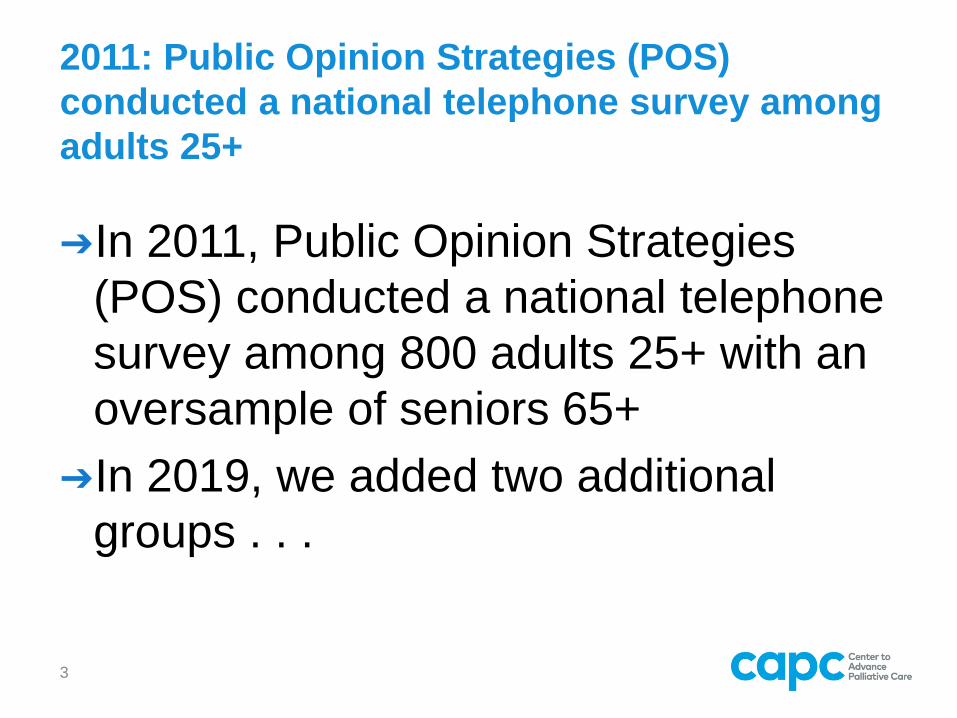
2011: Public Opinion Strategies (POS)
conducted a national telephone survey among
adults 25+
➔In 2011, Public Opinion Strategies
(POS) conducted a national telephone
survey among 800 adults 25+ with an
oversample of seniors 65+
➔In 2019, we added two additional
groups . . .
3
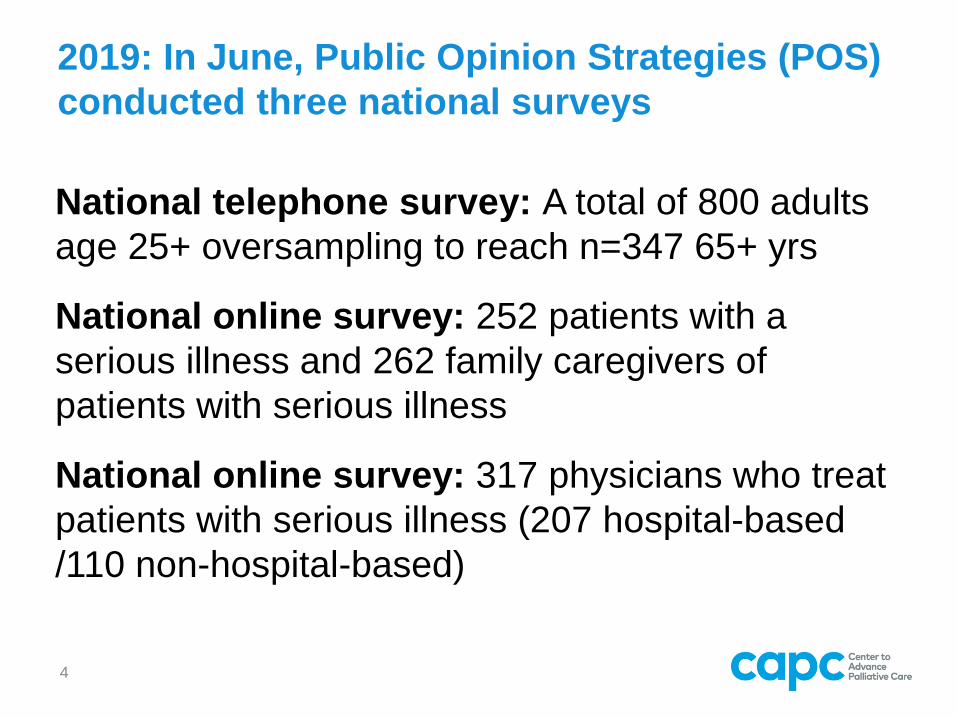
2019: In June, Public Opinion Strategies (POS)
conducted three national surveys
National telephone survey: A total of 800 adults
age 25+ oversampling to reach n=347 65+ yrs
National online survey: 252 patients with a
serious illness and 262 family caregivers of
patients with serious illness
National online survey: 317 physicians who treat
patients with serious illness (207 hospital-based
/110 non-hospital-based)
4
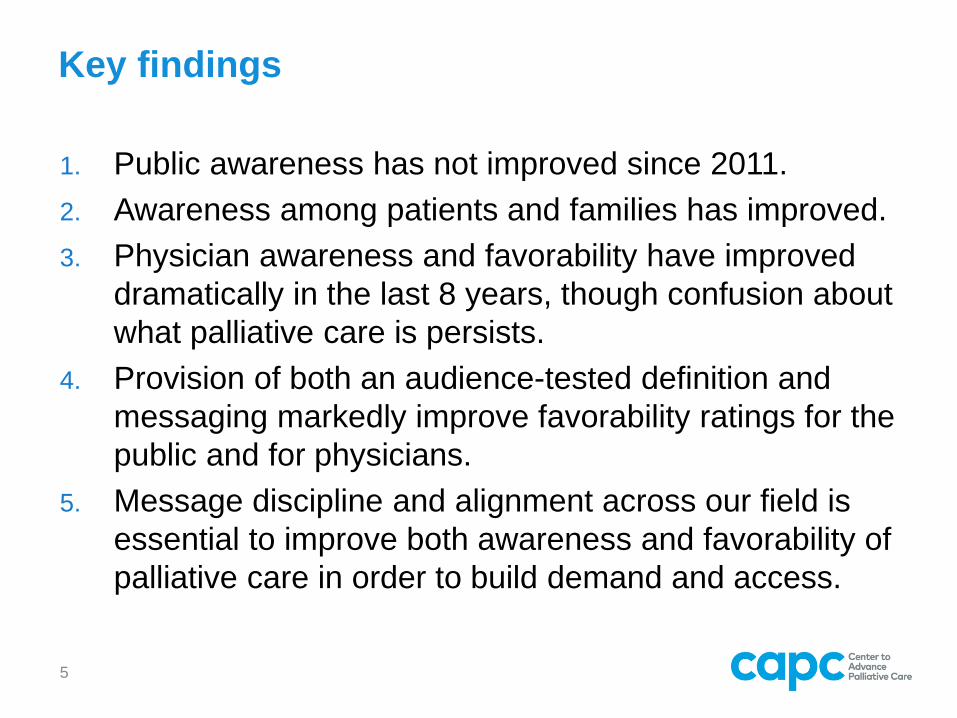
Key findings
1. Public awareness has not improved since 2011.
2. Awareness among patients and families has improved.
3. Physician awareness and favorability have improved
dramatically in the last 8 years, though confusion about
what palliative care is persists.
4. Provision of both an audience-tested definition and
messaging markedly improve favorability ratings for the
public and for physicians.
5. Message discipline and alignment across our field is
essential to improve both awareness and favorability of
palliative care in order to build demand and access.
5
KEY FINDINGS
Adult, Patient, Caregiver Populations
6
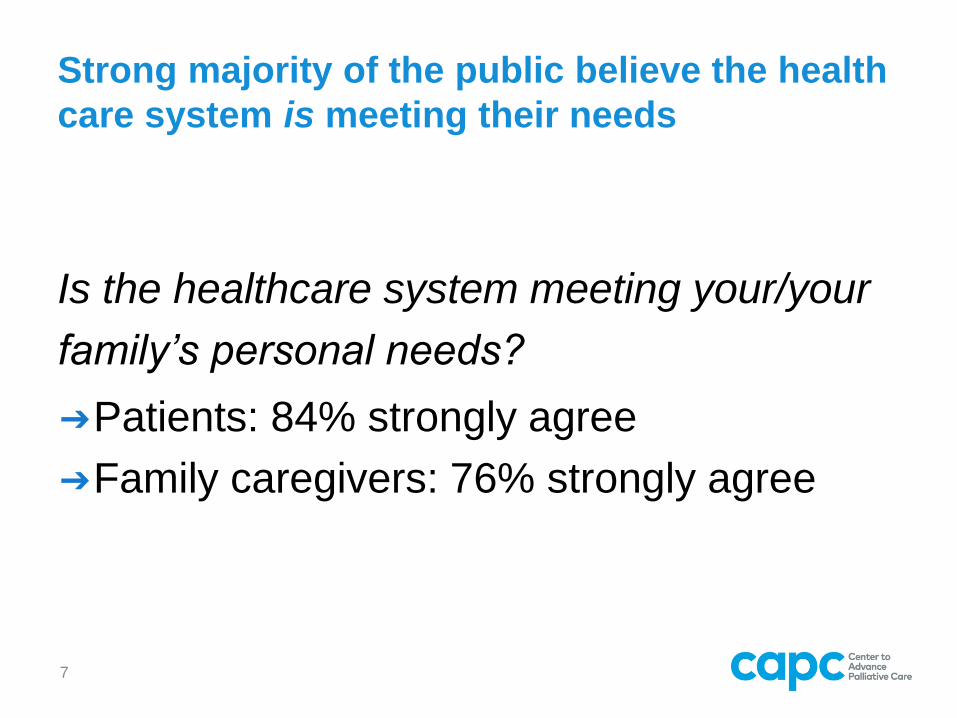
Strong majority of the public believe the health
care system is meeting their needs
Is the healthcare system meeting your/your
family’s personal needs?
➔Patients: 84% strongly agree
➔Family caregivers: 76% strongly agree
7
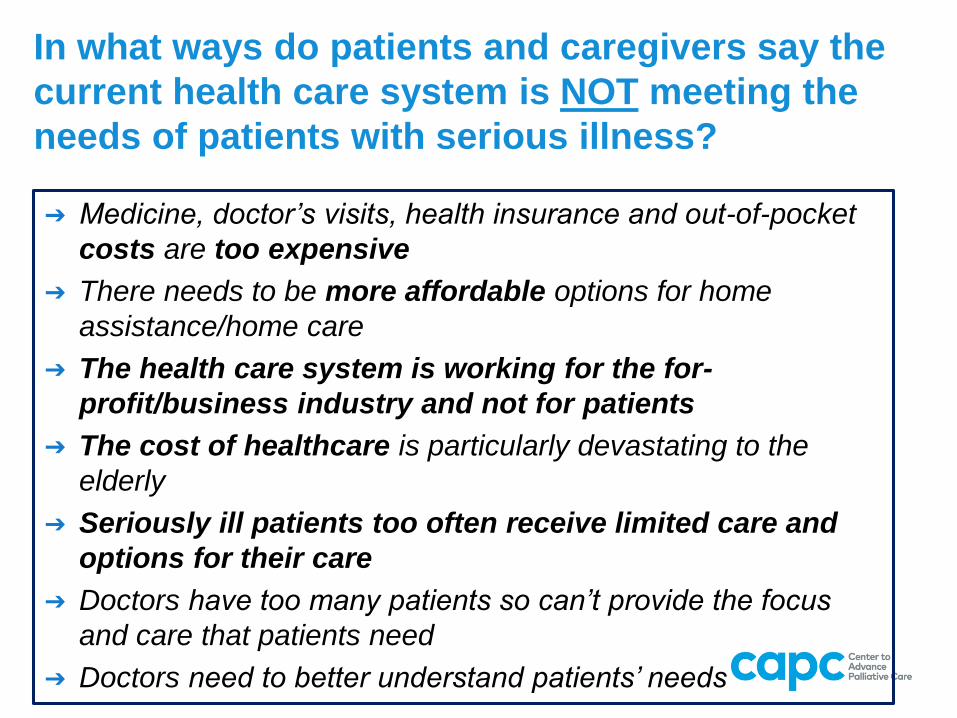
In what ways do patients and caregivers say the
current health care system is NOT meeting the
needs of patients with serious illness?
➔ Medicine, doctor’s visits, health insurance and out-of-pocket
costs are too expensive
➔ There needs to be more affordable options for home
assistance/home care
➔ The health care system is working for the for-
profit/business industry and not for patients
➔ The cost of healthcare is particularly devastating to the
elderly
➔ Seriously ill patients too often receive limited care and
options for their care
➔ Doctors have too many patients so can’t provide the focus
and care that patients need
➔ Doctors need to better understand patients’ needs
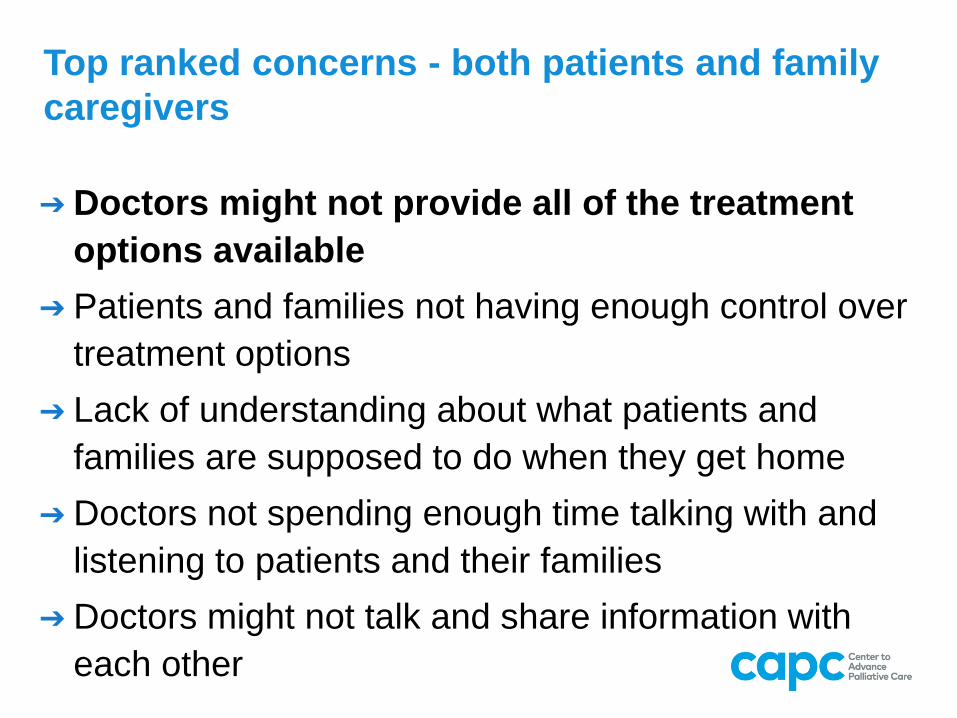
Top ranked concerns - both patients and family
caregivers
➔ Doctors might not provide all of the treatment
options available
➔ Patients and families not having enough control over
treatment options
➔ Lack of understanding about what patients and
families are supposed to do when they get home
➔ Doctors not spending enough time talking with and
listening to patients and their families
➔ Doctors might not talk and share information with
each other
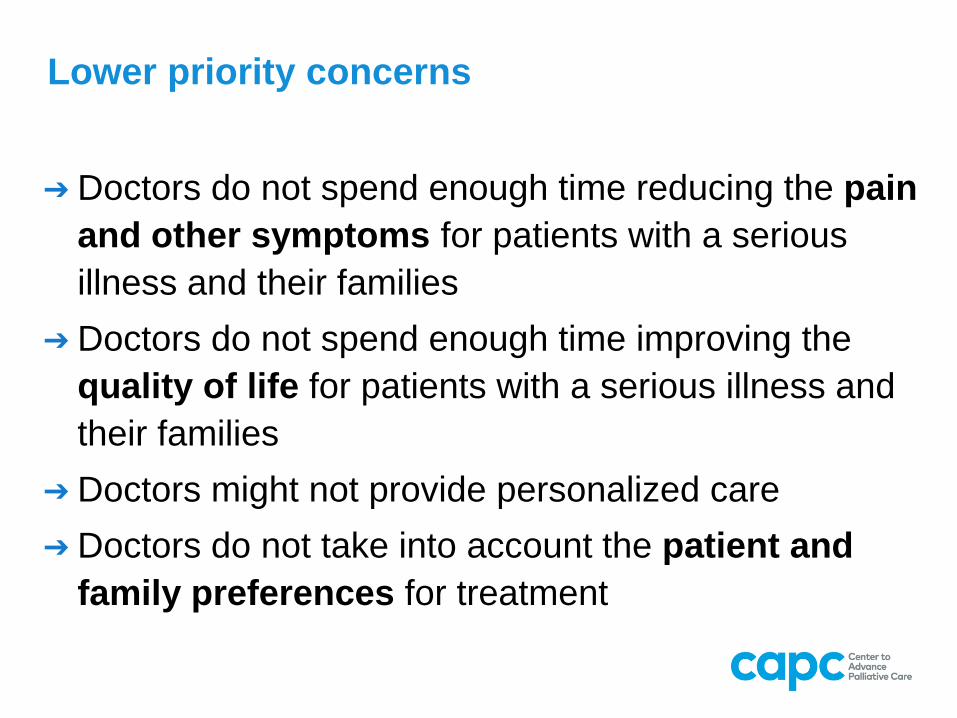
Lower priority concerns
➔ Doctors do not spend enough time reducing the pain
and other symptoms for patients with a serious
illness and their families
➔ Doctors do not spend enough time improving the
quality of life for patients with a serious illness and
their families
➔ Doctors might not provide personalized care
➔ Doctors do not take into account the patient and
family preferences for treatment
11
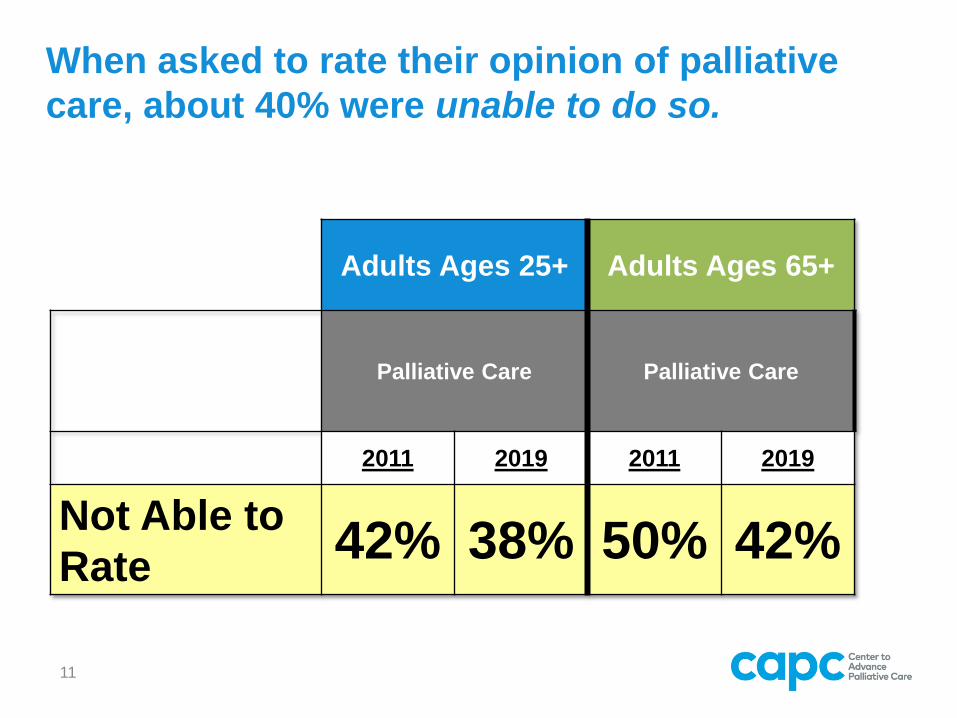
Adults Ages 25+ Adults Ages 65+
Palliative Care Palliative Care
2011 2019 2011 2019
Not Able to
Rate42% 38% 50% 42%
When asked to rate their opinion of palliative
care, about 40% were unable to do so.
12
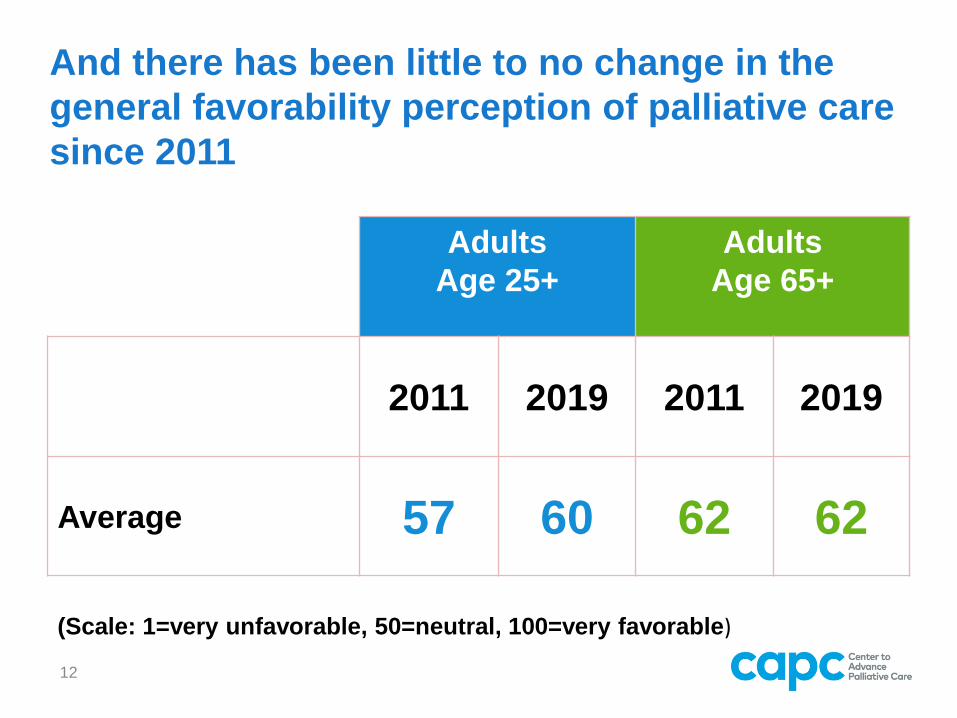
And there has been little to no change in the
general favorability perception of palliative care
since 2011
Adults
Age 25+
Adults
Age 65+
2011 2019 2011 2019
Average 57 60 62 62
(Scale: 1=very unfavorable, 50=neutral, 100=very favorable)
13
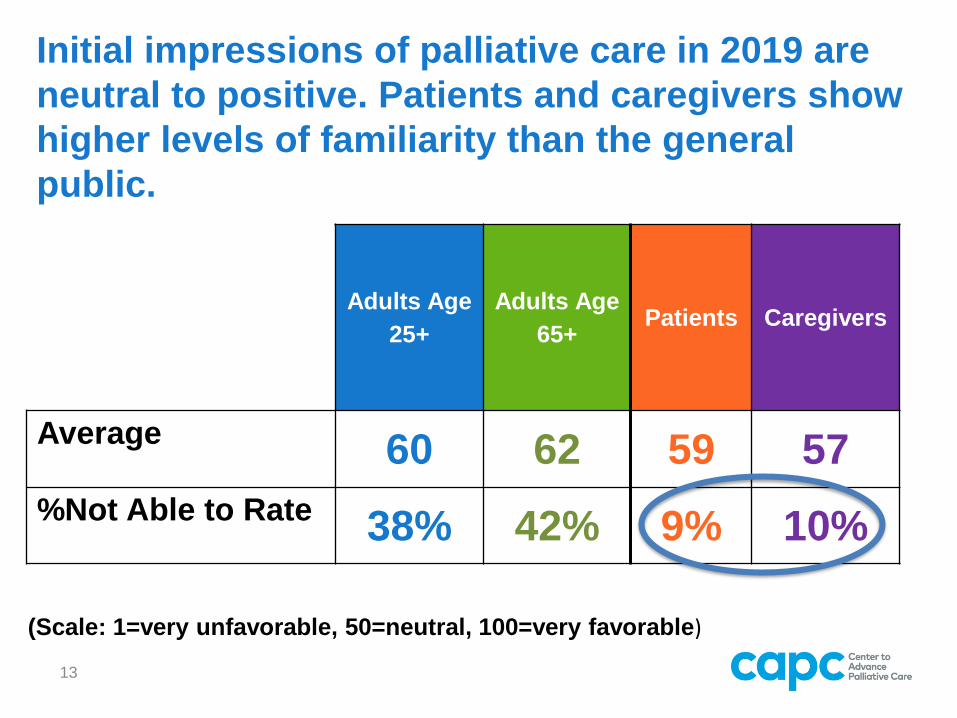
Initial impressions of palliative care in 2019 are
neutral to positive. Patients and caregivers show
higher levels of familiarity than the general
public.
Adults Age
25+
Adults Age
65+Patients Caregivers
Average 60 62 59 57
%Not Able to Rate 38% 42% 9% 10%
(Scale: 1=very unfavorable, 50=neutral, 100=very favorable)
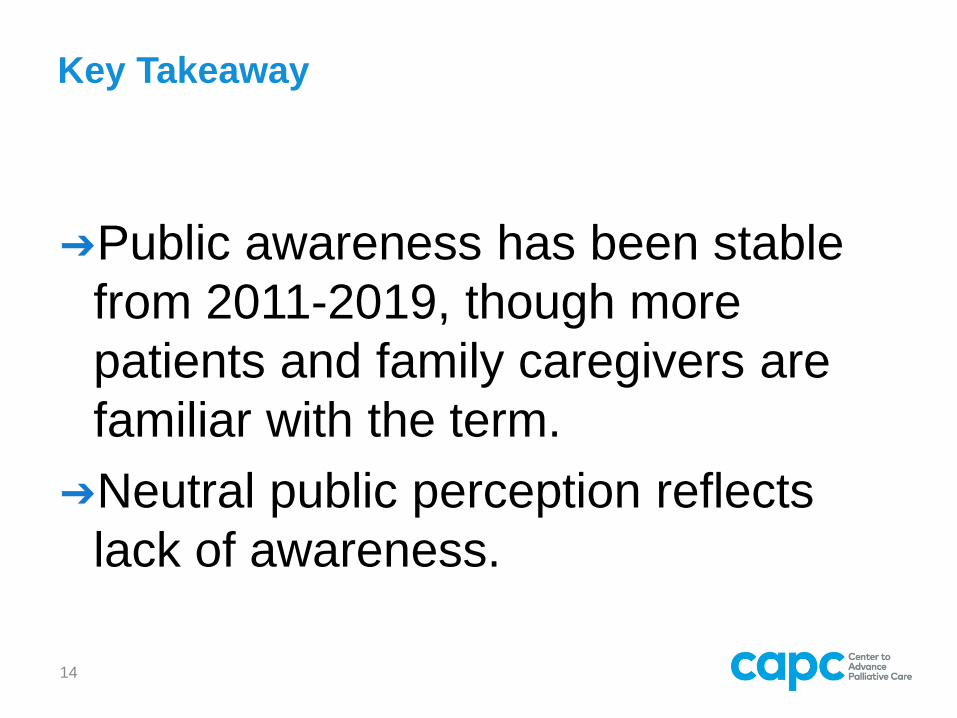
Key Takeaway
➔Public awareness has been stable
from 2011-2019, though more
patients and family caregivers are
familiar with the term.
➔Neutral public perception reflects
lack of awareness.
14
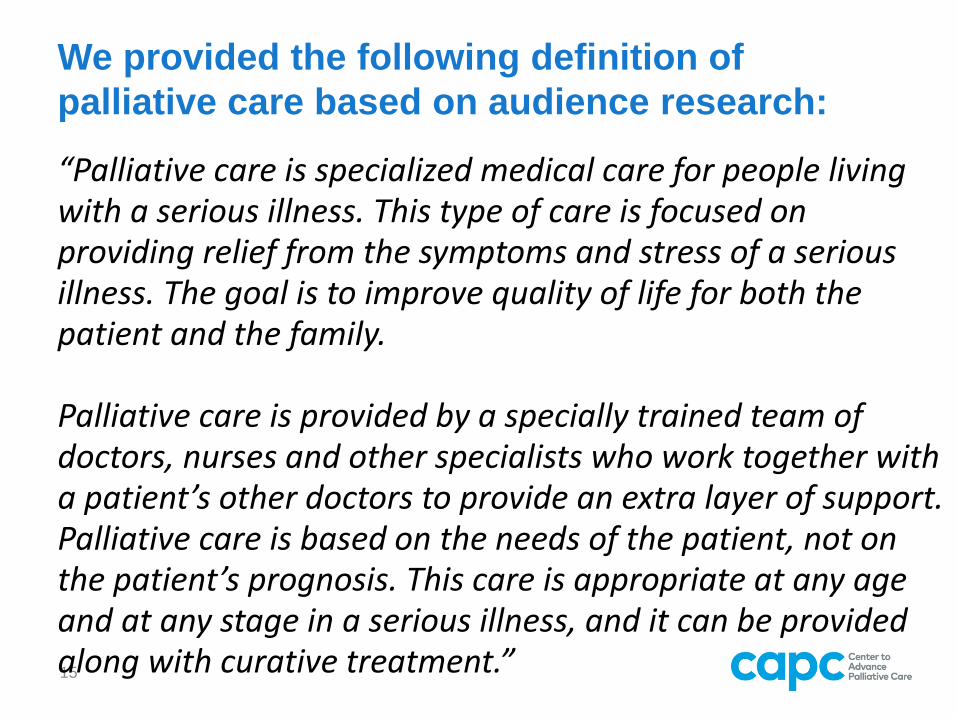
We provided the following definition of
palliative care based on audience research:
15
“Palliative care is specialized medical care for people living with a serious illness. This type of care is focused on providing relief from the symptoms and stress of a serious illness. The goal is to improve quality of life for both the patient and the family.
Palliative care is provided by a specially trained team of doctors, nurses and other specialists who work together with a patient’s other doctors to provide an extra layer of support. Palliative care is based on the needs of the patient, not on the patient’s prognosis. This care is appropriate at any age and at any stage in a serious illness, and it can be provided along with curative treatment.”
16
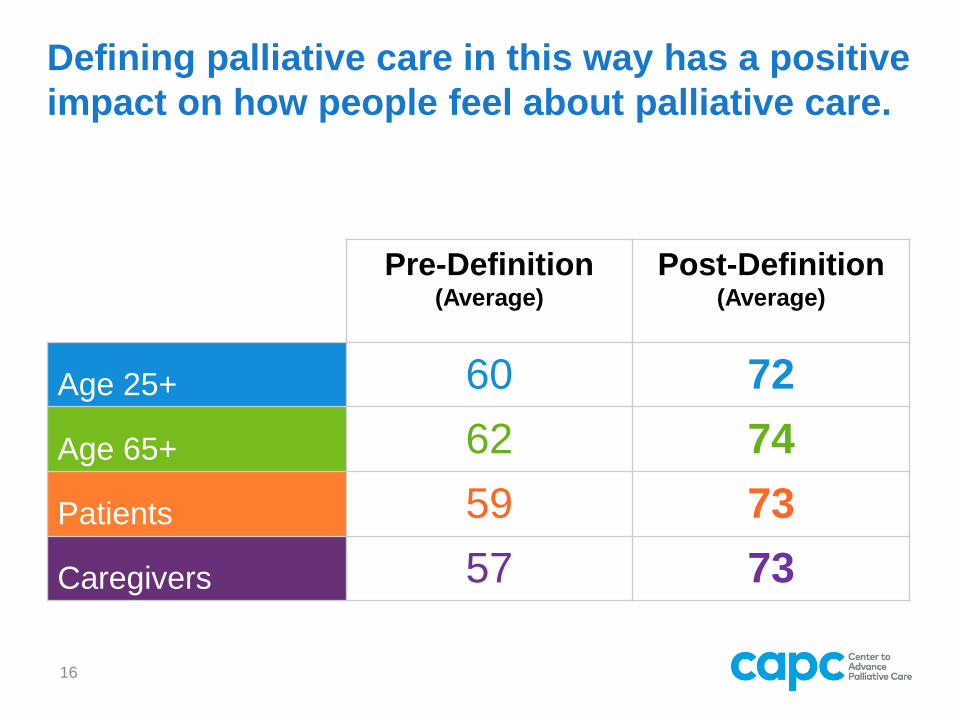
Defining palliative care in this way has a positive
impact on how people feel about palliative care.
Pre-Definition(Average)
Post-Definition(Average)
Age 25+ 60 72
Age 65+ 62 74
Patients 59 73
Caregivers 57 73
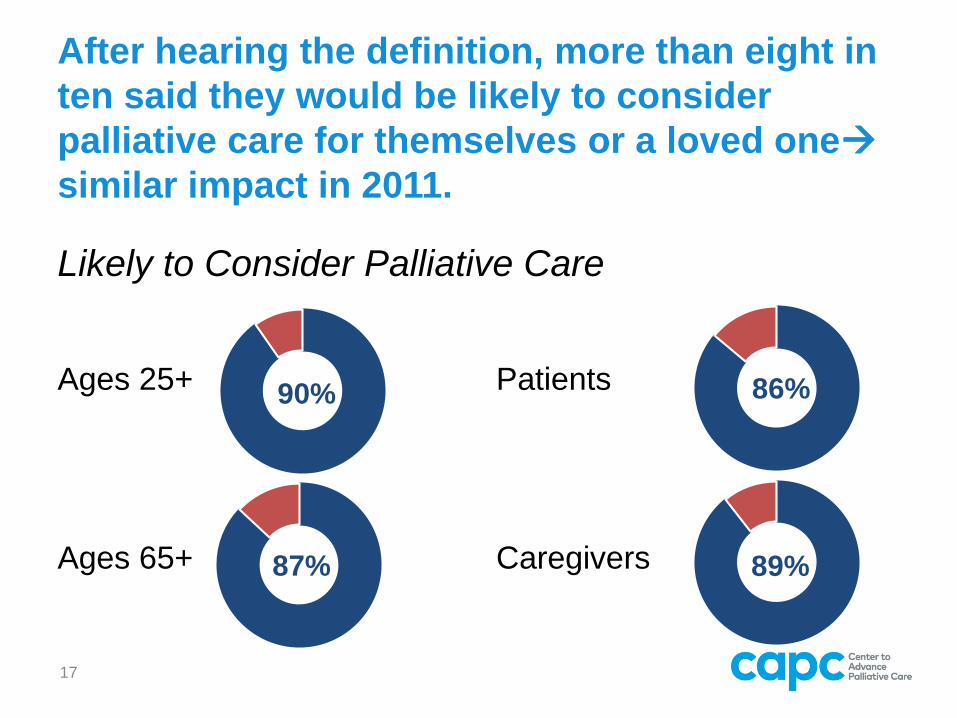
After hearing the definition, more than eight in
ten said they would be likely to consider
palliative care for themselves or a loved one
similar impact in 2011.
Likely to Consider Palliative Care
Ages 25+
Ages 65+
Patients
Caregivers
17
87%
90% 86%
89%
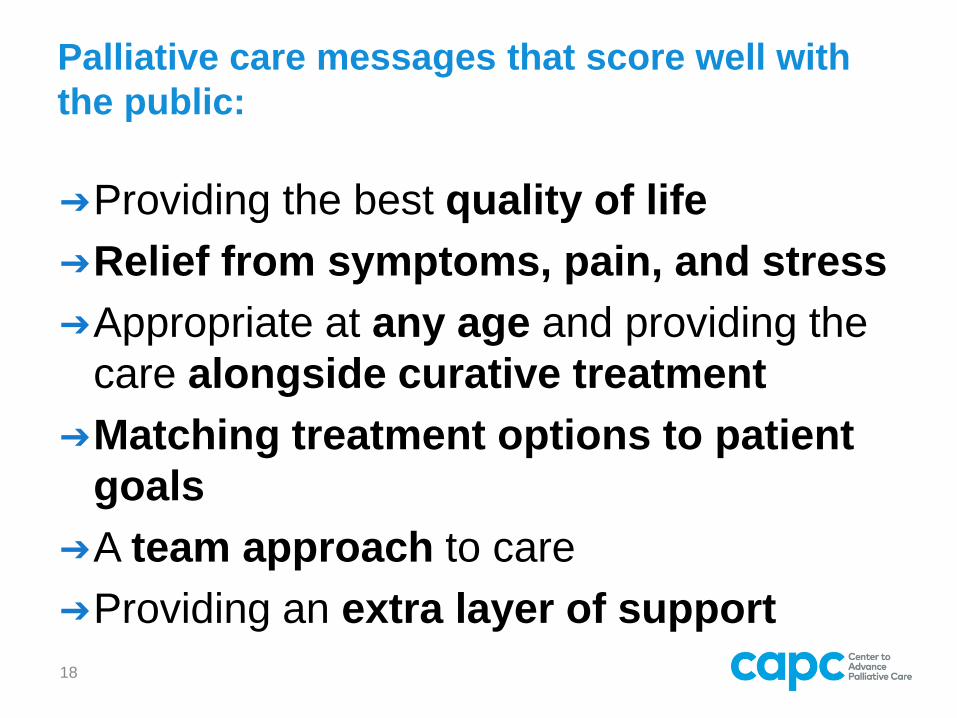
Palliative care messages that score well with
the public:
➔Providing the best quality of life
➔Relief from symptoms, pain, and stress
➔Appropriate at any age and providing the
care alongside curative treatment
➔Matching treatment options to patient
goals
➔A team approach to care
➔Providing an extra layer of support
18
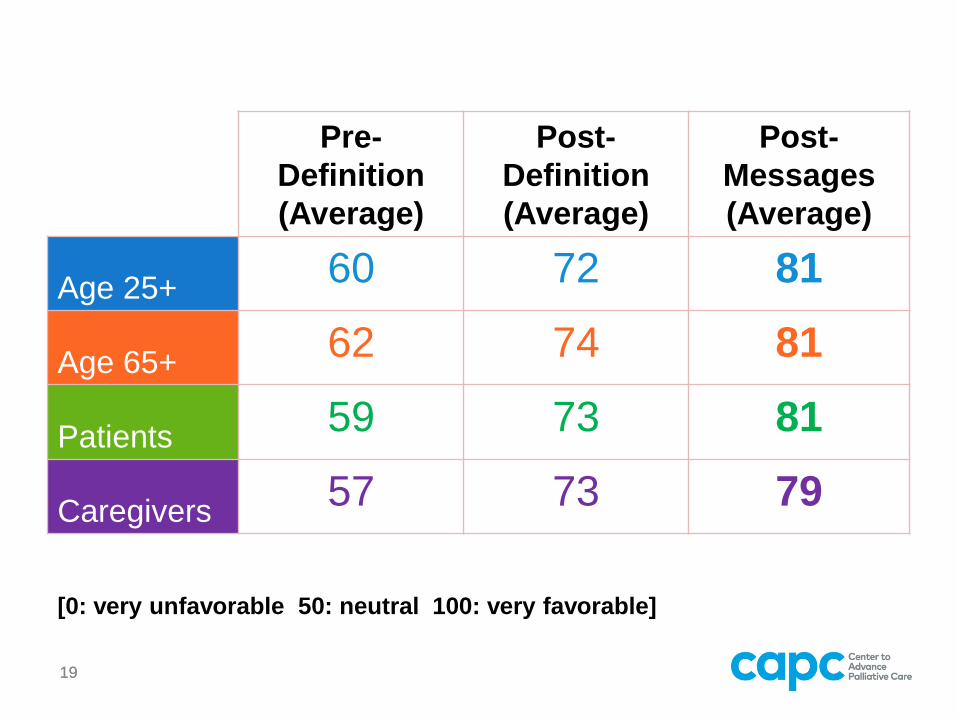
1919
Pre-
Definition
(Average)
Post-
Definition
(Average)
Post-
Messages
(Average)
Age 25+60 72 81
Age 65+62 74 81
Patients59 73 81
Caregivers57 73 79
[0: very unfavorable 50: neutral 100: very favorable]
➔How we talk about palliative care influences
perceptions about palliative care.
➔Attitudes become significantly more favorable
as people are educated.
➔The more educated consumers become the
more likely they are to say they would
consider palliative care for themselves or a
loved one (this is particularly true among patients and caregivers).
20
Key Takeaways
Language and definition/
messaging make a big
difference in public attitude
towards palliative care.
21
Key Takeaway
KEY FINDINGS
Physicians
22
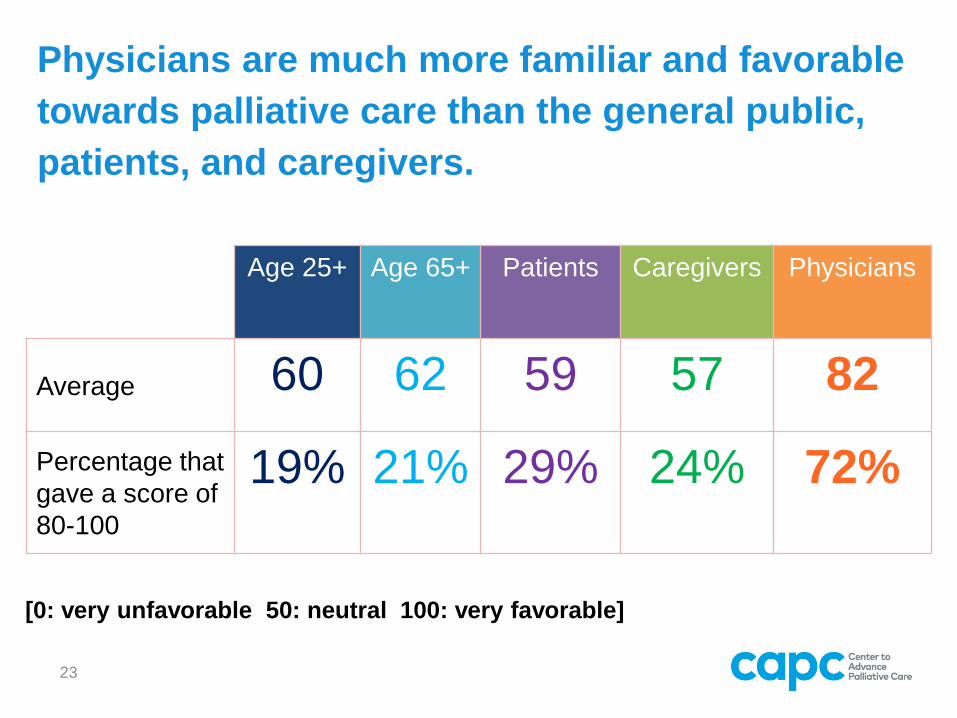
Physicians are much more familiar and favorable
towards palliative care than the general public,
patients, and caregivers.
23
Age 25+ Age 65+ Patients Caregivers Physicians
Average 60 62 59 57 82
Percentage that
gave a score of
80-100
19% 21% 29% 24% 72%
[0: very unfavorable 50: neutral 100: very favorable]
Most physicians say they are very comfortable
referring their patients to palliative care.
Physicians%Very
Comfortable
%Total
Comfortable
Referring your patients to
palliative care83% 99%
Talking with your patients
and their families about
palliative care
70% 98%
Determining when your
patients need palliative care66% 98%
24
25
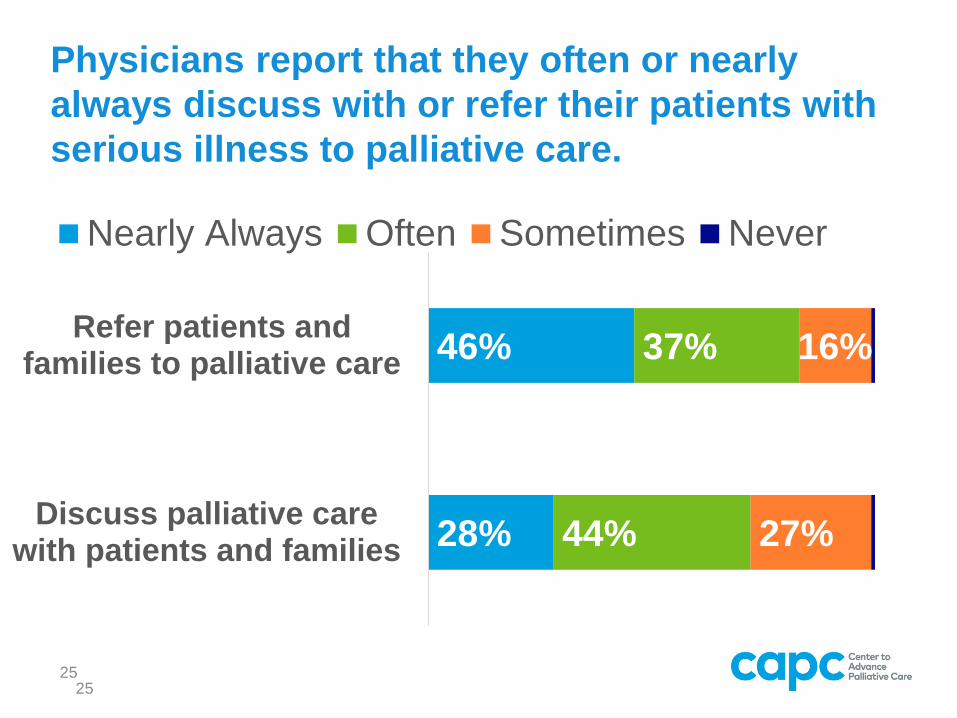
Physicians report that they often or nearly
always discuss with or refer their patients with
serious illness to palliative care.
28%
46%
44%
37%
27%
16%
Discuss palliative carewith patients and families
Refer patients andfamilies to palliative care
Nearly Always Often Sometimes Never
25
26
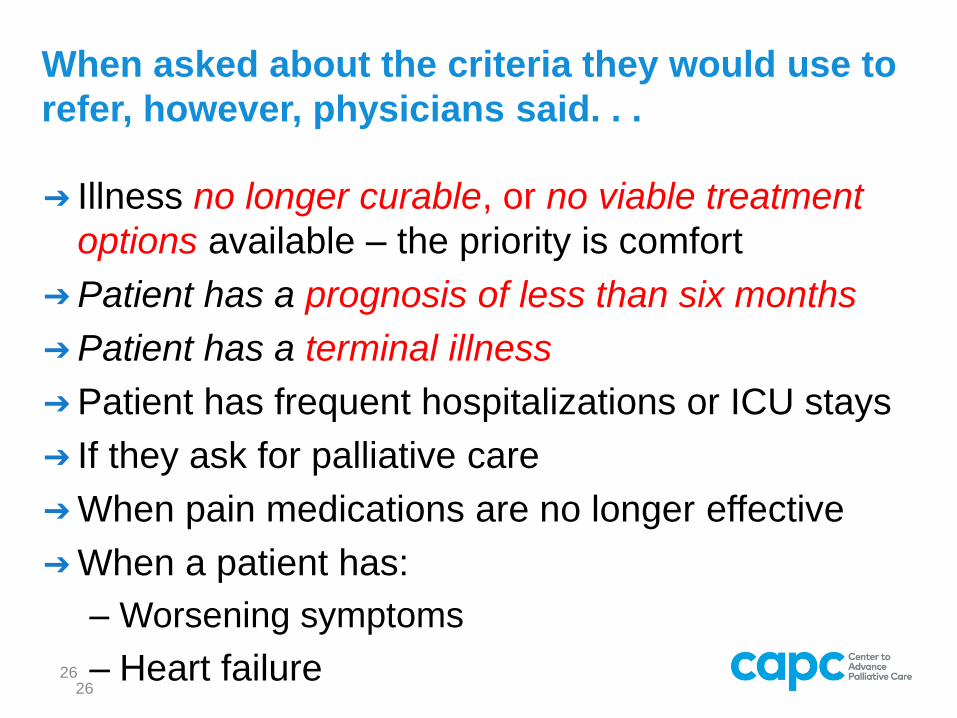
When asked about the criteria they would use to
refer, however, physicians said. . .
➔ Illness no longer curable, or no viable treatment
options available – the priority is comfort
➔Patient has a prognosis of less than six months
➔Patient has a terminal illness
➔Patient has frequent hospitalizations or ICU stays
➔ If they ask for palliative care
➔When pain medications are no longer effective
➔When a patient has:
– Worsening symptoms
– Heart failure26
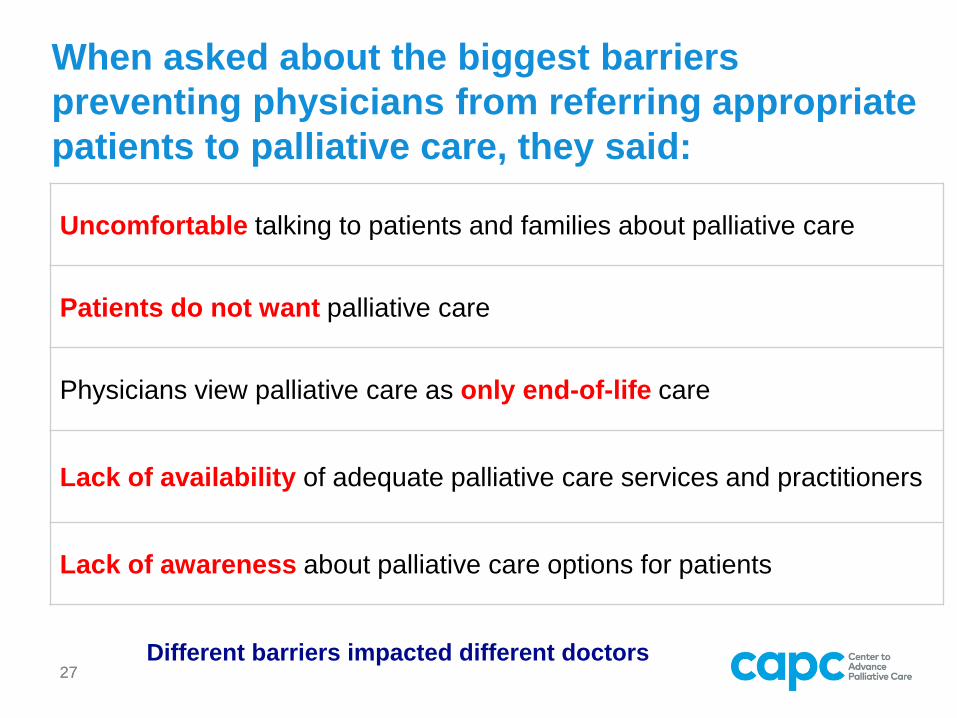
27
When asked about the biggest barriers
preventing physicians from referring appropriate
patients to palliative care, they said:
27
Uncomfortable talking to patients and families about palliative care
Patients do not want palliative care
Physicians view palliative care as only end-of-life care
Lack of availability of adequate palliative care services and practitioners
Lack of awareness about palliative care options for patients
Different barriers impacted different doctors
28
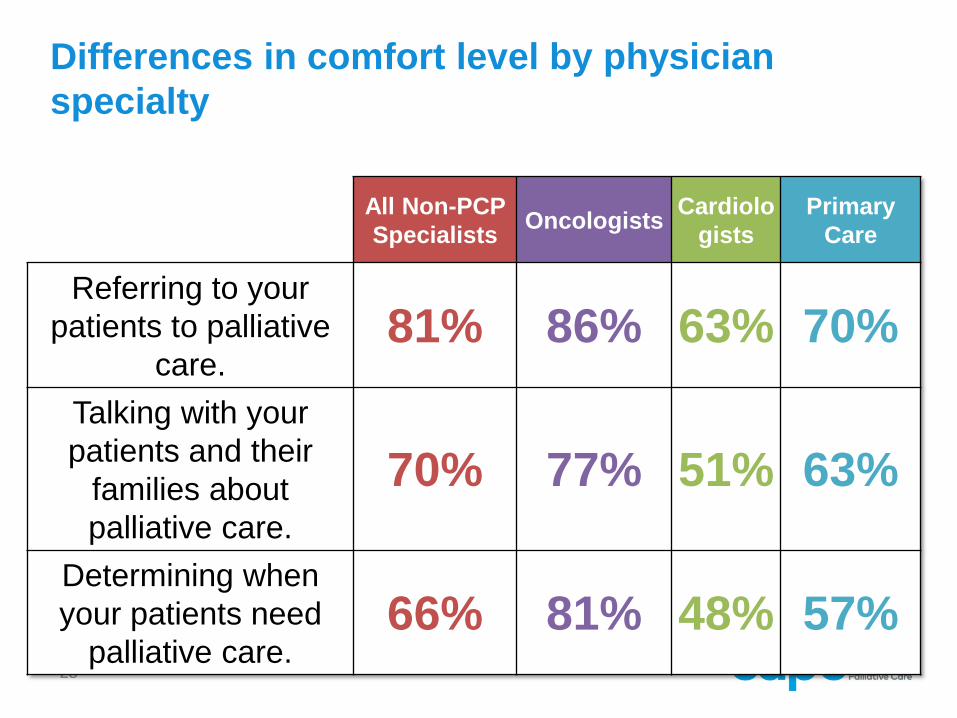
Differences in comfort level by physician
specialty
All Non-PCP
SpecialistsOncologists
Cardiolo
gists
Primary
Care
Referring to your
patients to palliative
care.81% 86% 63% 70%
Talking with your
patients and their
families about
palliative care.
70% 77% 51% 63%
Determining when
your patients need
palliative care. 66% 81% 48% 57%
29
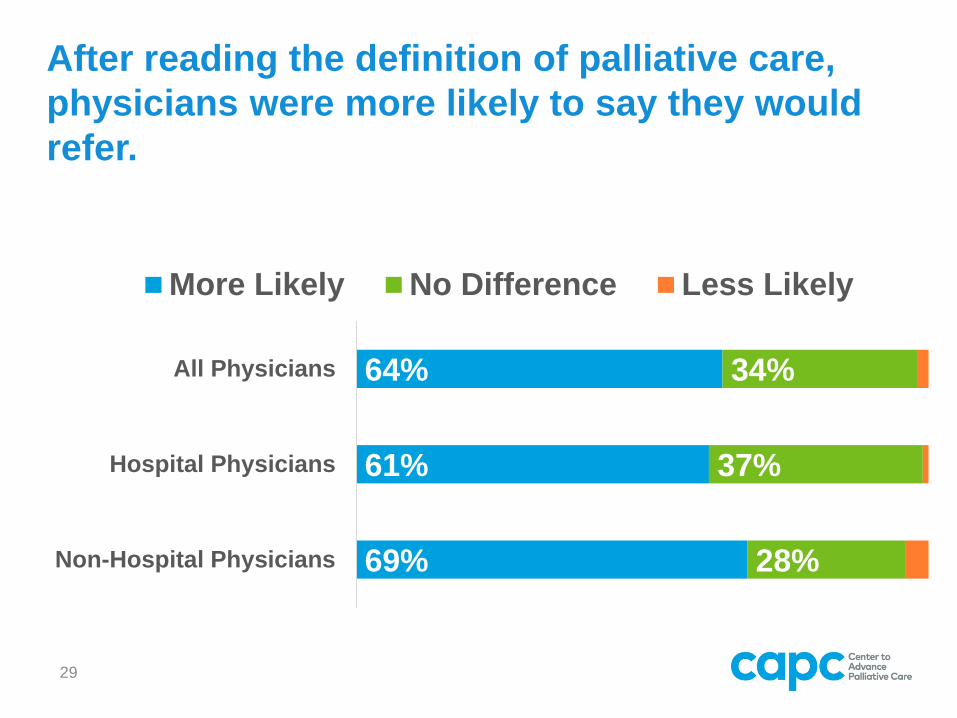
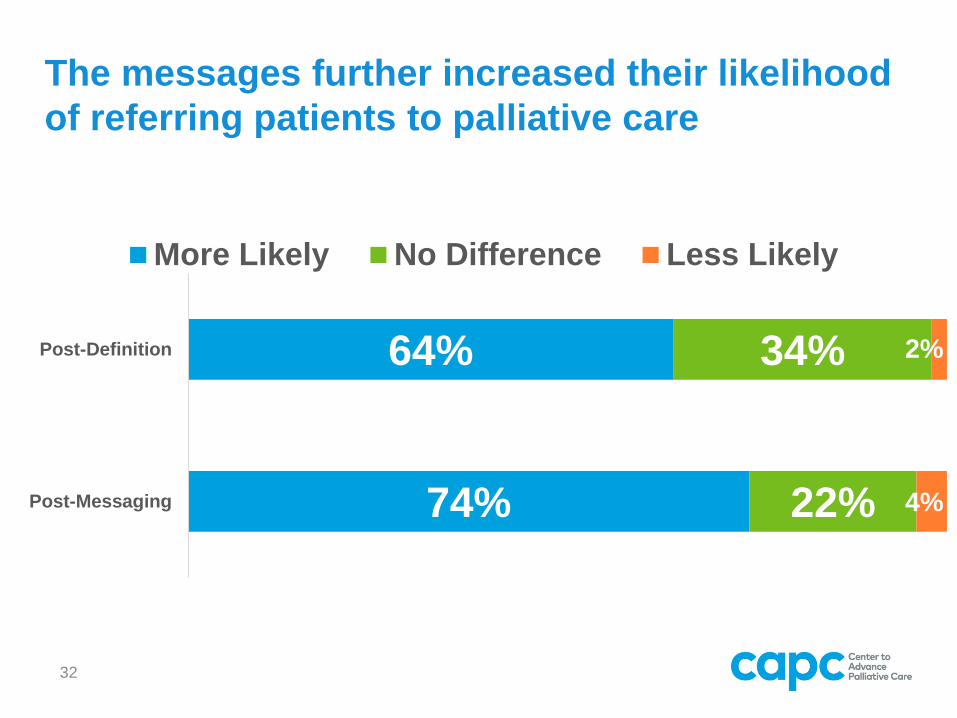
After reading the definition of palliative care,
physicians were more likely to say they would
refer.
64%
61%
69%
34%
37%
28%
All Physicians
Hospital Physicians
Non-Hospital Physicians
More Likely No Difference Less Likely
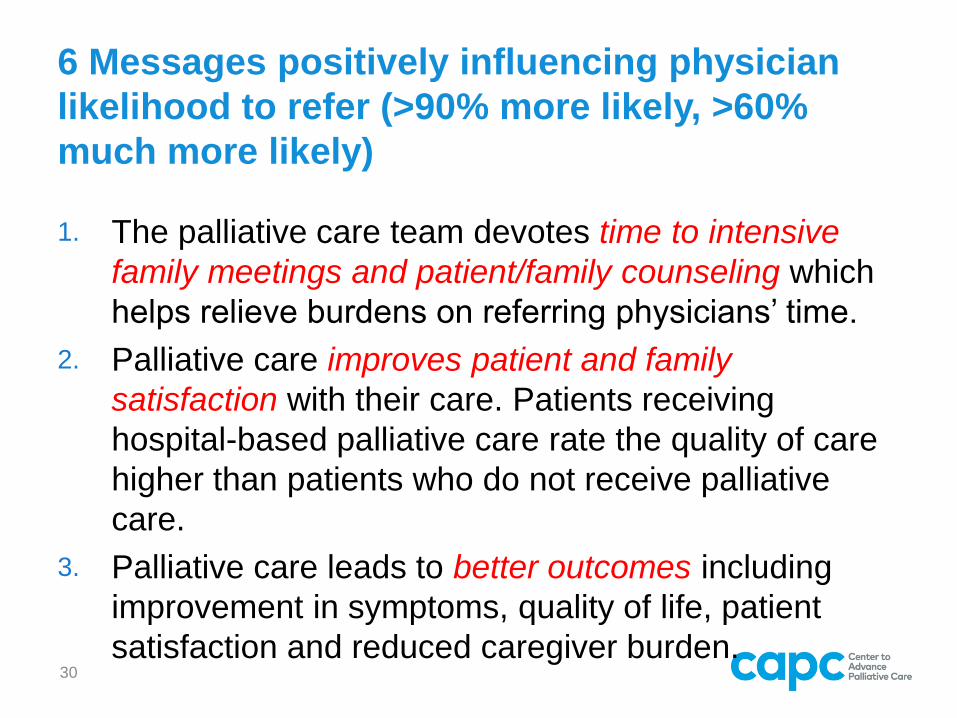
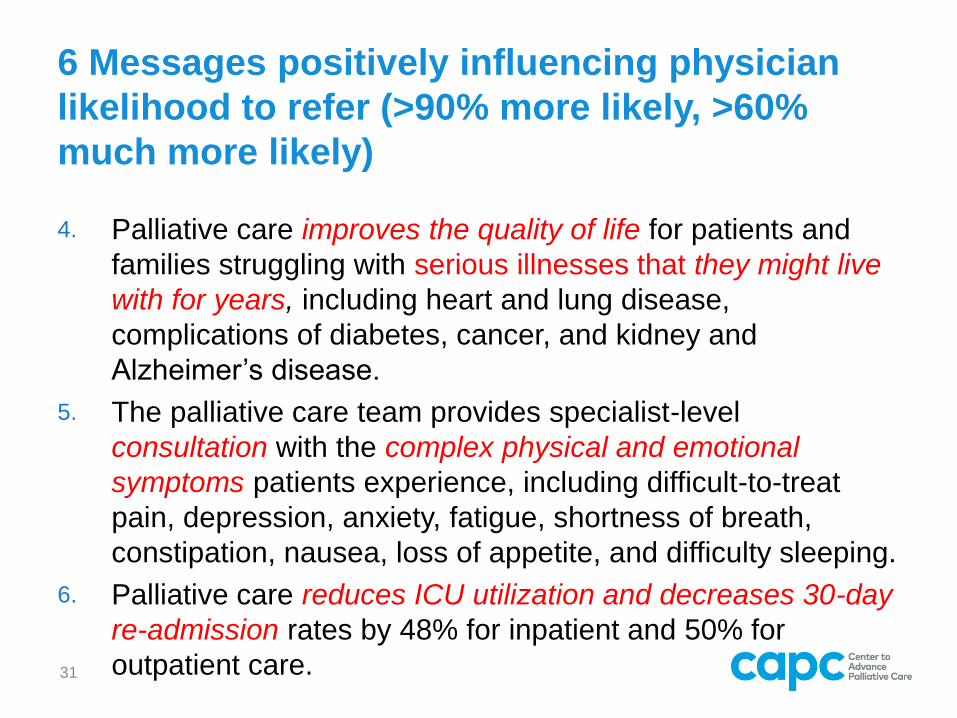
6 Messages positively influencing physician
likelihood to refer (>90% more likely, >60%
much more likely)
1. The palliative care team devotes time to intensive
family meetings and patient/family counseling which
helps relieve burdens on referring physicians’ time.
2. Palliative care improves patient and family
satisfaction with their care. Patients receiving
hospital-based palliative care rate the quality of care
higher than patients who do not receive palliative
care.
3. Palliative care leads to better outcomes including
improvement in symptoms, quality of life, patient
satisfaction and reduced caregiver burden. 30
6 Messages positively influencing physician
likelihood to refer (>90% more likely, >60%
much more likely)
4. Palliative care improves the quality of life for patients and
families struggling with serious illnesses that they might live
with for years, including heart and lung disease,
complications of diabetes, cancer, and kidney and
Alzheimer’s disease.
5. The palliative care team provides specialist-level
consultation with the complex physical and emotional
symptoms patients experience, including difficult-to-treat
pain, depression, anxiety, fatigue, shortness of breath,
constipation, nausea, loss of appetite, and difficulty sleeping.
6. Palliative care reduces ICU utilization and decreases 30-day
re-admission rates by 48% for inpatient and 50% for
outpatient care.31
32
The messages further increased their likelihood
of referring patients to palliative care
64%
74%
34%
22%
2%
4%
Post-Definition
Post-Messaging
More Likely No Difference Less Likely
WHAT DOES IT ALL MEAN
Conclusion
33
34
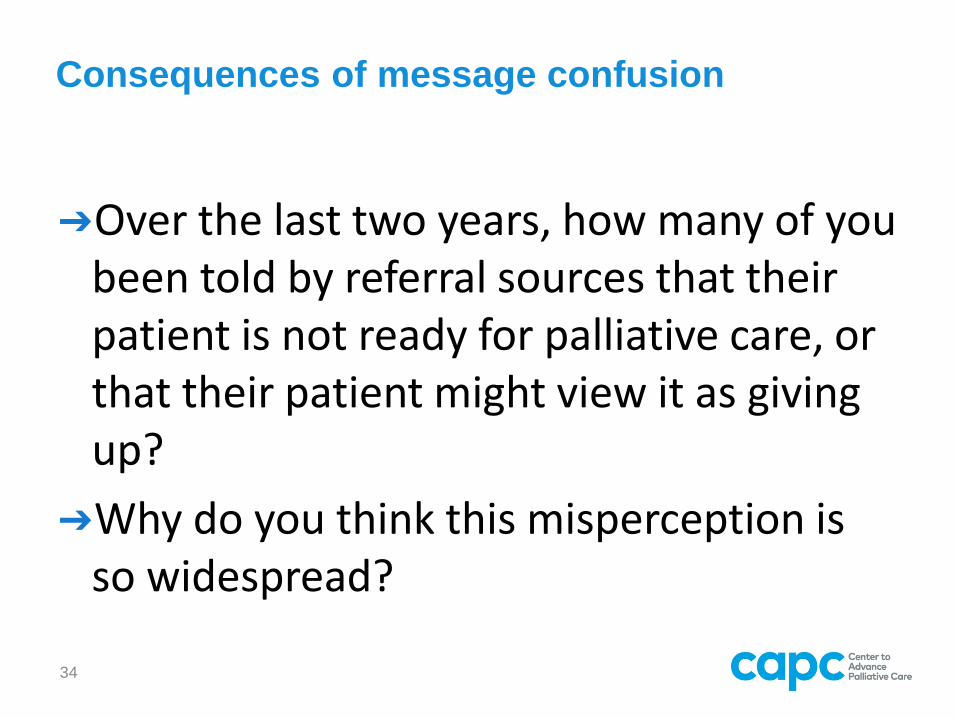
Consequences of message confusion
➔Over the last two years, how many of you been told by referral sources that their patient is not ready for palliative care, or that their patient might view it as giving up?
➔Why do you think this misperception is so widespread?
35
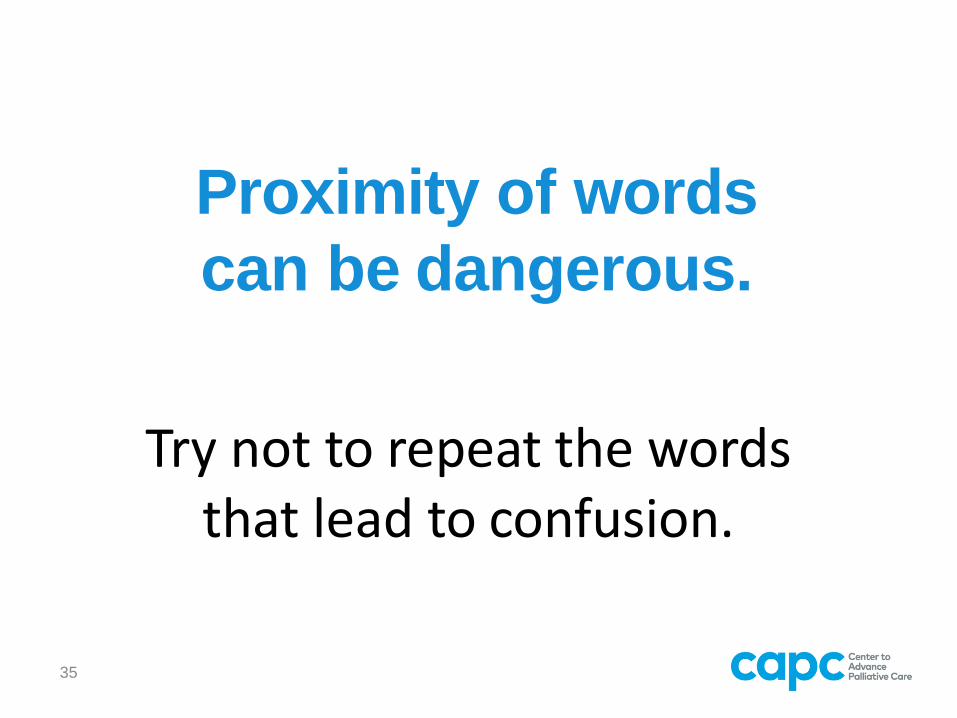
Proximity of words
can be dangerous.
Try not to repeat the wordsthat lead to confusion.
36
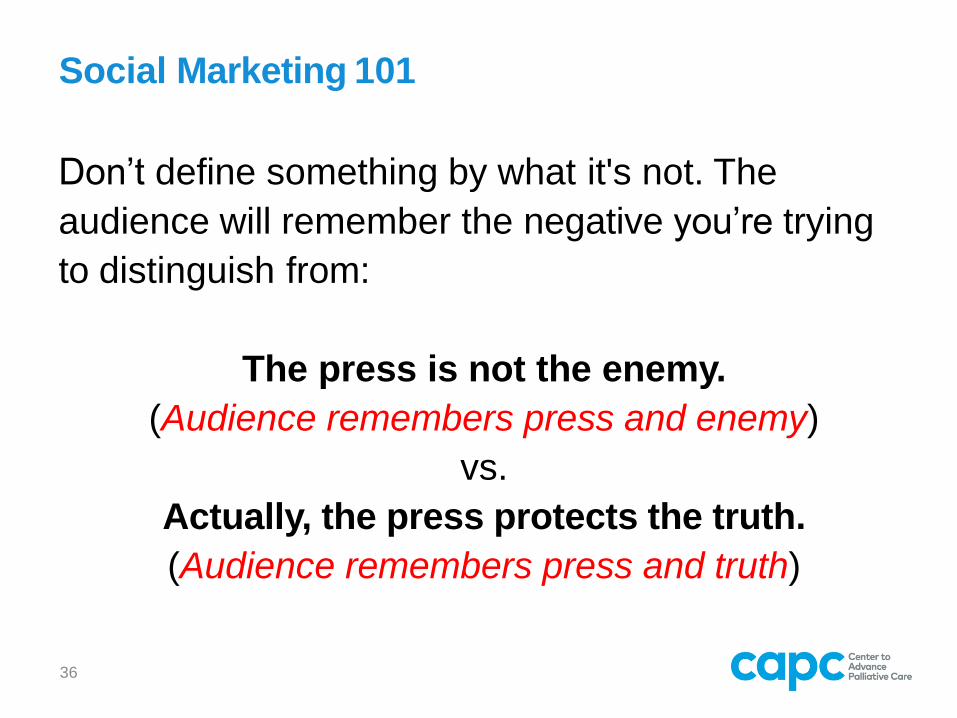
Don’t define something by what it's not. The
audience will remember the negative you’re trying
to distinguish from:
The press is not the enemy.
(Audience remembers press and enemy)
vs.
Actually, the press protects the truth.
(Audience remembers press and truth)
Social Marketing 101
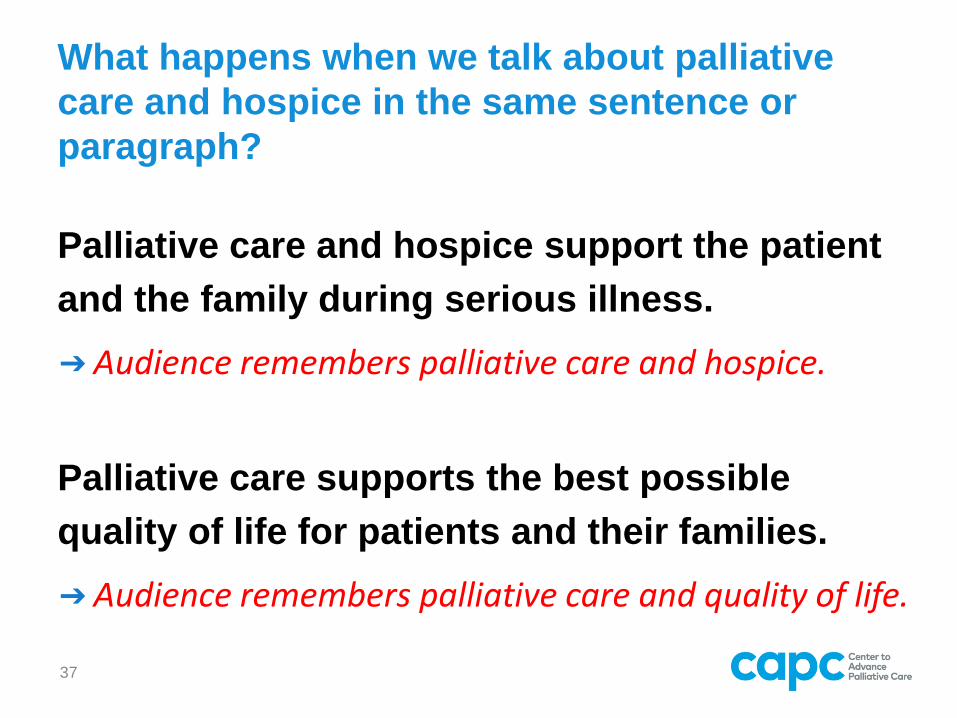
What happens when we talk about palliative
care and hospice in the same sentence or
paragraph?
Palliative care and hospice support the patient
and the family during serious illness.
➔Audience remembers palliative care and hospice.
Palliative care supports the best possible
quality of life for patients and their families.
➔Audience remembers palliative care and quality of life.
37
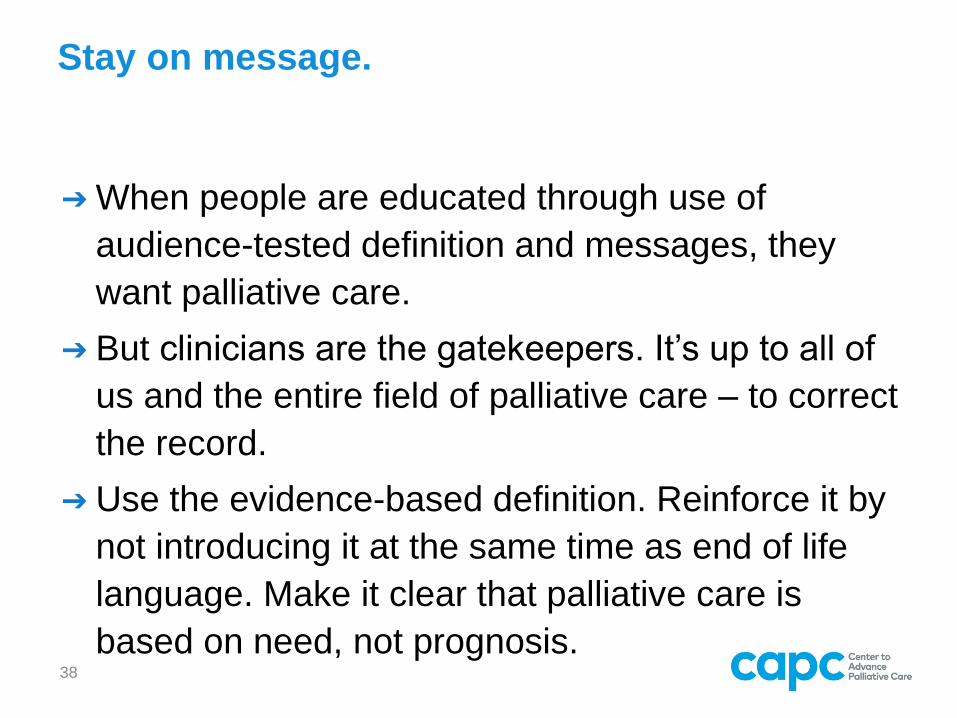
Stay on message.
➔ When people are educated through use of
audience-tested definition and messages, they
want palliative care.
➔ But clinicians are the gatekeepers. It’s up to all of
us and the entire field of palliative care – to correct
the record.
➔ Use the evidence-based definition. Reinforce it by
not introducing it at the same time as end of life
language. Make it clear that palliative care is
based on need, not prognosis. 38
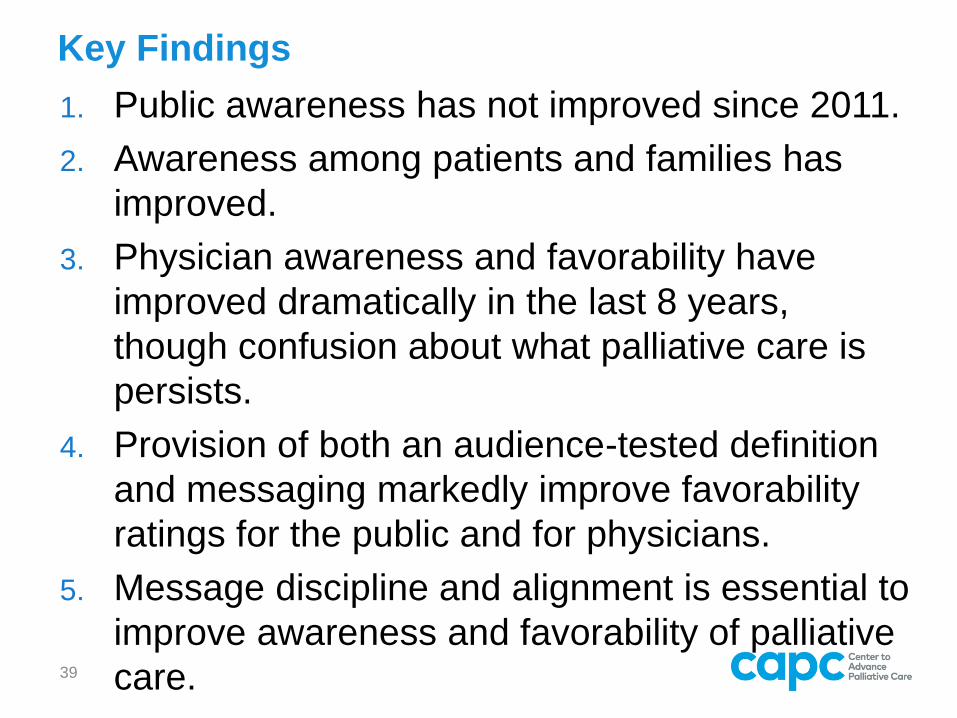
1. Public awareness has not improved since 2011.
2. Awareness among patients and families has
improved.
3. Physician awareness and favorability have
improved dramatically in the last 8 years,
though confusion about what palliative care is
persists.
4. Provision of both an audience-tested definition
and messaging markedly improve favorability
ratings for the public and for physicians.
5. Message discipline and alignment is essential to
improve awareness and favorability of palliative
care.39
Key Findings
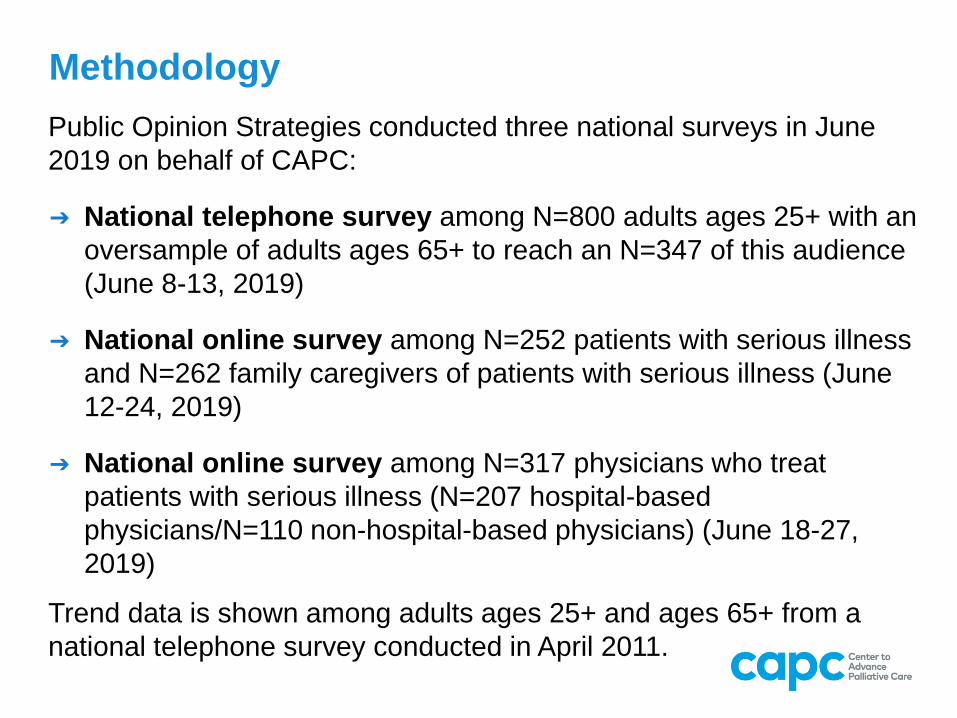
Methodology
Public Opinion Strategies conducted three national surveys in June
2019 on behalf of CAPC:
➔ National telephone survey among N=800 adults ages 25+ with an
oversample of adults ages 65+ to reach an N=347 of this audience
(June 8-13, 2019)
➔ National online survey among N=252 patients with serious illness
and N=262 family caregivers of patients with serious illness (June
12-24, 2019)
➔ National online survey among N=317 physicians who treat
patients with serious illness (N=207 hospital-based
physicians/N=110 non-hospital-based physicians) (June 18-27,
2019)
Trend data is shown among adults ages 25+ and ages 65+ from a
national telephone survey conducted in April 2011.
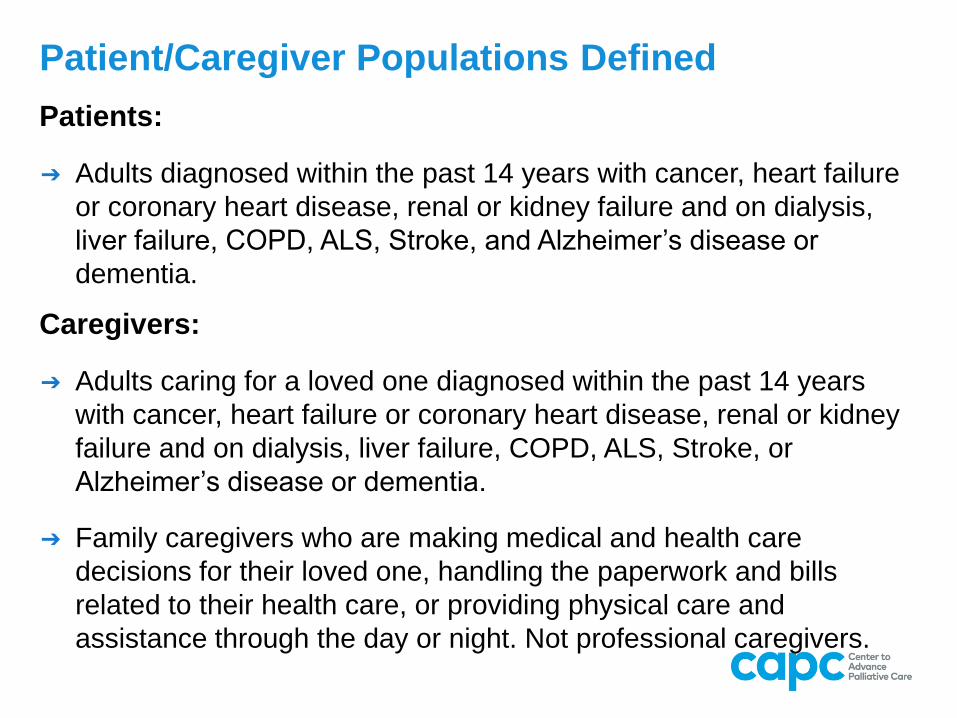
Patient/Caregiver Populations Defined
Patients:
➔ Adults diagnosed within the past 14 years with cancer, heart failure
or coronary heart disease, renal or kidney failure and on dialysis,
liver failure, COPD, ALS, Stroke, and Alzheimer’s disease or
dementia.
Caregivers:
➔ Adults caring for a loved one diagnosed within the past 14 years
with cancer, heart failure or coronary heart disease, renal or kidney
failure and on dialysis, liver failure, COPD, ALS, Stroke, or
Alzheimer’s disease or dementia.
➔ Family caregivers who are making medical and health care
decisions for their loved one, handling the paperwork and bills
related to their health care, or providing physical care and
assistance through the day or night. Not professional caregivers.
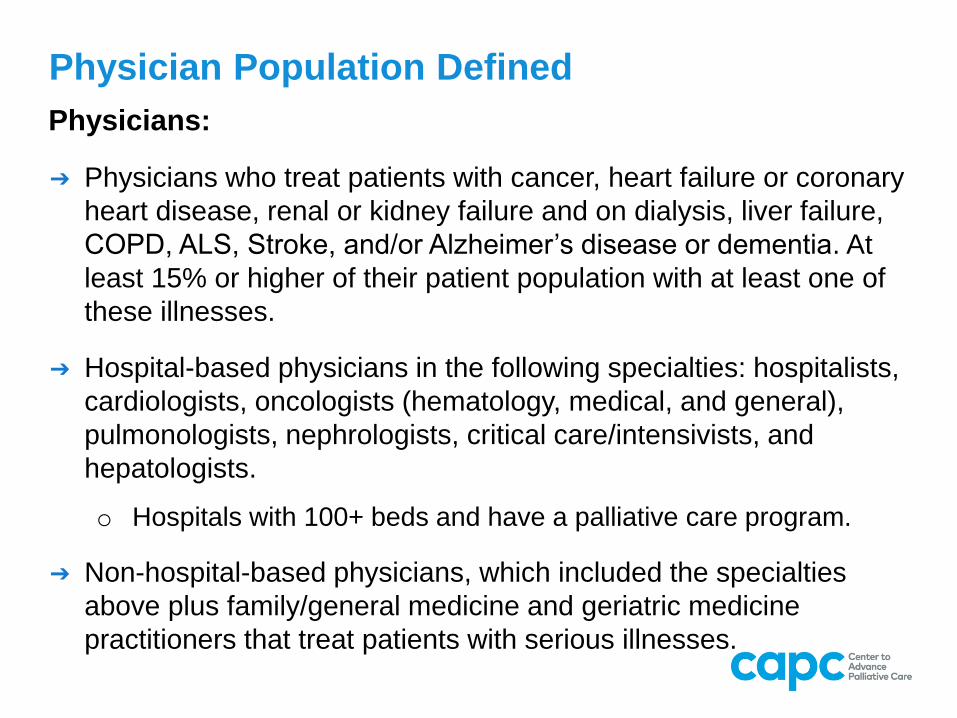
Physicians:
➔ Physicians who treat patients with cancer, heart failure or coronary
heart disease, renal or kidney failure and on dialysis, liver failure,
COPD, ALS, Stroke, and/or Alzheimer’s disease or dementia. At
least 15% or higher of their patient population with at least one of
these illnesses.
➔ Hospital-based physicians in the following specialties: hospitalists,
cardiologists, oncologists (hematology, medical, and general),
pulmonologists, nephrologists, critical care/intensivists, and
hepatologists.
o Hospitals with 100+ beds and have a palliative care program.
➔ Non-hospital-based physicians, which included the specialties
above plus family/general medicine and geriatric medicine
practitioners that treat patients with serious illnesses.
Physician Population Defined
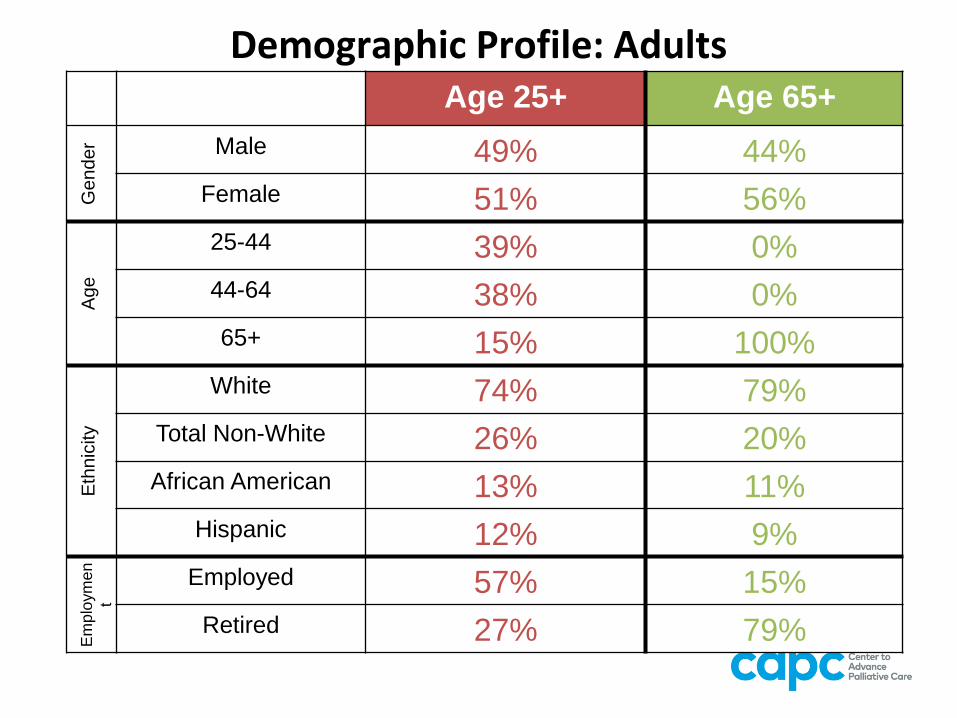
Demographic Profile: AdultsAge 25+ Age 65+
Gender Male 49% 44%
Female 51% 56%
Age
25-44 39% 0%
44-64 38% 0%
65+ 15% 100%
Eth
nic
ity
White 74% 79%
Total Non-White 26% 20%
African American 13% 11%
Hispanic 12% 9%
Em
plo
ym
en
t
Employed 57% 15%
Retired 27% 79%
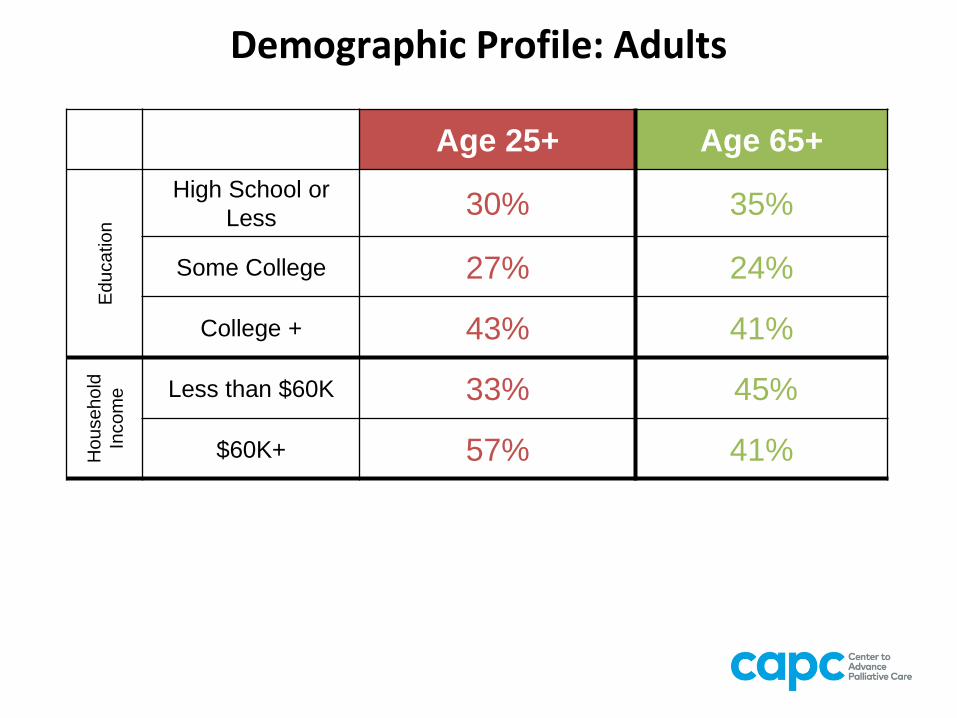
Demographic Profile: Adults
Age 25+ Age 65+
Ed
uca
tio
n
High School or
Less30% 35%
Some College 27% 24%
College + 43% 41%
Ho
use
ho
ld
Inco
me Less than $60K 33% 45%
$60K+ 57% 41%
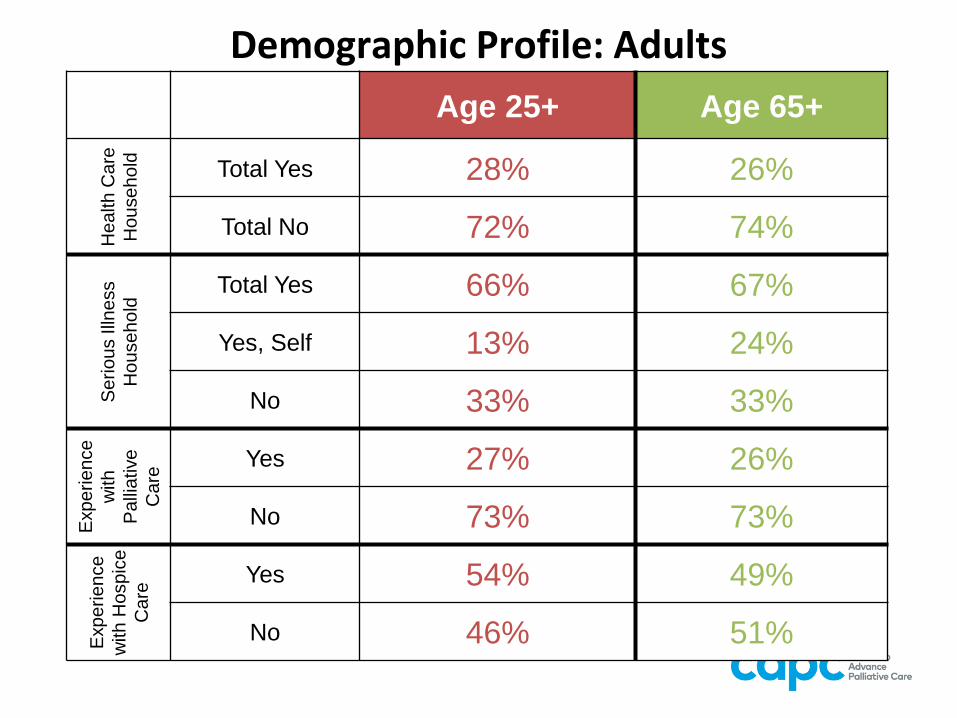
Demographic Profile: Adults
Age 25+ Age 65+H
ea
lth
Ca
re
Ho
use
ho
ld Total Yes 28% 26%
Total No 72% 74%
Se
rio
us Illn
ess
Ho
use
ho
ld Total Yes 66% 67%
Yes, Self 13% 24%
No 33% 33%
Exp
erie
nce
with
Pa
llia
tive
Ca
re
Yes 27% 26%
No 73% 73%
Exp
erie
nce
with
Ho
sp
ice
Ca
re
Yes 54% 49%
No 46% 51%
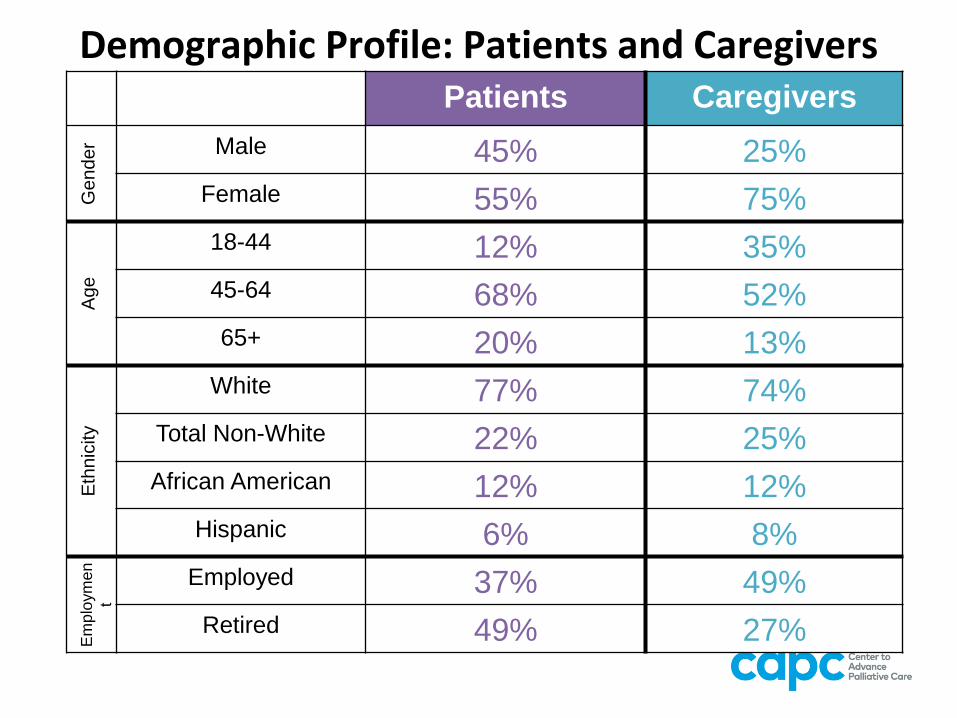
Demographic Profile: Patients and CaregiversPatients Caregivers
Gender Male 45% 25%
Female 55% 75%
Age
18-44 12% 35%
45-64 68% 52%
65+ 20% 13%
Eth
nic
ity
White 77% 74%
Total Non-White 22% 25%
African American 12% 12%
Hispanic 6% 8%
Em
plo
ym
en
t
Employed 37% 49%
Retired 49% 27%
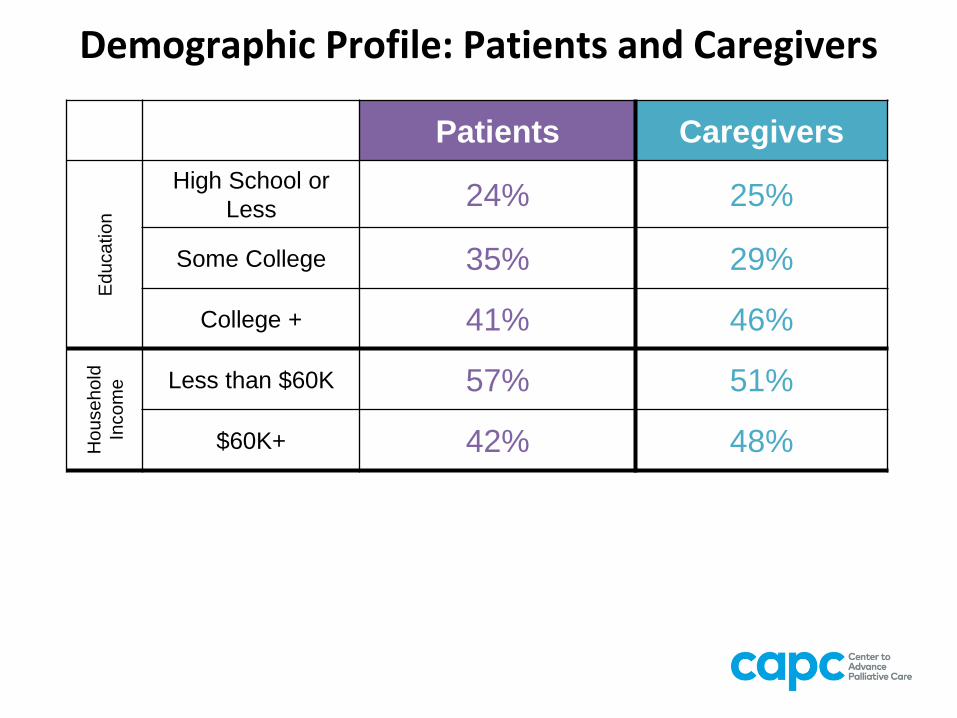
Demographic Profile: Patients and Caregivers
Patients CaregiversE
du
ca
tio
n
High School or
Less24% 25%
Some College 35% 29%
College + 41% 46%
Ho
use
ho
ld
Inco
me Less than $60K 57% 51%
$60K+ 42% 48%
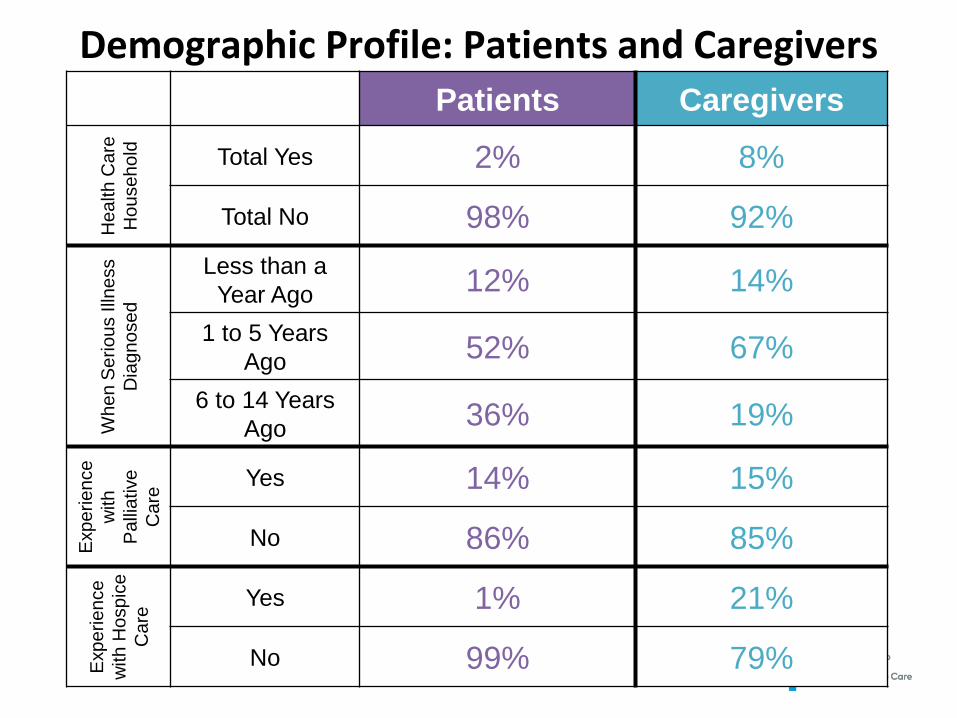
Demographic Profile: Patients and CaregiversPatients Caregivers
He
alth
Ca
re
Ho
use
ho
ld Total Yes 2% 8%
Total No 98% 92%
Wh
en
Se
rio
us Illn
ess
Dia
gn
ose
d
Less than a
Year Ago12% 14%
1 to 5 Years
Ago52% 67%
6 to 14 Years
Ago36% 19%
Exp
erie
nce
with
Pa
llia
tive
Ca
re
Yes 14% 15%
No 86% 85%
Exp
erie
nce
with
Ho
sp
ice
Ca
re
Yes 1% 21%
No 99% 79%
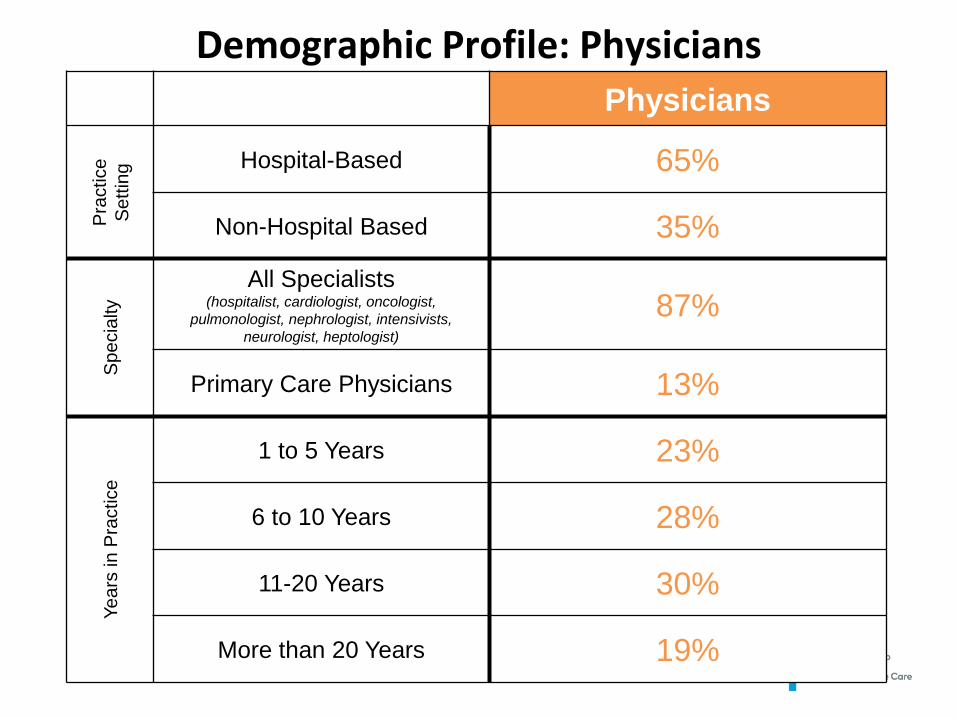
Demographic Profile: PhysiciansPhysicians
Pra
ctice
Se
ttin
g Hospital-Based 65%
Non-Hospital Based 35%
Sp
ecia
lty
All Specialists(hospitalist, cardiologist, oncologist,
pulmonologist, nephrologist, intensivists,
neurologist, heptologist)
87%
Primary Care Physicians 13%
Ye
ars
in
Pra
ctice
1 to 5 Years 23%
6 to 10 Years 28%
11-20 Years 30%
More than 20 Years 19%
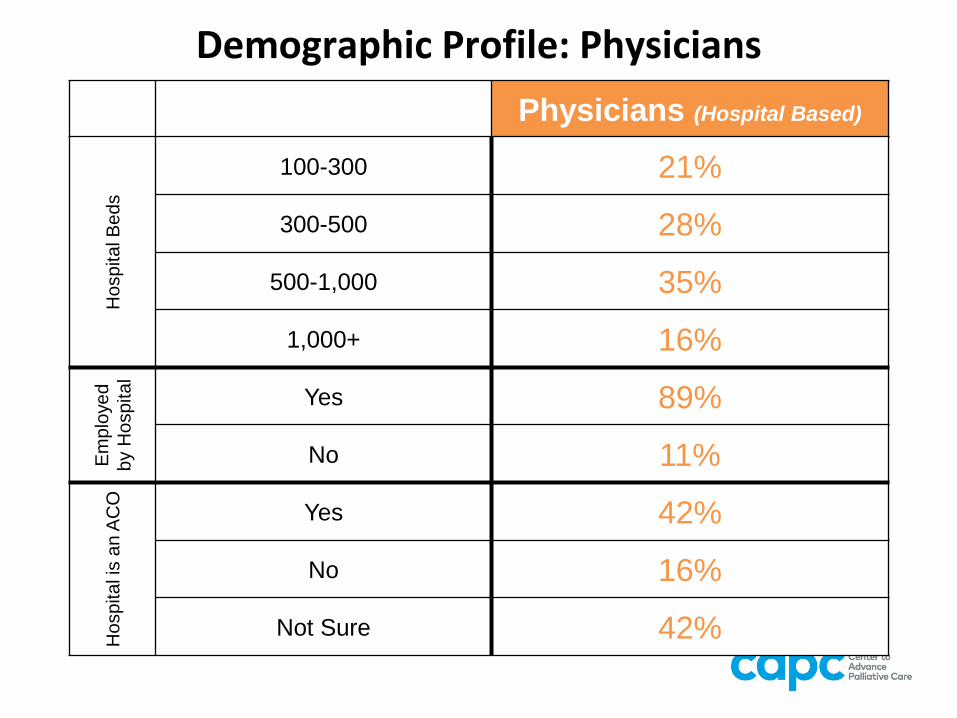
Demographic Profile: Physicians
Physicians (Hospital Based)H
osp
ita
l B
ed
s
100-300 21%
300-500 28%
500-1,000 35%
1,000+ 16%
Em
plo
ye
d
by H
ospital
Yes 89%
No 11%
Ho
sp
ita
l is
an
AC
O
Yes 42%
No 16%
Not Sure 42%
Demographic Profile: PhysiciansPhysicians
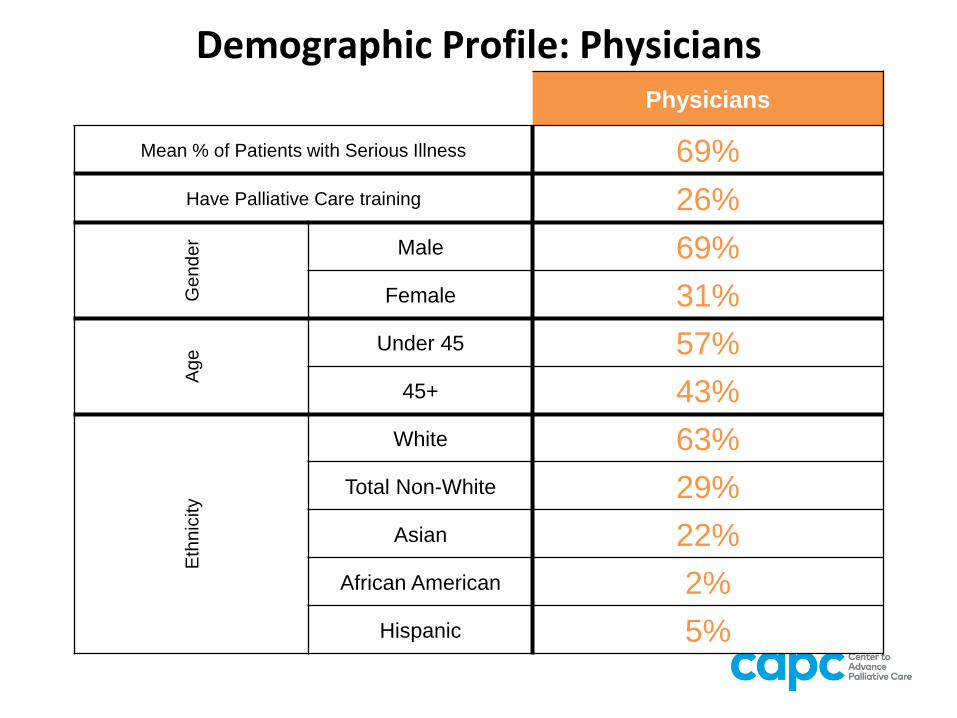
Mean % of Patients with Serious Illness 69%
Have Palliative Care training 26%G
ender Male 69%
Female 31%
Age
Under 45 57%
45+ 43%
Eth
nic
ity
White 63%
Total Non-White 29%
Asian 22%
African American 2%
Hispanic 5%