Embed Size (px)
Citation preview
ASIAN DEVELOPMENT BANK
HIGHLIGHTS
201546TH EDITION
KEY INDICATORSFOR ASIA AND THE PACIFIC
Printed on recycled paper
Creative Commons Attribution 3.0 IGO license (CC BY 3.0 IGO)
© 2015 Asian Development Bank6 ADB Avenue, Mandaluyong City, 1550 Metro Manila, PhilippinesTel +63 2 632 4444; Fax +63 2 636 2444www.adb.org; [email protected]; [email protected]
Some rights reserved. Published in 2015.Printed in [the] Philippines.
Publication Stock No. FLS157537-2
The views expressed in this publication are those of the authors and do not necessarily reflect the views and policies of the Asian Development Bank (ADB) or its Board of Governors or the governments they represent.
This work is available under the Creative Commons Attribution 3.0 IGO license (CC BY 3.0 IGO) https://creativecommons.org/licenses/by/3.0/igo/. By using the content of this publication, you agree to be bound by the terms of said license as well as the Terms of Use of the ADB Open Access Repository at openaccess.adb.org/termsofuse
The CC license does not apply to non-ADB copyright materials in this publication.
Note: In this publication, “$” refers to US dollars.
KEY INDICATORS FOR ASIAAND THE PACIFIC 2015
HIGHLIGHTSThis issue of Key Indicators for the Asia and the Pacific comprises of four parts.
Part I of the publication is a special chapter, “A Smarter Future: Skills, Education, and Growth in Asia”. The chapter emphasizes that developing Asia needs to scale up skills development to successfully manage its economic transformation and achieve a more prosperous and smarter future. Toward this goal, the region should make greater efforts to enhance the quality of education, while continuing to broaden access, to ensure its workforce has the full complement of skills—cognitive, noncognitive, and technical—needed for high growth. Systematic collection and sharing of credible, timely, and relevant information about schools, teachers, and students; attention to curriculum content; and emphasis on early childhood education will have large payoffs in improving the quality of education.
With the Millennium Development Goals (MDGs) set to expire by the end of 2015, the Sustainable Development Goals (SDGs) have been formally adopted as the post-2015 development agenda. Part II presents statistical tables and commentaries on the progress of the MDGs, highlighting that the region has reduced dramatically the number of poor living below $1.25 per day in 2005 purchasing power parity (PPP) terms, alongside meeting several other targets. Greater inclusion, tackling climate change, enhancing educational quality and improving access to sanitation facilities are some of the challenges that the region needs to overcome to end poverty in all its dimensions and promote sustainable development.
Part III presents statistical indicators across social, economic and environmental dimensions. These indicators reinforce developing Asia’s growing importance in the global economy with the region accounting for more than 40% of global GDP in PPP terms.
Part IV presents a new data series—statistics generated by ADB on selected economies’ participation in global value chains. In an economic environment increasingly characterized by fragmented and globally distributed production processes, these measures complement traditional trade statistics by capturing the essence of cross-economy production arrangements.
Shang-Jin Wei Chief Economist and Director General
3
Part I: Special Chapter A Smarter Future: Skills, Education, and Growth in Asia
1. While progress in the spread of education is noticeable, shortfalls in the quantity and, especially, quality of education constrain skill development and growth.
• Developing Asia has made large strides in expanding educationalaccesstoeducation. Average years of schooling nearly doubled from 3.9 in 1970 to 8.0 in 2010. Over 1990–2012, literacy grew from 79% to 87% and gross enrollments in secondary and tertiary education rose from 62% to 81% and from 15% to 27%, respectively. These gains have been the result of conscious efforts of both governments and households to invest in education, perhaps the most important channel through which individuals acquire skills.
• Skillsremainweakinmanypartsoftheregion,duetogapsinboththequantityandqualityofeducationprovided. In some economies, as many as 90% of high-skilled occupations in which tertiary education is important are filled by people with, at most, a secondary education. This points to the need to continue efforts to expand the quantity of education. But, perhaps more importantly, the quality of education (the level and relevance of skills in this chapter’s terminology) needs to improve. As revealed by international tests of cognitive skills that schooling is intended to provide, in 10 of 15 regional economies that participated in recent PISA and TIMSS tests (measuring critical cognitive skills in reading, mathematics, and science among students aged 14–15), more than 30% of participants had scores below the level corresponding to the minimum basic cognitive skills needed for functioning efficiently in the workplace (a score of at least 400). Very few students—less than 1% in five developing Asian economies—had top-end skills that allow individuals to solve complex problems and think strategically (captured by scores above 600 on PISA/TIMSS). Many Asian
4 Key Indicators for Asia and the Pacific 2015 Highlights
schools are also not providing students with good noncognitive skills. Employer surveys often cite this as a major “missing skill” in their workers, in addition to certain types of technical skills.
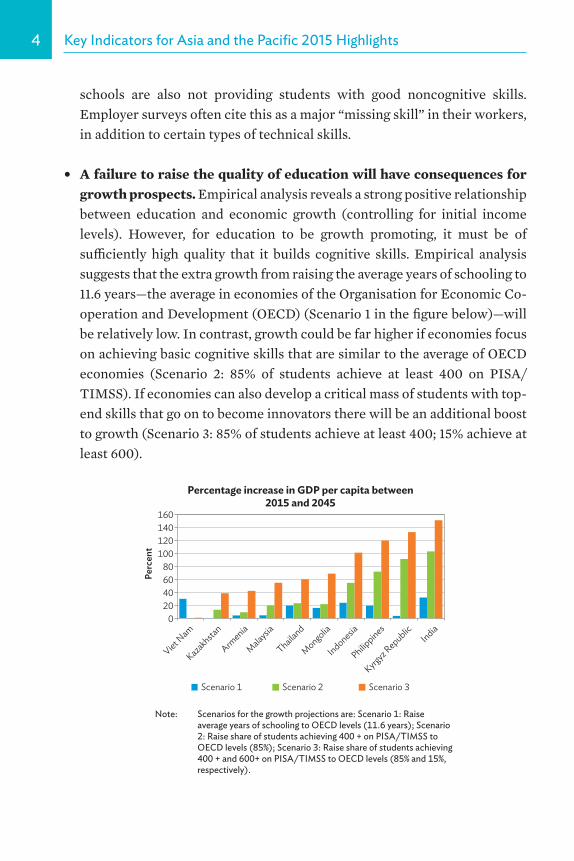
• Afailuretoraisethequalityofeducationwillhaveconsequencesforgrowthprospects.Empirical analysis reveals a strong positive relationship between education and economic growth (controlling for initial income levels). However, for education to be growth promoting, it must be of sufficiently high quality that it builds cognitive skills. Empirical analysis suggests that the extra growth from raising the average years of schooling to 11.6 years—the average in economies of the Organisation for Economic Co-operation and Development (OECD) (Scenario 1 in the figure below)—will be relatively low. In contrast, growth could be far higher if economies focus on achieving basic cognitive skills that are similar to the average of OECD economies (Scenario 2: 85% of students achieve at least 400 on PISA/TIMSS). If economies can also develop a critical mass of students with top-end skills that go on to become innovators there will be an additional boost to growth (Scenario 3: 85% of students achieve at least 400; 15% achieve at least 600).
Note: Scenarios for the growth projections are: Scenario 1: Raise average years of schooling to OECD levels (11.6 years); Scenario 2: Raise share of students achieving 400 + on PISA/TIMSS to OECD levels (85%); Scenario 3: Raise share of students achieving 400 + and 600+ on PISA/TIMSS to OECD levels (85% and 15%, respectively).
020406080
100120140160
Viet Nam
Kazakhstan
Armenia
Malaysia
Thailand
Mongolia
Indonesia
Philippines
Kyrgyz RepublicIndia
Perc
ent
Percentage increase in GDP per capita between2015 and 2045
Scenario 1 Scenario 2 Scenario 3
5Special Chapter
2. Toward more effective skill development systems
• In principle, many factors canmatter for improving the quality ofeducation. Policymakers have to decide on a number of issues, including: How should public finances be allocated across different levels and types of education to deliver better educational outcomes per dollar of investment? Is it teacher skills or motivation that is the greater constraint to enhancing learning outcomes? What role can information play in helping to improve educational outcomes? How can the public sector invest to catalyze educational investments by families and firms? Answering such questions relies crucially on data and evidence.
• Thisstudycompilesanewdatabaseonhoweconomiesacrosstheregionmanagetheireducationsystems. A database of over 150 indicators has been developed to compare and contrast educational inputs and practices followed by 67 economies globally for managing their basic education systems. For 23 economies from developing Asia, the database also includes indicators for technical and vocational education and training (TVET) and higher education. The indicators reveal considerable variations in inputs and practices across economies. Three economies in developing Asia—Republic of Korea; Singapore; and Taipei,China—have consistently better practices in virtually all areas considered. In particular, these economies are dedicated to collecting detailed information that is important to effectively manage schools and teachers and ensure that their incentives are aligned with better learning outcomes of their students. Some lower-income economies such as Viet Nam also rank high in many areas.
• Somefeaturesofeducationsystemsarebetterpredictorsoflearningoutcomes than others. To determine whether some practices matter more for skill development, this study examines the relationship between performance on the international PISA and TIMSS tests and indicators for basic education using the global sample of 67 economies. Analysis reveals that economies with better cognitive skills are those that are committed to collecting quality information, particularly on learning outcomes; that have curricula emphasizing critical thinking and matched to student
6 Key Indicators for Asia and the Pacific 2015 Highlights
capabilities (through remedial and enrichment courses); and that invest in early childhood education.
• The importance of collecting information on learning outcomesemphasizesthatdataareanessentialbasisformakingevidence-basedpolicydecisionsandimposingaccountability. Closing the gap between the economies with the best practices in the collection and provision of educational information and the economies with relatively weak practices could raise average PISA/TIMSS test scores of the latter by as much as 16%. Timely, credible, and relevant data allow governments to decide among alternative investments on the basis of evidence and hold schools and teachers accountable to learning outcomes. Providing information to parents on measures of student and school performance on standardized tests also improves test scores, as this information can empower families to demand better educational quality. It can also enable families to make more informed skill investment decisions. Indeed, families are likely to invest more in their children’s education when they are assured of its quality.
• Goodcurriculumcontentneedstobepitchedtostudentcapabilitiesto improve student learning and help develop transferrable labormarket–relevantskills. Closing the gap between the best and relatively weaker performers on curriculum content could raise average test scores of the latter by as much as 10%. When the curriculum is too hard or too easy, students may learn very little. Additionally, basic education curricula, especially at the secondary level, should focus on developing skills that are highly transferrable, whether they are cognitive, noncognitive, or technical. In particular, basic digital, financial, and marketing skills may be important technical skills that could help, independent of the occupation one may ultimately enter.
• Earlychildhoodeducationhas largepayoffs toskilldevelopmentbybuildingthecapacitytolearnlaterinlife.In fact, this brings some of the largest gains in tests of cognitive skills. On the PISA/TIMMS tests of 14-15 year olds, for example, test scores are 9% higher for students who started school before age 5 rather than 7, but are only 2% higher for those who started at age 6. Given the scientific evidence that early education builds
7Special Chapter
the capacity to learn, its benefits continue to accrue over the long term. Moreover, as lower-income families have difficulties in financing education, there is a strong case for public financing of early childhood education. Nevertheless, a good number of developing economies in Asia are lagging behind on the indicator for early childhood education. Early childhood investments targeted at the most disadvantaged may also be critically important in ensuring greater educational access and ensuring that the best and most promising students have a better opportunity to enter higher levels of education.
• Public educational expenditures are necessary, but not sufficient toimprove learning outcomes. While public educational expenditures as a percentage of GDP vary considerably across economies they are not systematically associated with higher test scores. This suggests that how public finances for education are utilized and invested matters as much as the amount of finance. In particular, public finances need to be directed at different levels and types of education so as to yield better educational quality per dollar of investment.
• Our analysis does not cover all potentially important issues due totheabsenceofgooddatathatareessentialtobuildinghardevidence.Some important questions on skill development beyond the scope of our analysis include TVET systems and the use of technology in education. For example, what are effective models for TVET and higher education that can better guarantee successful skill and labor market outcomes? Under what conditions can technology serve as a democratizer of education that creates more equity in educational inputs? A review of recent literature points to some important issues for future research.
• ForTVET there is a strongneed to get curriculumdesign anddeliveryright.As the costs of public secondary TVET are higher than public secondary general education (some estimates suggest 20-40% higher), there is a need to ensure that either the benefits from returns are also high or to focus on methods for reducing the costs. Offering curricula that develop foundational skills in addition to technical skills so graduates have pathways into higher levels of education, and hiring
8 Key Indicators for Asia and the Pacific 2015 Highlights
teachers with relevant industry experience are examples of promising approaches being implemented in the region. To control costs, the use of technology that can simulate technical processes (such as a virtual-reality welding simulator) and cost-sharing arrangements with industry are being tried.
• Technologycouldprovidealternativeswhenteachereffortandskills are low and aid in cost reductions. When combined with high-quality content that is customized to a level and pace that match student capabilities, technology can enhance educational quality by countering variations in teaching quality and in lower costs of educational delivery. Blended learning, which replaces some traditional classroom time with online interactive content to reduce costs paid for instruction when curricula are more standardized, is one form gaining traction in higher education for developed economies, as it has been shown to have minimal adverse consequences for student learning outcomes.
• Families and firms also need to be involved in the region’s skilldevelopmentagenda.This will be vital for developing the skills that will underpin the region’s path to prosperity. Families play a significant role in the process of skill development by ensuring that their children attend school and taking an active role in their studies. Firms matter as well, and estimates for developed countries suggest that a sizeable portion of skills acquired over the lifetime are learned on the job. But the type of firm in which a worker is employed matters, too. Formal firms using modern technologies and human resource management practices not only demand more skilled workers, they typically also do a better job in developing further the skills of their workers. Finally, competitive product and labor markets and a pro-investment business climate encourage such firms and practices. All these areas lie outside the domain of education policies, but governments with ambitious skill development agendas should not ignore them.
9
Part II: Millennium Development Goals2015 is a milestone year being the closing year of the Millennium Development Goals (MDGs) agenda. The eight MDGs and associated 21 targets on poverty, education, gender equality, child mortality, maternal health, disease, the environment, and global partnership, adopted in September 2000 have guided the development agenda in the last 15 years. Across the Asia and Pacific region, the greatest success has been in reducing extreme poverty, considerable advancement toward enrollment of girls and boys in primary education, and in providing safe drinking water. There has also been good progress in reducing hunger, particularly child malnutrition, and in reducing the deaths of children and mothers, but not sufficient enough to meet the MDG targets.
Despite encouraging progress in attaining many MDG targets, there remains an unfinished agenda due to uneven progress across countries, within countries, and across targets. Emerging issues of rising inequalities and climate change are posing new challenges. While more primary age children are going to school, greater efforts are needed to ensure that they complete primary schooling with quality education, and move on to secondary school. Though gender gaps have narrowed, gender inequalities persist in education, employment and political empowerment. The fight against HIV/AIDS, malaria, tuberculosis, and other diseases has saved many lives, but more needs to be achieved to tackle the disease burden. While forest cover has gone up slightly, carbon dioxide emissions have continued to increase rapidly. Access to safe drinking water has improved rapidly in the region, but progress on access to improved sanitation has been less satisfactory.
As the MDGs era comes to a close, the world has already committed itself to 17 Sustainable Development Goals (SDGs) and 169 targets adopted in September 2015 defining a new global agenda for the next 15 years. The SDGs aspire for an inclusive agenda that promises to leave no one behind and integrates the economic, social, and environmental elements of sustainable development. The MDGs brought data at the center stage of monitoring progress on goals and have provided many lessons for monitoring the progress of the SDGs. Availability of better and more disaggregated data to measure more inclusive development outcomes in the post-2015 era will be a necessity for the success of SDGs.
10 Key Indicators for Asia and the Pacific 2015 Highlights
MDG 1: Eradicate Extreme Poverty and Hunger
• Extreme poverty target has been achieved in most economies in developing Asia with around 950 million people lifted out of extreme poverty between 1990 and 2011, leading to cutting down the proportion of people living on less than $1.25 (2005 purchasing power parity) per day by more than two-thirds.
• Employment opportunities are improving in the Asia and Pacific region with employment-to-population ratios increasing in many economies, but a large workforce remains in low-paying vulnerable jobs in the informal sector in many developing economies.
• The proportion of workers living in extreme poverty is falling, suggesting progress in generating more decent jobs.
• Prevalence of hunger, as measured by the proportion of children under 5 years of age moderately or severely underweight, continues to decline, but remains a serious problem in many economies, with majority of the developing Asian economies unable to meet the hunger target.
MDG 2: Achieve Universal Primary Education
• Significant strides have been made in having primary age children attend school with the region’s net enrollment ratio rising from 86% in 1990 to 95% in 2013.
• Among developing economies where primary age boys had an advantage over girls for schooling in the early 1990s, these gaps have narrowed considerably, with some economies now having gaps slightly in favor of girls.
• The number of out-of-school children of primary school age fell from around 45 million in 1990 to 17 million in 2013. Much of this reduction was achieved by a reduction in the number of out-of-school girls from 31 million to 8 million during the same period.
11Millennium Development Goals
• In only 13 out of 36 economies of developing Asia, 95% or more pupils who started grade 1 are able to reach the last grade of primary schooling, implying continued constraints in achieving universal primary education.
• Since 1990, literacy rates have improved in the region, with gaps falling in literacy rates between young males and young females.
MDG 3: Promote Gender Equality and Empower Women
• Substantial progress has been achieved in narrowing down the gender gaps in education with gender parity having been achieved in almost all economies of developing Asia at the primary level. From around 86 girls enrolled per 100 boys in primary education in 1991 in developing Asia, gender parity has been achieved in the enrollments in 2013.
• Gender gaps have also reduced at the secondary and tertiary levels, with parity ratios exceeding 1.0 in many economies, implying higher enrolment among girls than boys in these economies.
• While women’s access to paid employment in the nonagriculture sector is increasing, it is still low in some developing economies with shares below 20%.
• In terms of political empowerment of women, the proportion of parliamentary seats held by women has increased between 1990 and 2015. However, conditions are far from parity: in a dozen economies of South Asia, Southeast Asia, and the Pacific, the proportions remain below 10%.
MDG 4: Reduce Child Mortality
• Developing Asia has made substantial progress in reducing under-5 mortality by more than half from 90 deaths per 1,000 live births in 1990 to 36 in 2015, but, the region is still behind the MDG target to reduce under-5 mortality by two-thirds of the 1990 rate.
12 Key Indicators for Asia and the Pacific 2015 Highlights
• Deaths of children under the age of 1 year have also reduced substantially, with the infant mortality rates reduced by more than half from 66 to 29 deaths per 1,000 live births between 1990 and 2015.
• Measles vaccination increased significantly with 84% of the children in developing Asia receiving at least one dosage of measles vaccination in 2013 as against 73% in 1990.
MDG 5: Improve Maternal Health
• Developing Asia’s maternal mortality ratio declined by more than half, from 344 in 1990 to 133 per 100,000 live births in 2013, but fell short of the MDG target of three-quarters reduction.
• In more than half of the developing economies of Asia (23 out of 43), more than 95% of the births were attended by skilled health personnel, while in a quarter of economies (11 out of 43) at least a quarter of the births were unattended in recent years.
• In three-fourths of developing economies (35 out of 45), the adolescent birth rate has fallen during the MDG period. In 14 economies, there are at least 50 births per 1,000 women in the age group 15–19 years.
MDG 6: Combat HIV/AIDS, Malaria, and Other Diseases
• In the Asia and Pacific region, the prevalence of HIV among the population aged 15–49 years has declined in economies with the highest rates of infection, but has risen in other economies.
13Millennium Development Goals
• Access to antiretroviral drugs for those with advanced HIV infection has increased in the region, especially in economies with high prevalence rates; however, access to this therapy is still well below the needs.
• About half of the 25 reporting economies have made significant progress in halting the incidence of malaria and associated death rates. In the other economies, malaria remains a severe problem where either the incidence is over 5,000 or the associated death rate is at least 10 per 100,000 population.
• The incidence and prevalence of death rates associated with tuberculosis have declined in the region, with almost all economies having achieved or on track to meet the target.
MDG 7: Ensure Environmental Sustainability
• Forest cover has slightly increased from 21.9% in 1990 to around 22.6% in 2015 in the Asia and Pacific region for the MDG period, with 16 economies recording increases in the proportion of land covered by forests since 1990.
• The region’s carbon dioxide emissions have more than doubled since 1990, with increasing per capita emissions of carbon dioxide in 35 out of 47 of the region’s economies. But per capita emissions remain well below those of developed economies.
• The proportion of people who do not have access to improved drinking water sources has declined to 8% from 29% during the MDG period, with two-thirds of the economies having achieved the MDG target on access to improved drinking water.
• The progress in access to improved sanitation facilities has been less impressive in the region, with more than a third of the population still deprived of clean sanitation facilities.
14 Key Indicators for Asia and the Pacific 2015 Highlights
• From 1990 to 2014, the proportion of the urban population living in slums has declined in all reporting economies of the region, with India, Indonesia, and Viet Nam achieving reductions by more than half from 1990 baselines.
MDG 8: Develop a Global Partnership for Development
• Net official development assistance (ODA), as percentage of gross national income (GNI), exceeded 0.7% for only five OECD Development Assistance Committee countries in 2014 and net ODA to least-developed countries as a proportion of their GNI has declined in most landlocked and small island economies.
• Access to mobile-cellular phones has risen phenomenally in the Asia and Pacific region, with 3.7 billion mobile subscriptions in 2014 compared with 1.6 million in 1990 and 222 million in 2000.
• Internet access has also increased significantly in the region, but there are wide gaps across economies with more than one-third of the economies in the Asia and Pacific region still having internet access below 20%.
15
Part III: Region at a GlanceMore than half of the world’s population lives in the Asia and Pacific region. The region is also home to six of the 10 most populous economies in the world, and 12 of the 23 most populous cities. In 2014, gross domestic product (GDP) growth accelerated in just over half of Asia and Pacific economies. Asia and the Pacific now accounts for more than 40% of global GDP, in purchasing power parity terms, and about one-third of the world’s merchandise exports.
Quality of life, as measured by the Human Development Index, continues to improve in most of the region. Inflation generally remained low across Asia and the Pacific in 2014 as declining energy prices eased pressure on consumer prices. Average time taken to start a business and the cost of registering a new business have also been declining across the region. In an increasing number of economies, the services sector has become an important contributor to growth as structural changes and declining labor intensity in agriculture and manufacturing have channeled more workers into services.
Rapid development and an expanding role in the global economy are also bringing new challenges to the region. Asia and the Pacific now consumes more than 40% of the world’s energy and is also facing increased emissions of greenhouse gases and other pollutants, alongside increased consumption of scarce resources. Furthermore, corruption is hindering development, with half of the region’s economies falling into the bottom one-third of Transparency International’s global corruption rankings.
The Regional Trends and Tables are grouped into eight themes, each of which has a brief analysis of key trends of selected indicators highlighting important recent developments:
16 Key Indicators for Asia and the Pacific 2015 Highlights
People
• Asia and the Pacific accounts for nearly 55% of the global population and six of the world’s 10 most populous economies. The region’s population is forecasted to reach 5.3 billion in 2050. India’s population is expected to surpass that of the People’s Republic of China (PRC) in the next 7 years.
• Population growth and fertility rates have slowed in most economies. The region’s population is aging, which will have major implications for economic growth. An aging population will tend to lower labor-force participation and increase age dependency with a larger part of the population becoming economically inactive yet continuously requiring social services.
• The rate of urbanization is increasing in most of the region. Asia is home to 12 of the world’s 23 biggest cities and eight of the 10 most densely populated cities.
• Based on the United Nations Development Programme’s Human Development Index, about half of developing member economies are in the “medium human development” category, and all but two have shown improvements in quality-of-life indicators since 2000.
Economy and Output
• In purchasing power parity terms, Asia and the Pacific generated more than 40% of global GDP in 2014. The PRC and India accounted for nearly 70% of the region’s output.
• GDP growth accelerated in slightly more than half of the region’s economies in 2014.
• The role of services has expanded in about 80% of the Asia and Pacific region since 2000 and now accounts for at least half of GDP in nearly two-thirds of the region’s reporting economies.
17Region at a Glance
• Between 2000 and 2014, the share of agriculture in GDP fell in all but seven of the region’s 47 reporting economies. During the same period, the share of industry in GDP rose in slightly less than half of the region’s economies.
• Between 2000 and 2014, or the latest year for which data are available, investment spending as a share of GDP increased in two-thirds of the region’s reporting economies, household consumption spending as a share of GDP declined in two-thirds of the region’s reporting economies, government consumption expenditure relative to GDP increased in slightly more than half of the region’s reporting economies, and gross domestic saving as a share of GDP increased in more than two-thirds of the region’s reporting economies.
Money, Finance, and Prices
• Inflation generally remained low across Asia and the Pacific in 2014 as declining oil prices took pressure off of consumer prices.
• The exchange rates of 35 out of 44 regional currencies depreciated against the US dollar in 2014.
• Growth in the money supply slowed in most of the region’s economies.
• The ratio of nonperforming loans to total gross loans declined in about half of the reporting economies in the region between 2013 and 2014.
• Stock market performances were largely positive across the region in 2014.
18 Key Indicators for Asia and the Pacific 2015 Highlights
Globalization
• Asia and the Pacific accounted for about one-third of the world’s merchandise exports in 2014, up from about one-quarter in 2001. Merchandise export growth slowed and merchandise import growth was negative in the region in 2014.
• Intraregional trade comprised the majority of the region’s exports and imports in 2014.
• The share of GDP generated by remittances of migrant workers has increased in more than three-quarters of the region’s economies since 2000.
• More than 60% of the region’s economies recorded current account deficits in 2013–2014, or the most recent 2 years for which data are available.
• External debt, as a percentage of gross national income, fell in more than half of the region’s economies between 2000 and 2013.
Transport and Communications
• The share of Primary and Class I roads in highway networks in Asia and the Pacific increased from 12% to 32% between 2004 and 2012.
• The number of vehicles has surged in the region. Nineteen economies have at least 100 vehicles per 1,000 people. The increase in the number of registered motor vehicles in many developing economies has been accompanied by a relatively high incidence of fatal road accidents.
• The region’s rail networks are heavily concentrated in three economies—the PRC, India, and Japan.
19Region at a Glance
• The number of mobile phone subscriptions per 100 people rose in all but three economies in Asia and the Pacific between 2010 and 2014.
• Fixed broadband internet penetration rates have increased throughout the region, but remain low in many economies.
Energy and Electricity
• Per capita electricity consumption rose by at least 200% in 16 developing member economies between 1990 and 2012, or the first and last years for which data are available.
• Asia and the Pacific accounts for more than 40% of global energy demand.
• Most economies in the region rely on energy imports. The four biggest energy users—the PRC, India, Japan, and the Republic of Korea—have all increased their dependence on energy imports since 2000.
• Six economies in Asia subsidize fossil fuels by more than 25% of the supply cost. At the same time, energy efficiency—as measured by GDP per unit of energy used—improved in 24 out of 30 economies between 2000 and 2012.
Environment
• Asia’s economic development has led to increased emissions of greenhouse gases.
• Between 2000 and 2012, almost half of the economies in the region expanded the amount of land devoted to agriculture.
• Four of the 10 economies with the highest rates of deforestation in 2012 were located in Southeast Asia.
20 Key Indicators for Asia and the Pacific 2015 Highlights
• The percentage of agricultural nitrous oxide emissions as a share of total nitrous oxide emissions increased in nearly two-thirds of the region’s economies between 1990 and 2010, while the percentage of agricultural methane emissions as a share of total methane emissions decreased in three-quarters of the region’s economies between 1990 and 2010.
Government and Governance
• All economies in Southeast Asia, a majority of economies in South Asia and Central and West Asia, and about half of the economies in East Asia and the Pacific ran fiscal deficits in 2014.
• Government expenditure decreased relative to GDP in a majority of economies in East Asia, South Asia, and Southeast Asia in 2014; and increased in a majority of economies in the Pacific and all but one economy in Central and West Asia.
• Government spending on health, social security, and welfare increased as a percentage of GDP in most economies between 2000 and 2014.
• Among developing member economies, the average time required to start a business has fallen from 47 days in 2005 to 26 days in 2014. The average cost of starting a business among all developing member economies—in terms of per capita gross national income—was more than halved between 2005 and 2014.
• Only eight out of 32 developing member economies in Asia scored 50 or higher on a scale of 0 (highly corrupt) to 100 (very clean) in Transparency International’s 2014 Corruption Perceptions Index.
21
Part IV: Global Value ChainsAs production processes are increasingly fragmented and distributed across economies, a growing amount of trade is taking place within so-called global value chains (GVCs). Traditional trade statistics do not fully capture the increasingly complex trade relationships across economies. To better understand these, it has become necessary to examine the export structure of an economy in terms of foreign and domestic value added components of trade, as well as “double counted” components brought about by back and forth trade in intermediate goods and services. The resulting statistics—which we refer to as GVC statistics—can provide crucial information for policy making. ADB has increased the granularity of existing GVC statistics and extended them to cover more Asian economies.
• Asian economies participation in GVCs exceeds that of most other regions. In 2011, foreign value added as a share of exports was 19% in Asia and the Pacific, slightly below the level of Europe, but above that of North and South America.
• The extent of GVC participation varies widely across Asian economies. In the Republic of Korea and Taipei,China, the share of foreign value added in exports was 30% in 2011, while the developing member average was 19%.
• Closely associated with GVC development, regional economies’ back-and-forth trade increased between 2000 to 2011, led by the Republic of Korea and Taipei,China.
• Indirect exports, as measured by the value added contributed by a sector to the exports of other sectors, account for about half of the total value added of regional members’ exports.
22 Key Indicators for Asia and the Pacific 2015 Highlights
• Specialization in export industries varies widely across Asian economies: East Asia leads in medium- and high-technology manufacturing; Indonesia and Viet Nam in the primary sector; and India, the Philippines, and Thailand in business services.
• The revealed comparative advantage indicator, in value-added-terms, confirms the comparative advantage of Japan; the Republic of Korea; and Taipei,China in medium- and high-technology industries. In low-technology industries, the PRC, the Philippines, Thailand, and Viet Nam show a clear comparative advantage. Primary industries hold an advantage in Indonesia and Viet Nam.