Embed Size (px)
Citation preview
Further information
05 06 07 08 09
134.5
149.4
173.0 174.9179.8
05 06 07 08 09
18.016.9
15.6 15.2 14.3
>$1m >$5m >$10m
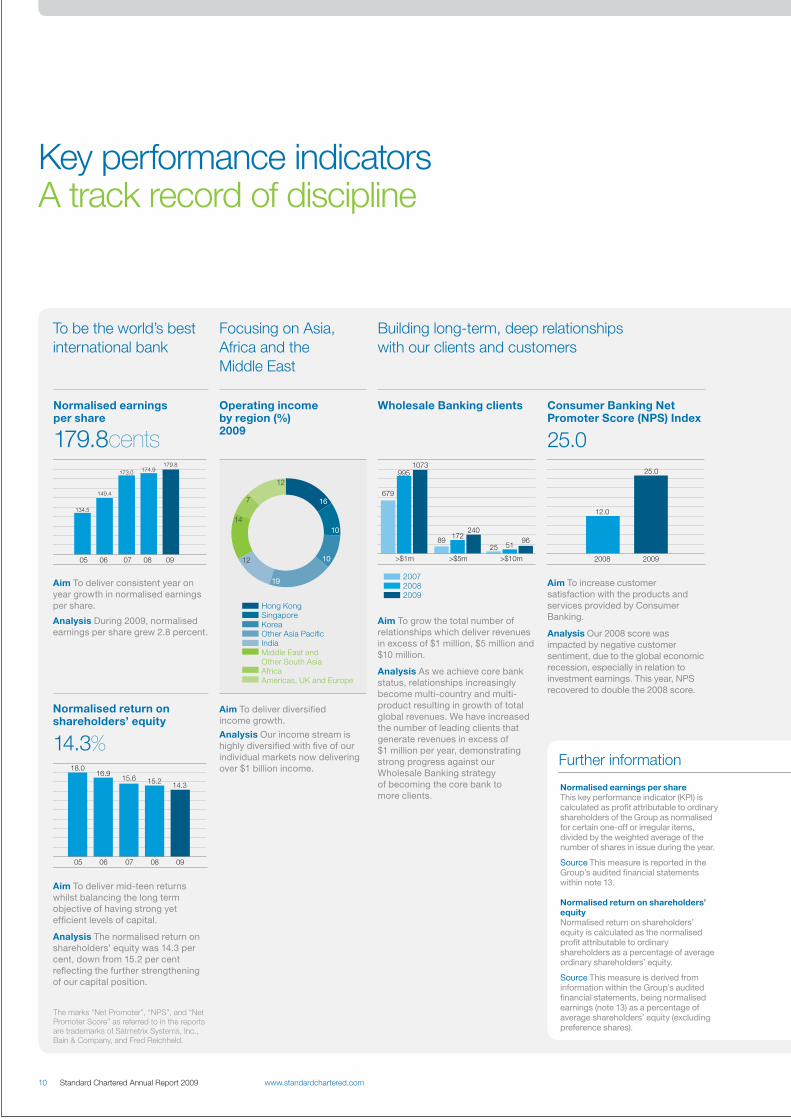
679
9951073
89172
240
25 5196
2008 2009
12.0
25.0
16
10
19
12
14
12
7
10
Hong KongSingaporeKoreaOther Asia PacificIndiaMiddle East and Other South AsiaAfricaAmericas, UK and Europe
Normalised earnings per shareThis key performance indicator (KPI) is calculated as profit attributable to ordinary shareholders of the Group as normalised for certain one-off or irregular items, divided by the weighted average of the number of shares in issue during the year.
Source This measure is reported in the Group’s audited financial statements within note 13.
Normalised return on shareholders’ equityNormalised return on shareholders’ equity is calculated as the normalised profit attributable to ordinary shareholders as a percentage of average ordinary shareholders’ equity.
Source This measure is derived from information within the Group’s audited financial statements, being normalised earnings (note 13) as a percentage of average shareholders’ equity (excluding preference shares).
200720082009
10 Standard Chartered Annual Report 2009 www.standardchartered.com
Key performance indicatorsA track record of discipline
Aim To deliver consistent year on year growth in normalised earnings per share.
Analysis During 2009, normalised earnings per share grew 2.8 percent.
Aim To deliver mid-teen returns whilst balancing the long term objective of having strong yet efficient levels of capital.
Analysis The normalised return on shareholders’ equity was 14.3 per cent, down from 15.2 per cent reflecting the further strengthening of our capital position.
Aim To deliver diversified income growth.
Analysis Our income stream is highly diversified with five of our individual markets now delivering over $1 billion income.
Aim To grow the total number of relationships which deliver revenues in excess of $1 million, $5 million and $10 million.
Analysis As we achieve core bank status, relationships increasingly become multi-country and multi-product resulting in growth of total global revenues. We have increased the number of leading clients that generate revenues in excess of $1 million per year, demonstrating strong progress against our Wholesale Banking strategy of becoming the core bank to more clients.
Aim To increase customer satisfaction with the products and services provided by Consumer Banking.
Analysis Our 2008 score was impacted by negative customer sentiment, due to the global economic recession, especially in relation to investment earnings. This year, NPS recovered to double the 2008 score.
Normalised earnings per share
179.8cents
Normalised return on shareholders’ equity
14.3%
Operating income by region (%) 2009
Wholesale Banking clients Consumer Banking Net Promoter Score (NPS) Index
25.0
To be the world’s best international bank
Focusing on Asia, Africa and the Middle East
Building long-term, deep relationships with our clients and customers
The marks “Net Promoter”, “NPS”, and “Net Promoter Score” as referred to in the reports are trademarks of Satmetrix Systems, Inc., Bain & Company, and Fred Reichheld.
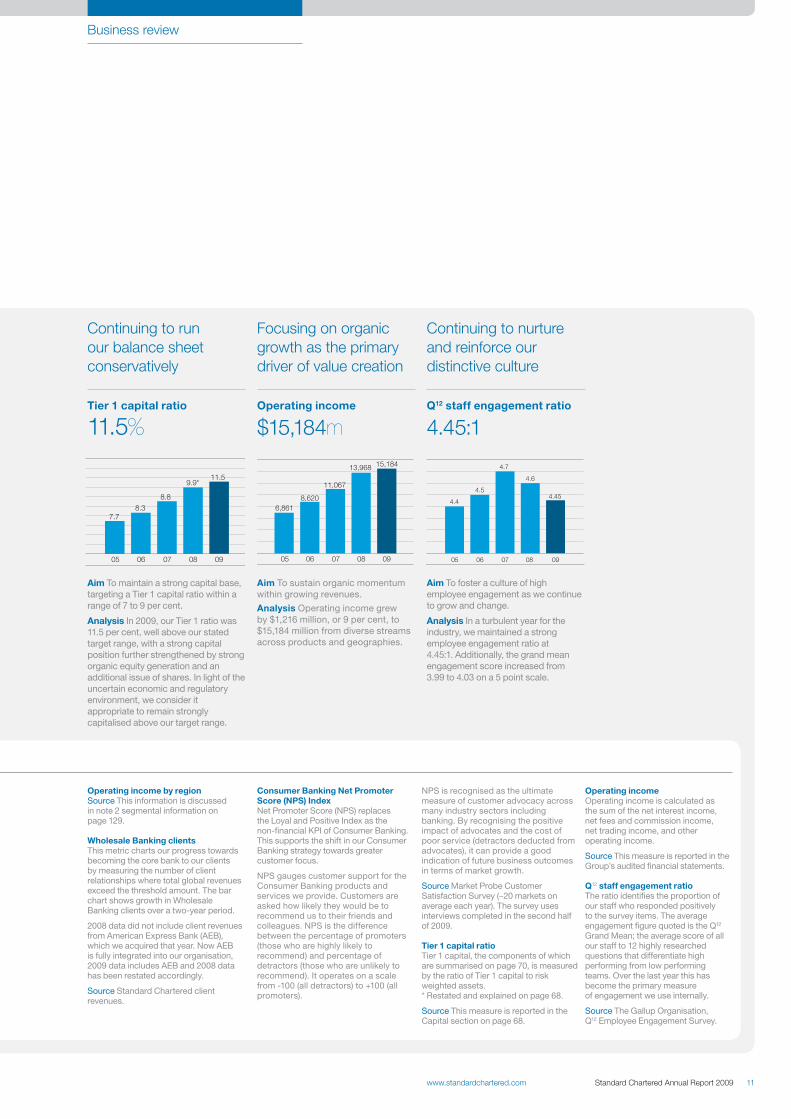
05 06 07 08 09
11.59.9*
8.8
8.37.7
05 06 07 08 09
6,8618,620
11,067
13,968 15,184
4.4
4.5
4.7
4.6
4.45
05 06 07 08 09
Further information
Operating income by regionSource This information is discussed in note 2 segmental information on page 129.
Wholesale Banking clientsThis metric charts our progress towards becoming the core bank to our clients by measuring the number of client relationships where total global revenues exceed the threshold amount. The bar chart shows growth in Wholesale Banking clients over a two-year period.
2008 data did not include client revenues from American Express Bank (AEB), which we acquired that year. Now AEB is fully integrated into our organisation, 2009 data includes AEB and 2008 data has been restated accordingly.
Source Standard Chartered client revenues.
Consumer Banking Net Promoter Score (NPS) IndexNet Promoter Score (NPS) replaces the Loyal and Positive Index as the non-financial KPI of Consumer Banking. This supports the shift in our Consumer Banking strategy towards greater customer focus.
NPS gauges customer support for the Consumer Banking products and services we provide. Customers are asked how likely they would be to recommend us to their friends and colleagues. NPS is the difference between the percentage of promoters (those who are highly likely to recommend) and percentage of detractors (those who are unlikely to recommend). It operates on a scale from -100 (all detractors) to +100 (all promoters).
NPS is recognised as the ultimate measure of customer advocacy across many industry sectors including banking. By recognising the positive impact of advocates and the cost of poor service (detractors deducted from advocates), it can provide a good indication of future business outcomes in terms of market growth.
Source Market Probe Customer Satisfaction Survey (~20 markets on average each year). The survey uses interviews completed in the second half of 2009.
Tier 1 capital ratioTier 1 capital, the components of which are summarised on page 70, is measured by the ratio of Tier 1 capital to risk weighted assets.* Restated and explained on page 68.
Source This measure is reported in theCapital section on page 68.
Operating incomeOperating income is calculated as the sum of the net interest income, net fees and commission income, net trading income, and other operating income.
Source This measure is reported in the Group’s audited financial statements.
Q12 staff engagement ratioThe ratio identifies the proportion of our staff who responded positively to the survey items. The average engagement figure quoted is the Q12 Grand Mean; the average score of all our staff to 12 highly researched questions that differentiate high performing from low performing teams. Over the last year this has become the primary measure of engagement we use internally.
Source The Gallup Organisation, Q12 Employee Engagement Survey.
www.standardchartered.com Standard Chartered Annual Report 2009 11
Business review
Continuing to run our balance sheet conservatively
Focusing on organic growth as the primary driver of value creation
Continuing to nurture and reinforce our distinctive culture
Tier 1 capital ratio
11.5%Operating income
$15,184mQ12 staff engagement ratio
4.45:1
Aim To maintain a strong capital base, targeting a Tier 1 capital ratio within a range of 7 to 9 per cent.
Analysis In 2009, our Tier 1 ratio was 11.5 per cent, well above our stated target range, with a strong capital position further strengthened by strong organic equity generation and an additional issue of shares. In light of the uncertain economic and regulatory environment, we consider it appropriate to remain strongly capitalised above our target range.
Aim To sustain organic momentum within growing revenues.
Analysis Operating income grew by $1,216 million, or 9 per cent, to $15,184 million from diverse streams across products and geographies.
Aim To foster a culture of high employee engagement as we continue to grow and change.
Analysis In a turbulent year for the industry, we maintained a strong employee engagement ratio at 4.45:1. Additionally, the grand mean engagement score increased from 3.99 to 4.03 on a 5 point scale.