Embed Size (px)
Citation preview

Key Performance Indicators in EMS 1
Running head: Key Performance Indicators in EMS
Developing Key Performance Indicators to
Improve Patient Care and Outcome at Littleton Fire Rescue
Wayne M. Zygowicz
Littleton Fire Rescue, Littleton, Colorado

Key Performance Indicators in EMS 2
CERTIFICATION STATEMENT
I hereby certify that this paper constitutes my own product, that where the language of others is set forth, quotation marks so indicate, and that appropriate credit is given where I have used the language, ideas, expressions, or writings of another. Signed: ____________________________________________

Key Performance Indicators in EMS 3
Abstract
The problem was Littleton Fire Rescue (LFR) could not measure the effectiveness of its
emergency medical services (EMS) and prove the fire department’s patient care was positively
influencing patient outcomes. Antidotal evidence indicated the fire department was providing
excellent medical treatment but no key performance indicators (KPI) were developed to prove or
disprove this theory. The purpose of this evaluative research was to investigate KPIs in EMS and
develop measurable service delivery standards to evaluate the effectiveness of medical treatment
provided by LFR. The following research questions were answered in the development of KPIs:
a) What measureable performance indicators were used to evaluate the effectiveness of an EMS
system? b) How do performance indicators improve patient care and outcome? and c) What
methods are used by other EMS system to measure performance? Three research procedures
produced results on KPIs in EMS. Procedures included a retrospective analysis of LFR’s incident
data, personal interviews and a national survey. Results proved that LFR was providing effective
medical treatment that directly influenced patient outcomes and reduced mortality. Results also
discovered treatment areas that needed improvement. Clinical and operational recommendations
resulted from this study. Clinical recommendations included reducing scene time, improving
treatment for cardiac patients, benchmarking reperfusion time, increasing cardiac arrest survival
rates and improving treatment for patients in pain. Operational recommendations included
developing non-clinical KPIs, improving individual paramedic performance, educating LFR’s
workforce on KPIs, improving EMS documentation and gathering patient satisfaction data
through a customer survey.

Key Performance Indicators in EMS 4
Table of Contents
Abstract ………………………………………………………………………………………….. 3
Table of Contents ………………………………………………………………...……………… 4
Introduction ……………………………………………………………………………………… 5
Background and Significance …………………………………………………………….………6
Literature Review ……………………………………………………………………………...…8
Procedures………………………………………………………………………………….…….20
Results ……………………………………………………………………………………..…….21
Discussion …………………………………………………………………………………. ……27
Recommendations ………………………………………………………………………….……33
References …………………………………………………………………………….........……37
Appendices
Appendix A: Littleton Fire Rescue KPI Data Analysis Areas……………………………..........40
Appendix B: Medical Director Interview Questions …………………………………………...41
Appendix C: National Key Performance Indicator Survey Questions………………………….42
Appendix D: Results – Littleton Fire Rescue KPI Data Analysis………………………………43
Appendix E: Results - National KPI Survey Questions…………………………………………47

Key Performance Indicators in EMS 5
Developing Key Performance Indicators to Improve Patient Care and Outcome at Littleton Fire Rescue
Introduction
Littleton Fire Rescue (LFR) had been providing emergency medical services (EMS) at the
advanced life support level to citizens of the Littleton community since 1974. Littleton’s EMS
deployment strategy used experienced and well trained firefighter/paramedics using state of the
art medical equipment to provide timely medical care.
The problem was LFR could not measure the effectiveness of its emergency medical
services and prove their impact on patient outcome. Antidotal evidence indicated the fire
department was providing high quality effective emergency medical care but no key performance
indicators (KPI) had been developed to measure the systems effectiveness and prove or disprove
this theory.
The purpose of this applied research project was to investigate and develop KPIs to
measure, evaluate and benchmark the effectiveness of LFR’s EMS system on patient outcomes.
The reason for developing KPIs was to improve patient care and make certain LFR was
providing the highest level of effective medical care that would reduce injuries and death.
This applied research project used evaluative research methodology to investigate KPIs
in EMS and develop measurable service delivery standards to improve patient care and outcome.
The following research questions were answered to assist in developing new KPIs and
measurable EMS standards for LFR: a) What measurable performance indicators were used to
evaluate the effectiveness of an EMS system? b) How do performance indicators improve patient
care and outcome? and c) What methods are used by other EMS systems to measure
performance?

Key Performance Indicators in EMS 6
Background and Significance
Founded in 1890, Littleton Fire Rescue (LFR) had provided fire suppression and
emergency services to the City of Littleton, Colorado and surrounding communities for the past
120 years. The fire department protected 225,000 residents from eight fire stations within its 92
square mile fire district. LFR employed 125 cross-trained-dual-role career firefighters who were
trained as emergency medical technicians. Half of the firefighters were trained to the advanced
life support level of paramedic. LFR responded to 12,187 incidents in 2009 and 67% were EMS
calls (“Annual Report,” 2009). LFR provided advanced life support care with paramedic/
firefighters responding on each of the seven engine companies, one ladder truck and five
transport ambulances.
LFR’s Deputy Chief Pete Cernich developed Littleton’s paramedic program in
conjunction with a local trauma center in 1974. 14 Littleton firefighters attended paramedic
school at Swedish Medical Center in Englewood, Colorado even before there was an official
paramedic certification program or published paramedic text books. These fledgling paramedic
firefighters graduated as the first official paramedics in the State of Colorado. LFR was one of
the first fire based EMS systems in the country.
LFR has a long history of providing high quality effective EMS using state-of-the-art
medical equipment. The fire department was known locally, regionally and nationally for
outstanding patient care and excellent customer service. LFR was featured in national EMS
publications as leaders and innovators in EMS. LFR was the first EMS system to use advanced
cardiac monitors, automated CPR machines and induced hypothermia in cardiac arrest. LFR was
only one of two EMS systems nationwide to use portable ultrasound machines in the ambulance
during transport to diagnosis internal bleeding in trauma patients. The fire department gained

Key Performance Indicators in EMS 7
national notoriety in 1999 during the Columbine High School shooting. The medical care
provided by LFR was credited with saving lives during the shooting incident.
The problem was LFR could not measure the effectiveness of its emergency medical
services and prove their impact on patient outcomes. Since the inception of the paramedic
program LFR had received numerous thank you letters, cards and visits from survivors and their
families after emergency care resulted in a “save” or positive patient outcome. While antidotal
evidence indicated LFR was providing excellent medical care no quantifiable performance
indicators existed to prove or disprove this assumption.
This is a serious problem because without key performance indicators (KPI) to measure
and benchmark performance there was no quantitative method to prove LFR’s medical care was
reducing injuries and death. LFR’s operational mission is to provide the citizens with emergency
response services and life safety education programs that minimized the loss of life and property
from fires, medical emergencies and hazardous conditions (“Annual Report,” 2009).
The impact of the problem could increase mortality or adverse outcomes for LFR
customers. KPIs will closely examine the quality of the medical services provided by LFR and
performance data benchmarks will improve patient care.
As the EMS Chief for LFR and an Executive Fire Officer candidate, it is this researcher’s
responsibility to guarantee that LFR’s patients are receiving the most effective and efficient
emergency medical care possible at the most reasonable cost. This researcher must find ways to
reduce organizational liability through EMS system quality improvement processes and
paramedic over site. The development of KPIs to analyze and benchmark performance will help
meet those objectives. This problem had never been studied in the 37 years that LFR had been
providing advanced life support care.

Key Performance Indicators in EMS 8
This applied research project was directly related to the National Fire Academy’s
Executive Leadership course, unit 5, managing multiple roles. As an Executive Fire Officer it is
this researcher’s responsibility to measure and improve EMS system performance to reduce
injuries and death. One of Mintberg’s ten roles of a successful manager is to be an entrepreneur.
An entrepreneur is a person who is continually “improving their organization, making the
necessary changes to meet new needs and demands (ED-Student Manual, 2005, p.SM 5-3).” This
problem was linked directly to the United States Fire Administration’s (USFA) strategic plan and
operational objective number one; reduce risk at the local level through planning and mitigation
(USFA Web page, 2010). By developing KPIs to measure, analyze and benchmark EMS system
effectiveness this researcher hopes to reduce community risk and adverse patient outcomes.
Literature Review
A literature search was conducted to acquire information from the existing body of
knowledge on key performance indicators (KPI). The literature review began in the Learning
Resource Center at the National Fire Academy in April, 2010 to locate Executive Fire Officer
(EFO) research papers, publications and other resources related to KPIs in emergency medical
services (EMS). Key terms used in the search were emergency medical services, performance
indicators, clinical success indicators, quality assurance, performance improvement, paramedics
and patient outcome. The search was expanded to the Internet in May, June and July, 2010.
Books, journal articles and one EFO paper were located to answer the first research
questions on what measurable performance indicators were used to evaluate the effectiveness of
an EMS system.
KPIs, also referred to as key success indicators (KSI), are a measurement of
organizational success. Wikipedia (Anonymous) defines a KPI as a measurement of performance
Key Performance Indicators in EMS 9
used to help organizations define and evaluate how successful they were in making progress
toward long-term goals and objectives. The operational mission and goals of LFR were to
provide the citizens with emergency response services that minimized the loss of life and
property from fires, medical emergencies and hazardous conditions.
KPIs are used to value difficult to measure activities such as customer satisfaction or
service. A KPI should be understood and accepted by all stakeholders, meaningful and
measurable. Historically few KPIs have been developed in EMS due largely in part to limited
quality and quantity of data and a lack of pre-hospital research. EMS systems have used response
time intervals and cardiac arrest survival rates as KPIs.
Swor & Pirrallo (2005) stressed the importance of developing KPIs for EMS in their
book Improving Quality in EMS. KPIs allow government officials to use objective system data to
establish policy, select EMS system design and monitor system performance for quality and
effectiveness. The public and other stakeholders expect EMS managers to be accountable for
system performance. KPIs help managers provide continuous quality system improvement,
identify areas of excellence, highlight sentinel events, monitor corrective action and compare
performance to established standards.
Swor &Pirrallo used three fundamental terms (performance indicators, performance
measurements and benchmarking) when evaluating EMS system performance. Performance
indicators are used to answer the question "How are we doing?" in making progress toward
achieving the mission and goals of the EMS system. Performance measurements are used to
quantify EMS system accomplishments through benchmarking. Benchmarking is a baseline used
to evaluate performance of a program or service according to the indicators that have been
established.

Key Performance Indicators in EMS 10
In 2007 the National Highway Traffic Safety Administration (NHTSA) in partnership
with the National Association of State EMS Officials and the National Association of EMS
Physicians completed a five year KPI project call the EMS Performance Measures Project. The
goal of the project was to develop performance measurements to help local EMS systems
measure, evaluate and benchmark system performance. Another objective was to establish
common measurements nationwide. NHTSA advocated establishing a baseline or “benchmark”
set of performance measurements that should be analyzed over a timeline to monitor and
improve system performance. NHTSA emphasized that performance measurements should be
assessed on a regular basis to improve overall system performance focusing on continual
improvement to deliver quality service to the public (NHTSA, 2009).
The project’s steering committee originally recommended over 100 performance
indicators but narrowed the list to 25. NHTSA recommended measuring KPIs regularly and the
rise or fall of these indicators would reveal performance trends. The 25 EMS system
performance indicators and attributes recommended by NHTSA were:
1. Which Emergency Medical Dispatch Protocol Reference System (EMDPRS) does the
EMS dispatch center use? APCO, Medical Priority Dispatch System, Power Phone,
Other, None
2. Does your agency base its 'lights-and-sirens use response mode on the EMDPRS it uses?
3. Does your agency base its response level (ALS/BLS) dispatch on the EMDPRS it uses?
4. What is the turnover rate for EMS providers?
5. In cardiac arrest occurring prior to EMS arrival where defibrillation is attempted, what is
the mean time and 90th percentile time from the public safety answering point (PSAP)
contact to the initial defibrillation?

Key Performance Indicators in EMS 11
6. In cardiac arrest occurring prior to EMS arrival where an EKG is obtained, what are the
mean time and the 90th percentile time from PSAP contact to initial analysis of rhythm?
7. What percentages of patients meet the 2006 CDC/ACS field triage criteria for transfer to
a trauma center are transported to a trauma center?
8. Comparing first and last pain scale values, what percentage of patients older than 13
years of age reported decreased pain, increased pain or no change in pain?
9. What percentage of patients older than 13 reporting a pain value of seven or greater on a
0-10 scale received subsequent interventions associated with pain relief?
10. What percentage of patients over the age of 35 with suspected cardiac chest pain
received a 12-lead EKG?
11. What percentage of patients over the age of 35 with suspected cardiac chest pain
received aspirin?
12. What percentages of patients with a field 12-lead EKG indicating ST-elevation
myocardial infarction (STEMI) were transported to hospital with emergency
interventional cardiac catheterization capabilities?
13. What are the mean and 90th percentile emergency patient response time intervals?
14. What are the mean and 90th percentile emergency scene time intervals?
15. What are the mean and 90th percentile emergency transport time intervals?
16. What is the total EMS cost per capita?
17. What percentages of patients were satisfied with their EMS experience?
18. What percentage of patients does your agency/system survey to measure patient
satisfaction?

Key Performance Indicators in EMS 12
19. What percentage of patients in respiratory arrest/distress received oxygen?
20. What is the rate of undetected esophageal intubation?
21. What is the rate of EMS crashes per 1,000 responses?
22. What is the rate of EMS crashes per 100,000 fleet miles?
23. What is the rate of injuries and deaths because of EMS crashes per 100,000 fleet miles?
24. What are the number and distribution of primary complaints to which EMS responds?
25. What percentage of patients experiencing cardiac arrest after EMS arrival survives to
discharge from the emergency department and discharge from the hospital?
In 2007 the U.S. Metropolitan Municipalities EMS Medical Directors Consortium
developed evidence based performance measures to serve as a model to improve EMS system
performance and enhance system benchmarking. Meyers et al. (2008) proposed evidenced-based
KPIs that had a quantifiable impact on clinical outcomes for patients in large urban and suburban
EMS systems.
Meyers et al. recommended an evidence based model of measuring system performance
centered on six KPI areas that have proven scientific evidence to support improved patient
outcomes. The six clinical performance areas were management of ST-elevation myocardial
infarction (STEMI), treatment of pulmonary edema, asthma, seizure, trauma and cardiac arrest.
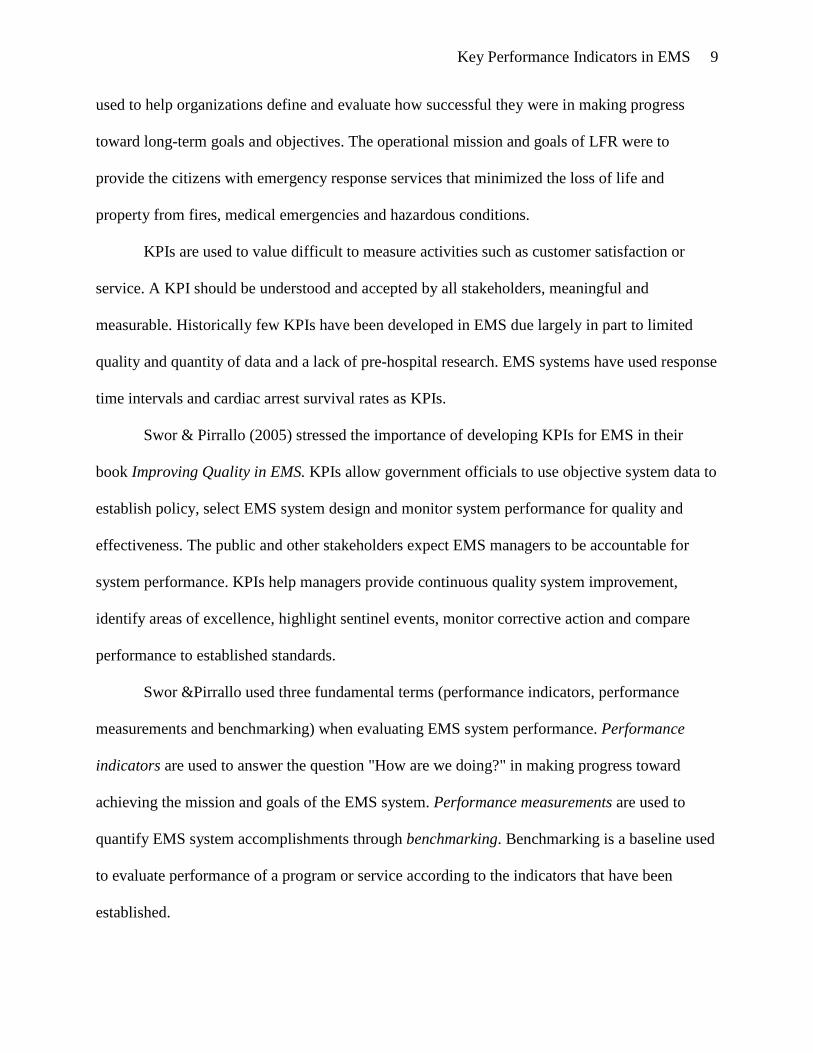
Each of the six clinical treatment areas had a defined treatment bundle or patient
management strategy. Benefits from each element of the treatment bundle were only realized
when all elements of the management strategy were completed together. The six key treatment
areas with KPIs defined by Meyers et al. were:
Key Performance Indicators in EMS 13
1. ST-Elevation Myocardial Infarction (STEMI)
a. Aspirin administration, if not allergic
b. 12-Lead EKG with pre-arrival activation of an interventional cardiology team
c. Direct transport to a coronary intervention facility capable of reperfusion in < 90
minutes
2. Pulmonary edema
a. Nitroglycerin administration in the absence of contraindications
b. Noninvasive positive pressure ventilations over endotracheal intubation
3. Asthma
a. Administration of a beta-agonist
4. Seizure
a. Blood glucose measurement
b. Benzodiazepine given for status seizures
5. Trauma
a. Limit non-entrapment scene time to < 10 minutes
b. Direct transport to a trauma center for those meeting criteria, particularly those
over 65

Key Performance Indicators in EMS 14
6. Cardiac arrest
a. Response interval < 5 minutes for basic CPR and automated external defibrillators
Colwell et al. (2006) developed KPIs for patients with non-traumatic chest pain to
determine if paramedics in Denver, Colorado were delivering quality comprehensive care. A
treatment bundle scoring system was developed to grade the completeness of chest pain
treatment. The treatment bundle’s KPIs were oxygen, aspirin administration, lung sound
assessment, vital signs, intravenous line establishment, EKG readings and cardiac risk factor
assessment. The bundle score was considered unmet if any single element of the treatment
bundle was not recorded. Colwell et al. discovered that while compliance with individual
elements of the treatment bundle was generally good the comprehensive composite score was
poor (39%). Colwell et al. concluded that;
Quality-of-care measures, similar to those used for evaluating in-hospital care, can
successfully be created and applied to pre-hospital emergency care. Pre-hospital care of
patients with non-traumatic chest pain is not uniform and there is an opportunity for
quality improvement measures targeted at improving the comprehensive care rendered to
these patients (Colwell et al., 2006).
In summary, after an examination of the literature, it was discovered that there were
clinical and operational KPIs developed to benchmark and improve EMS system performance.
KPIs that improved patient outcomes and reduce mortality were the focus of this research.
The second research question examined how performance indicators improved patient
care and outcomes? A search of the literature found research studies that had scientific evidence
supporting improved patient outcomes.

Key Performance Indicators in EMS 15
For years response time data had been used as a KPI to benchmark performance of fire
and EMS agencies national wide. After extensive research it was discovered that there were no
federal or state laws that mandate a specific response time for fire suppression or medical care.
The National Fire Protection Agency (NFPA) recommended a response time interval for
EMS incidents in NFPA Standard 1710, Standard for the Organization and Deployment of Fire
Suppression Operations, Emergency Medical Operations, and Special Operations to the Public
by Career Fire Departments. NFPA 1710 defined response time as the travel time that begins
when units were en route to the emergency incident and ends when units arrived at the scene.
NFPA recommended a four minute or less response time for responders with a defibrillator and
eight minutes or less for advanced life support (ALS) responders. An additional one minute call
processing time was not included in their response time recommendations. NFPA suggested
these response time objectives be met 90% of the time (NFPA, 2010).
Pons et al. (2005) studied the four minute and eight minute response time interval on
patient outcomes in Denver, Colorado. The objective of the study was to evaluate the
effectiveness of the four and eight minute response time interval on survival to hospital discharge
in unselected patients. Pons et al. concluded, after retrospectively reviewing 9,559 patient
transport records, that a “paramedic response time within eight minutes was not associated with
improved survival to hospital discharge after controlling several important confounders,
including level of illness. However, a survival benefit was identified when the response time was
less than or equal to four minutes with intermediate or high risk mortality (Pons et al., 2005).”
Pons et al. concluded that the eight minute response time guideline did not improve
patient outcomes and was not supported by the study results. They stressed the importance of
identifying patients who may benefit from shorter response times, besides those in cardiac arrest.
Key Performance Indicators in EMS 16
This was ultimately required to provide both effective and safe out-of-hospital care. The study
also suggested a better measurement of EMS system performance was from the customer’s
perspective. They recommended measuring response time from notification of the PSAP to
treatment intervention. This time measurement, from onset of the symptoms to intervention, was
more important to the customer and was a better benchmark of overall system performance.
A notable and significant response time interval that directly improved patient outcome
was a rapid response to patients in cardiac arrest. Survival depends on a speedy response by
paramedics to change the patient’s heart rhythm from ventricular fibrillation or pulse-less
ventricular tachycardia. Both are fatal heart rhythms. The American Heart Association (AHA)
emphasized that early defibrillation and early ALS care by paramedics will improve patient
survival. The AHA noted that brain death, or permanent irreversible death, begins within 4-6
minutes after cardiac arrest. Cardiac arrest can be reversed by a timely electrical shock from a
defibrillator and early ALS interventions by a paramedic. AHA recommended starting CPR
immediately with defibrillation administered within three to five minutes after collapse to reduce
mortality from sudden cardiac arrest (AHA, 2010).
KPIs were discovered that improved patient outcome for patients with ST-elevation
myocardial infarction (STEMI). Dieker and Jocobs (2010) studied the effect on patient outcome
when paramedics transported STEMI patients directly to a cardiac interventional hospital after
paramedic diagnosis of STEMI. After studying 581 patients with suspected STEMI indicators,
Dieker and Jacobs determined patients transported to a interventional hospital had a higher
likelihood of being treated within the 90-minute STEMI treatment guideline window. These
patients had shorter symptom-to-balloon time for reperfusion and had a lower 1-year mortality
rate (7% vs. 13%). “Our data underscores that efforts should be made to organize a large-scale

Key Performance Indicators in EMS 17
implementation of an infrastructure of pre-hospital diagnosis and direct transport to the
intervention center with early notification of the catheterization laboratory from the ambulance
(Dieker and Jacobs, 2010).”
De Luca, Suryaparanta, Ottervanger and Antman (2004) found similar conclusion when
they studied the relationship between when the patient has symptoms to time of treatment on
mortality in patients with STEMI. After following 1,791 STEMI patients for one year they
concluded that “results suggest that every minute of delay in primary angioplasty for STEMI
affects 1-year mortality even after adjustment for baseline characteristics. Therefore, all efforts
should be made to shorten the total ischemic time, not only for thrombolytic therapy but also for
primary angioplasty (De Luca, Suryaparanta, Ottervanger and Antman, 2004).”
KPIs were discovered that measured effectiveness of treatment for patients with
respiratory distress, a frequent emergency run for LFR. Benchmarking administration of a beta
agonist which can immediately reduce respiratory distress was a KPI recommended by Meyers et
al. (2008). Albuterol was the beta agonist dispensed by LFR. Richmond, Silverman, Kusick,
Mataliana and Winokur (2005) studied the administration of Albuterol by emergency medical
technicians (EMT) in New York City. Their study concluded that EMTs could effectively
administer Albuterol which had a direct effect on the outcome of patients in respiratory distress.
Improvements in the patient’s condition were noted after administration of Albuterol by EMTs.
Clinical improvements after Albuterol treatment included the patient's ability to breathe easier
and speak in full sentences, decreased respiratory distress and decreased pulse rate.
Another KPI measurement was the termination of seizures by administration of a
benzodiazepine drug. Seizures were a recurrent call for LFR. The two benzodiazepines dispensed
by LFR were Valium and Versed. These drugs were fast acting and effective in stopping

Key Performance Indicators in EMS 18
seizures. Alldredge et al. (2001) studied the effectiveness of paramedics giving a benzodiazepine
to terminate seizures. They concluded that there was “clear evidence that intravenous
benzodiazepines are safe and effective when administered by paramedics for the treatment of out
of the hospital status epilepticus (Alldredge et al., 2001).” They recommended the drug
Lorazepam over Valium even though both were effective in stopping seizures.
The goal of the third research question was to discover what methods were used by other
EMS systems to evaluate EMS system performance and improve patient outcomes.
Lampretch (2007) used KPIs to measure the effectiveness of the EMS system at the
Hobart Fire Department (HFD). HFD served a population of 26,000 people in 35 square miles in
Northwest Indiana. The purpose of his research was to develop strategies to evaluate EMS
system performance and improve patient outcome. Lampretch concluded that “cardiac arrest
survivability rates were considered the gold standard for determining EMS effectiveness
(Lampretch, 2007).” He recommended utilizing incident data to measure advanced life support
skills performance. He also recommended measuring and benchmarking emergency response
times and scene times since some medical conditions are time dependant for successful
outcomes.
Coastal Valleys EMS Agency (CVEMSA) was a large multi-county regional EMS entity
representing Sonoma, Napa and Mendocino Counties in California. CVEMSA provided medical
oversight for 24 fire departments, eight ambulances agencies and three hospitals. CVEMSA used
a three phase approach to monitor performance and improve the quality of care using KPIs. Their
quality management approach included quality assurance, key performance measurements and
process improvement.

Key Performance Indicators in EMS 19
CVEMSA collected incident data four times a year using a defined data set. They
recognized that the data collected represented the quantity of activity but didn’t reflect the
quality of the medical care provided. Their goal was to enhance their EMS system’s performance
by adopting KPIs recommended by NHTSA and the EMS Performance Measures Project. KPIs
were developed and adopted for cardiac, respiratory distress and trauma patients. CVEMSA
followed a model for system improvement and stress that:
This process of improvement relies on your local experts methodically testing changes,
studying results, modifying changes as appropriate based on data, and identifying process
improvements. It is a simple and effective method for teams to make substantive changes
that improve and enhance care (CVEMSA, 2009).
The London Ambulance Service (LAS) used a number of clinical performance indicators
(CPI) to benchmark performance and bring continual quality improvement to their service. LAS
served a population of 7.6 million people in 625 square miles in London, England. Their CPIs
were focused in areas with strong research evidence to prove that elements of the correct
treatment bundle, when administered as a group, could directly improve patient outcomes.
CPIs were developed for the treatment of ST-elevation myocardial infarction (STEMI),
cardiac arrest, stoke, hypoglycemia and respiratory distress. LAS audited 100% of these patient
care reports and the data from CPIs were analyzed and benchmarked to improve performance.
“The delivery of care in these areas is routinely audited by clinical leads, and the results of these
audits are fed back to crew members on a one-on-one basis so they can make personalized
recommendations on how they can improve performance. This process has led to clear
improvements in care over time (“Quality Account,” 2010).”

Key Performance Indicators in EMS 20
LAS used CPIs to increase cardiac arrest survival rates across their jurisdiction. With
more than 10,000 out-of hospital cardiac arrests per year, LAS improved cardiac arrest survival
rates from 6% in 2003 to 15.2% in 2009. Measuring CPIs improved the accuracy of
documentation, increased protocol compliance and reduced scene times.
Procedures
Research procedures were developed to answer the three research questions on key
performance indicators (KPI) in emergency medical services (EMS). Those procedures included
a retrospective analysis of incident data, personal interviews and a national survey on KPIs.
The first research procedure was a retrospective analysis of Littleton Fire Rescue’s (LFR)
incident data to measure LFR’s performance against KPIs discovered in the literature search.
Clinical areas that were examined are in Appendix A. Data for the time period January 1, 2010 to
June 30, 2010 was extracted from LFR’s electronic records management system for analysis.
The second research procedure was personal interviews with two EMS medical directors.
The purpose of the interviews was to learn how KPIs could impact care and affect patient
outcomes. Interview questions are in Appendix B.
The third research procedure was a national survey on KPIs used by other EMS systems.
Survey questions are in Appendix C. The purpose of the survey was to determine how other
EMS systems measured performance. The survey was distributed using Survey Monkey, an
Internet company specializing in survey development and distribution. A sample size of 100
respondents from different EMS systems was the goal. The survey distribution list was exclusive
to students from the National Fire Academy who represented EMS systems around the country.
The survey was distributed via email link in June, 2010. The survey requested information on the
respondent demographics, KPIs related to: response time, cardiac arrest survival, ST-elevation

Key Performance Indicators in EMS 21
myocardial infarction, respiratory distress, seizures and trauma. The survey was open for data
collection for 30 days. All results were collected anonymously through the Internet site.
There were a number of limitations in this study. The literature resources reviewed were
assumed to be objective and unbiased. Data collection was performed retrospectively and limited
to the reliability and accuracy of data input and correct documentation of each incident. The
population of the data examined was limited to only patients transported by LFR. The non-
specific trauma data analyzed was not categorized by severity level. The lack of a national
repository for EMS data to establish common measurements and KPIs national wide was a
limitation. The National EMS Information System (NEMSIS) project has started collecting EMS
data but results were not available for this study.
Results
The first research procedure produced results from examining 3,861 medical incident
reports. Results are in Appendix D. Data from Littleton Fire Rescue’s (LFR) electronic records
management system was used to analyze LFR’s performance in treatment areas with key
performance indicators (KPI) that had supporting scientific evidence to demonstrate improved
patient outcomes.
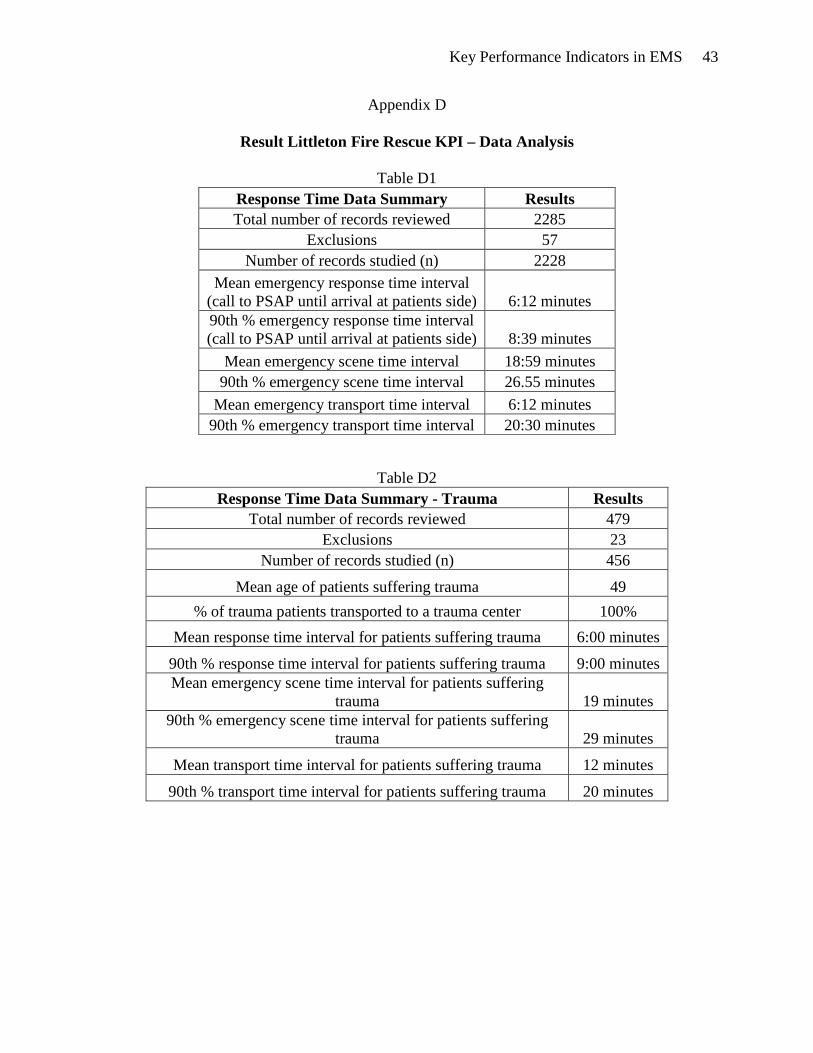
Data from 2,228 patient transport records produced KPI results associated with response
times, scene times and transport times. The average response time (notification of PSAP to
arrival on scene) was 6:12 minutes and 6:00 minutes in trauma cases. LFR responded in 8:39
minutes and 9:00 minutes in trauma 90% of the time. The average scene time (arrival on scene to
departure to hospital) was 18:59 minutes and 19:00 minutes in trauma. The average transport
time (from scene to hospital) was 6:12 minutes and 12:00 minutes in trauma. All LFR’s trauma
patients (100%) were transported directly to a designated trauma center.

Key Performance Indicators in EMS 22
Data from 445 patient transport records produce KPI results associated with cardiac
arrest, ST-elevation myocardial infarction (STEMI) and chest pain patients. Over half the cardiac
arrest patients LFR responded to were not viable (50.7%) and were not transported to hospitals.
Average time from PSAP notification to first defibrillation in patients with a shock-able cardiac
rhythm was 12 minutes. Average time from first patient contact until first defibrillation was 3
minutes. Nearly a fourth of the cardiac arrest patients (22%) transported by LFR had a return of
spontaneous circulation (ROSC) before they arrived at a hospital. LFR’s cardiac arrest survival
rate (discharge from hospital neurologically intact) was 11.4%.
Data from STEMI patients discovered that LFR paramedics had a high degree of
accuracy (90%) in identifying STEMI and notifying the receiving hospital with a cardiac alert.
Almost all STEMI patients (94%) received two 12-lead EKGs for clinical comparison. Data
showed, on average, the first 12-lead EKG was recorded within five minutes from first patient
contract. Most STEMI patients (89%) received aspirin. Average time from PSAP contact to heart
reperfusion (E2B) was 101 minutes. Average time from first patient contact to reperfusion (R2R)
was 88 minutes. Average time from arrival at the hospital to reperfusion (D2B) was 42 minutes.
All STEMI patients (100%) were delivered to an interventional coronary facility.
Data from chest pain patients discovered treatment areas needing improvement. Not all
chest pain patients received a 12-lead EKG (83.70%) or aspirin (60%) as required by medical
protocol. Just half the chest pain patients transported (49.8%) received nitroglycerin for their
chest pain and most (83.3%) had a notable reduction in their pain level after treatment.
Data from 308 patient transport records produced KPI results associated with managing
respiratory distress. Results discovered the majority of patients (84%) received oxygen therapy.
When a beta agonist was necessary due to the patient’s condition LFR administered the drug, on

Key Performance Indicators in EMS 23
average, within 12 minutes from first patient contact. Only 43% of the patients treated with a
beta agonist showed improvement. Some of the unstable respiratory distress patients (12%) were
treated with constant positive air pressure (CPAP) therapy. On average CPAP treatment was
started within 11 minutes from first patient contact and most patients treated with CPAP (88%)
showed improvement after treatment. There were no undetected esophageal intubations (n=0)
reported from 62 out-of-hospital intubations performed by LFR paramedics.
Data from 148 patient transport records produced KPI results associated with treating
seizures. A small percentage of patients (13%) who experienced seizures did not require
transport to a hospital. Most seizures patients (89%) had their blood glucose level checked, on
average, within 7 minutes of first patient contact. Only a small percentage of patients (7%)
required treatment with a benzodiazepine drug to stop their seizures. On average the drug was
administered within 14 minutes from arrival at the patient’s side. The benzodiazepine was
effective in stopping seizures 60% of the time after administration.
Data from 276 patient transport records produced KPI results associated with treating
patients in pain from various medical or trauma conditions. Not all patients treated for pain
(79%) had their pain level checked before and after treatment as recommended. Most patients
treated with a narcotic for pain (80%) reported a decreased in their pain level after treatment. A
large percentage of patients with a pain scale above seven (71%) had subsequent narcotic
treatments to reduce their pain after the initial therapy proved less than effective.
The second research procedure produced results from interview questions presented to
EMS medical directors from the two primary hospitals that LFR transported their patients to.
A personal interview was conducted on September 19, 2010 with Dr. Gene Eby, EMS
Medical Director for Littleton Fire Rescue. Dr Eby had been the EMS Medical Director for 15

Key Performance Indicators in EMS 24
years at Littleton Hospital, a level 2 trauma center located in Littleton, Colorado. LFR
transported most of their patients (66%) to Littleton Hospital in 2009 (“Annual Report,” 2009).
The purpose of the interview was to determine how KPIs improved patient outcomes at Littleton
Hospital.
Dr. Eby used KPIs to develop a very successful cardiac alert program now used by other
hospitals nationwide. The program improved treatment and outcomes for ST-elevation
myocardial infarction (STEMI) patients by measuring KPIs. “By benchmarking three KPIs (12-
lead EKG, aspirin administration and transport time) we improved compliance with medical
treatment protocols, reduced transport times and improved overall survival for STEMI patients
by reducing door-to-balloon (D2B) reperfusion time at the Littleton Hospital (Eby, personal
communication, September 19, 2010).”
Dr. Eby used aspirin administration (ASA), an important medication given by paramedics
when treating heart attacks, as a performance indicator. The cardiac alert program was initially
developed by measuring and benchmarking ASA administration. “We first started out measuring
one isolated KPI, ASA administration, for protocol compliance. We discovered our compliance
for ASA administration in STEMI treatment was just 50%. We improved ASA administration
compliance to 90 % through repeated benchmarking and education of our paramedics" Eby
stated. Benchmarking KPIs significantly improved the overall EMS system performance,
improved individual paramedic performance and changed patient outcomes. “Door to balloon
treatment times (D2B) were reduced from an average of 120 minutes, just a few years ago, to a
low of 22 minutes for some patients today” Eby stated. “We know that treating heart attack
patients is time dependent and time is heart muscle. Reducing D2B time equates to less cardiac
damage, shorter rehabilitation time for the patient and less medical expense.”

Key Performance Indicators in EMS 25
Dr. Eby remarked that developing KPIs in other areas of EMS could vastly improve
patient care. “Just do it. Develop measure and benchmark KPIs” commented Eby. “You never
know what you might find in the data, where it may take you or how it will improve patient care.
We never dreamed the cardiac alert program, now used nationwide, would have evolved from
simply measuring ASA administration.”
A personal interview was conducted on September 16, 2010 with Dr. Dylan Luyten, EMS
Medical Director at Swedish Hospital. Dr Luyten had been EMS Medical Director at Swedish
Hospital, a level 1 trauma center located in Englewood, Colorado, for the past seven years. LFR
had transported patients to Swedish Hospital for 35 years. The purpose of the interview was to
determine how KPIs improved patient outcomes at Swedish Hospital.
Dr. Luyten remarked that the development of KPIs in EMS had progressed slowly due to
the lack of good data management tools and little pre-hospital research. His observations were
that patient outcomes were never tracked well in the past so the lack of KPIs could be expected.
He believed that new data management systems and further pre-hospital research has led to
better data analysis and more widespread use of KPIs. “I believe we have seen a dramatic
improvement in patient care and outcome at Swedish Hospital because of increased
benchmarking of clinical performance indicators, especially in the area of cardiac care” stated
Luyten (Luyten, personal communication, September 16, 2010).
Dr. Luyten separated KPIs into two groups. The first group improved the EMS system
but had little or no direct correlation to patient outcomes. The example used was patient
satisfaction surveys. Dr. Luyten stressed the most important KPIs to measure were clinically
significant to the patient’s outcome and supported by scientific research data. The example used
was the cardiac alert program which was based on scientific evidence. Because of KPIs for

Key Performance Indicators in EMS 26
STEMI patients Swedish Hospital had dramatically reduced D2B times from 90-120 minutes to
50-75 minutes. Dr. Luyten equates this improvement to one life saved for every 15 STEMI
patients transported by LFR. “Benchmarking KPIs in STEMI treatment has allowed Swedish
Hospital to standardize the EMS response to STEMI patients which in turn has improved patient
outcomes and reduce mortality.”
The third research procedure produced KPI results using a national survey. Respondents
were asked to answer questions on which KPIs they used in their EMS system to improve patient
care and outcomes. The survey results are in Appendix E.
Results were produced from 150 surveys sent to respondents across the country. The
survey had an 81% survey return rate (n=122). Results were returned from 36 states. Most of the
survey results (69.7%) came from fire based EMS systems and a small percentage (13.1%) came
from fire departments without EMS. Other EMS system configurations accounted for fewer than
5% each.
Most respondents (91.7%) indicated that their EMS systems used response time data as a
KPI. Over half (54.2%) indicated their systems were analyzing cardiac arrest survival data.
Historically EMS systems have used these two KPIs as the hall mark measurements of system
performance.
Respondents indicated their EMS systems were benchmarking key elements in STEMI
treatment. Most measured aspirin administration (73%) which is an essential drug given in
STEMI treatment. The majority of EMS systems (75%) benchmarked the time when a 12-lead
EKG was taken and over half (52%) measured the time from PSAP notification to reperfusion
(E2B).

Key Performance Indicators in EMS 27
The majority of EMS systems were benchmarking performance in cardiac arrest
resuscitation. Most EMS systems (71%) measured the time from when the cardiac arrest
occurred to when basic life support was started and the majority (77%) tracked the use of
automated external defibrillators. Cardiac arrest survival rates (discharge from hospital
neurologically intact) reported in the survey varied from 3-44% with an average of 22%.
Respondents were asked about KPIs in the treatment of respiratory distress. Over half of
the respondents (58%) indicated their EMS systems measured administration of a beta agonist.
Many (63%) benchmarked respiratory distress level before treatment most (70%) also measured
respiratory distress level after treatment
Recommended KPI measurements to evaluate EMS performance in treating seizure
patients were measurement of blood glucose level (BGL) and administering a benzodiazepine
drug to terminate the seizure. Respondents to the survey indicated that most EMS systems (71%)
were benchmarking BGL but only half (53%) were benchmarking how quickly the
benzodiazepine was administered.
A recommended KPI to improve outcomes in trauma patients was keeping non-
entrapment scene times below 10 minutes. The majority of respondents (79%) indicated that
their respective EMS systems measured elapsed scene times in trauma cases. Most respondents
(69%) indicated their EMS system also monitored which patients were transported to trauma
centers and which were not.
Discussion
The purpose of this research project was to investigate and develop key performance
indicators (KPI) to measure the effectiveness of medical care provided by Littleton Fire Rescue
(LFR). Antidotal evidence indicated LFR was providing excellent care that improved patient

Key Performance Indicators in EMS 28
outcome and reduced mortality. The objective of this research was to prove or disprove that
theory.
Sowr & Pirrallo (2005) emphasized that KPIs are essential measurements in system
evaluation and can improve the overall quality and effectiveness of care. Results discovered
KPIs in two areas of EMS; operational KPIs and clinical KPIs. Dr. Dylan Luyten, EMS Medical
Director at Swedish Hospital, recommended EMS managers focus quality improvement efforts
on clinical performance (Luyten, personal communication, September 16, 2010). These results
narrowed the focus of this study to KPIs that improved patient outcomes.
Response time and scene time KPIs were directly associated with successful patient
outcomes. The treatment of certain medical conditions was time dependant and delays in
response time or transport time can be associated with increased mortality. Results from the
national survey found the majority of respondents (91.7%) were benchmarking response time
data as a KPI.
KPI results found LFR was meeting NFPA’s recommended response time standard of
eight minutes for advanced life support (NFPA, 2010). 90% of the time LFR paramedics were on
scene within eight minutes (7:39) and on average they arrived within 5:12 minutes (subtracting
one minute call processing time). Meyers et al. (2008) advocated measuring two KPIs in the
treatment of trauma patients, one of which was time dependant. Patient outcomes were
associated with limiting non-entrapment scene time to less than 10 minutes and transporting
trauma patients directly to a designated trauma center. Results showed that LFR’s scene times
were long (19 minute) in non-specific trauma. LFR’s scene times should be reduced. LFR
transported all trauma patients (100%) directly to a designated trauma center as recommended by
Meyers et al.

Key Performance Indicators in EMS 29
The design of LFR’s EMS system was advantageous for a rapid ALS response. A
paramedic was staffed on every firefighting unit and ALS interventional care was started
immediately on arrival of the closest unit. In a study of the eight minute response time, Pons et
al. (2005) stressed that EMS agencies should identify which medical conditions were dependant
on a rapid response and strike a balance between providing effective medical care and the safety
of the public and the responders.
Both Meyers et al. (2008) and NHTSA (2009) proposed benchmarking KPIs in the
treatment of chest pain, STEMI and cardiac arrest. Results from the national survey found the
majority of respondents (73%) were benchmarking elements of the STEMI treatment bundle.
Most (73%) were monitoring aspirin (ASA) administration and 12-lead EKG times (75%) while
only half of those who responded to the survey (52%) benchmarked reperfusion time. Half the
respondents (54%) tracked cardiac arrest survival rates as a KPI. Cardiac arrest survival rates, as
reported in the national survey, ranged from 3-44% with the average hospital discharge rate of
22%.
KPI results determine that LFR could improve treatment for chest pain patients by
closely benchmarking elements of the treatment bundle. While most patients received a 12-lead
EKG (83.7%) not all did. Acquiring a diagnostic 12-lead EKG is the standard of care in treating
chest pain patients. All patients 35 years of age and older with chest pain should have received
ASA but only a portion of those patient did (60%). Chest pain management could also be
improved with only half of chest pain patients (49.8%) receiving nitroglycerin to reduce their
pain level. Improvement in these KPIs was recommended. Colwell et al. discovered that pre-
hospital care was often not uniform and by measuring and benchmarking KPIs there is an
opportunity to enhance comprehensive care and improve patient outcomes (Colwell et al., 2006).

Key Performance Indicators in EMS 30
KPI results confirmed that LFR’s performance in STEMI treatment was directly
influencing patient outcomes in a positive manner. LFR correctly indentified STEMI patients
90% of the time and activated a cardiac alert at the receiving hospital. Nearly all of the STEMI
patients (94%) received two 12-lead EKGs for clinical comparison with the first EKG being
performed, on average, within five minutes from first patient contact. Nearly all STEMI patients
(89%) received ASA. Dieker and Jacobs (2010) stress the importance of transporting STEMI
patients to an interventional coronary facility and found these patients had a lower one year
mortality rate. LFR transported all of its STEMI patients (100%) to an interventional coronary
facility.
Results showed that LFR’s average time from first patient contact until reperfusion (R2R)
was 88 minutes. Meyers et al. (2008) emphasized the importance of keeping R2R time to less
than 90 minutes for successful STEMI outcomes. The average time from LFR’s arrival at the
hospital until reperfusion (D2B) was 42 minutes. Dieker and Jacobs (2010) determined patients
transported to a cardiac interventional hospital had a higher likelihood of being treated within the
90-minute STEMI treatment guideline window. These patients had shorter symptom-to-balloon
time for reperfusion and had a lower 1-year mortality rate (7% vs. 13%). Dr. Gene Eby, LFR’s
Medical Director, stressed the importance of reducing D2B time to improve patient outcomes.
Rapid reperfusion equates to less cardiac damage, shorter rehabilitation time and less medical
expense (Eby, personal communication, September 19, 2010).
KPI results confirmed that LFR was performing well in the treatment of cardiac arrest
patients. 22% of patients transported by LFR in cardiac arrest had return of spontaneous
circulation before they arrived at the hospital and 11.4% survived to hospital discharge
neurologically intact. By comparison, London Ambulance Service, with 10,000 cardiac arrests

Key Performance Indicators in EMS 31
per year, had a 6% cardiac arrest survival rate which increased to 15.2% after KPI benchmarking
(“Quality Account,” 2010). LFR paramedics treated cardiac arrest patients quickly after first
patient contact by defibrillating shock-able heart rhythms, on average, within three minutes. The
American Heart Association (AHA) emphasized that early defibrillation and early ALS care by
paramedics will improve patient survival. Cardiac arrest can be reversed by a timely electrical
shock from a defibrillator. AHA recommended starting CPR immediately with defibrillation
within three to five minutes after collapse to reduce mortality from sudden cardiac arrest (AHA,
2010).
NHTSA (2009) recommended benchmarking two KPIs in patients with respiratory
distress; oxygen administration and rate of undetected esophageal intubation. Meyers et al.
(2008) also advised measuring beta agonist administration as a KPI in respiratory distress. Over
half of the respondents answering the national survey (58%) were benchmarking administration
of a beta agonist.
KPI results established LFR was performing favorably in the treatment of respiratory
distress. The majority of patients in respiratory distress received oxygen (84%) and when a beta
agonist was required (12% of the cases), on average, it was administered within 12 minutes from
first patient contact. Richmond, Silverman, Kusick, Mataliana and Winokur (2005) found
administration of a beta agonist by EMTs directly reduced respiratory distress and improved
patient outcome. Only 43% of LFR’s patients treated with a beta agonist improved after
treatment. Patients that remained in distress after pharmacological treatment failed to improve
their condition were treated with a constant positive airway pressure (CPAP) mask. Most patients
treated with CPAP (88%) showed immediate improvement and did not required tracheal

Key Performance Indicators in EMS 32
intubation. In the 62 patients who required intubation from respiratory or cardiac arrest no
undetected esophageal intubations (n=0) were reported.
Meyers et al. (2008) recommended measuring two KPIs in the treatment of seizure
patients that directly affected their outcome by immediately terminating the seizure. KPIs in the
treatment bundle were benchmarking blood glucose measurements and administration of a
benzodiazepine drug to terminate the seizure. Results from the national survey showed that most
EMS agencies (71%) monitored blood glucose measurements but only half (53%) were
benchmarking benzodiazepine administration. Alldredge et al. (2001) studied the effectiveness of
benzodiazepine administration by paramedics and concluded there was “clear evidence that
intravenous benzodiazepines are safe and effective when administered by paramedics for the
treatment of out of the hospital status epilepticus (Alldredge et al., 2001).”
KPI results showed that LFR was adequately treating seizure patients by quickly
analyzing blood glucose levels and, in a small amount of cases (7%), administering a
benzodiazepine drug. Most seizure patient (89%) had their blood glucose level checked, on
average, within seven minutes from first patient contact. While only a small number of patients
(n=11) needed benzodiazepine treatment, on average, the drug was administered within 14
minutes of first patient contact. LFR’s treatment stopped the seizures in 60% of the patients.
NHTSA (2009) recommended measuring two KPIs in the treatment of patients with pain;
evaluation of the patient’s first and last pain level to assess treatment effectiveness and the
percentage of patients, older than 13 years of age with a pain scale above seven, who received
subsequent pain management interventions.
KPI results recognized that LFR could improve in the clinical treatment of patients with
pain. It was discovered that most patients (79%), but not all, had their pain level checked before
Key Performance Indicators in EMS 33
and after treatment as NHTSA advocated. Patients older than 13 years of age, with a pain scale
above seven, should have had subsequent pain treatment but only 71% of the patients were given
further pain management treatments as recommended (NHTSA, 2009).
This researcher interpreted the KPI results in this study to support the theory that LFR
was providing excellent emergency medical care that positively influenced patient outcomes and
reduced mortality. While past antidotal evidence supported this theory now quantifiable research
data proved that LFR’s expert medical staff was providing quality medical care. Results also
illustrate that there were elements of LFR’s treatment requiring improvement and
recommendations based on this research study were suggested.
The organizational implication of this research will change the standard of emergency
medical care delivered by LFR paramedics and directly improve patient outcomes. A new
comprehensive quality improvement strategy centered on developing, measuring and
benchmarking KPIs has evolved from this research study and will be put into practice.
Recommendations
Recommendations to enhance patient care at Littleton Fire Rescue (LFR) and improve
patient outcomes have resulted from this research study on key performance indicators (KPI).
The following recommendations, supported by KPI data collected and analyzed during this
research, are divided into two areas; clinical and operational.
Clinical recommendations will improve patient care and outcomes. Based on this
research the following clinical recommendations were made:
1. LFR should reduce non-entrapment scene times in trauma cases from 19 minutes to less
than 10 minutes.

Key Performance Indicators in EMS 34
2. LFR should increase the percentage of chest pain patients who receive a 12-lead EKG
from 83% to 100%. Increase the percentage of chest pain patients, 35 years and older,
receiving aspirin from 60% to 100%. Increase the percentage of patients receiving
nitroglycerin to reduce their chest pain from 49.8% to 100%.
3. LFR should benchmark the rescue to reperfusion time (R2R) in STEMI treatment and
maintain the 90 minute or less benchmark for cardiac reperfusion.
4. LFR should increase the hospital discharge rate from cardiac arrest from 11.4% to 25%
by benchmarking KPIs.
5. LFR should increase the percentage of patients who receive oxygen in respiratory distress
from 84% to 100%.
6. LFR should increase the percentage of patients that have their pain level checked before
and after LFR treatment from 79% to 100%.
7. LFR should increase the percentage of patients, 13 years of age and older with a pain
scale greater than seven, who received subsequent treatment with a narcotic for pain from
71% to 100%.
Operational recommendations will improve overall EMS system performance and
enhance customer service. Based on this research the following operational recommendations
were made:
1. LFR should develop, analyze and benchmark KPIs in non-clinical areas to enhance
overall EMS system performance and improve customer service. KPIs and their
subsequent data should be posted on the fire department’s web site for transparency and
accountability.

Key Performance Indicators in EMS 35
2. LFR should monitor individual paramedic performance using KPIs and give feed back to
crew members on a one-to-one basis to personalize recommendations to improve
individual paramedic performance.
3. LFR should develop and benchmark KPIs in the following operational areas;
communication center, light-and-sirens response, EMS cost per capita, patient
satisfaction, primary EMS complaints and EMS accident and injuries.
4. LFR should educate all LFR staff members on the results of this study and benchmark
established and accepted KPIs every six months.
5. LFR should use EMS training classes to simulate tracheal intubations since only 62
intubations were performed in a six months.
6. LFR should use data benchmarking to improve EMS documentation.
7. LFR should collect and analyze data on patient satisfaction. Patient satisfaction surveys
should be included with patient transport bills and results posted on the fire department’s
web site.
Recommendations from this research study will improve the standard of care at LFR by
benchmarking KPIs every six months. Organizationally, LFR should expand the use of KPIs into
all aspects of the fire department. This data driven continuous quality improvement process will
provide decision makers, customers and payers with objective data and quantifiable evidence
that they are receiving value and quality for the cost of the services they are paying for.
In conclusion, future readers and researchers may wish to perform a similar assessment of
their fire department’s performance using KPIs. This researcher hopes the information contained
in this research study will be a model for others to use to support improvement efforts and
demonstrate accountability for the services we provide the public. Finally, this researcher

Key Performance Indicators in EMS 36
encourages other fire and EMS professional to aggressively pursue research and become well
educated in the quality improvement process.

Key Performance Indicators in EMS 37
References
Alldredge, B.K., Gels, A.M., Issac, S.M., Corry, M.D., Allen, F., Ulrich, S., et al. (2001). A comparison of lorazepam, diazepam, and placebo for the treatment of out-of-hospital status epilepticus. The New England Journal of Medicine, 9, 631-637. American Heart Association 2010, Cardiopulmonary Resuscitation (CPR) Statistics. Retrieved August 1, 2010 from http://www.americanheart.org/presenter.jhtml?identifier=4483 Colwell, C., Mehler, P., Harper, J., Cassell, L., Vazquez, J., & Sabel, A., (2009). Measuring
quality in the prehospital care of chest pain patients. Prehospital Emergency Care, 13(2), 237-240.
Coastal Valleys EMS Agency. (2009, June 30). Pre-hospital emergency medical services quality
management approach. Retrieved July 10, 2010 from http://www.sonoma- county.org/cvrems/resources/pdf/qmi/quality.pdf
De Luca, G., Suryaparanta, H., Ottervanger, J.P., Antman, E.M., (2004). Time delay to treatment
and mortality in primary angioplasty for acute myocardial infarction. Circulation,109, 1223-1225.
Department of Homeland Security. (2005). Executive Leadership. Washington, DC: Author. Dieker, H., & Jacobs, A. (2010). Direct transport, cath lab notification after STEMI tripled
number of patients treated within guideline timeframe. American College of Cardiologists Journal, 3, 705-714.
Lampretch, R.P. (2007). Determining EMS effectiveness. Unpublished manuscript,
National Fire Academy. Littleton Fire Rescue. (2009). EMS Bureau Annual Report. Littleton, CO: Author.

Key Performance Indicators in EMS 38
London Ambulance Service (2010). Quality account 2009-10. Retrieved July 30, 2010 from http://www.londonambulance.nhs.uk/news/news_releases_and_statements/annual_report _quality_account.aspx Myers, J.B., Slovis, C.M., Eckstein, M., Goodloe, J.M., Isaac, S.M., Loflin, J.R., et al. (2008). Evidence-based performance measures for emergency medical service systems: a model for expanded EMS benchmarking. Prehospital Emergency Care, 141-151. National Fire Protection Association. (2010). NFPA 1710: Standard for organization and development of fire suppression operations, emergency medical services operations, and special operations to the public by career fire departments. Quincy, MA: Author. National Highway Traffic Safety Administration. (2009, December). Emergency medical
services performance measures recommended attributes and indicators for system and service performance. Retrieved August 10, 2010 from http://www.nasemso.org/Projects/ PerformanceMeasures/documents/EMSPerformanceMeasuresDec2009.pdf
Pons, P., Haukoos, J.S., Bludworth, W., Cribley, T., Pons, K.A., and Markovchick, V. (2010).
Paramedic response times: does it affect patient survival?. Academic Emergency Medicine, 12(7), 594-600.
Richmond, N.J., Silverman, R.A., Kusick, M., Matallana, L., Winokur, J. (2005). Out-of-hospital
administration of albuterol for asthma by basic life support providers. Academic
Emergency Medicine. 5, 396-403.
St. Anthony Hospital Prehospial Services. (2007, November). Denver Metropolitan Paramedic
Protocols. Retrieved June 1, 2008, from http://www.sahems.org/image.php?id=164
Swor, R.A., & Pirrallo, R.G., (2005). Improving Quality in EMS (2nd ed.). Dubuque: Kenuall
Hunt.

Key Performance Indicators in EMS 39
U.S. Fire Administration. 2010 Strategic plan. Retrieved July 1, 2010 from
http://www.usfa.dhs.gov/about/strategic/
Wikipedia. (n.d.). Retrieved August 10, 2010, from
http://en.wikipedia.org/wiki/Performance_indicator

Key Performance Indicators in EMS 40
Appendix A
Littleton Fire Rescue KPI Data Analysis Areas
1. Response times
2. Cardiac arrest survival rates
3. ST-evaluation myocardial infarction
4. Chest pain treatment
5. Respiratory distress treatment
6. Constant positive airway pressure (CPAP) treatment
7. Seizure treatment
8. Trauma
9. Pain management

Key Performance Indicators in EMS 41
Appendix B
Medical Director Interview Questions
1. What is your name and title?
2. What is your background as a medical director?
3. Can you describe how the development of key performance indicators improves patient care?
4. Can you give examples of how measuring and benchmarking key performance indicators have
improved patient outcomes at your hospital?

Key Performance Indicators in EMS 42
Appendix C
National Key Performance Indicator Survey Questions
1. What type of EMS agency are you affiliated with?
2. What state is your agency in?
3. Does your agency analyze response time data to monitor and improve system performance?
4. Does your agency analyze performance indicators for ST-myocardial infarction (STEMI)?
5. Does your agency analyze cardiac arrest survival rates?
6. Does your agency analyze performance indicators for patients with respiratory distress?
7. Does your agency analyze performance indicators for seizure patients?
8. Does your agency analyze performance indicators for trauma patients?
9. Does your agency analyze performance indicators for chest pain patients?
10. Does your agency analyze performance indicators for patients in pain?
11. Does your agency examine patient satisfaction data?
12. Does your agency analyze performance indicators related to EMS operations?
13. What other key performance indicators does your agency analyze to improve system
performance?
Key Performance Indicators in EMS 43
Appendix D
Result Littleton Fire Rescue KPI – Data Analysis
Table D1 Response Time Data Summary Results Total number of records reviewed 2285
Exclusions 57 Number of records studied (n) 2228
Mean emergency response time interval (call to PSAP until arrival at patients side) 6:12 minutes 90th % emergency response time interval (call to PSAP until arrival at patients side) 8:39 minutes
Mean emergency scene time interval 18:59 minutes 90th % emergency scene time interval 26.55 minutes
Mean emergency transport time interval 6:12 minutes 90th % emergency transport time interval 20:30 minutes
Table D2 Response Time Data Summary - Trauma Results
Total number of records reviewed 479 Exclusions 23
Number of records studied (n) 456
Mean age of patients suffering trauma 49 % of trauma patients transported to a trauma center 100%
Mean response time interval for patients suffering trauma 6:00 minutes
90th % response time interval for patients suffering trauma 9:00 minutes Mean emergency scene time interval for patients suffering
trauma 19 minutes 90th % emergency scene time interval for patients suffering
trauma 29 minutes
Mean transport time interval for patients suffering trauma 12 minutes
90th % transport time interval for patients suffering trauma 20 minutes

Key Performance Indicators in EMS 44
Table D3 Cardiac Arrest Data Summary Results Total number of records reviewed 71
Exclusions 1 Number of records studied (n) 70
Mean age of patients suffering cardiac arrest 59.5 years % of cardiac arrest patients that were not transported (left on scene) 50.70%
% of patients transported with return of spontaneous circulation prior to reaching the hospital emergency department 22%
% of patients transported that survived discharged from the ED 22.80%
% of patients transported that survived discharged from the hospital 12.80% % of patients transported that survived discharged from the hospital and
neurologically intact 11.40%
% of patients transported that had bystander CPR and ROSC 10%
% of patients transported that had Autopulse and ROSC 8.50%
% of patients transported that had ROSC with bystander CPR and Autopulse 5.70% Mean time - 1st patient contact to defibrillation in patients with a shock-able
cardiac rhythms 3 minutes Mean time - PSAP contact to defibrillation in patients with a shock-able
cardiac rhythms 12 minutes
Table D4 STEMI Data Summary Results
Total number of records reviewed 23 Exclusions 5
Number of records studied (n) 18 Mean age of STEMI patients 64.4 years
Mean time from activation of EMS until reperfusion (E2B) 101 minutes 90th % time from activation of EMS until reperfusion (E2B) 118 minutes Mean time from 1st patient contact until reperfusion (R2R) 88 minutes
90th % time from 1st patient contact until reperfusion (R2R) 105 minutes Mean time from hospital arrival until reperfusion (D2B) 42 minutes
Mean time from 1st patient contact until first 12-lead EKG 5 minutes % of STEMI patients who received ASA 89%
% of cardiac alerts called by LFR that met the criteria 90%
% of patients that received two 12 lead-EKGs for comparison 94%
% of patients transported to a coronary intervention facility 100%

Key Performance Indicators in EMS 45
Table D5 Chest Pain Data Summary Results
Total number of records reviewed 394 Exclusions 37
Number of records studied (n) 357 Mean age of chest pain patients 64 years
% of patients with cardiac chest pain who received a 12-lead EKG 83.70%
% of patients > 35 years old with cardiac chest pain receiving ASA 60% % of patients with cardiac chest pain who received Nitroglycerin 49.80%
% of patients with reduction in their pain level from LFR treatment 83.30%
Table D6
Respiratory Distress Data Summary Results Total number of records reviewed 275
Exclusions 0 Number of records studied (n) 275
Mean age of patients with respiratory distress 58 years % of patients with respiratory distress that received oxygen 84%
Mean time for1st patient contact until beta agonist given 12 minutes % of patients treated for respiratory distress that show
improvement after treatment 43% Rate of undetected esophageal intubation 0
Table D7
CPAP Data Summary Results Total number of records reviewed 33
Exclusions 0 Number of records studied (n) 33
Mean age of patients receiving CPAP 69 years % of patients with respiratory distress treated with CPAP 12%
% of patients improved after treatment with CPAP 88% Mean time from 1st patient contact to oxygen administration 6 minutes
Mean time from 1st patient contact to CPAP application 11minutes

Key Performance Indicators in EMS 46
Table D8 Seizure Treatment Data Summary Results
Total number of records reviewed 150 Exclusions 2
Number of records studied (n) 148
Mean age of patients treated for seizures 33 years
% of patients who had seizures but were not transported 13%
% of patients who had a blood glucose level checked 89% Mean time from 1st patient contact until first blood glucose
reading 7 minutes % of patients with seizures who were treated with Benzo 7%
Mean time from 1st patient contact until Benzo given 14 minutes % of patients treated with a Benzo that improved after
treatment (seizures stopped) 60%
Table D9
Pain Treatment Data Summary Results Total number of records reviewed 276
Exclusions 0 Number of records studied (n) 276
Mean age of patients treated with narcotics for pain 54 years % of patients that had their pain level taken before and
after narcotics administration 79% % of patients > 13 years of age that reported a decrease in
pain 80% % of patients > 13 years of age with a pain scale >7 that
received subsequent treatment for pain 71%

Key Performance Indicators in EMS 47
Appendix E
Results - National KPI Survey Questions
Table E1
What type of EMS agency are you affiliated with?
Answer Options Response Percent
Response Count
Fire service only 13.1% 16 Fire and EMS service combined 69.7% 85 County EMS service 3.3% 4 City EMS service(separated from fire) 4.1% 5 Hospital EMS service 2.5% 3 Private EMS service 3.3% 4 Air ambulance EMS service 0.8% 1 Other 3.3% 4 Other (please specify) 7
Table E2
What State is your agency in?
Answer Options Response Percent
Response Count
State: 100.0% 122
Table E3 Does your agency analyze response time data to monitor and improve
system performance?
Answer Options Response Percent
Response Count
Yes 91.7% 110 No 8.3% 10 I don't know 0.0% 0
Table E4
Does your agency analyze cardiac arrest survival rates (patient discharged from hospital) to improve system performance?
Answer Options Response Percent
Response Count
Yes 54.2% 65 No 41.7% 50 I don't know 4.2% 5 Cardiac Arrest Survival Rate (if known) 20

Key Performance Indicators in EMS 48
Table E5 Performance indicators for ST-Elevation Myocardial Infarction (STEMI)
patients?
Answer Options Yes No I don't know
Response Count
Aspirin administration 71 (73%) 19 (20%) 7 (7%) 97 12-Lead EKG times 73 (75%) 19 (20%) 5 (5%) 97 Reperfusion in <90 minutes from time of call to EMS 49 (52%) 34 (35%) 12 (13%) 95
Table E6
Performance indicators for cardiac arrest patients?
Answer Options Yes No I don't know
Response Count
Response time interval < 5 minutes for basic CPR 68 (71%) 21 (22%) 7 (7%) 96
Bystander CPR 67 (71%) 22 (22%) 8 (7%) 97 Use of automated external defibrillators 75 (77%) 18 (19%) 4
(94%) 97
Table E7
Performance indicators for patients with respiratory distress?
Answer Options Yes No I don't know
Response Count
Administration of a beta-agonist 56 (58%) 29 (30%) 12 (12%) 97 Respiratory distress level before treatment 61 (63%) 28 (30%) 8 (8%) 97
Respiratory distress improvement after treatment 67 (70%) 23 (24%) 6 (6%) 96
Table E8
Performance indicators for patients with pulmonary edema?
Answer Options Yes No I don't know
Response Count
Nitroglycerin administration 58 (60%) 29 (30%) 10 (10%) 97 Use of Noninvasive Positive Pressure Ventilations (CPAP) 66 (69%) 22 (23%) 8 (8%) 96

Key Performance Indicators in EMS 49
Table E9
Performance indicators for patients with seizures?
Answer Options Yes No I don't know
Response Count
Blood glucose measurement 69 (71%) 22 (23%) 6 (6%) 97 Time of Benzodiazepine administration to stop seizures 51 (53%) 36 (37%) 10 (10%) 97
Table E10
Performance indicators for trauma patients?
Answer Options Yes No I don't know
Response Count
Elapsed scene time 77 (79%) 16 (17%) 4 (4%) 97 Number of patients transported to a trauma center 66 (69%) 25 (26%) 5 (5%) 96