Embed Size (px)
Citation preview

Montana State Legislature
Legislative Audit Division
Strategic Plan Appendix
Key Performance
Indicators
The 2022/2023 Biennium

2 | P a g e
KEY PERFORMANCE INDICATORS
We are committed to performance and accountability. These Key Performance Indicators (KPIs) provide a
focus for strategic and operational improvement, create an analytical basis for decision-making, and help
focus attention on what matters most. Our KPIs are focused primarily at the organizational level and
provide a means of assessing our progress toward our goals measured against established benchmarks.
These benchmarks are based on historical experience or industry norms. Results are shown for the most
recently completed period, with trend data (where available) for 10 fiscal years.
Metric Benchmark Result
Staff Turnover Rate < 10 % 11 %
Employee Engagement > 85 % 74 %
Employee Absenteeism < 4.0 % 3.6 %
Direct Hours > 65 % 61 %
Billing Rate Inflationary Change ± 5.0 % +2.8 %
Project Budget Accuracy ± 10 % + 6 %
Project Timely Completion ± 30 Days + 36 Days
Hotline Timely Resolution < 60 Days 45 Days
Value-Added Impacts > 150% 103 %
Agency Engagement Pending Pending
Recommendation Concurrence > 90 % 82 %
Recommendation Implementation > 80 % 70 %
Results Key
Good Performance
Needs Improvement
Cause for Concern

3 | P a g e
STAFF TURNOVER RATE
Description
Staff Turnover Rate measures turnover in LAD permanent staff positions. The turnover rate is calculated for each
fiscal year to show the number of employees terminating as a percentage of the average employee count for the
year. The average employee count is based on the number of Full-Time Equivalent (FTE) staff at the beginning and
end of the fiscal year.
Performance Benchmark
The performance benchmark is established as maintaining turnover rate of less than 10% annually. This benchmark is
based on historical experience and generally accepted industry expectations.
Time Period & Trend
Result is shown for the most recently complete fiscal year. Trend data shows values for the past 10 fiscal years.
Charting
The chart shows KPI values (blue columns with percentage values above) and the performance benchmark (red line).
Result
For fiscal year 2020, we recorded a turnover rate of 11%, which slightly exceeds our performance benchmark.
Sustained focus on competitive compensation and employee engagement have resulted in our turnover rate
stabilizing at or around our benchmark. Although a further reduction would be welcome, we anticipate continuing to
experience turnover in the 5-10% range for the foreseeable future.

4 | P a g e
EMPLOYEE ENGAGEMENT
Description
Employee Engagement measures the extent to which LAD employees feel engaged in their work. Employees participate in an annual employee engagement survey, independently administered by the Legislative Branch Human Resources Manager. The survey consists of a series of questions designed to assess employee engagement. Respondents answer questions on a negative/neutral/positive scale, and the KPI measures the percentage of all responses that are recorded as positive.
Performance Benchmark
The performance benchmark is established at 85% positive response based on review of initial survey results and
expectations regarding the potential for future improvements.
Time Period & Trend
Result is shown for the most recently completed fiscal year. Trend data will be shown for 10 fiscal years as it becomes
available.
Charting
The chart shows KPI values (blue columns with percentage values above) and the performance benchmark (red line).
Result
Positive response increased slightly in the FY 2021 survey to 74%. While still broadly positive, this keeps us below our
benchmark of 85%. Review of results shows shifting sentiment in different areas, with some issues improving and
others becoming more negative.

5 | P a g e
EMPLOYEE ABSENTEEISM
Description
Employee absenteeism measures the number of hours absent from work recorded as Sick Leave or Leave Without
Pay for all LAD staff as a percentage of total hours worked in a fiscal year. The absenteeism rate is a proxy for both
employee satisfaction/engagement and for effective management control of the appropriate use of allocated leave
hours.
Performance Benchmark
The performance benchmark is established as maintaining an absenteeism rate of less than 4% annually. This
benchmark is based on historical experience and general expectations for governmental employers.
Time Period & Trend
Result is shown for the most recently complete fiscal year. Trend data shows values for the past 10 fiscal years.
Charting
The chart shows KPI values (blue columns with percentage values above) and the performance benchmark (red line).
Result
For fiscal year 2020, we recorded an absenteeism rate of 3.6%, which meets our performance benchmark of less than
4%. In recent years, the absenteeism rate has remained steady between 3.5% and 4%. We believe maintaining this
low rate of absenteeism is one indication of an engaged workforce.

6 | P a g e
DIRECT HOURS
Description
Direct hours measures productivity of the LAD workforce using direct hours recorded for work on audit projects and supporting activities. The direct hour rate is calculated based on total hours recorded for all audit staff in a fiscal year. Measuring direct hours involves assessment of the appropriate balance between work hours specific to audits versus other assigned responsibilities, training, and employee leave hours.
Performance Benchmark
The performance benchmark is established as maintaining direct hours in excess of 65% annually. This benchmark is
based on historical experience and generally accepted industry expectations.
Time Period & Trend
Result is shown for the most recently complete fiscal year. Trend data shows values for the past 10 fiscal years.
Charting
The chart shows KPI values (blue columns with percentage values above) and the performance benchmark (red line).
Result
For fiscal year 2020, we recorded direct hours at 61%, which remains slightly below our performance benchmark of
65%. Although not reflected in the 2020 results, adjusting to the demands of remote working during the Coronavirus
pandemic has brought renewed attention to managing workforce productivity. We remain committed to the long-
term goal of improving our direct hours percentage as one measure of cost-effectiveness in our operations.

7 | P a g e
BILLING RATE INFLATIONARY CHANGE
Description
Billing rate inflationary change is an efficiency metric that measures changes in the audit billing rate relative to
inflation in the general economy. The billing rate is paid by agencies through appropriations and is calculated each
fiscal year. This metric compares the change in the billing rate amount with the change in inflation as measured using
the Consumer Price Index.
Performance Benchmark
The performance benchmark is established as maintaining changes in the billing rate between + 5% and – 5% of the
neutral inflationary rate. This benchmark is based on historical experience.
Time Period & Trend
Results are calculated for 10 fiscal years. Trend data is developed using changes in both the actual billing rate and the
rate of inflation.
Charting
The chart shows KPI values (blue columns for the actual billing rate and percentage values showing above or below
the inflationary rate) and the performance benchmarks (red and green lines).
Result
For FY 2020, our billing rate was 2.8% above the neutral inflationary rate, which is within our benchmark target range
of ± 5%. Our billing rate continues to increase in line with inflationary expectations. Several factors impact the rate,
including division expenditures and direct audit hours.

8 | P a g e
PROJECT HOURS BUDGET ACCURACY
Description
Budget accuracy measures productivity and efficiency by comparing the amount of time estimated for projects with the actual time spent to complete. Budget accuracy is expressed as a percentage of the difference between the original target/estimate hours for a project and the actual hours recorded. The budget accuracy rate is calculated for every budgeted project and the KPI result reflects the average for all projects.
Performance Benchmark
The benchmark is established at ± 10% of the original budget (100%) and is based on prevailing industry standards and historical experience.
Time Period & Trend
Result is shown for the most recently completed two fiscal years. Trend data will be shown for five biennial periods
covering 10 fiscal years.
Charting
The chart shows KPI values (blue columns with percentage values above) and the performance benchmarks (green
and red lines).
Result
For the FY 18-19 period, our projects averaged 106% of budgeted hours, meaning we averaged 6% in excess of
targeted hours. This is within our benchmark range of ± 10% of budgeted hours and demonstrates appropriate levels
of control over workload, productivity and efficiency.

9 | P a g e
TIMELY PROJECT COMPLETION
Description
Timely completion measures productivity and efficiency by comparing the initial target date with the actual date an
audit report is delivered for release. Timely completion is expressed as the average number of days under/over the
initial target date based on the actual difference in days for each individual project. Timely completion is calculated
for projects over a 2-year/biennial audit period and the KPI result reflects the average for all projects.
Performance Benchmark
The benchmark is established at ± 30 days average of estimated timelines and is based on prevailing industry
standards and historical experience.
Time Period & Trend
Result is shown for the most recently completed two fiscal years. Trend data will be shown for five biennial periods
covering 10 fiscal years.
Charting
The chart shows KPI values (blue columns with percentage values above) and the performance benchmarks (green
and red lines).
Result
For the FY 18-19 period, our projects were delivered an average of 36 days in excess of the established deadline. This
is just over our performance benchmark of ± 30 days and is an increase from the previous period. Almost all this
increase is attributable to several large-scope performance or information systems audits that experienced more
significant delays relative to reporting deadlines.

10 | P a g e
TIMELY HOTLINE RESOLUTION
Description
Timely resolution of Hotline cases measures productivity and efficiency in our management of cases reported via the
LAD fraud, waste, and abuse Hotline. Each new case is logged at entry into our systems and tracked through the
point where we officially assign a resolution status. The time elapsed in days between receiving and resolving a case
is calculated, and the KPI reflects the average for all cases in a fiscal year.
Performance Benchmark
The benchmark is established at less than an average of 60 days for all cases and is based on prevailing industry
standards and our own internal standard for case resolution timeliness.
Time Period & Trend
Result is shown for the most recently complete fiscal year. Trend data will be shown for 10 fiscal years.
Charting
The chart shows KPI values (blue columns with average values above) and the performance benchmark (red line).
Result
For FY 2020, the average number of days to resolve Hotline cases was 45. This is within our benchmark of 60 days
and shows continuing improvement year-on-year. Updated internal processes and increased familiarity with our new
Hotline reporting system have contributed to decreasing turnaround times for handling Hotline cases.
11 | P a g e
VALUE-ADDED IMPACTS
Description
Value-added impacts is an outcome metric addressing the extent to which our work results in financial benefits to
state government or citizens. This metric focuses on broad value generation to include cost savings, cost/loss
avoidance, opportunity cost, revenue increases, errors and omissions, unallowable costs, process efficiency, resource
allocation, or duplicative, unnecessary or wasteful spending. Financial impact is calculated biennially and is used to
establish a return on investment (ROI) percentage relative to the total expenditures for the audit function during the
same period.
Performance Benchmark
The performance benchmark for ROI is 150%, which is based on industry norms and reflects the expectation that
audit and accountability functions should be able to realize a positive return by a multiple of at least 2 times
operating costs.
Time Period & Trend
Result is shown for the most recently completed two fiscal years. Trend data will be shown for five biennial periods
covering 10 fiscal years.
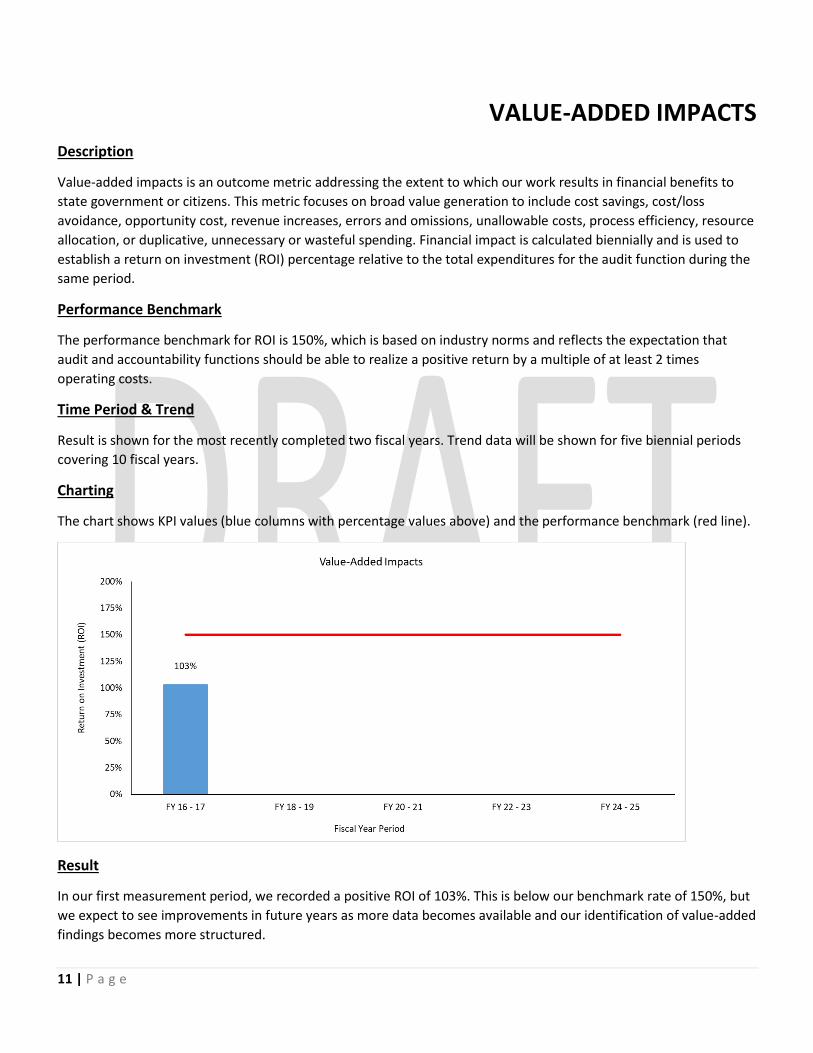
Charting
The chart shows KPI values (blue columns with percentage values above) and the performance benchmark (red line).
Result
In our first measurement period, we recorded a positive ROI of 103%. This is below our benchmark rate of 150%, but
we expect to see improvements in future years as more data becomes available and our identification of value-added
findings becomes more structured.

12 | P a g e
AGENCY ENGAGEMENT
Description
Development of this measurement is pending. Agency engagement impacts will be an outcomes-oriented metric that
measures our success in building and maintaining productive relationships between the different branches of
government. Data will be developed using a structured survey methodology to gather and analyze input from agency
employees who we work with on our projects.
Performance Benchmark
Performance benchmarks will be established based on recognized industry standards.
Time Period & Trend
Data will be developed on either a fiscal year or two-year/biennial basis. Trend data will be developed to show values
for the past 10 fiscal years.
Result
For the most part, the other branches of government are authorized and responsible for implementing audit findings
and are, therefore, an important part of our success. We already include performance metrics specific to findings
concurrence and implementation, but tracking and monitoring agency engagement via other methods can also
contribute to better understanding outcomes. Response to questions about adherence to professional standards and
other aspects of our working relationships with agencies could allow us to identify areas for improvements in our
internal processes and protocols.

13 | P a g e
RECOMMENDATION CONCURRENCE
Description
Recommendation concurrence is an outcome metric that measures the extent to which agencies agree with the
substance of our recommendations and commit to a meaningful response. The concurrence rate is the number of
recommendations that agencies either concur or conditionally concur with as a percentage of the total number of
recommendations addressed to agencies.
Performance Benchmark
The performance benchmark of 90% concurrence is established to reflect industry norms and recognizes that in audit
and accountability professions, some differences of opinion should be expected and that achieving 100%
concurrence is neither normal nor necessarily achievable.
Time Period & Trend
Result is shown for the most recently completed two fiscal years. Trend data will be shown for five biennial periods
covering 10 fiscal years.
Charting
The chart shows KPI values (blue columns with percentage values above) and the performance benchmark (red line).
Result
For the FY 18-19 period, we had a recommendation concurrence rate of 82%, which is below our benchmark rate of
90%. This decline in our concurrence rate may be isolated in time as almost the entire change was related to a one
audit engagement with an unusually high number of findings. We should continue to monitor concurrence with the
expectation that the rate returns to close to the benchmark level.

14 | P a g e
RECOMMENDATION IMPLEMENTATION
Description
Recommendation implementation measures the extent to which our recommendations have been fully implemented
by agencies or through legislative action. The implementation rate is the number of recommendations that have or
will be fully implemented as a percentage of the total number of recommendations.
Performance Benchmark
The performance benchmark of 80% implementation is established to reflect industry norms and recognizes that in
audit and accountability professions, some differences of opinion should be expected and that achieving 100%
implementation is challenging.
Time Period & Trend
Result is shown for the most recently completed two fiscal years. Trend data will be shown for five biennial periods
covering 10 fiscal years.
Charting
The chart shows KPI values (blue columns with percentage values above) and the performance benchmark (red line).
Result
For the FY 17-18 period, the implementation rate was 70%, which is an improvement on the previous period, but still
below our benchmark of 80%. We would like to see this trend continue as, absent legislative action to implement
recommendations, our success greatly depends on the actions of the other branches of government to address audit
findings.