Embed Size (px)
Citation preview
KEYSTATISTICS2016EUROPEAN PULP & PAPER INDUSTRY
Introduction 3
CEPI Key Figures 4
From Raw Materials to Paper 6
Pulp Industry Structure 7
Production and Consumption 8
Production and Consumption by Grade 9
Production and Consumption - Global View 10
Exports and Imports 11
Paper & Board Industry Structure 12
Production and Consumption 13
Production and Production Capacity 14
Production and Consumption by Grade 15
Production and Consumption - Global View 16
Exports and Imports 17
Raw Materials Summary 18
Wood Consumption by Species 19
Trade Flows and Wood Origin 20
Paper for Recycling Utilisation by Sector 21
Utilisation by Sector and by Grade 22
Utilisation and Recycling Rate 23
Exports and Imports 24
Non-Fibrous Materials 25
Energy Energy and Electricity Consumption 26
Energy & Environment Key Figures 27
Environmental Impact and Water 28
Social Affairs Employment and Accidents 29
Glossary 30
CEPI National Associations' Contact Details 31
Table of Contents
CEPI © 2017: please mention "CEPI statistics" as a source if you use figures, tables or charts from this brochure in one of your publications.
2 CEPI Key Statistics 2016
CEPI Key Statistics 2016 3
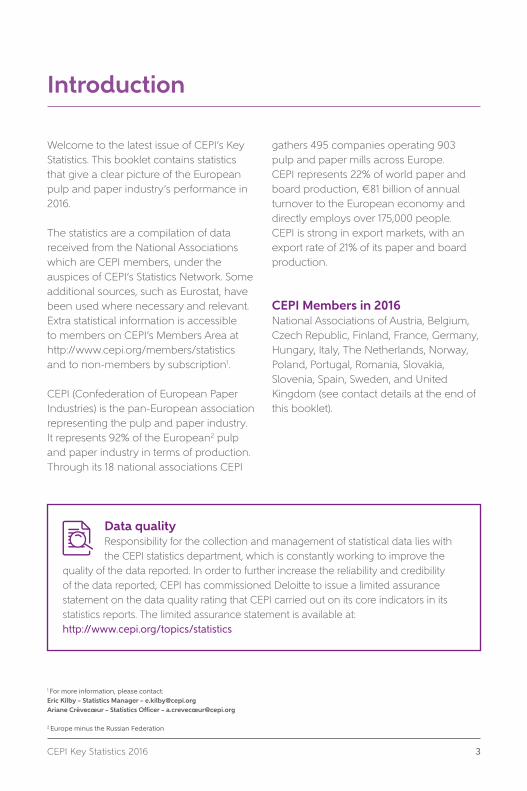
Introduction
1 For more information, please contact:Eric Kilby – Statistics Manager – [email protected] Crèvecoeur – Statistics Officer – [email protected]
2 Europe minus the Russian Federation
Welcome to the latest issue of CEPI’s Key Statistics. This booklet contains statistics that give a clear picture of the European pulp and paper industry’s performance in 2016.
The statistics are a compilation of data received from the National Associations which are CEPI members, under the auspices of CEPI’s Statistics Network. Some additional sources, such as Eurostat, have been used where necessary and relevant. Extra statistical information is accessible to members on CEPI’s Members Area at http://www.cepi.org/members/statistics and to non-members by subscription1.
CEPI (Confederation of European Paper Industries) is the pan-European association representing the pulp and paper industry. It represents 92% of the European2 pulp and paper industry in terms of production. Through its 18 national associations CEPI
gathers 495 companies operating 903 pulp and paper mills across Europe. CEPI represents 22% of world paper and board production, €81 billion of annual turnover to the European economy and directly employs over 175,000 people. CEPI is strong in export markets, with an export rate of 21% of its paper and board production.
CEPI Members in 2016National Associations of Austria, Belgium, Czech Republic, Finland, France, Germany, Hungary, Italy, The Netherlands, Norway, Poland, Portugal, Romania, Slovakia, Slovenia, Spain, Sweden, and United Kingdom (see contact details at the end of this booklet).
Data quality Responsibility for the collection and management of statistical data lies with the CEPI statistics department, which is constantly working to improve the
quality of the data reported. In order to further increase the reliability and credibility of the data reported, CEPI has commissioned Deloitte to issue a limited assurance statement on the data quality rating that CEPI carried out on its core indicators in its statistics reports. The limited assurance statement is available at: http://www.cepi.org/topics/statistics
4 CEPI Key Statistics 2016
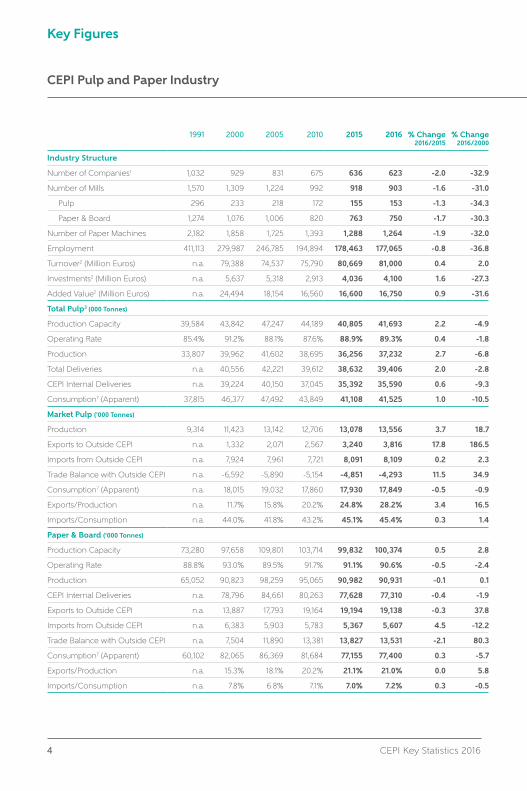
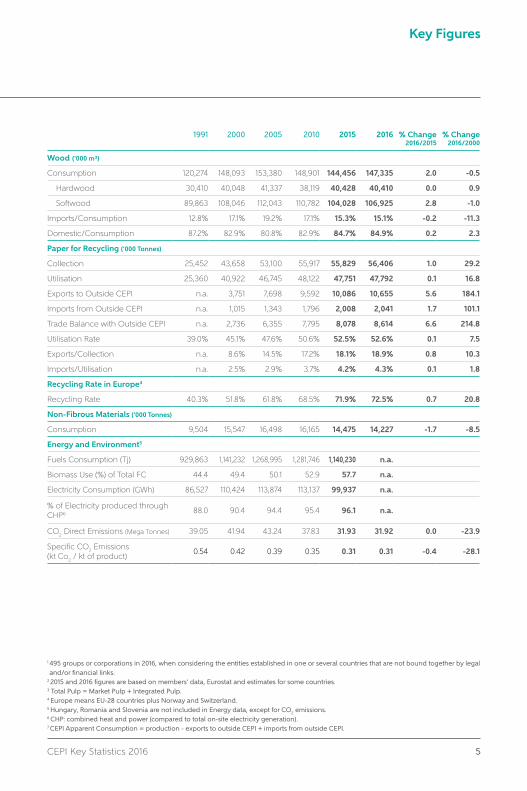
Key Figures
1991 2000 2005 2010 2015 2016 % Change 2016/2015
% Change2016/2000
Industry Structure
Number of Companies1 1,032 929 831 675 636 623 -2.0 -32.9
Number of Mills 1,570 1,309 1,224 992 918 903 -1.6 -31.0
Pulp 296 233 218 172 155 153 -1.3 -34.3
Paper & Board 1,274 1,076 1,006 820 763 750 -1.7 -30.3
Number of Paper Machines 2,182 1,858 1,725 1,393 1,288 1,264 -1.9 -32.0
Employment 411,113 279,987 246,785 194,894 178,463 177,065 -0.8 -36.8
Turnover2 (Million Euros) n.a. 79,388 74,537 75,790 80,669 81,000 0.4 2.0
Investments2 (Million Euros) n.a. 5,637 5,318 2,913 4,036 4,100 1.6 -27.3
Added Value2 (Million Euros) n.a. 24,494 18,154 16,560 16,600 16,750 0.9 -31.6
Total Pulp3 (000 Tonnes)
Production Capacity 39,584 43,842 47,247 44,189 40,805 41,693 2.2 -4.9
Operating Rate 85.4% 91.2% 88.1% 87.6% 88.9% 89.3% 0.4 -1.8
Production 33,807 39,962 41,602 38,695 36,256 37,232 2.7 -6.8
Total Deliveries n.a. 40,556 42,221 39,612 38,632 39,406 2.0 -2.8
CEPI Internal Deliveries n.a. 39,224 40,150 37,045 35,392 35,590 0.6 -9.3
Consumption7 (Apparent) 37,815 46,377 47,492 43,849 41,108 41,525 1.0 -10.5
Market Pulp ('000 Tonnes)
Production 9,314 11,423 13,142 12,706 13,078 13,556 3.7 18.7
Exports to Outside CEPI n.a. 1,332 2,071 2,567 3,240 3,816 17.8 186.5
Imports from Outside CEPI n.a. 7,924 7,961 7,721 8,091 8,109 0.2 2.3
Trade Balance with Outside CEPI n.a. -6,592 -5,890 -5,154 -4,851 -4,293 11.5 34.9
Consumption7 (Apparent) n.a. 18,015 19,032 17,860 17,930 17,849 -0.5 -0.9
Exports/Production n.a. 11.7% 15.8% 20.2% 24.8% 28.2% 3.4 16.5
Imports/Consumption n.a. 44.0% 41.8% 43.2% 45.1% 45.4% 0.3 1.4
Paper & Board ('000 Tonnes)
Production Capacity 73,280 97,658 109,801 103,714 99,832 100,374 0.5 2.8
Operating Rate 88.8% 93.0% 89.5% 91.7% 91.1% 90.6% -0.5 -2.4
Production 65,052 90,823 98,259 95,065 90,982 90,931 -0.1 0.1
CEPI Internal Deliveries n.a. 78,796 84,661 80,263 77,628 77,310 -0.4 -1.9
Exports to Outside CEPI n.a. 13,887 17,793 19,164 19,194 19,138 -0.3 37.8
Imports from Outside CEPI n.a. 6,383 5,903 5,783 5,367 5,607 4.5 -12.2
Trade Balance with Outside CEPI n.a. 7,504 11,890 13,381 13,827 13,531 -2.1 80.3
Consumption7 (Apparent) 60,102 82,065 86,369 81,684 77,155 77,400 0.3 -5.7
Exports/Production n.a. 15.3% 18.1% 20.2% 21.1% 21.0% 0.0 5.8
Imports/Consumption n.a. 7.8% 6.8% 7.1% 7.0% 7.2% 0.3 -0.5
CEPI Pulp and Paper Industry
CEPI Key Statistics 2016 5
Key Figures
1991 2000 2005 2010 2015 2016 % Change 2016/2015
% Change2016/2000
Wood ('000 m³)
Consumption 120,274 148,093 153,380 148,901 144,456 147,335 2.0 -0.5
Hardwood 30,410 40,048 41,337 38,119 40,428 40,410 0.0 0.9
Softwood 89,863 108,046 112,043 110,782 104,028 106,925 2.8 -1.0
Imports/Consumption 12.8% 17.1% 19.2% 17.1% 15.3% 15.1% -0.2 -11.3
Domestic/Consumption 87.2% 82.9% 80.8% 82.9% 84.7% 84.9% 0.2 2.3
Paper for Recycling ('000 Tonnes)
Collection 25,452 43,658 53,100 55,917 55,829 56,406 1.0 29.2
Utilisation 25,360 40,922 46,745 48,122 47,751 47,792 0.1 16.8
Exports to Outside CEPI n.a. 3,751 7,698 9,592 10,086 10,655 5.6 184.1
Imports from Outside CEPI n.a. 1,015 1,343 1,796 2,008 2,041 1.7 101.1
Trade Balance with Outside CEPI n.a. 2,736 6,355 7,795 8,078 8,614 6.6 214.8
Utilisation Rate 39.0% 45.1% 47.6% 50.6% 52.5% 52.6% 0.1 7.5
Exports/Collection n.a. 8.6% 14.5% 17.2% 18.1% 18.9% 0.8 10.3
Imports/Utilisation n.a. 2.5% 2.9% 3.7% 4.2% 4.3% 0.1 1.8
Recycling Rate in Europe4
Recycling Rate 40.3% 51.8% 61.8% 68.5% 71.9% 72.5% 0.7 20.8
Non-Fibrous Materials ('000 Tonnes)
Consumption 9,504 15,547 16,498 16,165 14,475 14,227 -1.7 -8.5
Energy and Environment5
Fuels Consumption (Tj) 929,863 1,141,232 1,268,995 1,281,746 1,140,230 n.a.
Biomass Use (%) of Total FC 44.4 49.4 50.1 52.9 57.7 n.a.
Electricity Consumption (GWh) 86,527 110,424 113,874 113,137 99,937 n.a.
% of Electricity produced through CHP6 88.0 90.4 94.4 95.4 96.1 n.a.
CO2 Direct Emissions (Mega Tonnes) 39.05 41.94 43.24 37.83 31.93 31.92 0.0 -23.9
Specific CO2 Emissions (kt Co2 / kt of product)
0.54 0.42 0.39 0.35 0.31 0.31 -0.4 -28.1
1 495 groups or corporations in 2016, when considering the entities established in one or several countries that are not bound together by legal and/or financial links.
2 2015 and 2016 figures are based on members' data, Eurostat and estimates for some countries.3 Total Pulp = Market Pulp + Integrated Pulp.4 Europe means EU-28 countries plus Norway and Switzerland.5 Hungary, Romania and Slovenia are not included in Energy data, except for CO2 emissions.6 CHP: combined heat and power (compared to total on-site electricity generation).7 CEPI Apparent Consumption = production - exports to outside CEPI + imports from outside CEPI.
6 CEPI Key Statistics 2016
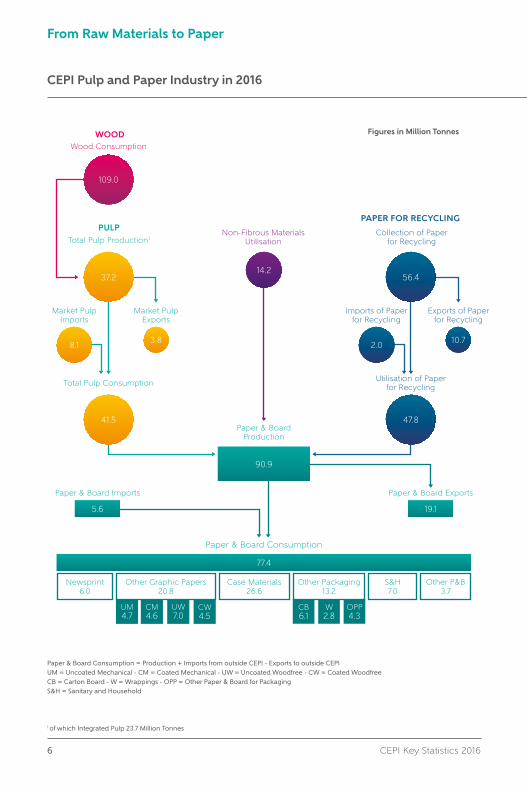
From Raw Materials to Paper
CEPI Pulp and Paper Industry in 2016
WOODWood Consumption
109.0
PULPTotal Pulp Production1
41.5
Total Pulp Consumption
8.1
Market Pulp Imports
3.8
Market Pulp Exports
Non-Fibrous Materials Utilisation
14.2
PAPER FOR RECYCLING
Collection of Paper for Recycling
56.4
47.8
2.0 10.7
Exports of Paper for Recycling
Imports of Paper for Recycling
Utilisation of Paper for Recycling
Paper & BoardProduction
90.9
5.6
Paper & Board Imports
19.1
Paper & Board Exports
Paper & Board Consumption
77.4
6.0Newsprint
20.8Other Graphic Papers
26.6Case Materials
13.2Other Packaging
7.0S&H
3.7Other P&B
4.7UM
4.6CM
7.0UW
4.5CW
6.1CB
2.8W
4.3OPP
Paper & Board Consumption = Production + Imports from outside CEPI - Exports to outside CEPIUM = Uncoated Mechanical - CM = Coated Mechanical - UW = Uncoated Woodfree - CW = Coated WoodfreeCB = Carton Board - W = Wrappings - OPP = Other Paper & Board for PackagingS&H = Sanitary and Household
1 of which Integrated Pulp 23.7 Million Tonnes
Figures in Million Tonnes
37.2

CEPI Key Statistics 2016 7
Pulp | Industry Structure
Number of CEPI Pulp Mills by Volume in 2006 and 2016
Number of Pulp Mills
10
20
30
40
50
60
0
Size category ('000 Tonnes p.a.)
<25 25 to 50 50 to 100 100 to 200 200 to 300 300+
Number of Pulp Mills Total Pulp Production (Million Tonnes)
‘92 ‘94 ‘96 ‘98 ‘00 ‘02 ‘04 ‘06 ‘08 ‘10 ‘12 ‘14 ‘160
40
80
120
160
200
240
280
320
30
32
34
36
38
40
42
44
46
2006 2016
10.3%1
5.9% 5.9%
14.4%
22,9%
14.4%
36.6%
9.4%
17.8%
21.1%
16.4%
24.9%
Number of Pulp Mills Total Pulp Production Trend in Pulp Production
+0.4%
Number of CEPI Pulp Mills and Total Pulp Production
1 Share of Total Number of Mills
8 CEPI Key Statistics 2016
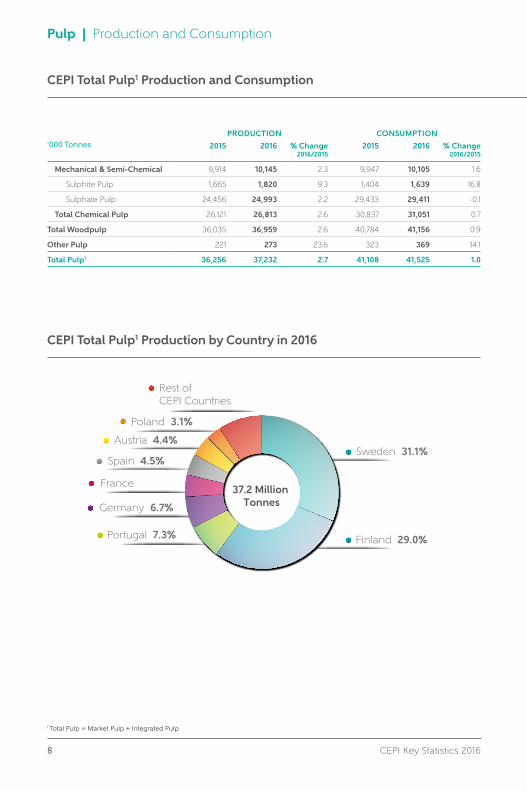
Pulp | Production and Consumption
CEPI Total Pulp1 Production and Consumption
'000 TonnesPRODUCTION CONSUMPTION
2015 2016 % Change 2016/2015
2015 2016 % Change 2016/2015
Mechanical & Semi-Chemical 9,914 10,145 2.3 9,947 10,105 1.6
Sulphite Pulp 1,665 1,820 9.3 1,404 1,639 16.8
Sulphate Pulp 24,456 24,993 2.2 29,433 29,411 -0.1
Total Chemical Pulp 26,121 26,813 2.6 30,837 31,051 0.7
Total Woodpulp 36,035 36,959 2.6 40,784 41,156 0.9
Other Pulp 221 273 23.6 323 369 14.1
Total Pulp1 36,256 37,232 2.7 41,108 41,525 1.0
CEPI Total Pulp1 Production by Country in 2016
Germany 6.7%
Million Tonnes
Million Tonnes
37.2 Million Tonnes
‘92 ‘94 ‘96 ‘98 ‘00 ‘02 ‘04 ‘06 ‘08 ‘10 ‘12 ‘14 ‘16
‘92 ‘94 ‘96 ‘98 ‘00 ‘02 ‘04 ‘06 ‘08 ‘10 ‘12 ‘14 ‘160
5
10
15
20
25
30
35
40
45
50
Chemical Pulp Other Pulp Market Pulp ProductionMechanical & Semi-Chemical Pulp
Chemical Pulp Other Pulp Market Pulp ConsumptionMechanical & Semi-Chemical Pulp
Rest of CEPI Countries
Poland 3.1%
Austria 4.4%
Spain 4.5%
France
Portugal 7.3%
Sweden 31.1%
Finland 29.0%
0
5
10
15
20
25
30
35
40
45
50
0.7%
72.0%
27.2%
1.1%
61.6%
37.3%
9:;<
=>:?<
@@:A<
1.7%
64.8%
33.5%
0.9%
74.8%
24.3%
1 Total Pulp = Market Pulp + Integrated Pulp
CEPI Key Statistics 2016 9
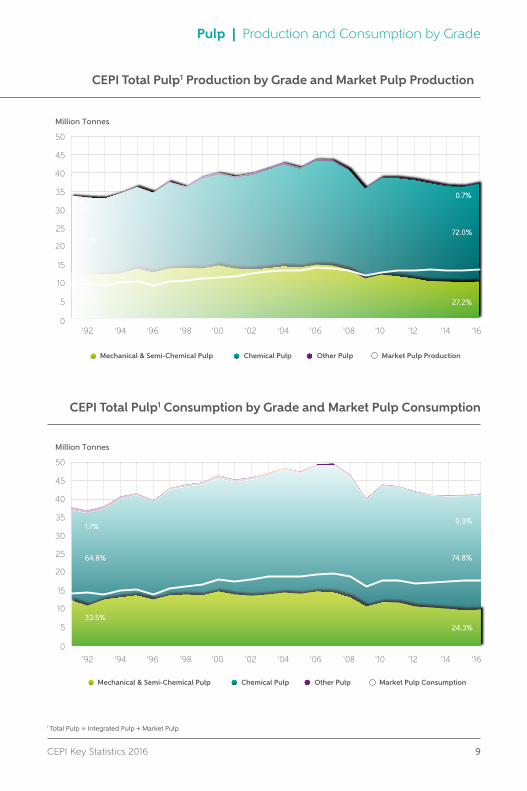
Pulp | Production and Consumption by Grade
CEPI Total Pulp1 Production by Grade and Market Pulp Production
Germany 6.7%
Million Tonnes
Million Tonnes
37.2 Million Tonnes
‘92 ‘94 ‘96 ‘98 ‘00 ‘02 ‘04 ‘06 ‘08 ‘10 ‘12 ‘14 ‘16
‘92 ‘94 ‘96 ‘98 ‘00 ‘02 ‘04 ‘06 ‘08 ‘10 ‘12 ‘14 ‘160
5
10
15
20
25
30
35
40
45
50
Chemical Pulp Other Pulp Market Pulp ProductionMechanical & Semi-Chemical Pulp
Chemical Pulp Other Pulp Market Pulp ConsumptionMechanical & Semi-Chemical Pulp
Rest of CEPI Countries
Poland 3.1%
Austria 4.4%
Spain 4.5%
France
Portugal 7.3%
Sweden 31.1%
Finland 29.0%
0
5
10
15
20
25
30
35
40
45
50
0.7%
72.0%
27.2%
1.1%
61.6%
37.3%
9:;<
=>:?<
@@:A<
1.7%
64.8%
33.5%
0.9%
74.8%
24.3%
CEPI Total Pulp1 Consumption by Grade and Market Pulp Consumption
1 Total Pulp = Integrated Pulp + Market Pulp
10 CEPI Key Statistics 2016
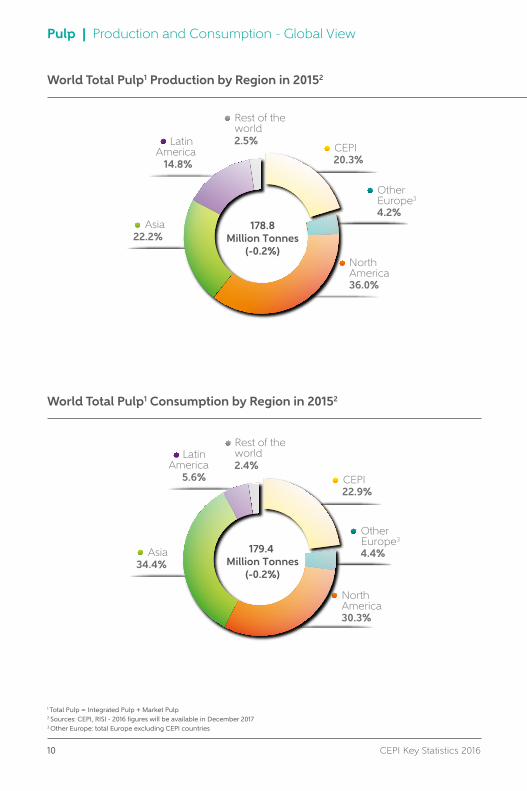
Pulp | Production and Consumption - Global View
World Total Pulp1 Production by Region in 20152
Asia22.2%
Asia34.4%
Latin America
14.8%
Latin America
5.6%
Rest of theworld2.5%
Rest of theworld2.4%
CEPI20.3%
Other Europe3
4.2%
NorthAmerica36.0%
CEPI22.9%
Other Europe3
4.4%
NorthAmerica30.3%
Imports to CEPIExports from CEPI
Million Tonnes
178.8Million Tonnes
(-0.2%)
179.4 Million Tonnes
(-0.2%)
B:C<
;>:?<
D>:@<
World Total Pulp1 Consumption by Region in 20152
1 Total Pulp = Integrated Pulp + Market Pulp 2 Sources: CEPI, RISI - 2016 figures will be available in December 20173 Other Europe: total Europe excluding CEPI countries

CEPI Key Statistics 2016 11
Pulp | Exports and Imports
'000 Tonnes 2000 2005 2010 2015 2016 % Share of Total
% Change2016/2015
Other Europe1 724 674 719 768 879 23.0 14.3
North America 104 187 62 59 53 1.4 -11.1
Latin America 6 20 49 69 65 1.7 -5.6
Asia 412 1,076 1,595 2,156 2,604 68.2 20.8
Rest of the World 86 114 142 187 215 5.6 15.0
Total 1,332 2,071 2,567 3,240 3,816 100.0 17.8
CEPI Exports of Market Pulp to Other Regions
'000 Tonnes 2000 2005 2010 2015 2016 % Share of Total
% Change2016/2015
Other Europe1 657 615 480 663 698 8.6 5.2
North America 4,623 3,891 2,292 1,415 1,348 16.6 -4.8
Latin America 1,916 2,825 4,733 5,657 5,762 71.1 1.8
Asia 272 197 134 220 133 1.6 -39.5
Rest of the World 456 433 81 135 169 2.1 24.5
Total 7,924 7,961 7,721 8,091 8,109 100.0 0.2
CEPI Imports of Market Pulp from Other Regions
CEPI Trade Flows of Market Pulp in 2016
Asia22.2%
Asia34.4%
Latin America
14.8%
Latin America
5.6%
Rest of theworld2.5%
Rest of theworld2.4%
CEPI20.3%
Other Europe3
4.2%
NorthAmerica36.0%
CEPI22.9%
Other Europe3
4.4%
NorthAmerica30.3%
Imports to CEPIExports from CEPI
Million Tonnes
178.8Million Tonnes
(-0.2%)
179.4 Million Tonnes
(-0.2%)
B:C<
;>:?<
D>:@<
1 Other Europe: total Europe excluding CEPI countries2 Production and consumption of total pulp (market and integrated)
Total Imports to CEPI: 8.1 Million TonnesTotal Exports from CEPI: 3.8 Million Tonnes
54.3
64.3
Consumption2 (2015)
Production2 (2015)
41.1
36.3
7.9
7.6
4.3
4.4
10.1
26.5
61.7
39.7
1.3
0.1
5.8
0.1
0.20.2
2.6
0.1
0.9
0.7
12 CEPI Key Statistics 2016
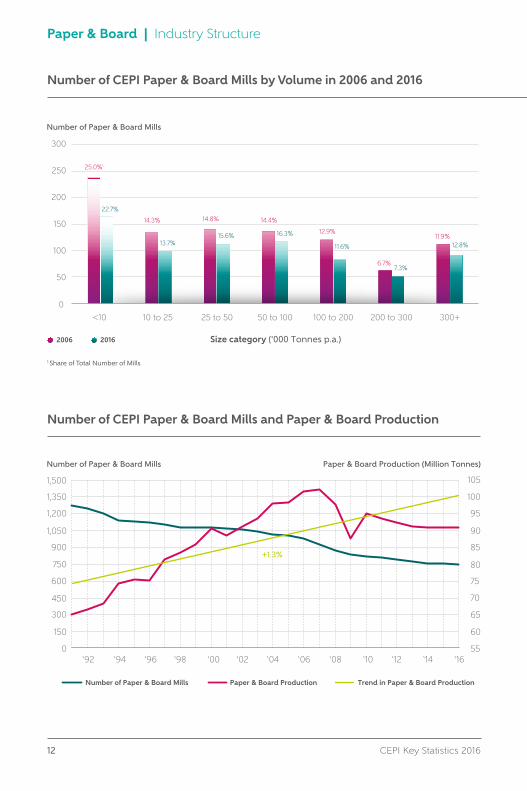
Paper & Board | Industry Structure
Number of CEPI Paper & Board Mills by Volume in 2006 and 2016
Number of Paper & Board Mills
50
100
150
200
250
300
0
25.0%1
22.7%
14.3%
13.7%
14.8% 14.4%
16.3% 12.9%
11.6%
6.7%
11.9%12.8%
7.3%
15.6%
Number of Paper & Board Mills Paper & Board Production (Million Tonnes)
‘92 ‘94 ‘96 ‘98 ‘00 ‘02 ‘04 ‘06 ‘08 ‘10 ‘12 ‘14 ‘160
150
300
450
600
750
900
1,050
1,200
1,350
1,500
55
60
65
70
75
80
85
90
95
100
105
+1.3%
Number of Paper & Board Mills Paper & Board Production Trend in Paper & Board Production
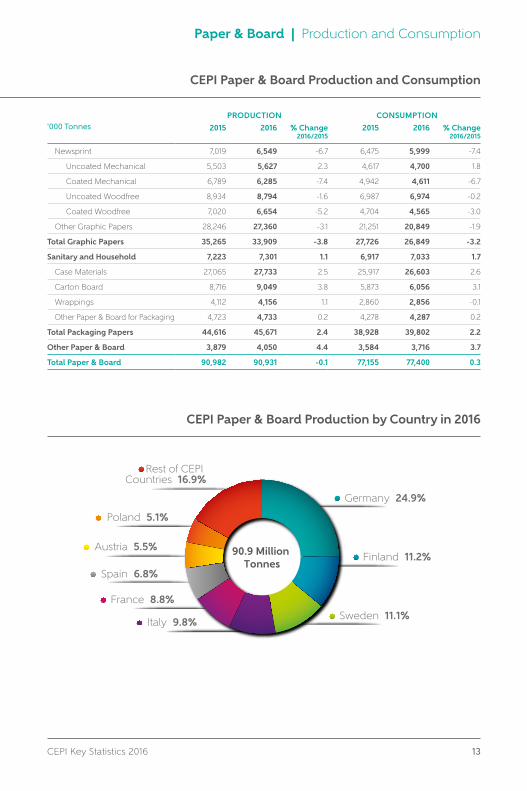
90.9 Million Tonnes
Germany 24.9%
Finland 11.2%
Sweden 11.1%Italy 9.8%
France 8.8%
Spain 6.8%
Austria 5.5%
Poland 5.1%
Rest of CEPI Countries 16.9%
<10 10 to 25 25 to 50 50 to 100 100 to 200 200 to 300 300+
2006 2016 Size category ('000 Tonnes p.a.)
Number of Paper & Board Mills
50
100
150
200
250
300
0
25.0%1
22.7%
14.3%
13.7%
14.8% 14.4%
16.3% 12.9%
11.6%
6.7%
11.9%12.8%
7.3%
15.6%
Number of Paper & Board Mills Paper & Board Production (Million Tonnes)
‘92 ‘94 ‘96 ‘98 ‘00 ‘02 ‘04 ‘06 ‘08 ‘10 ‘12 ‘14 ‘160
150
300
450
600
750
900
1,050
1,200
1,350
1,500
55
60
65
70
75
80
85
90
95
100
105
+1.3%
Number of Paper & Board Mills Paper & Board Production Trend in Paper & Board Production
90.9 Million Tonnes
Germany 24.9%
Finland 11.2%
Sweden 11.1%Italy 9.8%
France 8.8%
Spain 6.8%
Austria 5.5%
Poland 5.1%
Rest of CEPI Countries 16.9%
<10 10 to 25 25 to 50 50 to 100 100 to 200 200 to 300 300+
2006 2016 Size category ('000 Tonnes p.a.)
Number of CEPI Paper & Board Mills and Paper & Board Production
1 Share of Total Number of Mills
CEPI Key Statistics 2016 13
Paper & Board | Production and Consumption
CEPI Paper & Board Production and Consumption
'000 TonnesPRODUCTION CONSUMPTION
2015 2016 % Change 2016/2015
2015 2016 % Change 2016/2015
Newsprint 7,019 6,549 -6.7 6,475 5,999 -7.4
Uncoated Mechanical 5,503 5,627 2.3 4,617 4,700 1.8
Coated Mechanical 6,789 6,285 -7.4 4,942 4,611 -6.7
Uncoated Woodfree 8,934 8,794 -1.6 6,987 6,974 -0.2
Coated Woodfree 7,020 6,654 -5.2 4,704 4,565 -3.0
Other Graphic Papers 28,246 27,360 -3.1 21,251 20,849 -1.9
Total Graphic Papers 35,265 33,909 -3.8 27,726 26,849 -3.2
Sanitary and Household 7,223 7,301 1.1 6,917 7,033 1.7
Case Materials 27,065 27,733 2.5 25,917 26,603 2.6
Carton Board 8,716 9,049 3.8 5,873 6,056 3.1
Wrappings 4,112 4,156 1.1 2,860 2,856 -0.1
Other Paper & Board for Packaging 4,723 4,733 0.2 4,278 4,287 0.2
Total Packaging Papers 44,616 45,671 2.4 38,928 39,802 2.2
Other Paper & Board 3,879 4,050 4.4 3,584 3,716 3.7
Total Paper & Board 90,982 90,931 -0.1 77,155 77,400 0.3
CEPI Paper & Board Production by Country in 2016
Number of Paper & Board Mills
50
100
150
200
250
300
0
25.0%1
22.7%
14.3%
13.7%
14.8% 14.4%
16.3% 12.9%
11.6%
6.7%
11.9%12.8%
7.3%
15.6%
Number of Paper & Board Mills Paper & Board Production (Million Tonnes)
‘92 ‘94 ‘96 ‘98 ‘00 ‘02 ‘04 ‘06 ‘08 ‘10 ‘12 ‘14 ‘160
150
300
450
600
750
900
1,050
1,200
1,350
1,500
55
60
65
70
75
80
85
90
95
100
105
+1.3%
Number of Paper & Board Mills Paper & Board Production Trend in Paper & Board Production
90.9 Million Tonnes
Germany 24.9%
Finland 11.2%
Sweden 11.1%Italy 9.8%
France 8.8%
Spain 6.8%
Austria 5.5%
Poland 5.1%
Rest of CEPI Countries 16.9%
<10 10 to 25 25 to 50 50 to 100 100 to 200 200 to 300 300+
2006 2016 Size category ('000 Tonnes p.a.)
14 CEPI Key Statistics 2016
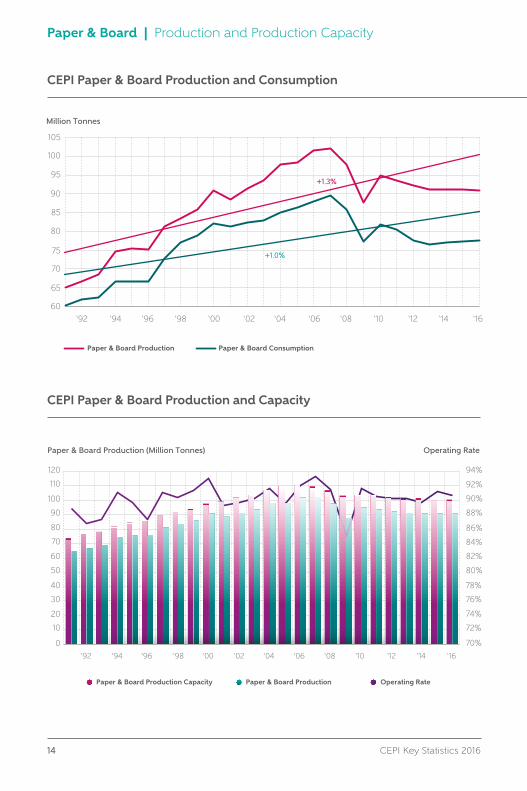
Paper & Board | Production and Production Capacity
CEPI Paper & Board Production and Consumption
Paper & Board Production Paper & Board Consumption
Million Tonnes
‘92 ‘94 ‘96 ‘98 ‘00 ‘02 ‘04 ‘06 ‘08 ‘10 ‘12 ‘14 ‘1660
65
70
75
80
85
90
95
100
105
+1.0%
+1.3%
Paper & Board Production (Million Tonnes) Operating Rate
74%
76%
72%
78%
80%
82%
84%
86%
88%
90%
92%
94%
Million Tonnes
Newsprint Other Graphic Papers Sanitary & Household Total Packaging Papers Other Paper & Board
Newsprint Other Graphic Papers Sanitary & Household Total Packaging Papers Other Paper & Board
0
10
20
30
40
50
60
70
80
90
100
110
‘92 ‘94 ‘96 ‘98 ‘00 ‘02 ‘04 ‘06 ‘08 ‘10 ‘12 ‘14 ‘16
Million Tonnes
4.9%
40.8%
5.8%
35.9%
12.5%
4.5%
50.2%
8.0%
30.1%
7.2%
70%
Paper & Board Production Capacity Paper & Board Production Operating Rate
0
10
20
30
40
50
60
70
80
90
100
110
120
‘92 ‘94 ‘96 ‘98 ‘00 ‘02 ‘04 ‘06 ‘08 ‘10 ‘12 ‘14 ‘16
0
10
20
30
40
50
60
70
80
90
100
‘92 ‘94 ‘96 ‘98 ‘00 ‘02 ‘04 ‘06 ‘08 ‘10 ‘12 ‘14 ‘16
51.4%
4.8%
26.9%
4.9%
42.1%
6.1%
34.2%
12.7% 7.8%
9.1%
CEPI Paper & Board Production and Capacity
CEPI Key Statistics 2016 15
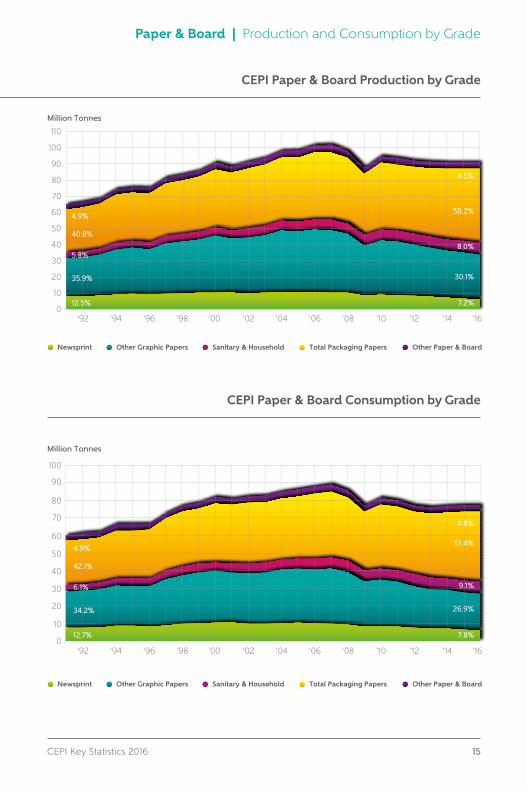
Paper & Board | Production and Consumption by Grade
CEPI Paper & Board Production by Grade
Paper & Board Production Paper & Board Consumption
Million Tonnes
‘92 ‘94 ‘96 ‘98 ‘00 ‘02 ‘04 ‘06 ‘08 ‘10 ‘12 ‘14 ‘1660
65
70
75
80
85
90
95
100
105
+1.0%
+1.3%
Paper & Board Production (Million Tonnes) Operating Rate
74%
76%
72%
78%
80%
82%
84%
86%
88%
90%
92%
94%
Million Tonnes
Newsprint Other Graphic Papers Sanitary & Household Total Packaging Papers Other Paper & Board
Newsprint Other Graphic Papers Sanitary & Household Total Packaging Papers Other Paper & Board
0
10
20
30
40
50
60
70
80
90
100
110
‘92 ‘94 ‘96 ‘98 ‘00 ‘02 ‘04 ‘06 ‘08 ‘10 ‘12 ‘14 ‘16
Million Tonnes
4.9%
40.8%
5.8%
35.9%
12.5%
4.5%
50.2%
8.0%
30.1%
7.2%
70%
Paper & Board Production Capacity Paper & Board Production Operating Rate
0
10
20
30
40
50
60
70
80
90
100
110
120
‘92 ‘94 ‘96 ‘98 ‘00 ‘02 ‘04 ‘06 ‘08 ‘10 ‘12 ‘14 ‘16
0
10
20
30
40
50
60
70
80
90
100
‘92 ‘94 ‘96 ‘98 ‘00 ‘02 ‘04 ‘06 ‘08 ‘10 ‘12 ‘14 ‘16
51.4%
4.8%
26.9%
4.9%
42.1%
6.1%
34.2%
12.7% 7.8%
9.1%
CEPI Paper & Board Consumption by Grade
16 CEPI Key Statistics 2016
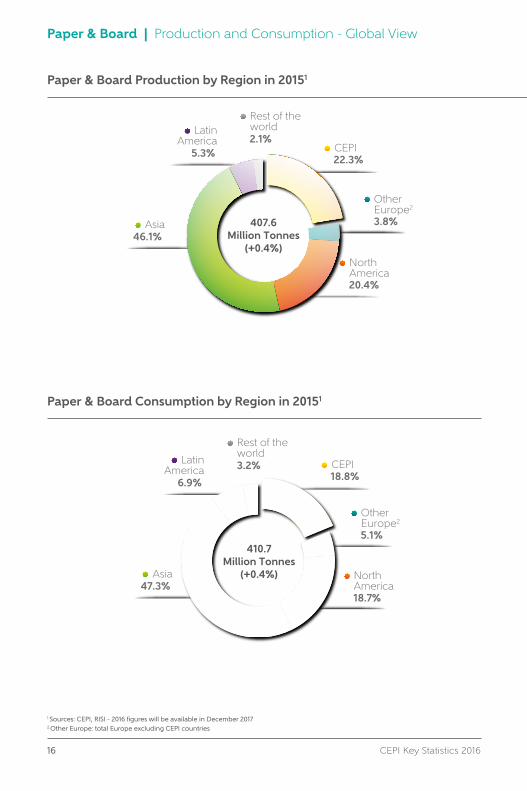
Paper & Board | Production and Consumption - Global View
Paper & Board Production by Region in 20151
Asia46.1%
Asia47.3%
LatinAmerica
5.3%
LatinAmerica
6.9%
Rest of theworld2.1%
Rest of theworld3.2%
CEPI22.3%
Other Europe2
3.8%
NorthAmerica20.4%
CEPI18.8%
Other Europe2
5.1%
NorthAmerica18.7%
407.6Million Tonnes
(+0.4%)
410.7Million Tonnes
(+0.4%)
Asia46.1%
Asia47.3%
LatinAmerica
5.3%
LatinAmerica
6.9%
Rest of theworld2.1%
Rest of theworld3.2%
CEPI22.3%
Other Europe2
3.8%
NorthAmerica20.4%
CEPI18.8%
Other Europe2
5.1%
NorthAmerica18.7%
407.6Million Tonnes
(+0.4%)
410.7Million Tonnes
(+0.4%)
Paper & Board Consumption by Region in 20151
1 Sources: CEPI, RISI - 2016 figures will be available in December 20172 Other Europe: total Europe excluding CEPI countries
CEPI Key Statistics 2016 17
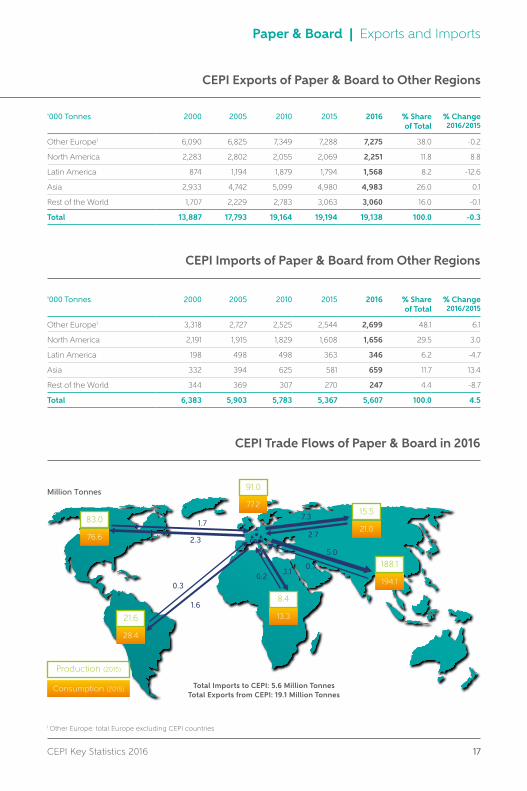
Paper & Board | Exports and Imports
CEPI Exports of Paper & Board to Other Regions
'000 Tonnes 2000 2005 2010 2015 2016 % Share of Total
% Change2016/2015
Other Europe1 6,090 6,825 7,349 7,288 7,275 38.0 -0.2
North America 2,283 2,802 2,055 2,069 2,251 11.8 8.8
Latin America 874 1,194 1,879 1,794 1,568 8.2 -12.6
Asia 2,933 4,742 5,099 4,980 4,983 26.0 0.1
Rest of the World 1,707 2,229 2,783 3,063 3,060 16.0 -0.1
Total 13,887 17,793 19,164 19,194 19,138 100.0 -0.3
'000 Tonnes 2000 2005 2010 2015 2016 % Share of Total
% Change2016/2015
Other Europe1 3,318 2,727 2,525 2,544 2,699 48.1 6.1
North America 2,191 1,915 1,829 1,608 1,656 29.5 3.0
Latin America 198 498 498 363 346 6.2 -4.7
Asia 332 394 625 581 659 11.7 13.4
Rest of the World 344 369 307 270 247 4.4 -8.7
Total 6,383 5,903 5,783 5,367 5,607 100.0 4.5
CEPI Imports of Paper & Board from Other Regions
CEPI Trade Flows of Paper & Board in 2016
Asia22.2%
Asia34.4%
Latin America
14.8%
Latin America
5.6%
Rest of theworld2.5%
Rest of theworld2.4%
CEPI20.3%
Other Europe3
4.2%
NorthAmerica36.0%
CEPI22.9%
Other Europe3
4.4%
NorthAmerica30.3%
Imports to CEPIExports from CEPI
Million Tonnes
178.8Million Tonnes
(-0.2%)
179.4 Million Tonnes
(-0.2%)
B:C<
;>:?<
D>:@<
1 Other Europe: total Europe excluding CEPI countries
Total Imports to CEPI: 5.6 Million TonnesTotal Exports from CEPI: 19.1 Million Tonnes
76.6
83.0
Consumption (2015)
Production (2015)
77.2
91.0
21.0
15.5
13.3
8.4
28.4
21.6
194.1
188.1
1.7
2.3
0.3
1.6
0.23.1
5.0
0.7
7.3
2.7
18 CEPI Key Statistics 2016
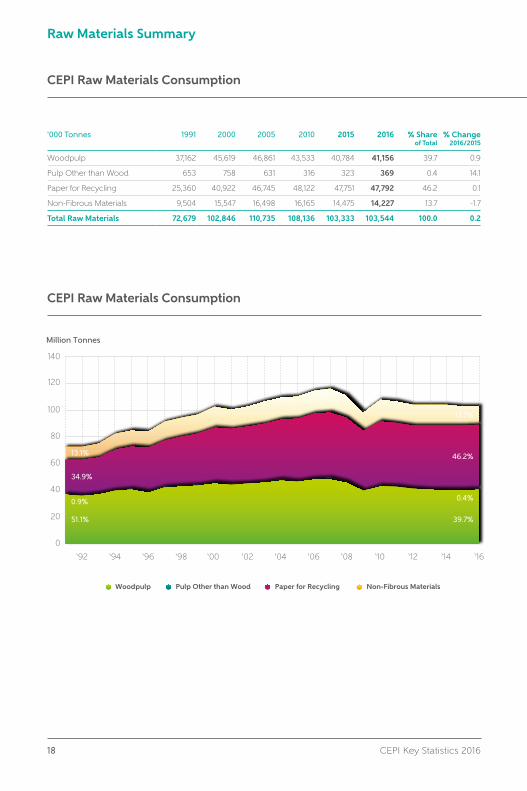
Raw Materials Summary
CEPI Raw Materials Consumption
'000 Tonnes 1991 2000 2005 2010 2015 2016 % Shareof Total
% Change2016/2015
Woodpulp 37,162 45,619 46,861 43,533 40,784 41,156 39.7 0.9
Pulp Other than Wood 653 758 631 316 323 369 0.4 14.1
Paper for Recycling 25,360 40,922 46,745 48,122 47,751 47,792 46.2 0.1
Non-Fibrous Materials 9,504 15,547 16,498 16,165 14,475 14,227 13.7 -1.7
Total Raw Materials 72,679 102,846 110,735 108,136 103,333 103,544 100.0 0.2
CEPI Raw Materials Consumption
Woodpulp Pulp Other than Wood Paper for Recycling Non-Fibrous Materials
0
20
40
60
80
100
120
140
‘92 ‘94 ‘96 ‘98 ‘00 ‘02 ‘04 ‘06 ‘08 ‘10 ‘12 ‘14 ‘16
Hardwood: 27.6% Softwood: 72.4% Imported: 15.1% Domestic: 84.9%
Pine 35.9% Spruce 36.5%
Domestic Roundwood 67.1% Domestic Chips 17.8%
Birch 13.4% Eucalyptus 8.6%
Imported Roundwood 10.2% ImportedChips 4.9%
Beech 2.7% Aspen 1.3% OtherHardwood2 1.4%
Million Tonnes
13.7%
46.2%
0.4%
39.7%
13.1%
34.9%
0.9%
51.1%
147.3Million m³
147.3Million m³
CEPI Key Statistics 2016 19
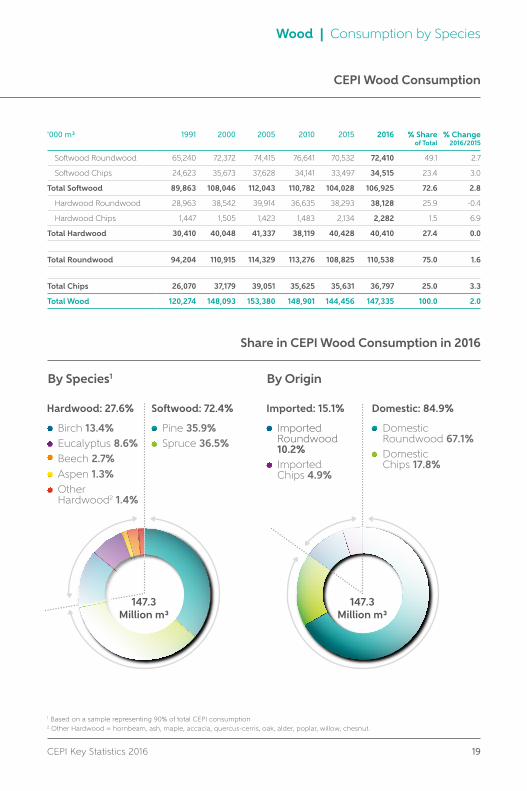
Wood | Consumption by Species
CEPI Wood Consumption
'000 m³ 1991 2000 2005 2010 2015 2016 % Shareof Total
% Change2016/2015
Softwood Roundwood 65,240 72,372 74,415 76,641 70,532 72,410 49.1 2.7
Softwood Chips 24,623 35,673 37,628 34,141 33,497 34,515 23.4 3.0
Total Softwood 89,863 108,046 112,043 110,782 104,028 106,925 72.6 2.8
Hardwood Roundwood 28,963 38,542 39,914 36,635 38,293 38,128 25.9 -0.4
Hardwood Chips 1,447 1,505 1,423 1,483 2,134 2,282 1.5 6.9
Total Hardwood 30,410 40,048 41,337 38,119 40,428 40,410 27.4 0.0
Total Roundwood 94,204 110,915 114,329 113,276 108,825 110,538 75.0 1.6
Total Chips 26,070 37,179 39,051 35,625 35,631 36,797 25.0 3.3
Total Wood 120,274 148,093 153,380 148,901 144,456 147,335 100.0 2.0
Share in CEPI Wood Consumption in 2016
Woodpulp Pulp Other than Wood Paper for Recycling Non-Fibrous Materials
0
20
40
60
80
100
120
140
‘92 ‘94 ‘96 ‘98 ‘00 ‘02 ‘04 ‘06 ‘08 ‘10 ‘12 ‘14 ‘16
Hardwood: 27.6% Softwood: 72.4% Imported: 15.1% Domestic: 84.9%
Pine 35.9% Spruce 36.5%
Domestic Roundwood 67.1% Domestic Chips 17.8%
Birch 13.4% Eucalyptus 8.6%
Imported Roundwood 10.2% ImportedChips 4.9%
Beech 2.7% Aspen 1.3% OtherHardwood2 1.4%
Million Tonnes
13.7%
46.2%
0.4%
39.7%
13.1%
34.9%
0.9%
51.1%
147.3Million m³
147.3Million m³
By Species1 By Origin
1 Based on a sample representing 90% of total CEPI consumption2 Other Hardwood = hornbeam, ash, maple, accacia, quercus-cerris, oak, alder, poplar, willow, chesnut.
20 CEPI Key Statistics 2016
Wood | Trade Flows and Wood Origin
CEPI Wood Consumption by Origin
25
50
75
100
125
0
CEPI Area84.9%
Imports from outside CEPI 15.1%
Other EU28 Countries 5.8%
Russia 5.3%
Belarus 2.1%
Ukraine 0.7%
Uruguay 0.7%
Brazil 0.3%
Switzerland 0.1%
United States 0.1%
47.8 MillionTonnes
Million Tonnes
Germany 35.4%
France 11.2%Spain 10.9%
Italy 10.2%
United Kingdom 6.3%
Austria 4.9%
Poland 5.1%
Netherlands 4.8%
Rest of CEPI Countries 11.3%
85%83%83% 83% 83% 82% 81%
83% 83%83%
89% 83% 84% 85% 84% 83% 85%
17%*17%
17% 17%17% 17%
17%17% 17%
18% 19%
11%16% 16%15% 15% 15%
‘00 ‘01 ‘02 ‘03 ‘04 ‘05 ‘06 ‘07 ‘08 ‘09 ‘10 ‘11 ‘12 ‘13 ‘14 ‘16‘15
Wood from Domestic Origin Imported Wood
CEPI Wood Consumption Origin in 2016
25
50
75
100
125
0
CEPI Area84.9%
Imports from outside CEPI 15.1%
Other EU28 Countries 5.8%
Russia 5.3%
Belarus 2.1%
Ukraine 0.7%
Uruguay 0.7%
Brazil 0.3%
Switzerland 0.1%
United States 0.1%
47.8 MillionTonnes
Million Tonnes
Germany 35.4%
France 11.2%Spain 10.9%
Italy 10.2%
United Kingdom 6.3%
Austria 4.9%
Poland 5.1%
Netherlands 4.8%
Rest of CEPI Countries 11.3%
85%83%83% 83% 83% 82% 81%
83% 83%83%
89% 83% 84% 85% 84% 83% 85%
17%*17%
17% 17%17% 17%
17%17% 17%
18% 19%
11%16% 16%15% 15% 15%
‘00 ‘01 ‘02 ‘03 ‘04 ‘05 ‘06 ‘07 ‘08 ‘09 ‘10 ‘11 ‘12 ‘13 ‘14 ‘16‘15
Wood from Domestic Origin Imported Wood
CEPI Trade Flows of Wood in 2016
Asia22.2%
Asia34.4%
Latin America
14.8%
Latin America
5.6%
Rest of theworld2.5%
Rest of theworld2.4%
CEPI20.3%
Other Europe3
4.2%
NorthAmerica36.0%
CEPI22.9%
Other Europe3
4.4%
NorthAmerica30.3%
Imports to CEPIExports from CEPI
Million Tonnes
178.8Million Tonnes
(-0.2%)
179.4 Million Tonnes
(-0.2%)
B:C<
;>:?<
D>:@<
Total Imports to CEPI: 16.5 Million TonnesTotal Exports from CEPI: 1.2 Million Tonnes
0.1
0.5
0.01
0.7
15.3
Source: Eurostat
Source: Eurostat
* percentage of total wood consumption
Source: Eurostat
1.1
CEPI Key Statistics 2016 21
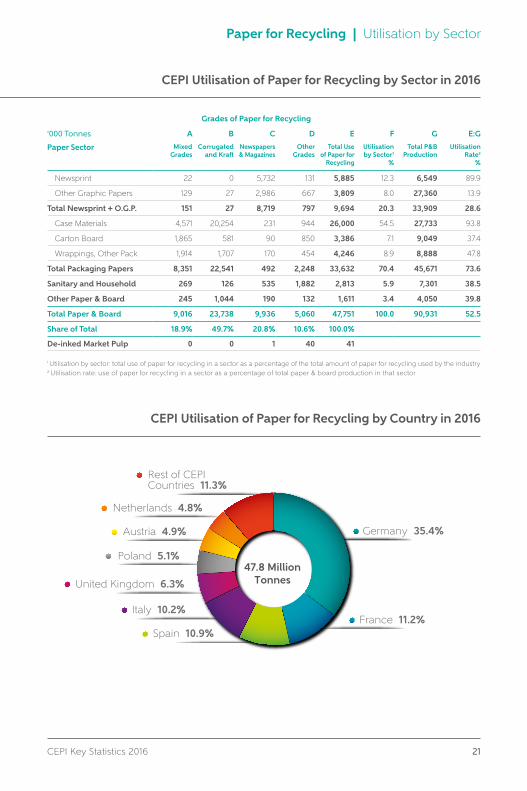
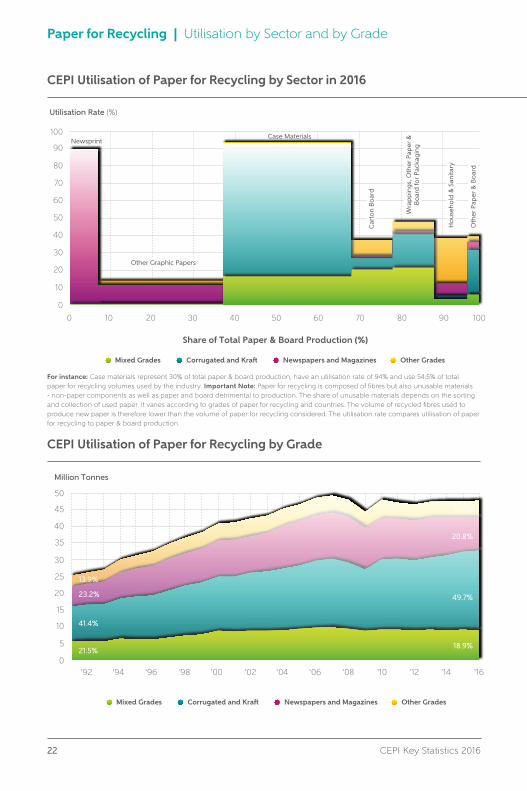
Paper for Recycling | Utilisation by Sector
CEPI Utilisation of Paper for Recycling by Sector in 2016
Grades of Paper for Recycling
'000 Tonnes A B C D E F G E:G
Paper Sector Mixed Grades
Corrugated and Kraft
Newspapers & Magazines
Other Grades
Total Use of Paper for
Recycling
Utilisation by Sector1
%
Total P&B Production
Utilisation Rate2
%
Newsprint 22 0 5,732 131 5,885 12.3 6,549 89.9
Other Graphic Papers 129 27 2,986 667 3,809 8.0 27,360 13.9
Total Newsprint + O.G.P. 151 27 8,719 797 9,694 20.3 33,909 28.6
Case Materials 4,571 20,254 231 944 26,000 54.5 27,733 93.8
Carton Board 1,865 581 90 850 3,386 7.1 9,049 37.4
Wrappings, Other Pack 1,914 1,707 170 454 4,246 8.9 8,888 47.8
Total Packaging Papers 8,351 22,541 492 2,248 33,632 70.4 45,671 73.6
Sanitary and Household 269 126 535 1,882 2,813 5.9 7,301 38.5
Other Paper & Board 245 1,044 190 132 1,611 3.4 4,050 39.8
Total Paper & Board 9,016 23,738 9,936 5,060 47,751 100.0 90,931 52.5
Share of Total 18.9% 49.7% 20.8% 10.6% 100.0%
De-inked Market Pulp 0 0 1 40 41
1 Utilisation by sector: total use of paper for recycling in a sector as a percentage of the total amount of paper for recycling used by the industry2 Utilisation rate: use of paper for recycling in a sector as a percentage of total paper & board production in that sector
CEPI Utilisation of Paper for Recycling by Country in 2016
25
50
75
100
125
0
CEPI Area84.9%
Imports from outside CEPI 15.1%
Other EU28 Countries 5.8%
Russia 5.3%
Belarus 2.1%
Ukraine 0.7%
Uruguay 0.7%
Brazil 0.3%
Switzerland 0.1%
United States 0.1%
47.8 MillionTonnes
Million Tonnes
Germany 35.4%
France 11.2%Spain 10.9%
Italy 10.2%
United Kingdom 6.3%
Austria 4.9%
Poland 5.1%
Netherlands 4.8%
Rest of CEPI Countries 11.3%
85%83%83% 83% 83% 82% 81%
83% 83%83%
89% 83% 84% 85% 84% 83% 85%
17%*17%
17% 17%17% 17%
17%17% 17%
18% 19%
11%16% 16%15% 15% 15%
‘00 ‘01 ‘02 ‘03 ‘04 ‘05 ‘06 ‘07 ‘08 ‘09 ‘10 ‘11 ‘12 ‘13 ‘14 ‘16‘15
Wood from Domestic Origin Imported Wood
22 CEPI Key Statistics 2016
Paper for Recycling | Utilisation by Sector and by Grade
CEPI Utilisation of Paper for Recycling by Sector in 2016
Case Materials
Mixed Grades Corrugated and Kraft Newspapers and Magazines Other Grades
Mixed Grades Corrugated and Kraft Newspapers and Magazines Other Grades
Utilisation Rate (%)
0
10
20
30
40
50
60
70
80
90
100
0
5
10
15
20
25
30
35
40
45
50
0
10
20
30
40
50
60
70
80
90
‘92 ‘94 ‘96 ‘98 ‘00 ‘02 ‘04 ‘06 ‘08 ‘10 ‘12 ‘14 ‘16
‘92 ‘94 ‘96 ‘98 ‘00 ‘02 ‘04 ‘06 ‘08 ‘10 ‘12 ‘14 ‘160 10 20 30 40 50 60 70 80 90 100
Share of Total Paper & Board Production (%)Recycling in Paper Mills Net Trade of Paper for Recycling
Non Recoverable
Total Paper & Board Consumption
Other Recycling / Recovery or Final Disposal
Recycling Rate (%)
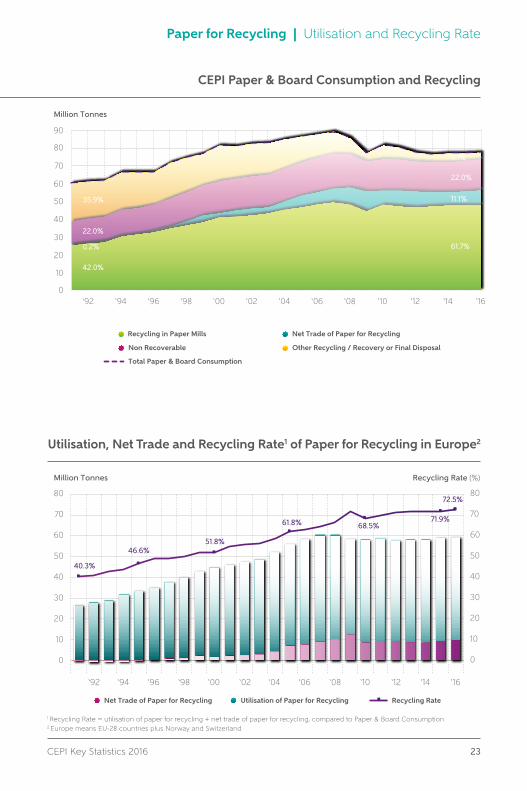
‘92 ‘94 ‘96 ‘98 ‘00 ‘02 ‘04 ‘06 ‘08 ‘10 ‘12 ‘14 ‘16
0
10
20
30
40
50
60
70
80
0
10
20
30
40
50
60
70
80
40.3%
46.6% 51.8%
61.8% 68.5% 71.9%
72.5%
Utilisation of Paper for RecyclingNet Trade of Paper for Recycling Recycling Rate
Million Tonnes
Million Tonnes
Million Tonnes
13.9%
23.2%
41.4%
21.5%
10.7%
20.8%
49.7%
18.9%
5.7%
22.0%
10.6%
61.6%
35.9%
22.0%
0.2%
42.0%
Newsprint
Other Graphic Papers
Car
ton
Bo
ard
Wra
pp
ings
, Oth
er P
aper
&B
oar
d fo
r Pa
ckag
ing
Ho
use
ho
ld &
San
itary
Oth
er P
aper
& B
oar
d
35.9%
22.0%
0.2%
42.0%
5.1%
22.0%
11.1%
61.7%
For instance: Case materials represent 30% of total paper & board production, have an utilisation rate of 94% and use 54.5% of total paper for recycling volumes used by the industry. Important Note: Paper for recycling is composed of fibres but also unusable materials - non-paper components as well as paper and board detrimental to production. The share of unusable materials depends on the sorting and collection of used paper. It varies according to grades of paper for recycling and countries. The volume of recycled fibres used to produce new paper is therefore lower than the volume of paper for recycling considered. The utilisation rate compares utilisation of paper for recycling to paper & board production.
CEPI Utilisation of Paper for Recycling by Grade
Case Materials
Mixed Grades Corrugated and Kraft Newspapers and Magazines Other Grades
Mixed Grades Corrugated and Kraft Newspapers and Magazines Other Grades
Utilisation Rate (%)
0
10
20
30
40
50
60
70
80
90
100
0
5
10
15
20
25
30
35
40
45
50
0
10
20
30
40
50
60
70
80
90
‘92 ‘94 ‘96 ‘98 ‘00 ‘02 ‘04 ‘06 ‘08 ‘10 ‘12 ‘14 ‘16
‘92 ‘94 ‘96 ‘98 ‘00 ‘02 ‘04 ‘06 ‘08 ‘10 ‘12 ‘14 ‘160 10 20 30 40 50 60 70 80 90 100
Share of Total Paper & Board Production (%)Recycling in Paper Mills Net Trade of Paper for Recycling
Non Recoverable
Total Paper & Board Consumption
Other Recycling / Recovery or Final Disposal
Recycling Rate (%)
‘92 ‘94 ‘96 ‘98 ‘00 ‘02 ‘04 ‘06 ‘08 ‘10 ‘12 ‘14 ‘16
0
10
20
30
40
50
60
70
80
0
10
20
30
40
50
60
70
80
40.3%
46.6% 51.8%
61.8% 68.5% 71.9%
72.5%
Utilisation of Paper for RecyclingNet Trade of Paper for Recycling Recycling Rate
Million Tonnes
Million Tonnes
Million Tonnes
13.9%
23.2%
41.4%
21.5%
10.7%
20.8%
49.7%
18.9%
5.7%
22.0%
10.6%
61.6%
35.9%
22.0%
0.2%
42.0%
Newsprint
Other Graphic Papers
Car
ton
Bo
ard
Wra
pp
ings
, Oth
er P
aper
&B
oar
d fo
r Pa
ckag
ing
Ho
use
ho
ld &
San
itary
Oth
er P
aper
& B
oar
d
35.9%
22.0%
0.2%
42.0%
5.1%
22.0%
11.1%
61.7%
CEPI Key Statistics 2016 23
Paper for Recycling | Utilisation and Recycling Rate
CEPI Paper & Board Consumption and Recycling
Case Materials
Mixed Grades Corrugated and Kraft Newspapers and Magazines Other Grades
Mixed Grades Corrugated and Kraft Newspapers and Magazines Other Grades
Utilisation Rate (%)
0
10
20
30
40
50
60
70
80
90
100
0
5
10
15
20
25
30
35
40
45
50
0
10
20
30
40
50
60
70
80
90
‘92 ‘94 ‘96 ‘98 ‘00 ‘02 ‘04 ‘06 ‘08 ‘10 ‘12 ‘14 ‘16
‘92 ‘94 ‘96 ‘98 ‘00 ‘02 ‘04 ‘06 ‘08 ‘10 ‘12 ‘14 ‘160 10 20 30 40 50 60 70 80 90 100
Share of Total Paper & Board Production (%)Recycling in Paper Mills Net Trade of Paper for Recycling
Non Recoverable
Total Paper & Board Consumption
Other Recycling / Recovery or Final Disposal
Recycling Rate (%)
‘92 ‘94 ‘96 ‘98 ‘00 ‘02 ‘04 ‘06 ‘08 ‘10 ‘12 ‘14 ‘16
0
10
20
30
40
50
60
70
80
0
10
20
30
40
50
60
70
80
40.3%
46.6% 51.8%
61.8% 68.5% 71.9%
72.5%
Utilisation of Paper for RecyclingNet Trade of Paper for Recycling Recycling Rate
Million Tonnes
Million Tonnes
Million Tonnes
13.9%
23.2%
41.4%
21.5%
10.7%
20.8%
49.7%
18.9%
5.7%
22.0%
10.6%
61.6%
35.9%
22.0%
0.2%
42.0%
Newsprint
Other Graphic Papers
Car
ton
Bo
ard
Wra
pp
ings
, Oth
er P
aper
&B
oar
d fo
r Pa
ckag
ing
Ho
use
ho
ld &
San
itary
Oth
er P
aper
& B
oar
d
35.9%
22.0%
0.2%
42.0%
5.1%
22.0%
11.1%
61.7%
Utilisation, Net Trade and Recycling Rate1 of Paper for Recycling in Europe2
Case Materials
Mixed Grades Corrugated and Kraft Newspapers and Magazines Other Grades
Mixed Grades Corrugated and Kraft Newspapers and Magazines Other Grades
Utilisation Rate (%)
0
10
20
30
40
50
60
70
80
90
100
0
5
10
15
20
25
30
35
40
45
50
0
10
20
30
40
50
60
70
80
90
‘92 ‘94 ‘96 ‘98 ‘00 ‘02 ‘04 ‘06 ‘08 ‘10 ‘12 ‘14 ‘16
‘92 ‘94 ‘96 ‘98 ‘00 ‘02 ‘04 ‘06 ‘08 ‘10 ‘12 ‘14 ‘160 10 20 30 40 50 60 70 80 90 100
Share of Total Paper & Board Production (%)Recycling in Paper Mills Net Trade of Paper for Recycling
Non Recoverable
Total Paper & Board Consumption
Other Recycling / Recovery or Final Disposal
Recycling Rate (%)
‘92 ‘94 ‘96 ‘98 ‘00 ‘02 ‘04 ‘06 ‘08 ‘10 ‘12 ‘14 ‘16
0
10
20
30
40
50
60
70
80
0
10
20
30
40
50
60
70
80
40.3%
46.6% 51.8%
61.8% 68.5% 71.9%
72.5%
Utilisation of Paper for RecyclingNet Trade of Paper for Recycling Recycling Rate
Million Tonnes
Million Tonnes
Million Tonnes
13.9%
23.2%
41.4%
21.5%
10.7%
20.8%
49.7%
18.9%
5.7%
22.0%
10.6%
61.6%
35.9%
22.0%
0.2%
42.0%
Newsprint
Other Graphic Papers
Car
ton
Bo
ard
Wra
pp
ings
, Oth
er P
aper
&B
oar
d fo
r Pa
ckag
ing
Ho
use
ho
ld &
San
itary
Oth
er P
aper
& B
oar
d
35.9%
22.0%
0.2%
42.0%
5.1%
22.0%
11.1%
61.7%
1 Recycling Rate = utilisation of paper for recycling + net trade of paper for recycling, compared to Paper & Board Consumption2 Europe means EU-28 countries plus Norway and Switzerland
24 CEPI Key Statistics 2016
Paper for Recycling | Exports and Imports
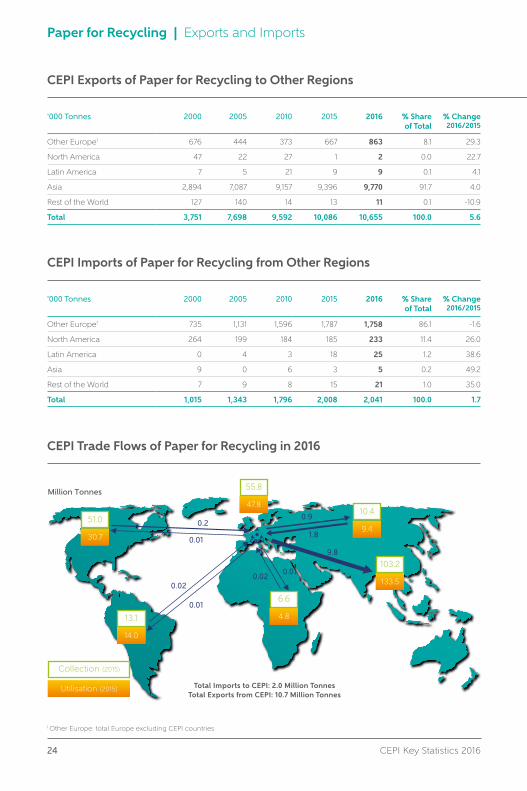
CEPI Exports of Paper for Recycling to Other Regions
'000 Tonnes 2000 2005 2010 2015 2016 % Share of Total
% Change2016/2015
Other Europe1 676 444 373 667 863 8.1 29.3
North America 47 22 27 1 2 0.0 22.7
Latin America 7 5 21 9 9 0.1 4.1
Asia 2,894 7,087 9,157 9,396 9,770 91.7 4.0
Rest of the World 127 140 14 13 11 0.1 -10.9
Total 3,751 7,698 9,592 10,086 10,655 100.0 5.6
CEPI Imports of Paper for Recycling from Other Regions
'000 Tonnes 2000 2005 2010 2015 2016 % Share of Total
% Change2016/2015
Other Europe1 735 1,131 1,596 1,787 1,758 86.1 -1.6
North America 264 199 184 185 233 11.4 26.0
Latin America 0 4 3 18 25 1.2 38.6
Asia 9 0 6 3 5 0.2 49.2
Rest of the World 7 9 8 15 21 1.0 35.0
Total 1,015 1,343 1,796 2,008 2,041 100.0 1.7
CEPI Trade Flows of Paper for Recycling in 2016
Asia22.2%
Asia34.4%
Latin America
14.8%
Latin America
5.6%
Rest of theworld2.5%
Rest of theworld2.4%
CEPI20.3%
Other Europe3
4.2%
NorthAmerica36.0%
CEPI22.9%
Other Europe3
4.4%
NorthAmerica30.3%
Imports to CEPIExports from CEPI
Million Tonnes
178.8Million Tonnes
(-0.2%)
179.4 Million Tonnes
(-0.2%)
B:C<
;>:?<
D>:@<
Total Imports to CEPI: 2.0 Million TonnesTotal Exports from CEPI: 10.7 Million Tonnes
30.7
51.0
Utilisation (2015)
Collection (2015)
47.8
55.8
9.4
10.4
4.8
6.6
14.0
13.1
133.5
103.2
0.2
0.01
0.02
0.01
0.020.01
9.8
0.9
1.8
1 Other Europe: total Europe excluding CEPI countries
CEPI Key Statistics 2016 25
Non-Fibrous Materials
CEPI Trade Flows of Paper for Recycling in 2016
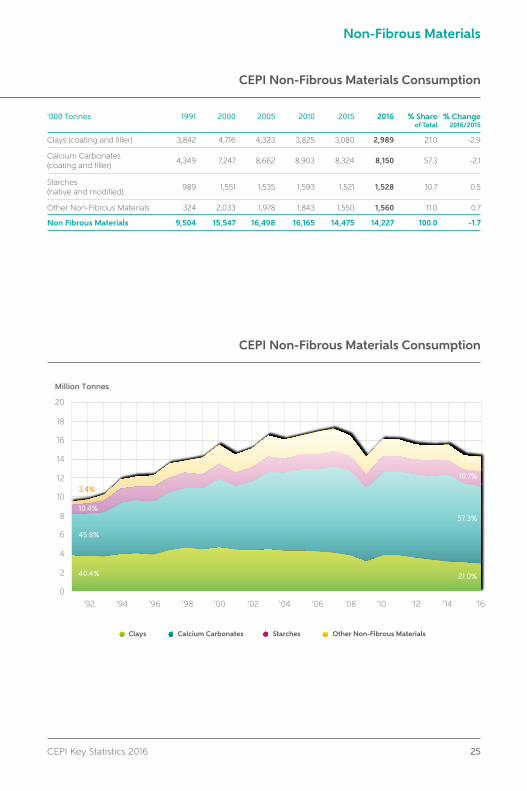
CEPI Non-Fibrous Materials Consumption
'000 Tonnes 1991 2000 2005 2010 2015 2016 % Shareof Total
% Change2016/2015
Clays (coating and filler) 3,842 4,716 4,323 3,825 3,080 2,989 21.0 -2.9
Calcium Carbonates (coating and filler)
4,349 7,247 8,662 8,903 8,324 8,150 57.3 -2.1
Starches (native and modified)
989 1,551 1,535 1,593 1,521 1,528 10.7 0.5
Other Non-Fibrous Materials 324 2,033 1,978 1,843 1,550 1,560 11.0 0.7
Non Fibrous Materials 9,504 15,547 16,498 16,165 14,475 14,227 100.0 -1.7
CEPI Non-Fibrous Materials Consumption
0
2
4
6
8
10
12
14
16
18
20
‘92 ‘94 ‘96 ‘98 ‘00 ‘02 ‘04 ‘06 ‘08 ‘10 ‘12 ‘14 ‘16
Clays Calcium Carbonates Starches Other Non-Fibrous Materials
Million Tonnes
3.4%
10.4%
45.8%
40.4%
11.0%
10.7%
57.3%
21.0%
26 CEPI Key Statistics 2016
Energy | Energy and Electricity Consumption
Primary Energy Consumption TJ
1991 2000 2005 2010 2014 2015 % Shareof Total
% Change2015/2014
Gas 259,593 404,946 489,425 489,565 395,169 395,234 34.7 0.0
Fuel Oil 129,461 90,914 67,454 37,856 19,481 19,431 1.7 -0.3
Coal 113,867 59,304 48,314 53,280 39,966 44,690 3.9 11.8
Other Fossil Fuels 10,134 19,052 19,714 14,529 11,275 10,625 0.9 -5.8
Biomass 413,248 562,865 635,511 677,569 647,986 657,878 57.7 1.5
Other 3,560 4,151 8,602 8,948 12,018 12,374 1.1 3.0
Total Fuels Consumption 929,863 1,141,232 1,268,995 1,281,746 1,125,896 1,140,230 100.0 1.3
Net Bought Electricity 205,852 246,864 228,050 202,945 175,605 171,464 -2.4
Total Primary Energy Consumption
1,135,715 1,388,096 1,497,045 1,484,691 1,301,501 1,311,695 0.8
Fraction of Biomass in Total Fuels Consumption 44.4% 49.4% 50.1% 52.9% 57.6% 57.7% 0.1
Electricity Consumption GWh
1991 2000 2005 2010 2014 2015 % Shareof Total
% Change2015/2014
Total Electricity Produced at Site
29,416 41,930 50,462 56,780 51,823 52,308 52.3 0.9
Purchased Electricity 59,045 72,255 72,815 67,567 59,916 58,738 58.8 -2.0
Sold Electricity -1,864 -3,681 -9,468 -11,193 -11,137 -11,109 11.1 -0.3
Total Electricity Consumption 86,527 110,424 113,874 113,137 100,602 99,937 100.0 -0.7
% of Electricity produced through CHP2 88.0% 90.4% 94.4% 95.4% 96.0% 96.1% 0.1
CEPI Primary Energy and Electricity Consumption1
Gas34.7%
Coal3.9%
FuelOil
1.7%
OtherFossilFuels0.9%
1,140,200 TJ
Biomass 57.7%
Others1.1%
CEPI Fuels Consumption in 20151
1 Excluding Hungary , Romania & Slovenia - excluding Poland before 2003 - Figures for 2016 will be available in December 2017.2 CHP: combined heat and power (compared to total on-site electricity generation).
CEPI Key Statistics 2016 27
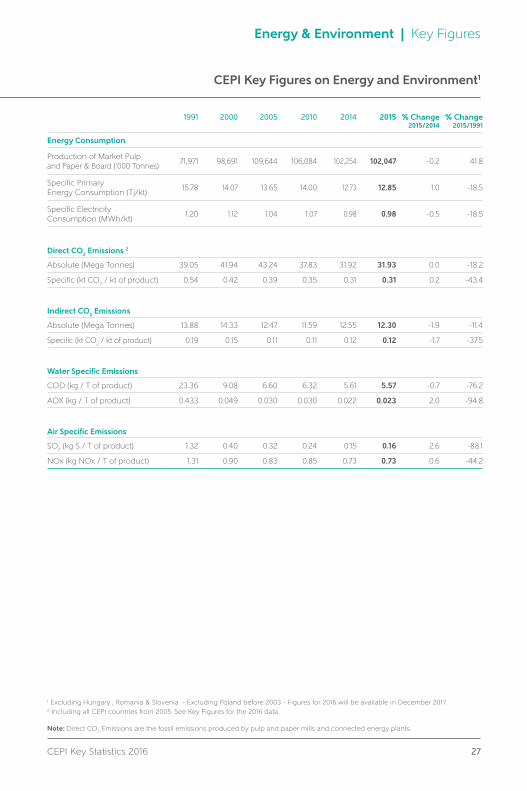
Energy & Environment | Key Figures
CEPI Key Figures on Energy and Environment1
1991 2000 2005 2010 2014 2015 % Change2015/2014
% Change2015/1991
Energy Consumption
Production of Market Pulpand Paper & Board ('000 Tonnes)
71,971 98,691 109,644 106,084 102,254 102,047 -0.2 41.8
Specific Primary Energy Consumption (Tj/kt)
15.78 14.07 13.65 14.00 12.73 12.85 1.0 -18.5
Specific Electricity Consumption (MWh/kt)
1.20 1.12 1.04 1.07 0.98 0.98 -0.5 -18.5
Direct CO2 Emissions 2
Absolute (Mega Tonnes) 39.05 41.94 43.24 37.83 31.92 31.93 0.0 -18.2
Specific (kt CO2 / kt of product) 0.54 0.42 0.39 0.35 0.31 0.31 0.2 -43.4
Indirect CO2 Emissions
Absolute (Mega Tonnes) 13.88 14.33 12.47 11.59 12.55 12.30 -1.9 -11.4
Specific (kt CO2 / kt of product) 0.19 0.15 0.11 0.11 0.12 0.12 -1.7 -37.5
Water Specific Emissions
COD (kg / T of product) 23.36 9.08 6.60 6.32 5.61 5.57 -0.7 -76.2
AOX (kg / T of product) 0.433 0.049 0.030 0.030 0.022 0.023 2.0 -94.8
Air Specific Emissions
SO2 (kg S / T of product) 1.32 0.40 0.32 0.24 0.15 0.16 2.6 -88.1
NOx (kg NOx / T of product) 1.31 0.90 0.83 0.85 0.73 0.73 0.6 -44.2
1 Excluding Hungary , Romania & Slovenia - Excluding Poland before 2003 - Figures for 2016 will be available in December 2017.2 Including all CEPI countries from 2005. See Key Figures for the 2016 data.
Note: Direct CO2 Emissions are the fossil emissions produced by pulp and paper mills and connected energy plants.
28 CEPI Key Statistics 2016
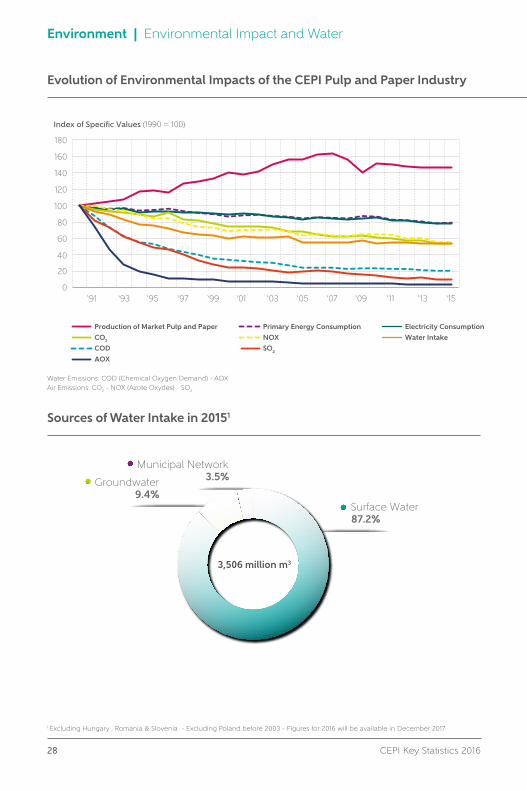
Environment | Environmental Impact and Water
Evolution of Environmental Impacts of the CEPI Pulp and Paper Industry
Index of Specific Values (1990 = 100)
‘91 ‘93 ‘95 ‘97 ‘99 ‘01 ‘03 ‘05 ‘07 ‘09 ‘11 ‘13 ‘150
20
40
60
80
100
120
140
160
180
Production of Market Pulp and Paper Primary Energy Consumption Electricity Consumption
CO2 NOX Water Intake
COD
AOX
SO2
Surface Water87.2%
Number of Employees ('000 Employees) Average Number of Employees per Mill
‘00 ‘01 ‘02 ‘03 ‘04 ‘05 ‘06 ‘07 ‘08 ‘09 ‘10 ‘11 ‘12 ‘13 ‘15‘14
50
100
150
200
250
300
350
400
450
50
100
150
200
250
300
350
400
450
15
20
25
30
35
40
45
50
10
44.9 44.4
40.4
32.1
27.0
24.3
24.8
23.7
23.1
19.8
19.5
18.516.9 16.5
15.7
16.0
3,506 million m3
Groundwater9.4%
Municipal Network3.5%
‘92 ‘94 ‘96 ‘98 ‘00 ‘02 ‘04 ‘06 ‘08 ‘10 ‘12 ‘14 ‘16
Number of Employees Average Number of Employees per Mill
0 0
Sources of Water Intake in 20151
1 Excluding Hungary , Romania & Slovenia - Excluding Poland before 2003 - Figures for 2016 will be available in December 2017.
Water Emissions: COD (Chemical Oxygen Demand) - AOX Air Emissions: CO2 - NOX (Azote Oxydes) - SO2
CEPI Key Statistics 2016 29
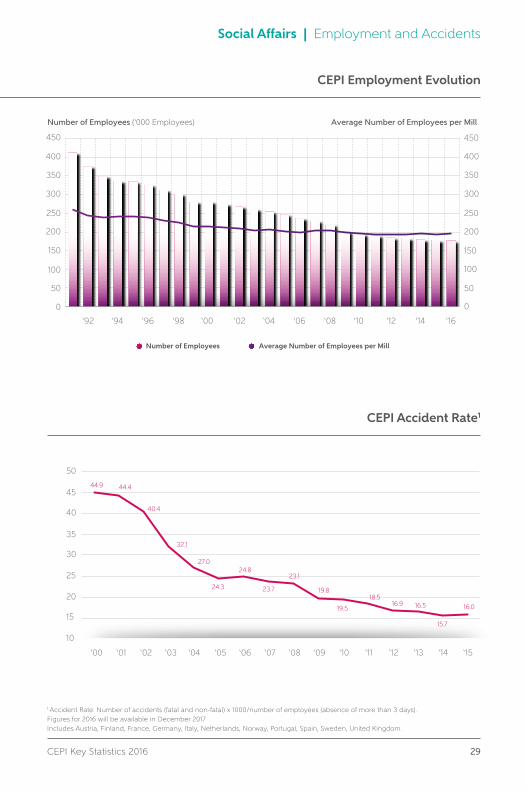
Social Affairs | Employment and Accidents
CEPI Employment EvolutionIndex of Specific Values (1990 = 100)
‘91 ‘93 ‘95 ‘97 ‘99 ‘01 ‘03 ‘05 ‘07 ‘09 ‘11 ‘13 ‘150
20
40
60
80
100
120
140
160
180
Production of Market Pulp and Paper Primary Energy Consumption Electricity Consumption
CO2 NOX Water Intake
COD
AOX
SO2
Surface Water87.2%
Number of Employees ('000 Employees) Average Number of Employees per Mill
‘00 ‘01 ‘02 ‘03 ‘04 ‘05 ‘06 ‘07 ‘08 ‘09 ‘10 ‘11 ‘12 ‘13 ‘15‘14
50
100
150
200
250
300
350
400
450
50
100
150
200
250
300
350
400
450
15
20
25
30
35
40
45
50
10
44.9 44.4
40.4
32.1
27.0
24.3
24.8
23.7
23.1
19.8
19.5
18.516.9 16.5
15.7
16.0
3,506 million m3
Groundwater9.4%
Municipal Network3.5%
‘92 ‘94 ‘96 ‘98 ‘00 ‘02 ‘04 ‘06 ‘08 ‘10 ‘12 ‘14 ‘16
Number of Employees Average Number of Employees per Mill
0 0
CEPI Accident Rate1
Index of Specific Values (1990 = 100)
‘91 ‘93 ‘95 ‘97 ‘99 ‘01 ‘03 ‘05 ‘07 ‘09 ‘11 ‘13 ‘150
20
40
60
80
100
120
140
160
180
Production of Market Pulp and Paper Primary Energy Consumption Electricity Consumption
CO2 NOX Water Intake
COD
AOX
SO2
Surface Water87.2%
Number of Employees ('000 Employees) Average Number of Employees per Mill
‘00 ‘01 ‘02 ‘03 ‘04 ‘05 ‘06 ‘07 ‘08 ‘09 ‘10 ‘11 ‘12 ‘13 ‘15‘14
50
100
150
200
250
300
350
400
450
50
100
150
200
250
300
350
400
450
15
20
25
30
35
40
45
50
10
44.9 44.4
40.4
32.1
27.0
24.3
24.8
23.7
23.1
19.8
19.5
18.516.9 16.5
15.7
16.0
3,506 million m3
Groundwater9.4%
Municipal Network3.5%
‘92 ‘94 ‘96 ‘98 ‘00 ‘02 ‘04 ‘06 ‘08 ‘10 ‘12 ‘14 ‘16
Number of Employees Average Number of Employees per Mill
0 0
1 Accident Rate: Number of accidents (fatal and non-fatal) x 1000/number of employees (absence of more than 3 days).Figures for 2016 will be available in December 2017Includes Austria, Finland, France, Germany, Italy, Netherlands, Norway, Portugal, Spain, Sweden, United Kingdom.
30 CEPI Key Statistics 2016
PULPPulp Consumption: production + Imports from outside CEPI - Exports to outside CEPIIntegrated Pulp Production: integrated pulp is produced for use as raw material in the production of paper at the same mill, or for shipment by a producing mill to other mills, which it owns, controls or with which it is affiliated within the same country and therefore not sold on the open market.Pulp Grades:Mechanical - Stone groundwood: pulp produced by grinding wood into relatively short fibres.CEPI Harmonised Code is 923 000 000.Thermo-mechanical: pulp produced in a thermo-mechanical process where wood particles are softened by steam before entering a pressurised refiner. CEPI Harmonised Code is 923 400 000.Semi-chemical: pulp produced in a two-stage process which involves partial digestion with chemicals, followed by mechanical treatment in a disc refiner. CEPI Harmonised Code is 921 000 000.Chemical - Sulphite: pulp produced by cooking wood chips in a pressure vessel in the presence of bisulphite liquor.CEPI Harmonised Code is 922 200 000. Chemical - Sulphate (or kraft): pulp produced by cooking wood chips in pressure vessels in the presence of a sodium hydroxide (soda) liquor. CEPI Harmonised Code is 922 100 000.Other Pulp: pulp produced from fibres other than wood, such as sugar cane bagasse, wheat straw, kenaf, cotton rags and hemp.
PAPERPaper and Board Consumption: Production + Imports from outside CEPI - Exports to outside CEPIPaper Grades:Newsprint: paper mainly used for printing newspapers. CEPI Harmonised Code is 100 000 000.Uncoated mechanical: paper suitable for printing or other graphic purposes where less than 90% of the fibre furnish consists of chemical pulp fibres. CEPI Harmonised Code is 211 000 000.Uncoated woodfree: paper suitable for printing or other graphic purposes where at least 90% of the fibre furnish consists of chemical pulp fibres. CEPI Harmonised Code is 231 000 000.Coated papers: all paper suitable for printing or other graphic purposes and coated on one or both sides with minerals such as china clay (kaolin), calcium carbonate, etc. CEPI Harmonised Code for Coated Mechanical is 212 000 000 and for Coated Woodfree is 232 000 000.Sanitary and Household: this covers a wide range of tissue and other hygienic paper for use in households or commercial and industrial premises. CEPI Harmonised Code is 700 000 000.Case materials: paper and board mainly used in the manufacture of corrugated board. Included are kraftliner, testliner, semi-chemical fluting, and waste-based fluting (Wellenstoff). Also known as containerboard, corrugated case materials, cardboard, linerboard or corrugating medium. CEPI Harmonised Code is 300 000 000.Carton board: made from virgin and/or recovered fibres, mainly used in cartons for consumer products. Also known as solid board, folding boxboard, boxboard or carrier board. CEPI Harmonised Code is 400 000 000.Wrappings: paper whose main use is wrapping or packaging made from any combination of virgin or recovered fibres, bleached or unbleached. Included are sack kraft, other wrapping krafts, sulphite and grease-proof paper. CEPI Harmonised Code is 500 000 000.Other paper and board for packaging: this category embraces all paper and board mainly for packaging purposes other than those listed above. CEPI Harmonised Code is 600 000 000.Other paper and board: includes cigarette paper and filter paper, as well as gypsum liners and special paper for waxing, insulating, roofing, asphalting, and other specific applications or treatments. CEPI Harmonised Code is 800 000 000.
PAPER FOR RECYCLINGCollection: utilisation plus exports minus imports of paper for recycling.Utilisation rate: percentage of paper for recycling utilisation compared to the total paper & board production.Important Note: Paper for recycling is composed of fibres but also unusable materials - non-paper components as well as paper and board detrimental to production. The share of unusable materials depends on the actual sorting and collection of used paper. It varies according to paper for recycling grades and countries. The volume of recycled fibres used to produce new paper is therefore lower than the respective volume of paper for recycling. The utilisation rate compares utilisation of paper for recycling to paper & board production.Recycling rate: utilisation of paper for recycling + net trade of paper for recycling, compared to paper & boardconsumption.Utilisation by sector: total utilisation of paper for recycling in a sector as a percentage of the overall utilisation of paperfor recycling.
Glossary
More information can be found in the CEPI booklet "Pulp and paper industry - definitions and concepts" available on
CEPI's website.
CEPI National Associations' Contact Details
CEPI Key Statistics 2016 31
AustriaAUSTROPAPIERVereinigung derÖsterreichischenPapierindustrieGumpendorfer Straße 6A-1061 ViennaT +43 1 588 86 0F +43 1 588 86 [email protected]
BelgiumCOBELPAAssociation desFabricants de Pâtes,Papier et Cartonsde BelgiqueVereniging van deBelgische Fabrikantenvan Papierdeeg,Papier en Karton5 Boulevard de la PlaineB-1050 BrusselsT +32 2 646 64 50F +32 2 646 82 [email protected]
Czech RepublicACPPAssociation of the CzechPulp and Paper IndustryU Uranie 954/18CZ-170 00 Praha 7T +420 602 244 [email protected]
FinlandFFIFFinnish Forest IndustriesFederationSnellmaninkatu 13FIN-00170 HelsinkiPO Box 336FIN-00171 HelsinkiT +358 9 132 [email protected]
FranceCOPACELUnion Française desIndustries des Cartons,Papiers et Celluloses23 - 25 rue d’AumaleF-75009 ParisT +33 1 53 89 24 00F +33 1 53 89 24 [email protected]
GermanyVDPVerband DeutscherPapierfabrikenAdenauerallee 55D-53113 BonnT +49 228 267 050F +49 228 267 05 [email protected]
HungaryFederation ofthe Hungarian Printersand Paper MakersBartók Béla út 41.H-1114 BudapestT +36 1 350 77 28F +36 1 350 77 [email protected]
ItalyASSOCARTAAssociazione Italiana fragli Industriali della Carta,Cartoni e Paste per CartaBastioni di Porta Volta 7I-20121 MilanoT +39 02 290 03 018F +39 02 290 03 [email protected]
Viale Pasteur 8-10I-00144 RomaT +39 06 591 91 31F +39 06 591 08 [email protected]
The NetherlandsRoyal VNPVereniging vanNederlandsePapier- en kartonfabriekenKruisweg 761NL-2132 NE HoofddorpPO Box 731NL-2130 AS HoofddorpT +31 20 654 30 55F +31 20 654 30 [email protected]
NorwayNorsk IndustriMiddelthunsgate 27PO Box 7072 MajorstuenN-0306 OsloT +47 23 08 88 [email protected]
PolandSPPAssociation of PolishPapermakersPl. Komuny Paryskiej 5APO Box 200PL-90-007 ŁódźT +48 42 630 01 17F +48 42 632 43 [email protected]/[email protected]. Al. Jerozolimskie 44,room 1126PL-00-024 WarszawaT +48 22 433 61 20F +48 22 433 61 [email protected]
PortugalCELPAAssociação daIndústria PapeleiraRua Marquês deSá da Bandeira 74-2°P-1069 - 076 LisboaT +351 21 761 15 10F +351 21 761 15 [email protected]
RomaniaROMPAPThe PatronizingOrganization forRomanian Pulpand Paper IndustryPiata Walter Maracineanu1-3Intr. 2, Et. 2, Cam. 177-178RO-Sector 1 BucharestT +40 21 315 01 62F +40 21 315 00 [email protected]
Slovak RepublicZCPP SRSlovak Pulp and PaperIndustry AssociationTichá 30SK-974 04 Banská BystricaT +421 48 412 37 76F +421 48 412 37 [email protected]
SloveniaChamber of Commerceand Industry of SloveniaPaper and PaperConverting AssociationDimiceva 13, SI-1504LjubljanaSloveniaT +386 1 5898 274F +386 1 5898 100M +386 41 316 [email protected]
SpainASPAPELAsociación Españolade Fabricantes de Pasta,Papel y CartónAvenida de Baviera 15E-28028 MadridT +34 91 576 30 03F +34 91 577 47 [email protected]
SwedenSFIFSwedish ForestIndustries FederationStorgatan 19PO Box 55525SE-102 04 StockholmT +46 8 762 72 60F +46 8 611 71 [email protected]
United KingdomCPIConfederationof Paper Industries1 Rivenhall RoadSwindonWiltshire SN5 78DUnited KingdomT +44 1 793 88 96 00F +44 1 793 87 87 [email protected]
CEPI aisblConfederation of European Paper Industries250 Avenue Louise, Box 80B-1050 Brussels
Tel: +32 2 627 49 11 | Fax: +32 2 646 81 [email protected]: @CEPI_Paper www.cepi.org/topics/statistics
Jun
e 20
17D
esig
n b
y A
bso
lute
-Ag
ency
.be
This brochure is printed on certified paper from sustainably-managed sources.