Embed Size (px)
Citation preview
16
defining the WCU
• self-declaration
• reputation
• rankings
17
18
19
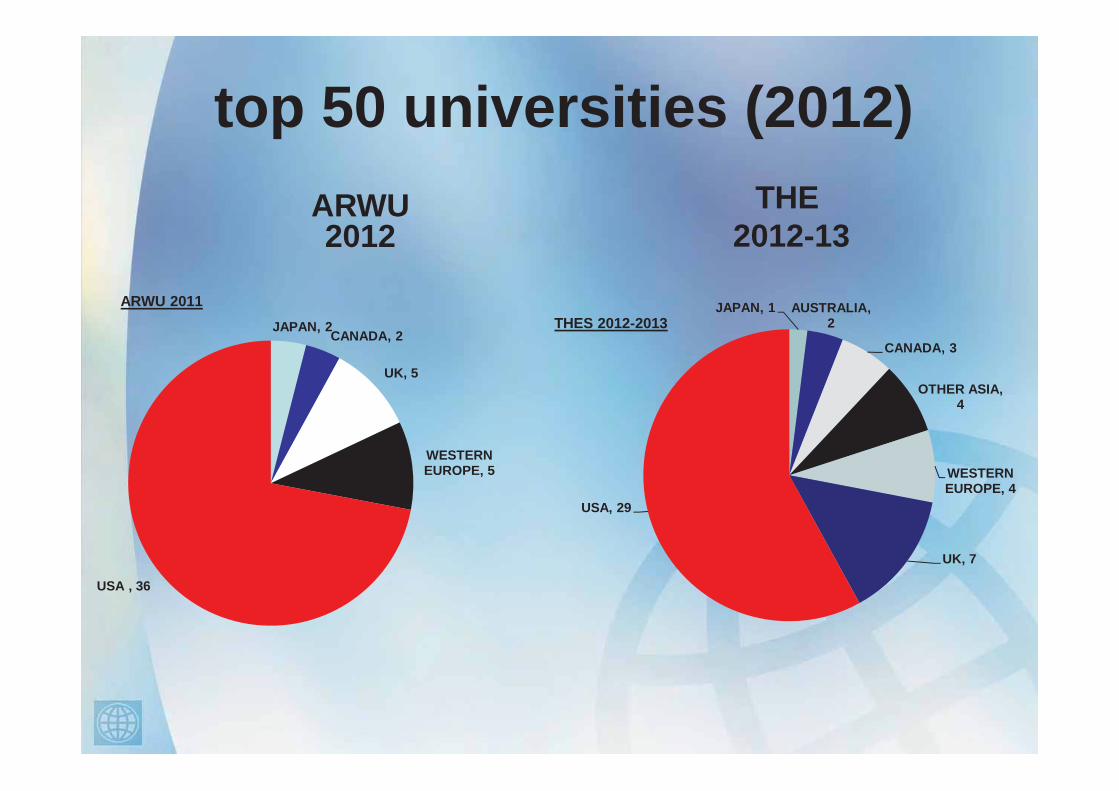
top 50 universities (2012)ARWU 2012
THE2012-13
JAPAN, 2CANADA, 2
UK, 5
WESTERN EUROPE, 5
USA , 36
ARWU 2011 JAPAN, 1 AUSTRALIA, 2
CANADA, 3
OTHER ASIA, 4
WESTERN EUROPE, 4
UK, 7
USA, 29
THES 2012-2013
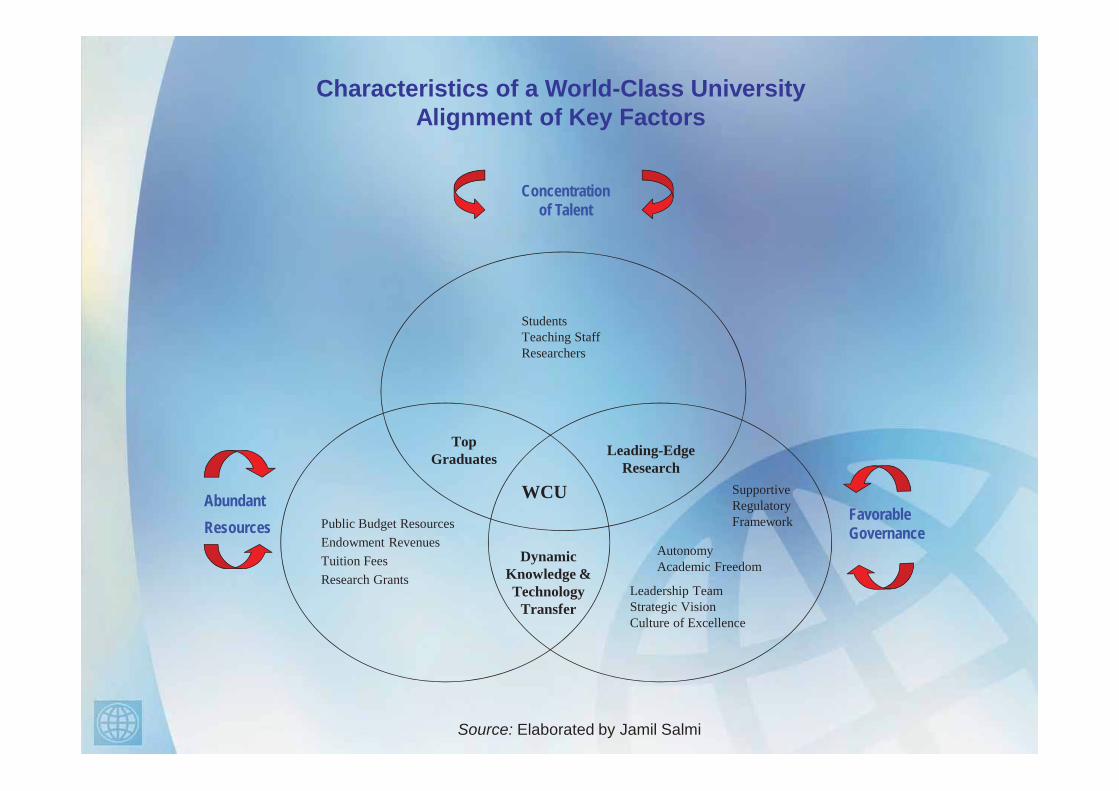
AutonomyAcademic Freedom
StudentsTeaching StaffResearchers
Leading-Edge Research
Dynamic Knowledge & Technology
Transfer
Concentration of Talent
AbundantResources
Favorable Governance
Leadership TeamStrategic VisionCulture of Excellence
Public Budget ResourcesEndowment RevenuesTuition FeesResearch Grants
WCU Supportive Regulatory Framework
Top Graduates
Characteristics of a World-Class UniversityAlignment of Key Factors
Source: Elaborated by Jamil Salmi

concentration of talent
• teachers and researchers
• incoming students
• undergraduate / graduate students balance
22
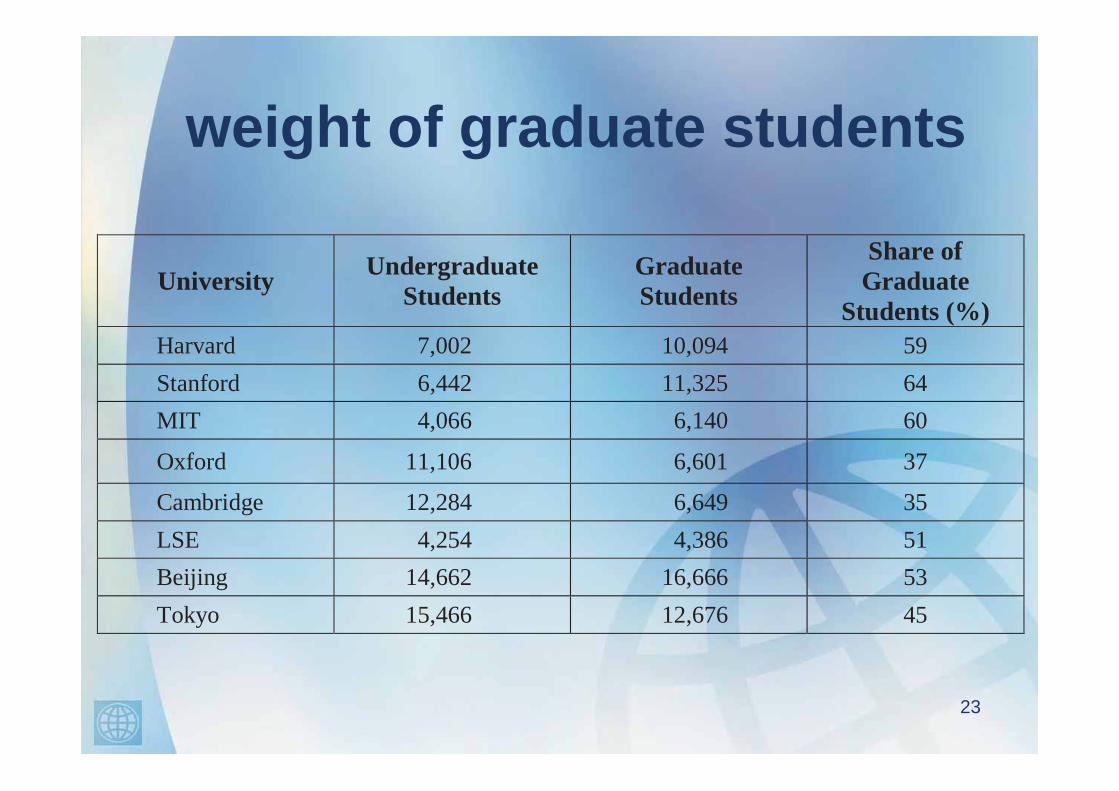
weight of graduate students
University Undergraduate Students
Graduate Students
Share of Graduate
Students (%) Harvard 7,002 10,094 59 Stanford 6,442 11,325 64 MIT 4,066 6,140 60
Oxford 11,106 6,601 37
Cambridge 12,284 6,649 35 LSE 4,254 4,386 51 Beijing 14,662 16,666 53Tokyo 15,466 12,676 45
23
concentration of talent
• teachers and researchers
• incoming students
• undergraduate / graduate students balance– but involving undergraduate students in
research
• international dimensions24
international dimensions
• foreign faculty– Caltech (37%), Harvard (30%), Oxford (36%),
ETH Zürich (60%)
• foreign students– Harvard (19%), Cambridge (18%)
25
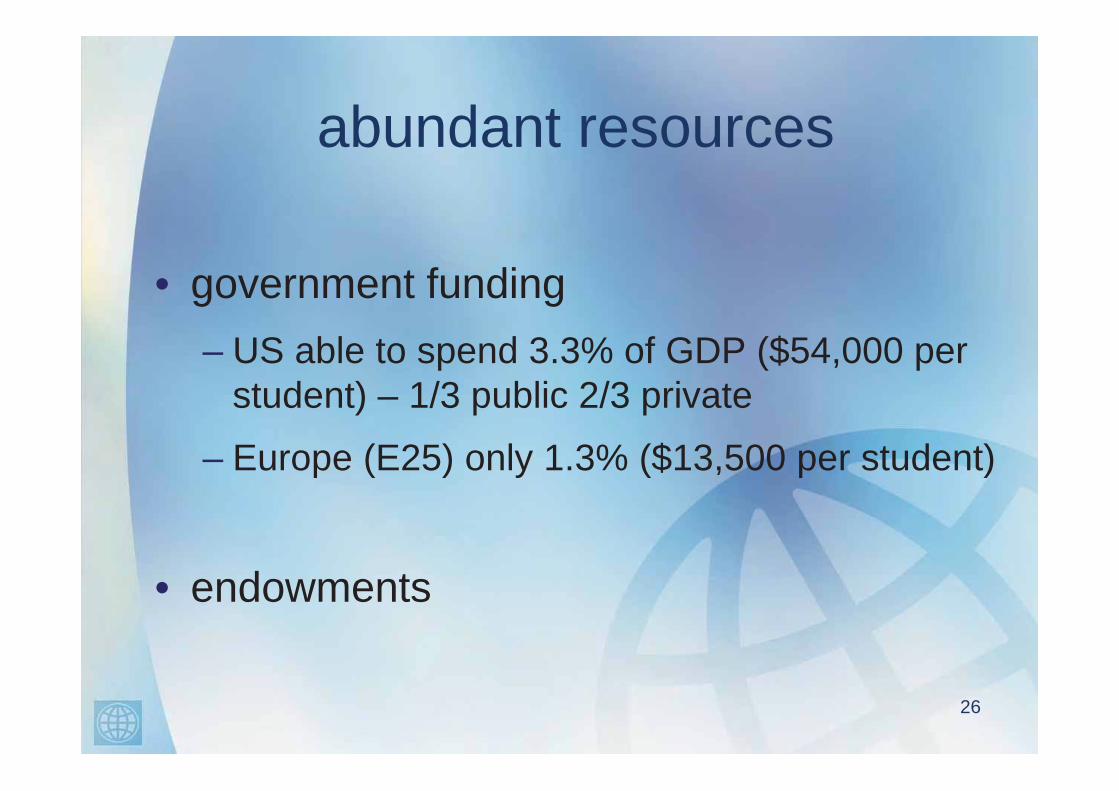
abundant resources
• government funding– US able to spend 3.3% of GDP ($54,000 per
student) – 1/3 public 2/3 private
– Europe (E25) only 1.3% ($13,500 per student)
• endowments
26

27
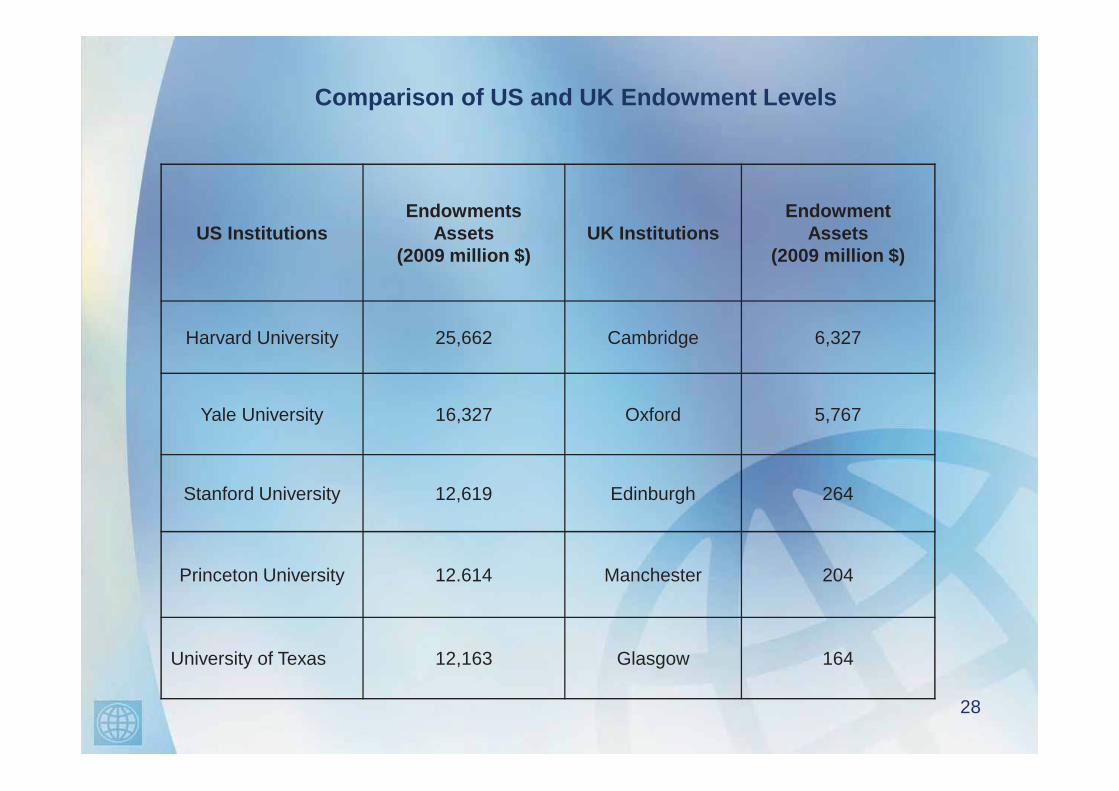
Comparison of US and UK Endowment Levels
28
US InstitutionsEndowments
Assets(2009 million $)
UK InstitutionsEndowment
Assets(2009 million $)
Harvard University 25,662 Cambridge 6,327
Yale University 16,327 Oxford 5,767
Stanford University 12,619 Edinburgh 264
Princeton University 12.614 Manchester 204
University of Texas 12,163 Glasgow 164
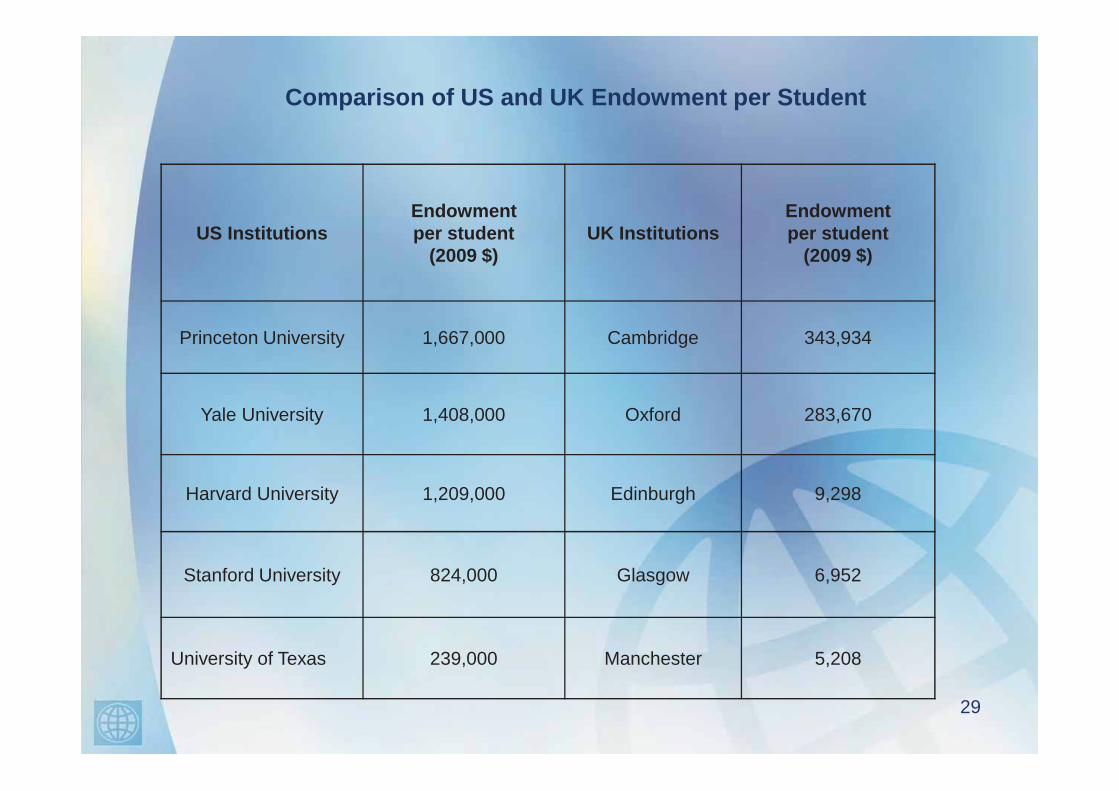
Comparison of US and UK Endowment per Student
29
US InstitutionsEndowmentper student
(2009 $)UK Institutions
Endowment per student
(2009 $)
Princeton University 1,667,000 Cambridge 343,934
Yale University 1,408,000 Oxford 283,670
Harvard University 1,209,000 Edinburgh 9,298
Stanford University 824,000 Glasgow 6,952
University of Texas 239,000 Manchester 5,208
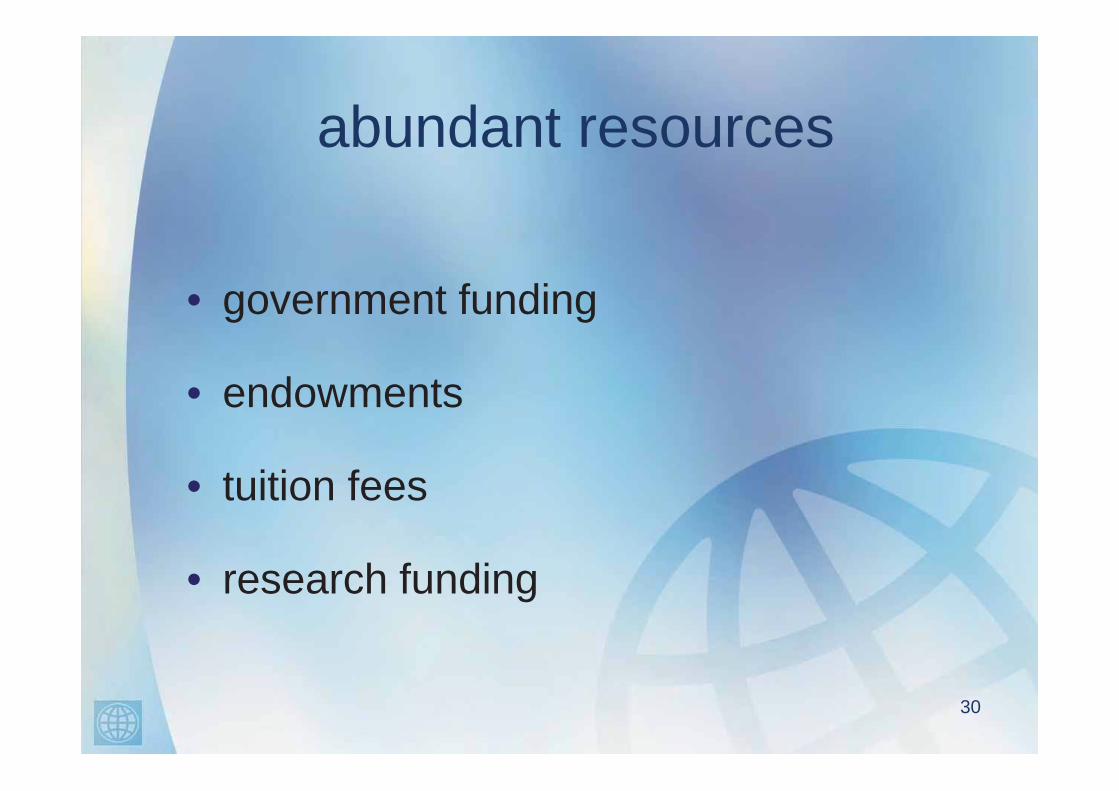
abundant resources
• government funding
• endowments
• tuition fees
• research funding
30
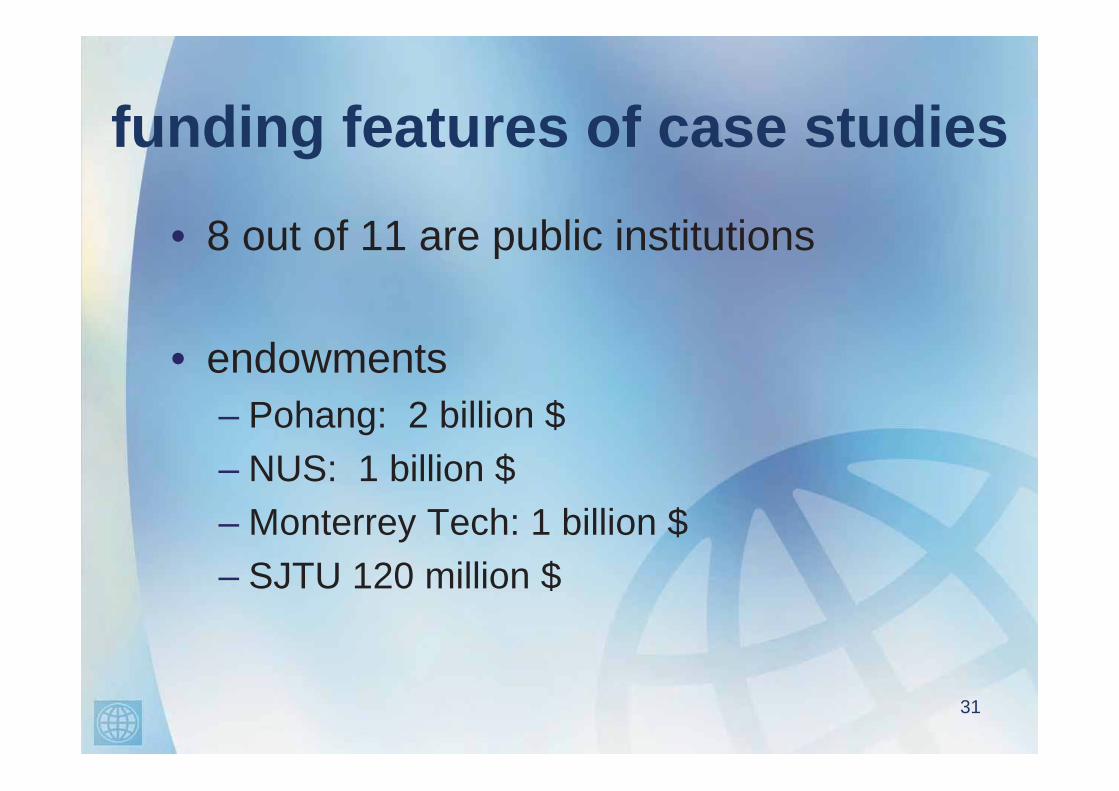
funding features of case studies
• 8 out of 11 are public institutions
• endowments– Pohang: 2 billion $– NUS: 1 billion $– Monterrey Tech: 1 billion $– SJTU 120 million $
31

32

favorable governance• freedom from civil service rules (human
resources, procurement, financial management)
• management autonomy
– flexibility and responsiveness with power to act
• selection of leadership team
• independent Board with outside representation
33
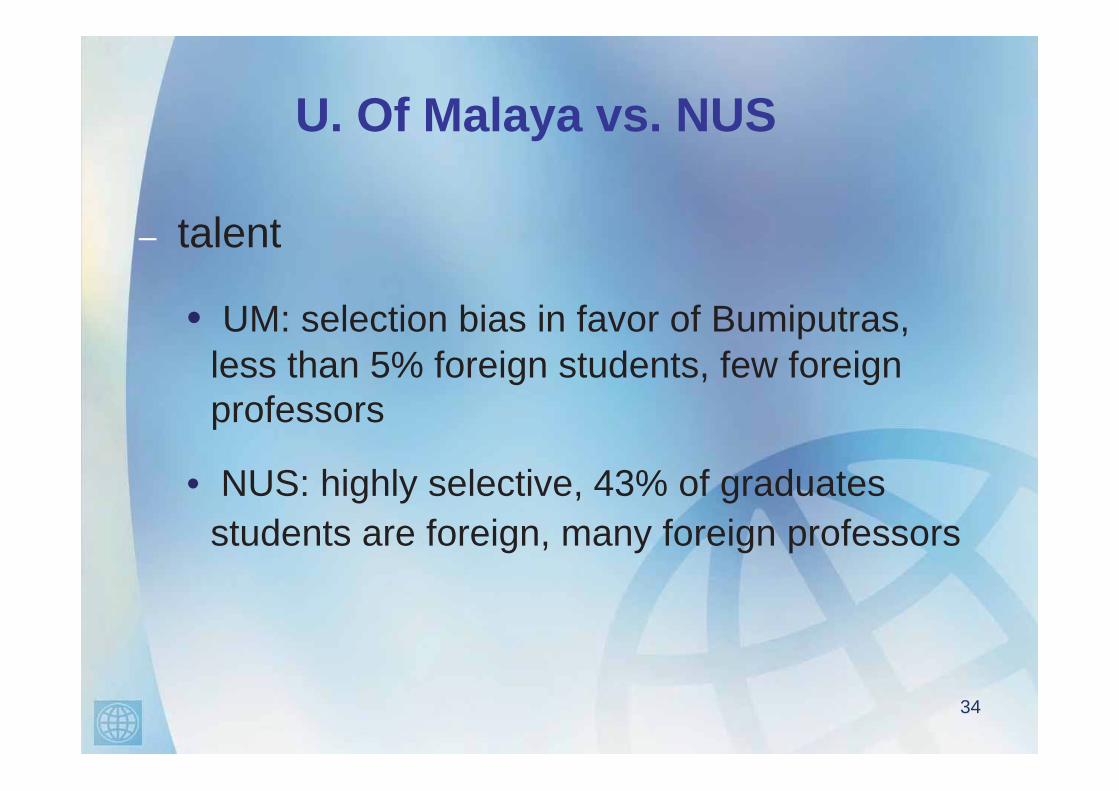
U. Of Malaya vs. NUS
– talent
• UM: selection bias in favor of Bumiputras, less than 5% foreign students, few foreign professors
• NUS: highly selective, 43% of graduates students are foreign, many foreign professors
34
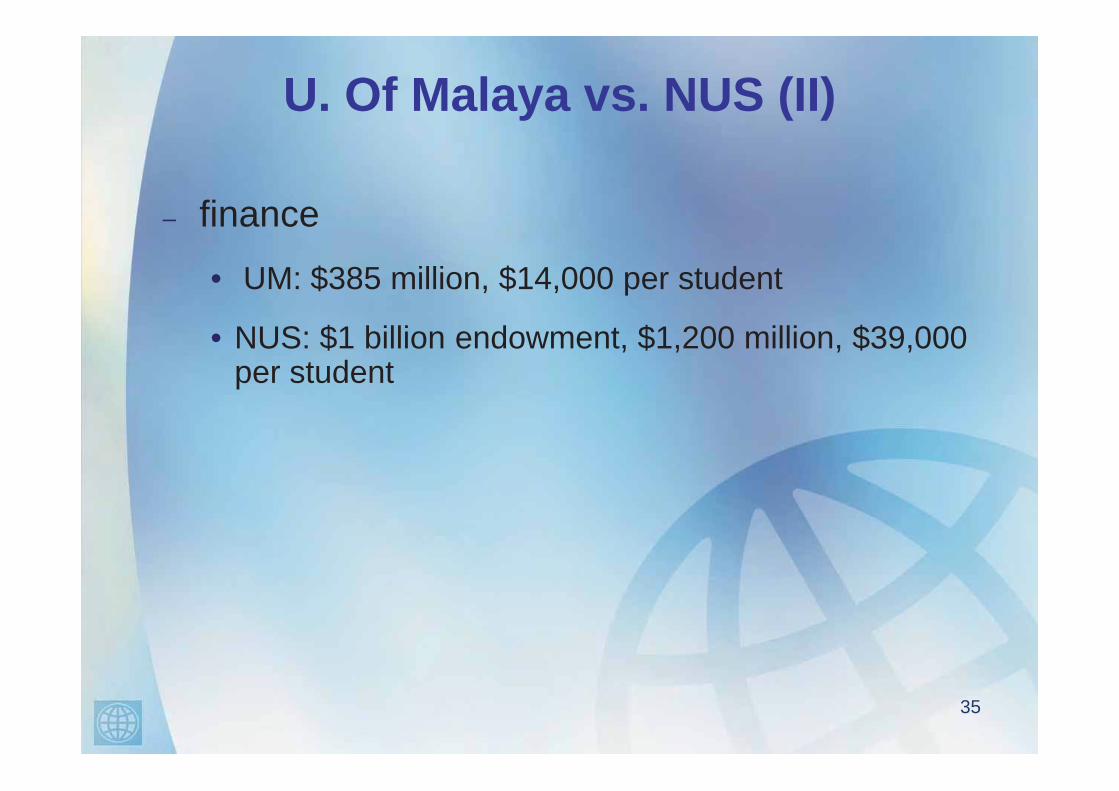
U. Of Malaya vs. NUS (II)
– finance
• UM: $385 million, $14,000 per student
• NUS: $1 billion endowment, $1,200 million, $39,000 per student
35
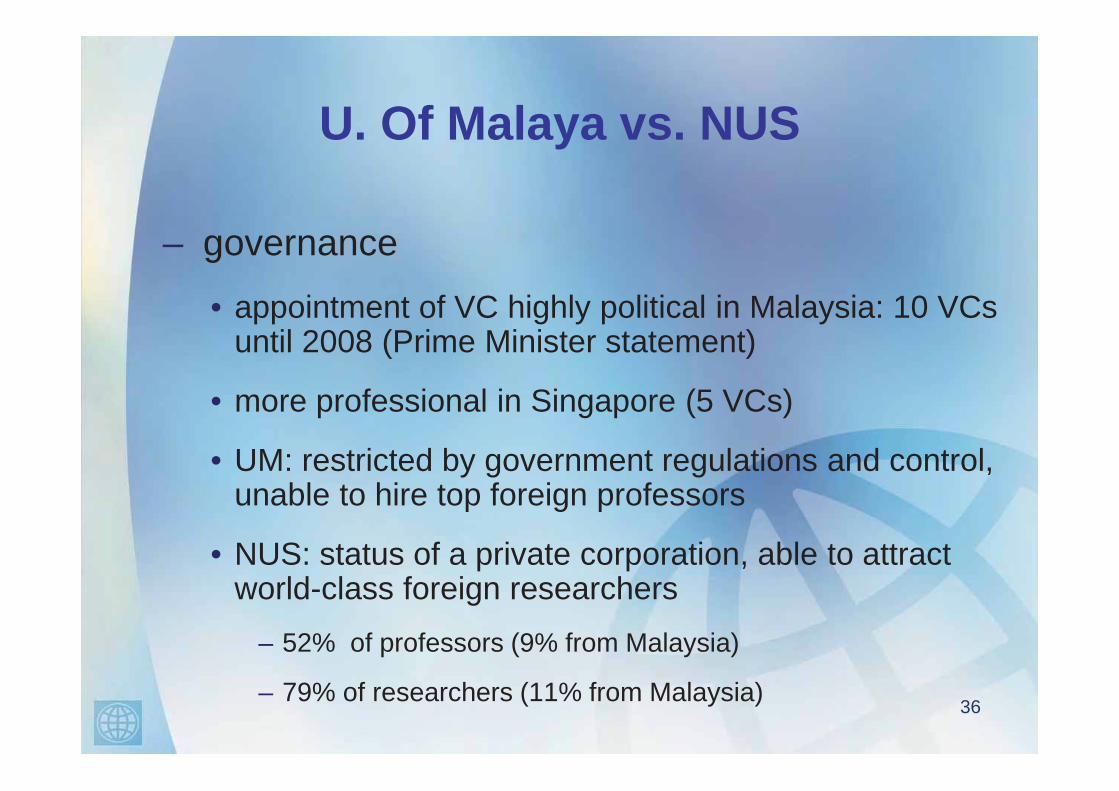
U. Of Malaya vs. NUS
– governance
• appointment of VC highly political in Malaysia: 10 VCs until 2008 (Prime Minister statement)
• more professional in Singapore (5 VCs)
• UM: restricted by government regulations and control, unable to hire top foreign professors
• NUS: status of a private corporation, able to attract world-class foreign researchers
– 52% of professors (9% from Malaysia)
– 79% of researchers (11% from Malaysia) 36
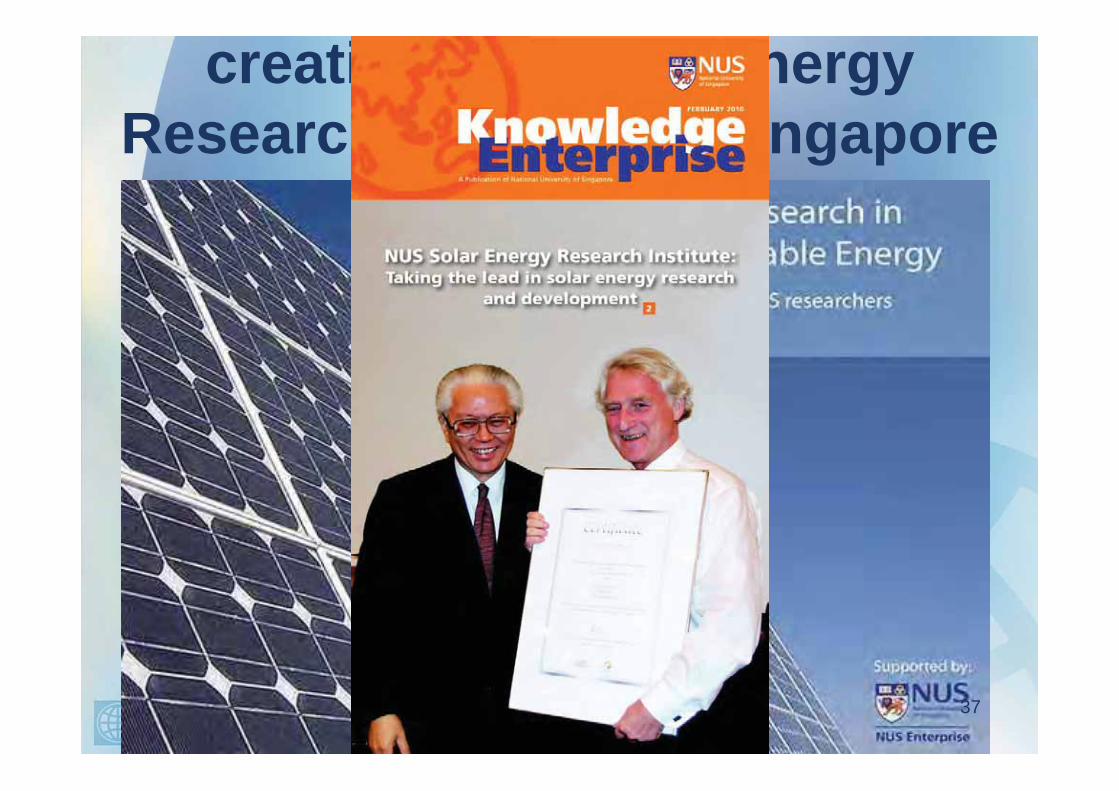
creating the Solar Energy Research Institute in Singapore
37
outline of the presentation
• defining the world-class university
• the road to academic excellence
38
the path to glory
• mergers
• upgrading existing institutions
• creating a new institution
39
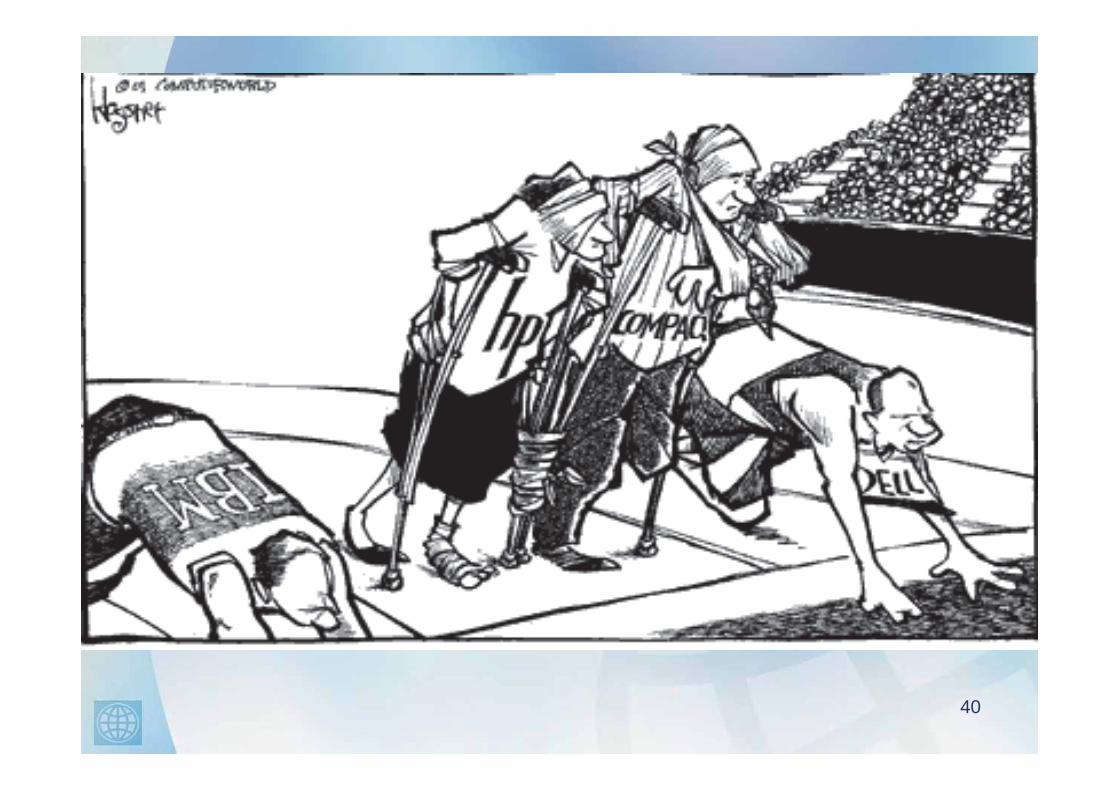
mergers approach
• China, Russia, France, Denmark, Finland
• potential synergies– 1+1=3
• clash of cultures
40

upgrading approach
• less costly
• challenge of creating a culture of excellence
• focus on governance
41

42

44
creating a new institution
45
• KAUST, Nazarbayev University, Skolktech
• higher costs
• getting the right culture from the beginning
• creating a deep tradition of research
• academic freedom
which approach works best?
• upgrading and merging complicated
• establishing a new university from scratch potentially easier
46
who takes the initiative?
role of the State
• favorable regulatory framework
• funding• Excellence Initiatives
47
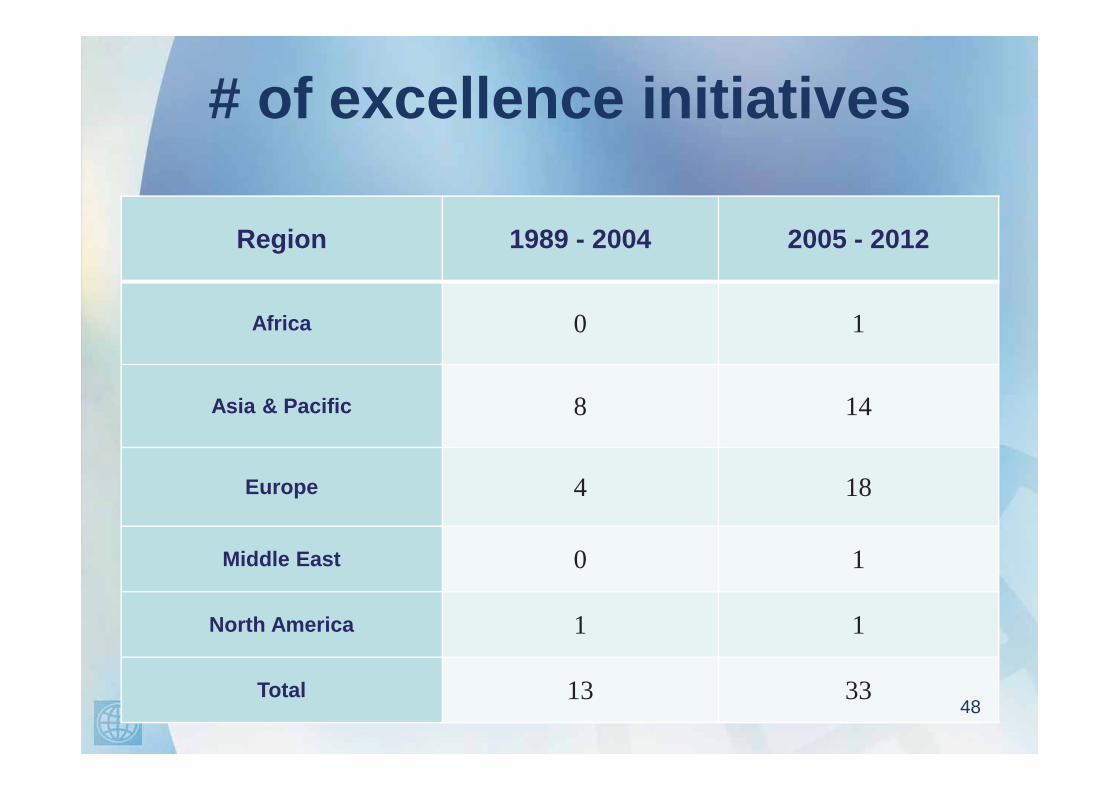
# of excellence initiatives
Region 1989 - 2004 2005 - 2012
Africa 0 1
Asia & Pacific 8 14
Europe 4 18
Middle East 0 1
North America 1 1
Total 13 3348
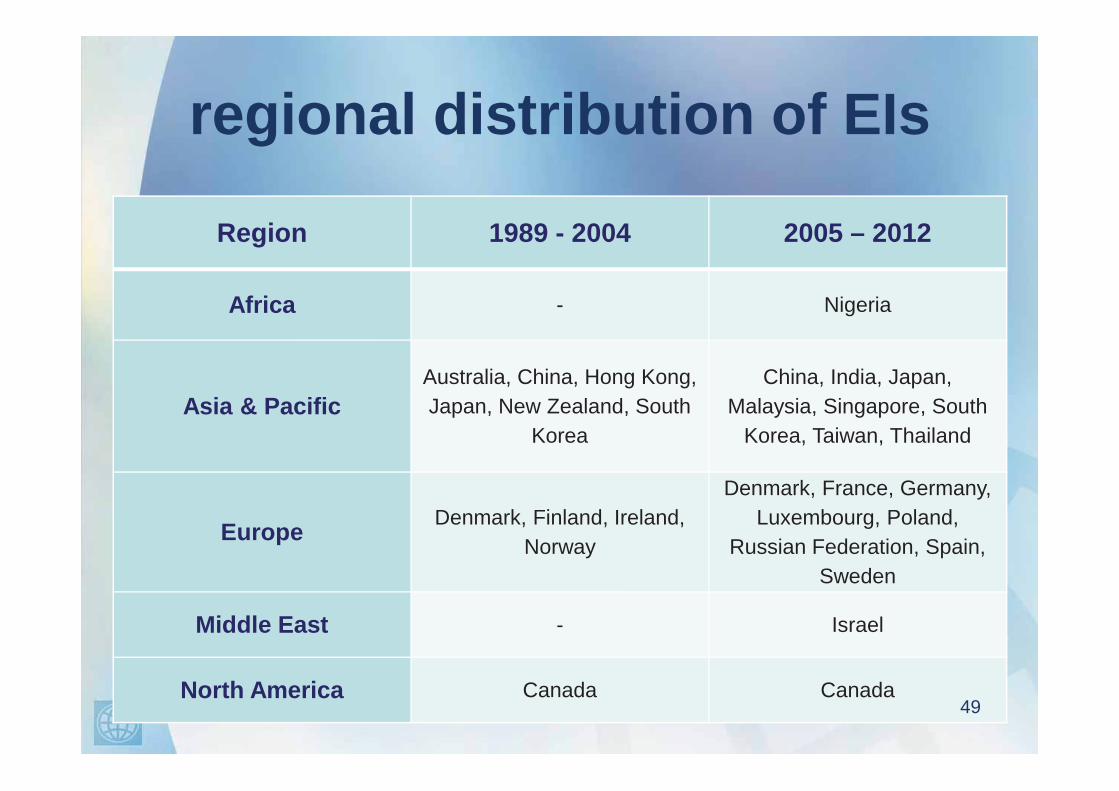
regional distribution of EIs
Region 1989 - 2004 2005 – 2012
Africa - Nigeria
Asia & PacificAustralia, China, Hong Kong, Japan, New Zealand, South
Korea
China, India, Japan, Malaysia, Singapore, South
Korea, Taiwan, Thailand
Europe Denmark, Finland, Ireland, Norway
Denmark, France, Germany, Luxembourg, Poland,
Russian Federation, Spain, Sweden
Middle East - Israel
North America Canada Canada49
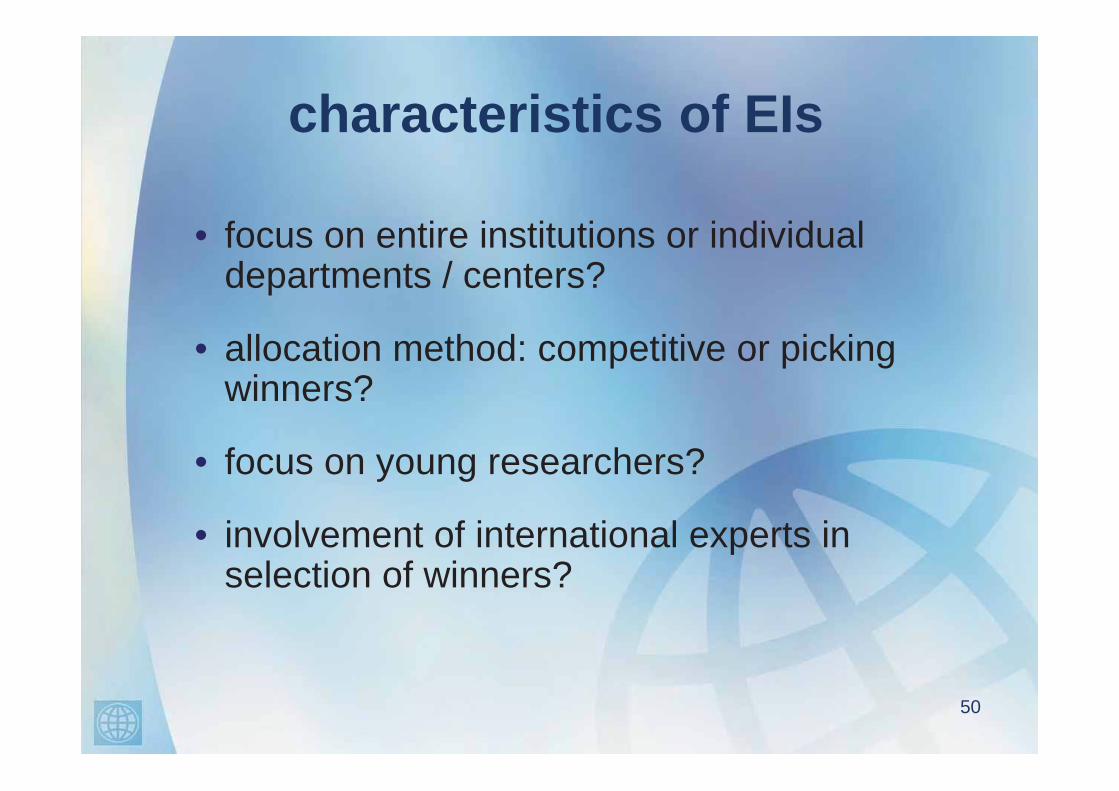
characteristics of EIs
• focus on entire institutions or individual departments / centers?
• allocation method: competitive or picking winners?
• focus on young researchers?
• involvement of international experts in selection of winners?
50
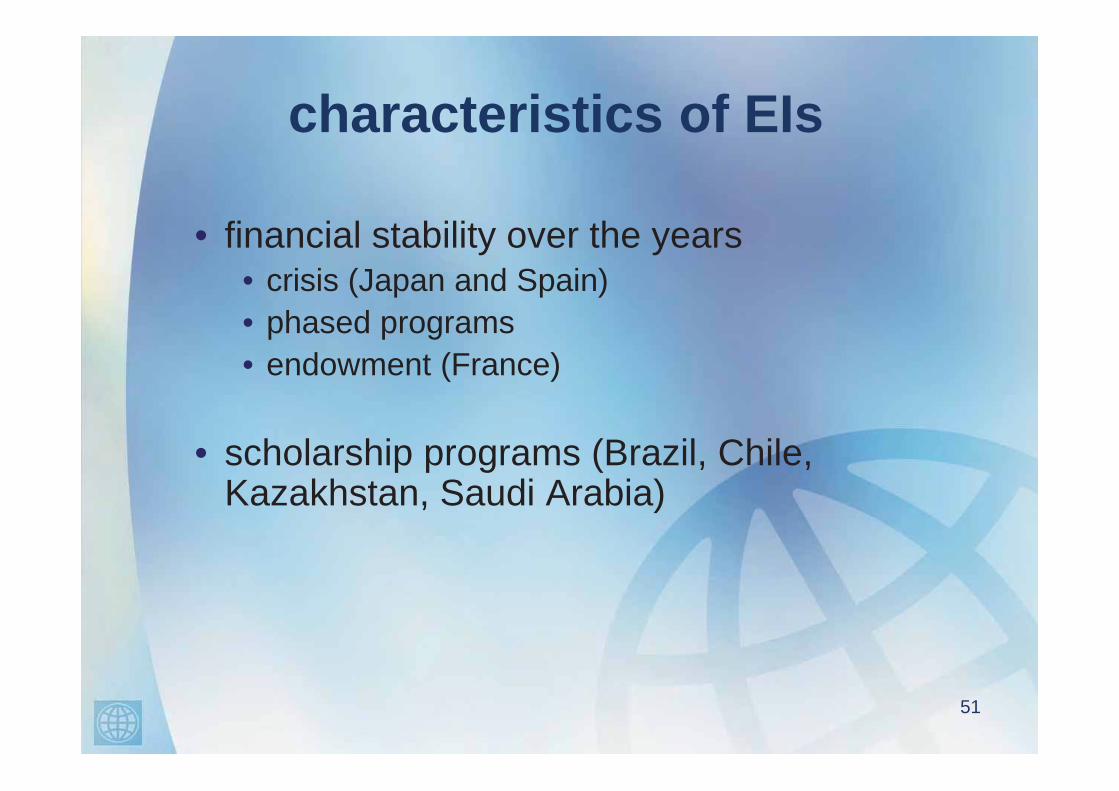
characteristics of EIs
• financial stability over the years• crisis (Japan and Spain)• phased programs• endowment (France)
• scholarship programs (Brazil, Chile, Kazakhstan, Saudi Arabia)
51
who takes the initiative?(II)
• role of the institutions
• leadership• strategic vision• culture of excellence
52
53

54
55
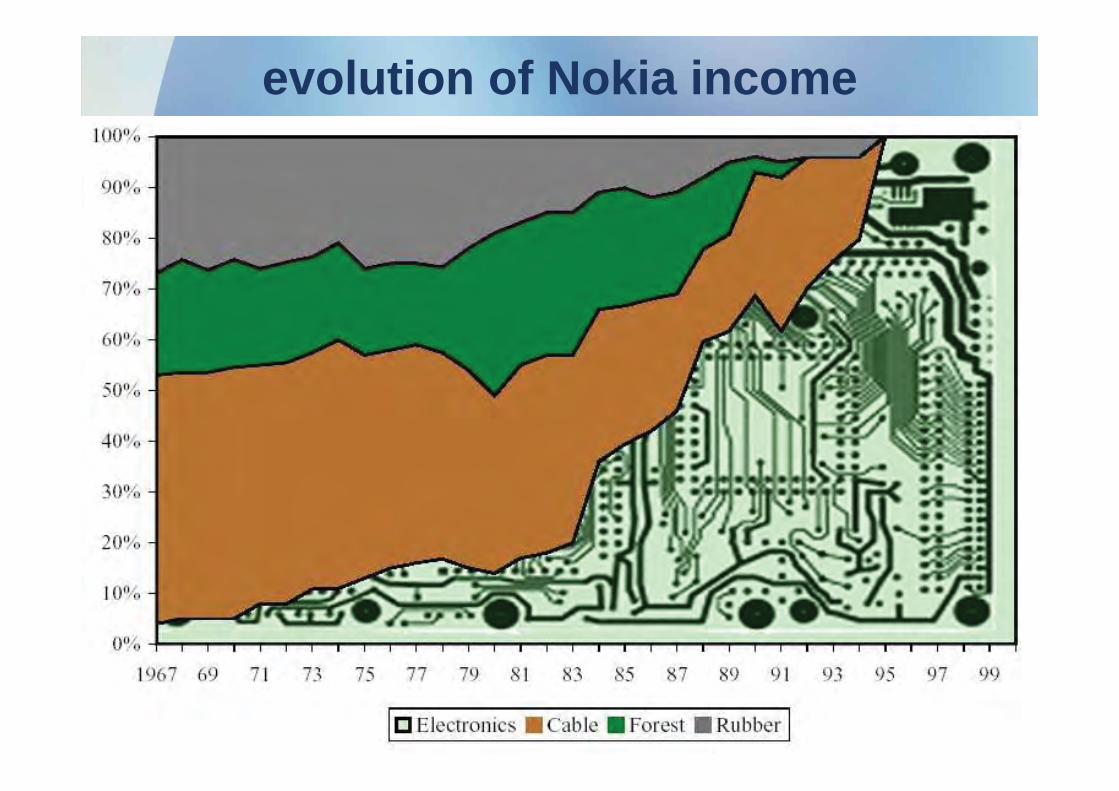
evolution of Nokia income
outline of the presentation
• defining the world-class university
• the road to academic excellence
• lessons of experience
56
vintage bias
57

58
accelerating factors
• internationalization
59
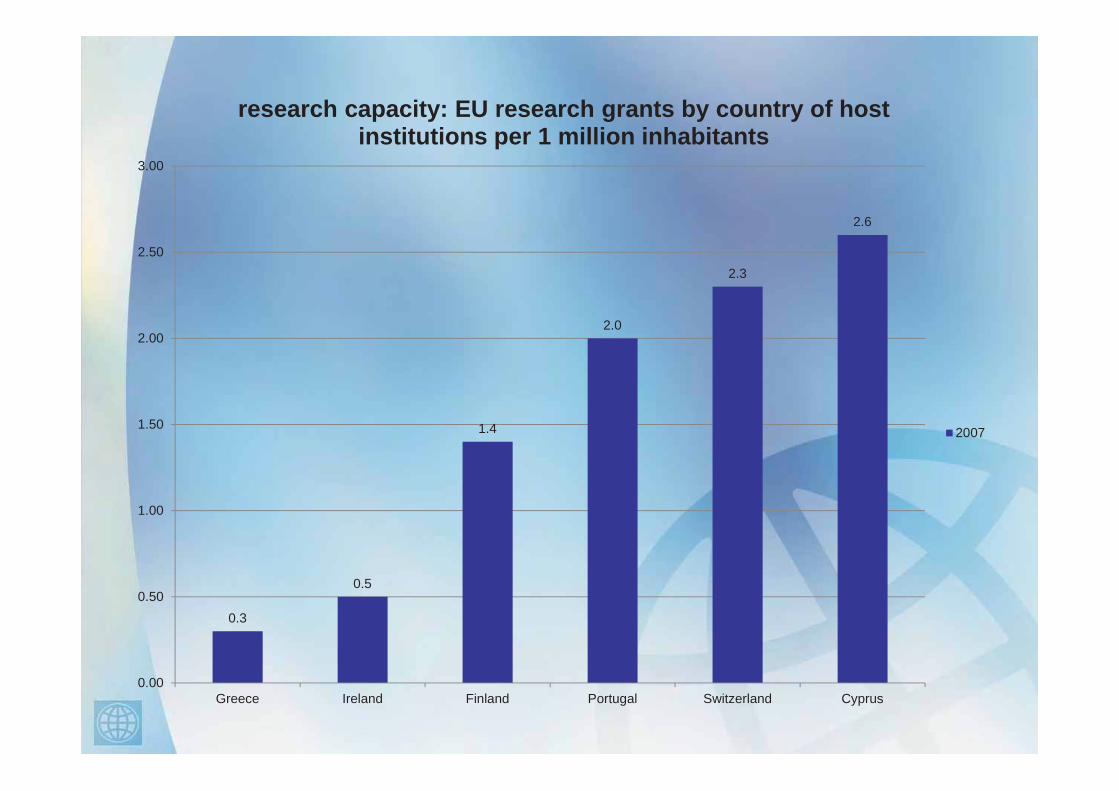
0.3
0.5
1.4
2.0
2.3
2.6
0.00
0.50
1.00
1.50
2.00
2.50
3.00
Greece Ireland Finland Portugal Switzerland Cyprus
research capacity: EU research grants by country of host institutions per 1 million inhabitants
2007
international dimensions
• reliance on Diaspora (Pohang, HK, SJTU, Cyprus)
61
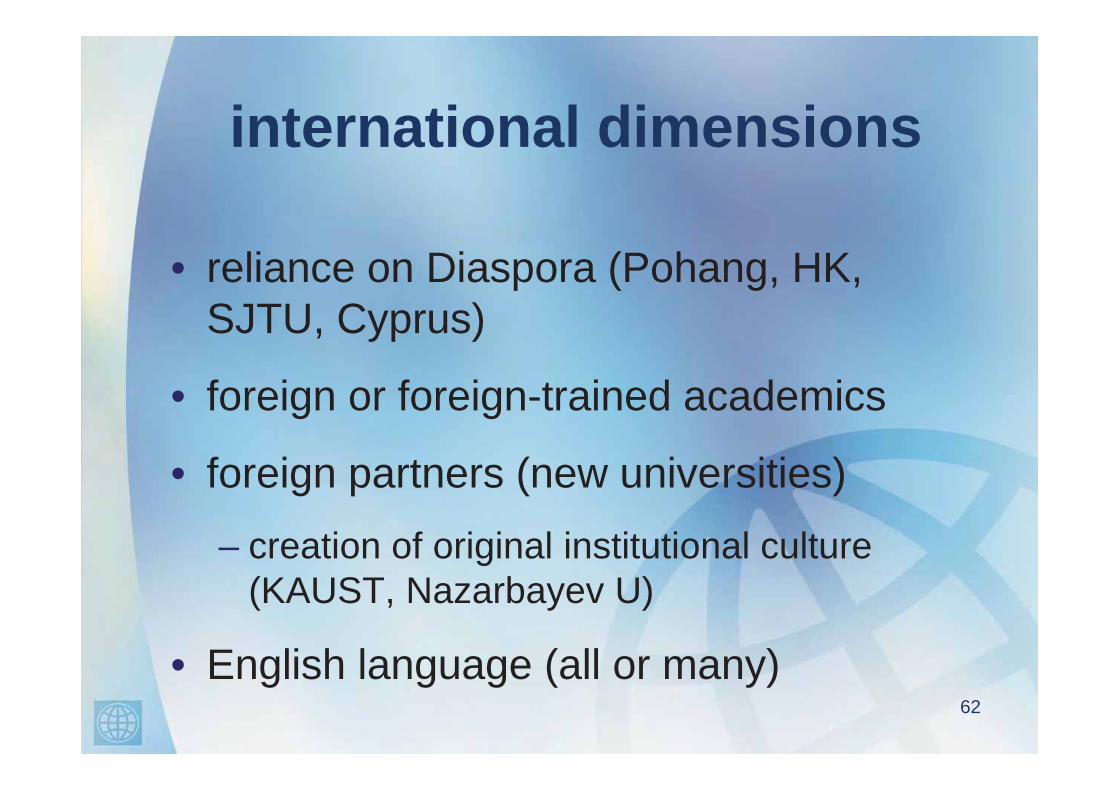
international dimensions
• reliance on Diaspora (Pohang, HK, SJTU, Cyprus)
• foreign or foreign-trained academics
• foreign partners (new universities)– creation of original institutional culture
(KAUST, Nazarbayev U)
• English language (all or many) 62


![[01]UNCOPUOS SentinelAsia Final · Sep. 1993 Tokyo, Japan Tokyo, Japan Tokyo, Japan Tokyo, Japan Ulanbator, Mongolia Tsukuba, Japan Tokyo, Japan Kuala Lumpur, Malaysia Daejeon, Korea](https://img.pdfslide.net/doc/110x75/600d276b3d3e78250500e5e2/01uncopuos-sentinelasia-final-sep-1993-tokyo-japan-tokyo-japan-tokyo-japan.jpg)