Embed Size (px)
Citation preview

Keysight TechnologiesTechniques for Precise Interference Measurements in the Field Using FieldFox Handheld Analyzers
This application note discusses the different kinds of interference that operators will encounter in both current and new wireless environments. It introduces efficient and effective measurement techniques and instrument requirements for testing interference using modern high- performance spectrum analyzers such as Keysight Technologies, Inc. FieldFox analyzers, which have the versatility and durability to make accurate measurements quickly in the field in harsh conditions and hard- to-reach locations. The classifications for different types of interference including in-band, co-channel, out-of-band and adjacent channel interference will also be discussed. Carry precision with you.
Application Note
Introduction
Operators of microwave systems frequently encounter interference from cellular systems and data links. Due to the scarcity of radio frequency spectrum, demands are often placed on wireless communication systems to operate under a limited amount of radio interference. Many existing wireless systems control and operate portions of the frequency spectrum through licensing with regulatory agencies. Licensed operation grants the service provider the right to determine the technology employed for the service offered and is also protected against harmful interference from other wireless services and service providers. Licensed wireless systems operate over a wide range of RF and microwave carrier frequencies. Licensed systems include LTE cellular, which operates with carrier frequencies typically below 2 GHz, direct broadcast satellite operating at 12 GHz for the down-link and 17 GHz for the uplink, and point-to-point backhaul systems operating in the 23 GHz band. When attempting to squeeze a large number of users on to a limited band of licensed spectrum, co-channel and adjacent channel interference are often created within the system. Unlicensed operation, on the other hand, is treated as part of an open access resource and when the demand for spectrum increases, the system interference increases and reduces the quality of service for all users. Examples of unlicensed systems include the popular Wi-Fi, Bluetooth® and ZigBee systems operating in the 2.4 GHz band. Many frequency bands are allocated for both licensed and unlicensed operation. For example, in the U.S., the 3.1 to 3.3 GHz band includes numerous radar platforms, including airborne systems such as AWACS and synthetic aperture radar (SAR), and shipboard systems such as Aegis. Also within the 200 MHz band, unlicensed operation is allowed over the 3.26 to 3.267 GHz segment. In addition, given the growing demand for spectrum in public sector, commercial and non-commercial applications, it is expected that wireless interference will be an expanding problem as new wireless systems are introduced. For example, next generation cellular systems deploying “femtocells” operating in an overlay network may potentially create interference to the macro-cell downlink 1.
Another example includes systems utilizing Dynamic Spectrum Access (DSA), where these opportunistic wireless systems, operating as a secondary user, would temporarily use idle spectrum until the primary operator begins to transmit. The secondary DSA user would appear as interference to the primary until the secondary relocates to another portion of available spectrum. These DSA technologies are sometimes referred to as Cognitive Radio (CR) 2 and White Space 3.
Increased spectrum utilization requires advanced measurement toolsTo increase spectrum utilization, some countries are attempting to reassign spectrum based on consumer demand. In a recent decision 4 by the U.S. government, frequency spectrum will be repurposed in order to open up 500 MHz of new spectrum for mobile and fixed broadband applications. This frequency relocation of existing systems, beginning with the 1755 to 1850 MHz band 5, will likely occur over a multi-year transition period and therefore could create interference between the current and new systems until the relocation is complete. While all of these current and new systems attempt to use and improve spectrum utilization, there is an ever expanding need for advanced measurement tools to evaluate, monitor, and manage the interference levels between various wireless systems. These measurements often require field testing in the vicinity of a system’s receiver(s) with test instrumentation that is rugged, lightweight, and having performance consistent with traditional bench-top instrumentation.
This application note discusses the different kinds of interference that operators will encounter in both current and new systems, and will introduce efficient methods to measure a variety of interference types using modern high-performance spectrum analyzers such as the Keysight FieldFox N993xA microwave spectrum analyzers and N991xA microwave combination analyzers (cable and antenna analyzer, spectrum analyzer, plus vector network analyzer).

03 | Keysight | Techniques for Precise Interference Measurements in the Field Using FieldFox Handheld Analyzers - Application Note
Interference and spectrum access
In any wireless system, interference is found in the wireless channel which may degrade the reception of desired sig-nals. When the received power levels of an interfering signal are large relative to the desired signal, a wireless system will experience degradation or possibly an interruption of service. When multi-ple wireless systems attempt to coexist across the radio spectrum, it is possible that an “interference event” may occur. The IEEE 6 defines an interference event as “a circumstance in which a quantified threshold level of interference has been exceeded,” and the threshold level can be set as a function of amplitude, frequency, time, and/or system performance. When investigating the types and origins of electromagnetic interference in a dynamic wireless environment, high-performance spectrum analyzers, such as FieldFox, are necessary tools when measuring the pow-er levels of interfering signals as a function of time, frequency and location.
As interference testing often requires measurement and data collection in the environment surrounding a wireless system, a lightweight, battery-operated spectrum analyzer provides a convenient method for field testing in these often rugged environ-ments. Figure 1a shows a field technician operating a handheld spectrum analyzer near a noisy CATV amplifier. In this exam-ple, the spectrum analyzer was connected
Figure 1a. FieldFox connected to a directional antenna for locating a source of radio interference
Figure 1b. FieldFox directly connected to a feeder line on a wireless communication system
to a directional antenna through a short length of coaxial cable. The analyzer’s displayed measurements can be adjust-ed for cable loss and antenna gain. This technique is useful for identifying the location of the offending transmitter as the directional antenna provides amplitude changes as the antenna is pointed around the environment. Figure 1b shows FieldFox connected to the feeder line of a cell site to ensure its return loss is within specifi-cation, as poor cable and antenna perfor-mance can result in network interference. Interference in wireless systems can origi-nate from a variety of intentional, uninten-tional and incidental radiators. An inten-tional radiator is defined as equipment having an active transmitter capable of producing an electromagnetic signal at a specified RF/microwave carrier frequency and specified output power level. Inten-tional radiators include mobile phones, radars and WLAN devices. An unintention-al radiator may use RF/microwave signals, such as a radio receiver, but inadvertently radiate a signal, although it is not intended to be a transmitter. Incidental radiators do not use RF/microwave signals but may radiate or modulate RF/microwave signals as a byproduct of its operation such as motors 7 and fluorescent lightning8. While the techniques and measurement applications can be used for any type of radiator, this application note will focus on
the measurement of intentional radiators, licensed or unlicensed, that coexists in the frequency spectrum and may interfere with the operation of the intended wireless systems.
Licensed wireless systems are designed to minimize interference by separating multiple users in the time, frequency and/or spatial domains. Unlicensed systems are designed knowing that interference will exist and attempt to politely share the spectrum with all users by also utilizing the time, frequency and/or spatial domain whenever possible. In unlicensed bands, coordination between multiple radios is often not allowed and radios are often required to measure channel energy before transmitting in a “listen before talk” protocol, as found in IEEE 802.11-based systems.

04 | Keysight | Techniques for Precise Interference Measurements in the Field Using FieldFox Handheld Analyzers - Application Note
Figure 2. Over-the-air measurement of the UHF spectrum using FieldFox, showing a portion of the licensed cellular and unlicensed Industrial, Scientific and Medical (ISM) bands
Interference and spectrum access (continued)
Figure 2 shows an “over-the-air” measure-ment example taken from FieldFox with an externally attached omnidirectional antenna. The figure shows the measured spectrum over a part of the UHF frequency range supporting both licensed and unli-censed signals. The lower band covers the downlink portion of a cellular system oper-ating in the U.S. The upper band shows the unlicensed spectrum containing trans-missions from radio telecommunication devices operating under FCC Part 15 and other non-telecommunication devices with Industrial, Scientific and Medical (ISM) ap-plications. For this measurement, FieldFox was configured with an internal preampli-fier to improve the measurement sensitiv-ity, and a 0-dB internal input attenuator to further improve the noise floor of the analyzer. Markers and associated mark-er tables are used to show the start and stop frequencies of each assigned band. The measurement shown in this figure was captured and stored as an image file using FieldFox. Measurement sweeps can also be recorded to the analyzer’s internal memory, mini-SD or USB drive. Recording measurements is very useful for capturing intermittent signals and later performing additional analysis including channel pow-er, occupied bandwidth, adjacent channel power and other interference analysis.
Figure 2 also shows that having a distinct separation between these two frequency ranges would ideally prevent the different types of systems from interfering with each other. With the spectrum being such a valuable resource, the frequency range between the displayed downlink and ISM bands, labeled as “other” in the figure, has been assigned to other types of wireless systems including commercial aviation and land mobile radio systems. As observed in the figure, it is difficult to measure any signal energy from these “other” systems at this particular measurement location and instrument settings.
Interference testing is particularly im-portant near airports, marine harbors and locations where interference could disrupt wireless and satellite reception. Spectrum users near international borders must also take special care as radio transmission can interfere across borders and regulations can be different in each territory. Organi-zations such as the International Telecom-munication Union (ITU) develop wireless standards “to ensure seamless global communications and interoperability for next generation networks” but it can be difficult to find common frequency bands across international borders.
Occasionally, an operator of a radio trans-mitter may maliciously transmit signals in order to disrupt communications or knowingly broadcast signals without an appropriate license. Government agencies penalize rogue operators and sometimes seize radio equipment that is in violation of the spectrum allocations. Many govern-ment agencies prohibit the intentional or malicious operation of “jammers” that interfere with wireless communication services 9. Regulatory agencies will record complaints and use radio direction finding equipment to locate the source of the interference where fines and equipment seizure may be imposed on the operator.
In order to expedite the identification and location of an offending transmitter, equipment operators often use their own equipment, including a spectrum ana-lyzer such as FieldFox, to quickly locate the disruptive transmissions and expedite the process of removing the offending interference through the proper regulatory channels.
As part of evaluating system performance and ensuring regulatory compliance, commercial and non-commercial agen-cies working in industries such as cellular, broadcast radio and television, radar, and satellite, are often required to continually monitor the frequency spectrum for known and unknown signals. As wireless systems often share or reuse frequency spectrum, interference from other users can quickly become an issue when a system transmit-ter is improperly radiating energy into the assigned or other frequency bands. Under all of these conditions where frequency spectrum is continuously being “squeezed” for the highest capacity and performance, identification and reduction of interference is essential to the proper operation for all wireless systems.

05 | Keysight | Techniques for Precise Interference Measurements in the Field Using FieldFox Handheld Analyzers - Application Note
Figure 3. Diagram of several signals in a wireless environment resulting in different levels of interference occurring in Channel 1
Interference classifications
Figure 4. Measured spectrum of a 24 GHz microwave communications signal with lower-than- expected system performance and including potential in-band interference
When a wireless system is reporting adequate received signal strength for the desired signal but is experiencing performance issues, it is quite possible that some form of radio interference is affecting the receiver’s operation. A spectrum analyzer is an extremely useful tool for examining the amplitude levels of any signal in the frequency range around the desired channel to verify whether the reduced performance is the result of interference within the operating channel or in the adjacent channels. Interference found in wireless systems can be catego-rized in a number of ways. Interference can affect only a small number of users or can be transmitted in such a way that all communications within the entire wireless system is disrupted. The following is a list of common classifications that are used by the wireless industry.
– In-band interference – Co-channel interference – Out-of-band interference – Adjacent channel interference – Downlink interference – Uplink interference
Figure 3 shows a diagram of an idealized frequency spectrum having several signals operating across a wide frequency range. Using Channel 1 as the frequency range for the desired signal, other signals intro-duced across the frequency domain could degrade the performance of this system. As shown in Figure 3, in-band, out-of-band (including its associated harmonic) and adjacent channel interference (repre-sented by the overlap between Channel 1 and Channel 2) may all interfere with the Channel 1 system performance.
In-band interferenceIn-band interference is an undesired transmission from a different communica-tion system or unintentional radiator that falls inside the operating bandwidth of the desired system. This type of interference will pass through the receiver’s channel fil-ter and if the amplitude of the interference is large relative to the desired signal, the desired signal will be corrupted. If the in-
band interference has an amplitude level near or below the signal of interest, it may be difficult to measure the interference making it necessary to temporarily turn off the transmitter of the desired signal in order to measure the characteristics of the interference. If the target transmitter cannot be turned off, then physically mov-ing the spectrum analyzer, with attached antenna, around the environment may result in a signal condition where, relative to the desired signal, the amplitude of the interference is large enough to be ob-served and measured on the analyzer.
Figure 4 shows a measurement exam-ple taken from a point-to-point micro-wave communications system operating at 24.125 GHz with potential in-band interference. The system was reporting a lower-than-expected performance and
FieldFox was used to measure the channel conditions at the receiver. As shown in the figure, there appears to be a signal with slightly different amplitude located near the center of the band. Troubleshooting this system may require that the main system be turned off in order to observe and identify the interference. Another approach is to adjust the pointing direction of a high-gain antenna in order to improve the amplitude level of the measured in-terference for observation. The high-gain antenna may also be useful when estimat-ing the physical location of the source of the interference by pointing the antenna around the surrounding environment until an amplitude peak is observed on the handheld spectrum analyzer.
06 | Keysight | Techniques for Precise Interference Measurements in the Field Using FieldFox Handheld Analyzers - Application Note
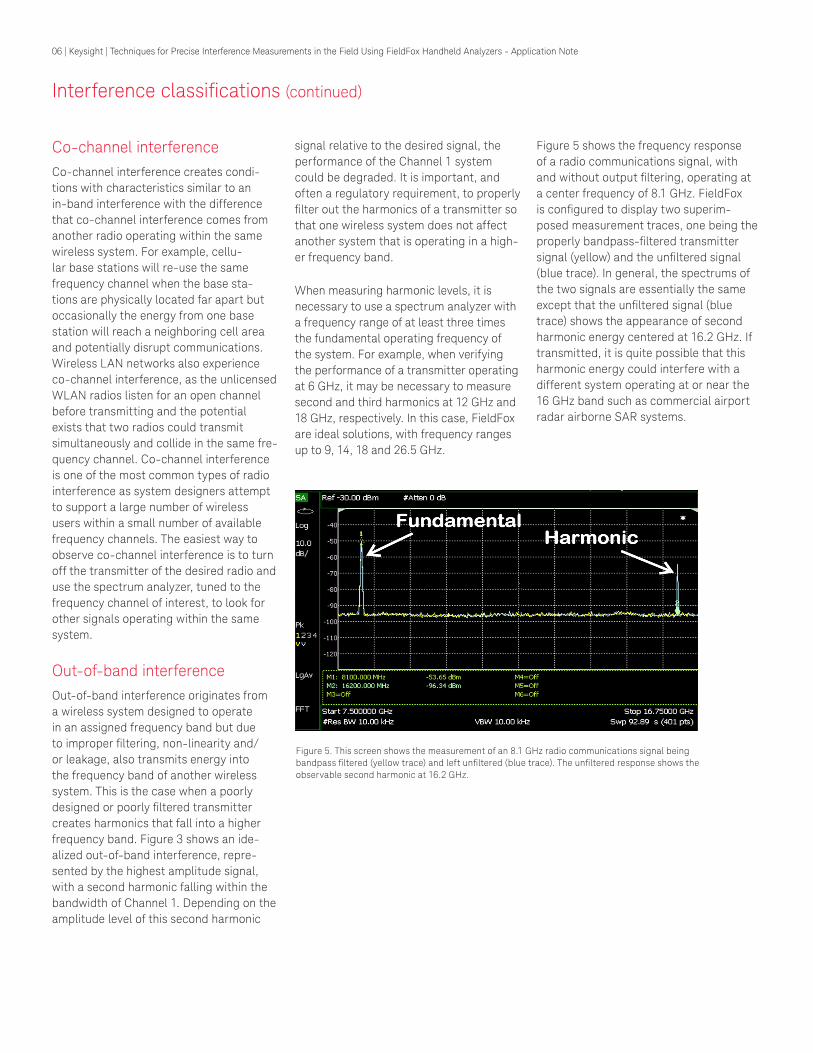
Figure 5. This screen shows the measurement of an 8.1 GHz radio communications signal being bandpass filtered (yellow trace) and left unfiltered (blue trace). The unfiltered response shows the observable second harmonic at 16.2 GHz.
Interference classifications (continued)
Co-channel interferenceCo-channel interference creates condi-tions with characteristics similar to an in-band interference with the difference that co-channel interference comes from another radio operating within the same wireless system. For example, cellu-lar base stations will re-use the same frequency channel when the base sta-tions are physically located far apart but occasionally the energy from one base station will reach a neighboring cell area and potentially disrupt communications. Wireless LAN networks also experience co-channel interference, as the unlicensed WLAN radios listen for an open channel before transmitting and the potential exists that two radios could transmit simultaneously and collide in the same fre-quency channel. Co-channel interference is one of the most common types of radio interference as system designers attempt to support a large number of wireless users within a small number of available frequency channels. The easiest way to observe co-channel interference is to turn off the transmitter of the desired radio and use the spectrum analyzer, tuned to the frequency channel of interest, to look for other signals operating within the same system.
Out-of-band interferenceOut-of-band interference originates from a wireless system designed to operate in an assigned frequency band but due to improper filtering, non-linearity and/or leakage, also transmits energy into the frequency band of another wireless system. This is the case when a poorly designed or poorly filtered transmitter creates harmonics that fall into a higher frequency band. Figure 3 shows an ide-alized out-of-band interference, repre-sented by the highest amplitude signal, with a second harmonic falling within the bandwidth of Channel 1. Depending on the amplitude level of this second harmonic
signal relative to the desired signal, the performance of the Channel 1 system could be degraded. It is important, and often a regulatory requirement, to properly filter out the harmonics of a transmitter so that one wireless system does not affect another system that is operating in a high-er frequency band. When measuring harmonic levels, it is necessary to use a spectrum analyzer with a frequency range of at least three times the fundamental operating frequency of the system. For example, when verifying the performance of a transmitter operating at 6 GHz, it may be necessary to measure second and third harmonics at 12 GHz and 18 GHz, respectively. In this case, FieldFox are ideal solutions, with frequency ranges up to 9, 14, 18 and 26.5 GHz.
Figure 5 shows the frequency response of a radio communications signal, with and without output filtering, operating at a center frequency of 8.1 GHz. FieldFox is configured to display two superim-posed measurement traces, one being the properly bandpass-filtered transmitter signal (yellow) and the unfiltered signal (blue trace). In general, the spectrums of the two signals are essentially the same except that the unfiltered signal (blue trace) shows the appearance of second harmonic energy centered at 16.2 GHz. If transmitted, it is quite possible that this harmonic energy could interfere with a different system operating at or near the 16 GHz band such as commercial airport radar airborne SAR systems.
07 | Keysight | Techniques for Precise Interference Measurements in the Field Using FieldFox Handheld Analyzers - Application Note
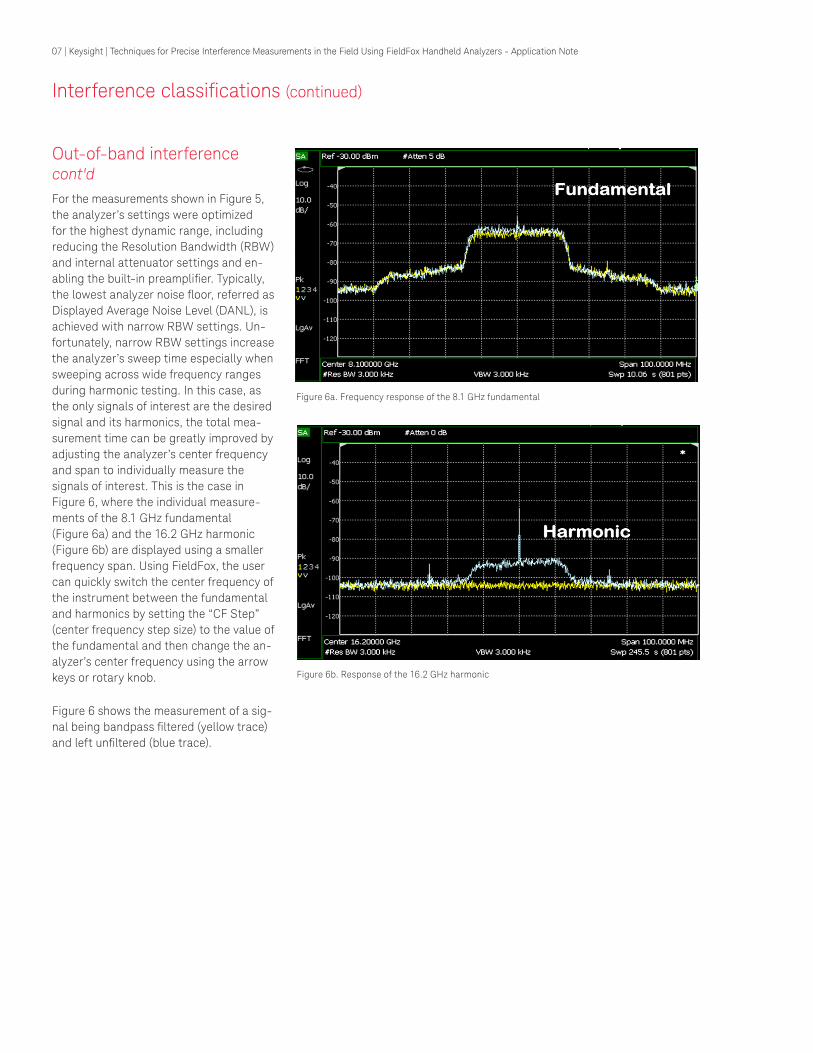
Figure 6a. Frequency response of the 8.1 GHz fundamental
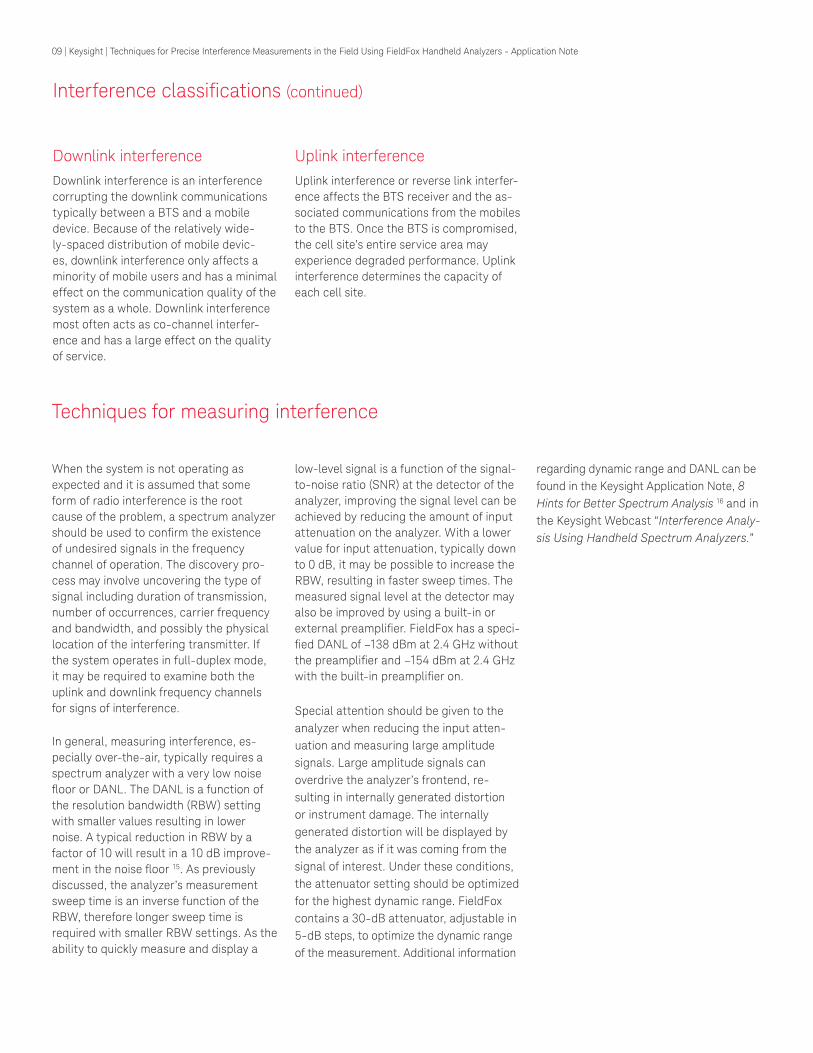
Out-of-band interference cont'dFor the measurements shown in Figure 5, the analyzer’s settings were optimized for the highest dynamic range, including reducing the Resolution Bandwidth (RBW) and internal attenuator settings and en-abling the built-in preamplifier. Typically, the lowest analyzer noise floor, referred as Displayed Average Noise Level (DANL), is achieved with narrow RBW settings. Un-fortunately, narrow RBW settings increase the analyzer’s sweep time especially when sweeping across wide frequency ranges during harmonic testing. In this case, as the only signals of interest are the desired signal and its harmonics, the total mea-surement time can be greatly improved by adjusting the analyzer’s center frequency and span to individually measure the signals of interest. This is the case in Figure 6, where the individual measure-ments of the 8.1 GHz fundamental (Figure 6a) and the 16.2 GHz harmonic (Figure 6b) are displayed using a smaller frequency span. Using FieldFox, the user can quickly switch the center frequency of the instrument between the fundamental and harmonics by setting the “CF Step” (center frequency step size) to the value of the fundamental and then change the an-alyzer’s center frequency using the arrow keys or rotary knob.
Figure 6 shows the measurement of a sig-nal being bandpass filtered (yellow trace) and left unfiltered (blue trace).
Interference classifications (continued)
Figure 6b. Response of the 16.2 GHz harmonic

08 | Keysight | Techniques for Precise Interference Measurements in the Field Using FieldFox Handheld Analyzers - Application Note
Interference classifications (continued)
Figure 7a. Channel power measurement
Figure 7b. Adjacent channel power
Adjacent channel interferenceAdjacent channel interference is the result of a transmission at the desired frequency channel producing unwanted energy in other nearby channels usually within the same system. This type of interference is common and primarily created by energy splatter out of the assigned frequency channel and into the surrounding upper and lower channels. This energy splatter is generated by modulation, switching transients and intermodulation distortion. Intermodulation distortion, or spectral re-growth, is often created in the power amplifier of the radio transmitter due to nonlinear effects in the power electronics. Additional details concerning the testing for intermodulation distortion are included in the Keysight Product Note “Optimizing Dynamic Range for Distortion Measure-ments” 10.
Examples of two channel-related mea-surements are shown in Figure 7. These measurements are recorded from a modulated 17.725 GHz signal similar to the Cable Television Relay Services (CARS) that is licensed to operate in the 17.7 to 19.7 GHz band. The CARS channel spacing in this band is specified at 10 MHz. The recorded measurements were then played back and used to determine the channel power and adjacent channel power. Figure 7a shows the measured channel power at –19.6 dBm over a 10 MHz bandwidth. It is apparent from Figure 7a that this signal also introduces undesired energy into the surrounding channels. Figure 7b shows the adjacent channel power reported as dBc relative to the main signal power. For this example, the two channels above and below the main channel are displayed. The highest level of undesired adjacent channel power is found in the two chan-nels immediately on each side of the main channel with relative levels at approxi-mately –23 dBc. FieldFox also includes an occupied bandwidth measurement as part of the Channel Measurements menu and any of the measurements can be per-formed with live or recorded signals. While adjacent channel interference is
normally associated with active compo-nents in the transmitter, it is also found that passive components, including antennas, cables and connectors, can produce undesired interference in the form of intermodulation interference 11. This type of interference, often referenced as Passive Intermodulation (PIM), is created in passive components that are excited by two or more high power signals. The resulting PIM may produce signals in the receive channel of a communication sys-tem and degrade receiver performance. Intermodulation interference is a concern in modern communication systems using multicarrier modulation including mobile radio, satellites, space probes, and ship-board systems 12, 13. Additional information
concerning the specialized equipment required for PIM testing can be found in the Keysight Application Note Innovative Passive Intermodulation (PIM) and S-pa-rameter Measurement Solution with the ENA 14.
Figure 7 shows the measurement of the channel power characteristics for a modulated 17.725 GHz transmission using FieldFox.
09 | Keysight | Techniques for Precise Interference Measurements in the Field Using FieldFox Handheld Analyzers - Application Note
Interference classifications (continued)
Downlink interferenceDownlink interference is an interference corrupting the downlink communications typically between a BTS and a mobile device. Because of the relatively wide-ly-spaced distribution of mobile devic-es, downlink interference only affects a minority of mobile users and has a minimal effect on the communication quality of the system as a whole. Downlink interference most often acts as co-channel interfer-ence and has a large effect on the quality of service.
Techniques for measuring interference
Uplink interferenceUplink interference or reverse link interfer-ence affects the BTS receiver and the as-sociated communications from the mobiles to the BTS. Once the BTS is compromised, the cell site’s entire service area may experience degraded performance. Uplink interference determines the capacity of each cell site.
When the system is not operating as expected and it is assumed that some form of radio interference is the root cause of the problem, a spectrum analyzer should be used to confirm the existence of undesired signals in the frequency channel of operation. The discovery pro-cess may involve uncovering the type of signal including duration of transmission, number of occurrences, carrier frequency and bandwidth, and possibly the physical location of the interfering transmitter. If the system operates in full-duplex mode, it may be required to examine both the uplink and downlink frequency channels for signs of interference.
In general, measuring interference, es-pecially over-the-air, typically requires a spectrum analyzer with a very low noise floor or DANL. The DANL is a function of the resolution bandwidth (RBW) setting with smaller values resulting in lower noise. A typical reduction in RBW by a factor of 10 will result in a 10 dB improve-ment in the noise floor 15. As previously discussed, the analyzer’s measurement sweep time is an inverse function of the RBW, therefore longer sweep time is required with smaller RBW settings. As the ability to quickly measure and display a
low-level signal is a function of the signal-to-noise ratio (SNR) at the detector of the analyzer, improving the signal level can be achieved by reducing the amount of input attenuation on the analyzer. With a lower value for input attenuation, typically down to 0 dB, it may be possible to increase the RBW, resulting in faster sweep times. The measured signal level at the detector may also be improved by using a built-in or external preamplifier. FieldFox has a speci-fied DANL of –138 dBm at 2.4 GHz without the preamplifier and –154 dBm at 2.4 GHz with the built-in preamplifier on.
Special attention should be given to the analyzer when reducing the input atten-uation and measuring large amplitude signals. Large amplitude signals can overdrive the analyzer’s frontend, re-sulting in internally generated distortion or instrument damage. The internally generated distortion will be displayed by the analyzer as if it was coming from the signal of interest. Under these conditions, the attenuator setting should be optimized for the highest dynamic range. FieldFox contains a 30-dB attenuator, adjustable in 5-dB steps, to optimize the dynamic range of the measurement. Additional information
regarding dynamic range and DANL can be found in the Keysight Application Note, 8 Hints for Better Spectrum Analysis 16 and in the Keysight Webcast “Interference Analy-sis Using Handheld Spectrum Analyzers.”
10 | Keysight | Techniques for Precise Interference Measurements in the Field Using FieldFox Handheld Analyzers - Application Note
Equipment requirements
Measurement accuracy, sweep speed and analyzer portability are extremely import-ant requirements when selecting an an-alyzer as field testing often occurs under extreme conditions ranging from high el-evations, such as outdoor tower and mast installations, to confined spaces, required in shipboard, aircraft and vehicle applica-tions. There are several main features of the measurement equipment that need to be considered when interference testing in the field, including the ruggedness of the spectrum analyzer, long battery life with quick battery replacement, rapid turn-on from a paused state, built-in GPS, DC block and DC voltage source. The DC volt-age source, when used with an external bias tee, is especially useful for powering a Low Noise Block (LNB) downconverter found in satellite applications. Fortunately, the high-performance FieldFox analyzer, covering frequencies up to 26.5 GHz, can support all the requirements for field test-ing in all environmental conditions.
FieldFox not only has the capabilities found in benchtop spectrum analyzers but also includes a unique feature known as InstAlign that provides improved ampli-tude accuracy across the entire RF and microwave frequency range from turn-on and across the temperature range of –10 to +55 °C. The InstAlign feature is based on an internal and very stable CW amplitude reference which is character-ized over the entire frequency range of the instrument. Any discrepancies between the measured amplitude of this reference and its characterized values are applied as corrections during measurements of the test signal. When FieldFox's internal sensors detect that the instrument's tem-perature has changed by approximately 2 °C, an amplitude alignment is executed as a background process, without user intervention. The net result is that the total absolute amplitude accuracy is typically less than ± 0.6 dB up to 26.5 GHz over the temperature range of –10 to +55 °C without the need for warm-up time.
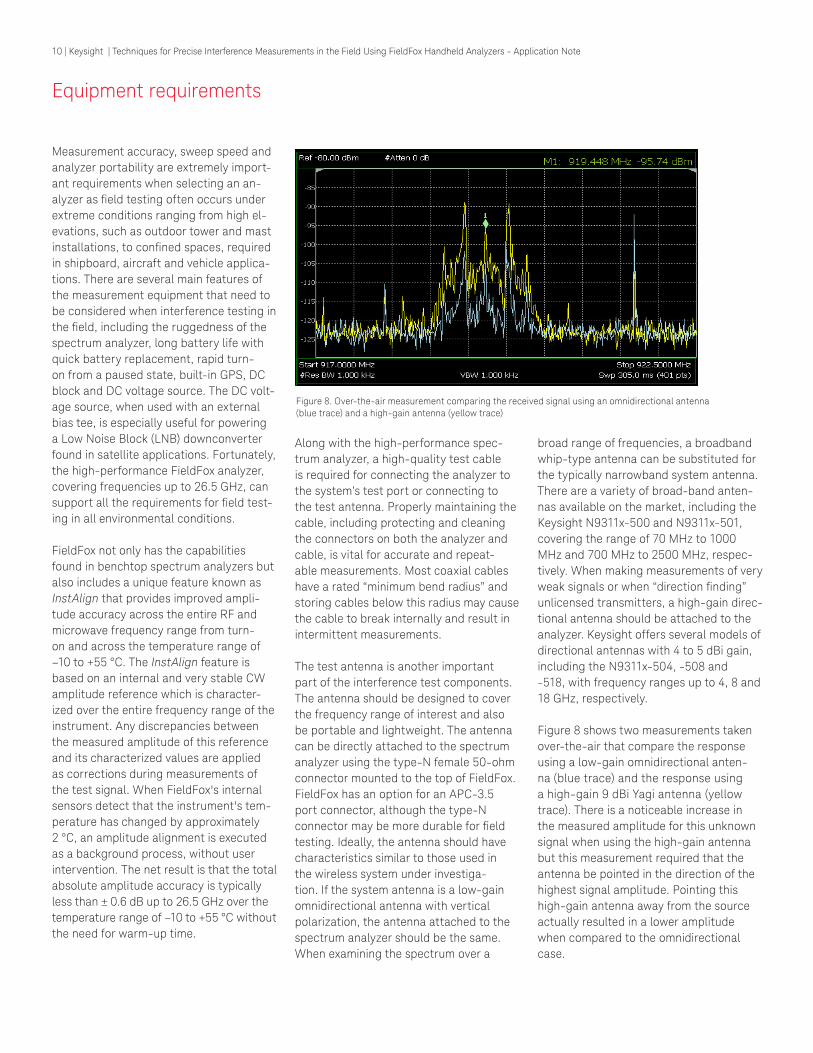
Figure 8. Over-the-air measurement comparing the received signal using an omnidirectional antenna (blue trace) and a high-gain antenna (yellow trace)
Along with the high-performance spec-trum analyzer, a high-quality test cable is required for connecting the analyzer to the system’s test port or connecting to the test antenna. Properly maintaining the cable, including protecting and cleaning the connectors on both the analyzer and cable, is vital for accurate and repeat-able measurements. Most coaxial cables have a rated “minimum bend radius” and storing cables below this radius may cause the cable to break internally and result in intermittent measurements.
The test antenna is another important part of the interference test components. The antenna should be designed to cover the frequency range of interest and also be portable and lightweight. The antenna can be directly attached to the spectrum analyzer using the type-N female 50-ohm connector mounted to the top of FieldFox. FieldFox has an option for an APC-3.5 port connector, although the type-N connector may be more durable for field testing. Ideally, the antenna should have characteristics similar to those used in the wireless system under investiga-tion. If the system antenna is a low-gain omnidirectional antenna with vertical polarization, the antenna attached to the spectrum analyzer should be the same. When examining the spectrum over a
broad range of frequencies, a broadband whip-type antenna can be substituted for the typically narrowband system antenna. There are a variety of broad-band anten-nas available on the market, including the Keysight N9311x-500 and N9311x-501, covering the range of 70 MHz to 1000 MHz and 700 MHz to 2500 MHz, respec-tively. When making measurements of very weak signals or when “direction finding” unlicensed transmitters, a high-gain direc-tional antenna should be attached to the analyzer. Keysight offers several models of directional antennas with 4 to 5 dBi gain, including the N9311x-504, -508 and -518, with frequency ranges up to 4, 8 and 18 GHz, respectively.
Figure 8 shows two measurements taken over-the-air that compare the response using a low-gain omnidirectional anten-na (blue trace) and the response using a high-gain 9 dBi Yagi antenna (yellow trace). There is a noticeable increase in the measured amplitude for this unknown signal when using the high-gain antenna but this measurement required that the antenna be pointed in the direction of the highest signal amplitude. Pointing this high-gain antenna away from the source actually resulted in a lower amplitude when compared to the omnidirectional case.
11 | Keysight | Techniques for Precise Interference Measurements in the Field Using FieldFox Handheld Analyzers - Application Note
Equipment requirements (continued)
Spectrum analyzer modes and displays Intermittent interference is often the most difficult to measure. For cases when the interference is pulsed, intermittent or frequency hopping, the spectrum analyzer display can be configured a number of different ways to aid in the detection and identification of these signal types.
MaxHold modeThe MaxHold display mode can store and display the maximum trace values over multiple sweeps. This “maximum hold” mode is found under the TRACE menu on FieldFox. Figure 9 shows a measure-ment of a frequency hopping carrier with the analyzer configured with two active traces. Trace 1 (yellow) is configured with the MaxHold mode while trace 2 (blue) is the standard sweep “clear/write” (Clr/Wr) mode. After several sweeps, the MaxHold trace is relatively stable while the Clr/Wr trace is very dynamic as the frequency hopping signal is constantly changing in time. During the measurement, it was ob-served that a second carrier, shown on the left, was not frequency hopping as is often required in this ISM band under unlicensed operation. This fixed frequency signal could represent a source of interference to the hopping signal when the two signals eventually collide in the frequency domain. The MaxHold display mode is shown to be very useful when only the maximum ampli-tude of an intermittent signal is required. If the signal variation as a function of time is also required, then a spectrogram or wa-terfall display mode will provide additional insight into the structure of the intermit-tent signal.
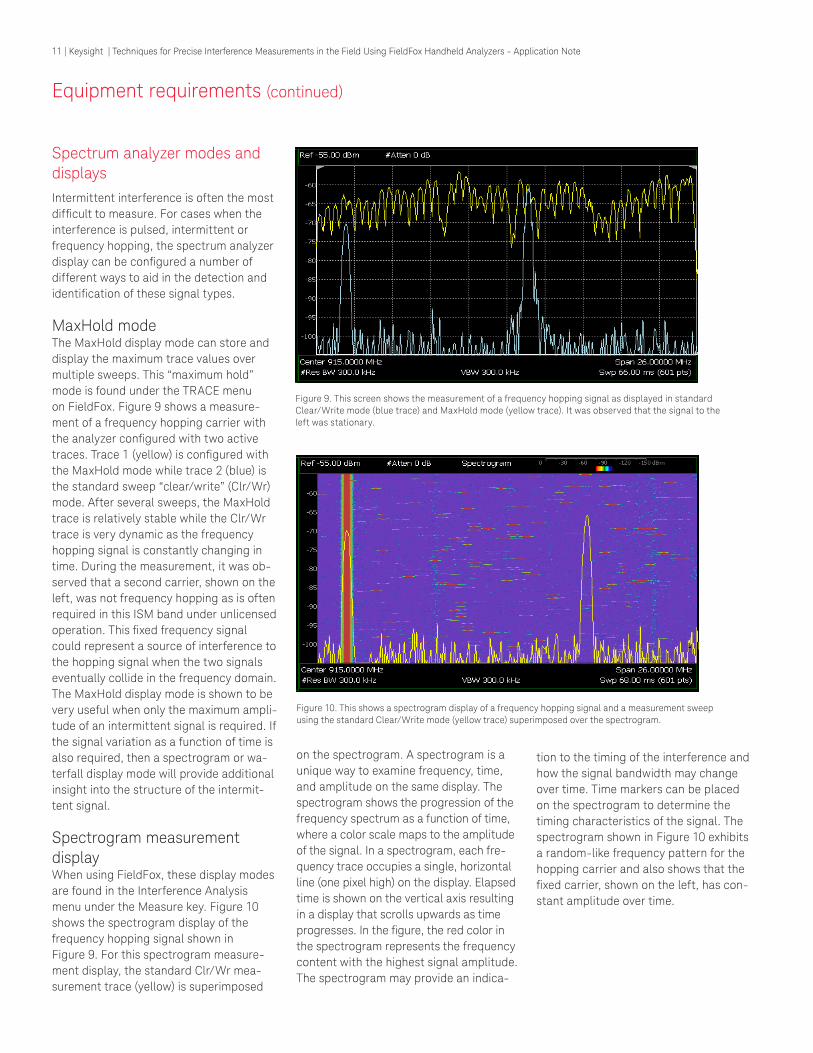
Spectrogram measurement displayWhen using FieldFox, these display modes are found in the Interference Analysis menu under the Measure key. Figure 10 shows the spectrogram display of the frequency hopping signal shown in Figure 9. For this spectrogram measure-ment display, the standard Clr/Wr mea-surement trace (yellow) is superimposed
Figure 9. This screen shows the measurement of a frequency hopping signal as displayed in standard Clear/Write mode (blue trace) and MaxHold mode (yellow trace). It was observed that the signal to the left was stationary.
Figure 10. This shows a spectrogram display of a frequency hopping signal and a measurement sweep using the standard Clear/Write mode (yellow trace) superimposed over the spectrogram.
on the spectrogram. A spectrogram is a unique way to examine frequency, time, and amplitude on the same display. The spectrogram shows the progression of the frequency spectrum as a function of time, where a color scale maps to the amplitude of the signal. In a spectrogram, each fre-quency trace occupies a single, horizontal line (one pixel high) on the display. Elapsed time is shown on the vertical axis resulting in a display that scrolls upwards as time progresses. In the figure, the red color in the spectrogram represents the frequency content with the highest signal amplitude. The spectrogram may provide an indica-
tion to the timing of the interference and how the signal bandwidth may change over time. Time markers can be placed on the spectrogram to determine the timing characteristics of the signal. The spectrogram shown in Figure 10 exhibits a random-like frequency pattern for the hopping carrier and also shows that the fixed carrier, shown on the left, has con-stant amplitude over time.

12 | Keysight | Techniques for Precise Interference Measurements in the Field Using FieldFox Handheld Analyzers - Application Note
Equipment requirements (continued)
Spectrum analyzer modes and displays cont'd.
Zero Span modeAnother useful display mode for intermit-tent signals is the Zero Span mode. In this mode, the center frequency of the spec-trum analyzer is tuned to a fixed frequen-cy and the analyzer sweeps in the time domain, analogous to a frequency-tuned oscilloscope. The RBW filter is adjusted wide enough to capture as much of the signal’s bandwidth as possible without increasing the measurement noise floor to unacceptable levels. An amplitude trigger level can be set to trigger the start of the sweep similar to an oscilloscope. The trig-ger function is found under the Sweep key on FieldFox. Figure 11 shows a Zero Span measurement of the previous frequency hopping signal. The figure shows the am-plitude of the signal as a function of time as the hopping carrier moves to the same frequency as that set on the analyzer. This display provides a timing measurement of the pulse duration while the hopping carrier remains at this one frequency.
Waterfall displaySimilar to the spectrogram, the Waterfall display also provides a visual history of the measured spectrum. The Waterfall display is a 3D color-coded history of the ampli-tude levels as a function of frequency and time. Time progression moves diagonally up and to the right of the display. Figure 12 shows a typical Waterfall display of a time varying signal with the highest ampli-tude levels shown in red and the lowest in blue. The signal shown in the figure was captured to the memory of FieldFox. The analyzer’s trace record and playback capability allow signal monitoring and analysis over long time periods. Traces can be recorded continuously, with a specified number of traces or when triggered by a user-specified power and frequency mask.
Figure 11. Measurement of a hopping carrier using the Zero Span mode on FieldFox
Figure 12. Waterfall display of a time varying signal
Sweep acquisition FieldFox has a function called ‘SwpAcqui-sition’ that is under the SWEEP key. It is designed to capture low duty cycle pulses or intermittent signals. Under this mode, FieldFox will continue to acquire data and process it without display traces, making the gap between each sweep smaller, and increasing the chance to capture pulses and intermittent signals. The number of sweep acquisitions can be set from 1 to 5000, with the larger the number, the lon-ger it will take for the analyzer to produce final trace data. It is similar to a swept tuned spectrum analyzer’s sweep time control. Because FieldFox is not swept,
the SwpAcquistion setting can increase the dwell time at each step, increasing the probability of capturing the interfering signal. Interfering signals that are difficult to detect can also be captured with proper settings of RBW, attenuation and the preamplifier on.
Tune and listen FieldFox 'Tune and Listen' function can help identify an interference signal by demodulating AM, FM narrow and FM wide formats. The demodulated audio can help the user determine signal type and source.

13 | Keysight | Techniques for Precise Interference Measurements in the Field Using FieldFox Handheld Analyzers - Application Note
Conclusion
This application note has introduced measurement techniques and instrument requirements for testing interference in a wireless environment. The classifications for different types of interference includ-ing in-band, co-channel, out-of-band and adjacent channel interference were discussed. Spectrum measurements were made on a variety of wireless signals to show the effectiveness of handheld spec-trum analyzers, such as FieldFox, when identifying and locating the sources of radio interference.
References
[1] Espino, J., Markendahl, J., Analysis of macro-femtocell interference and implications for spectrum allocation, IEEE 20th International Symposium on Personal, Indoor and Mobile Radio Communications, September 2009.[2] Keysight White Paper, Keysight Cognitive Radio Algorithm Development and Testing, Literature Number 5990-4389EN, August, 2009.[3] Stanislav, F., Kentaro, I., and Hiroshi, H., IEEE Draft Standard P1900.4a for Architecture and Interfaces for Dynamic Spectrum Access Networks in White Space Frequency Bands: Technical Overview and Feasibility Study, IEEE 21st International Symposium on Personal, Indoor and Mobile Radio Communications Workshops, 2010.[4] National Broadband Plan Chapter 5, Spectrum, at www.broadband.gov.[5] An Assessment of the Viability of Accommodating Wireless Broadband in the 1755 – 1850 MHz Band, U.S. Depart- ment of Commerce, National Telecommunications and Information Administration (NTIA), March 2012.[6] IEEE Std 1900.1-2008, Standard Definitions and Concepts for Dynamic Spectrum Access: Terminology Relating to Emerging Wireless Networks, System Functionality, and Spectrum Management, September 26, 2008.[7] Jabbar, M., Rahman, M, Radio frequency interference of electric motors and controls, Conference Record of the 1989 IEEE Industry Applications Society Annual Meeting, October, 1989.[8] Keysight Application Note, Evaluating Fluorescent Lighting Interference on Passive UHF RFID Systems, Literature number 5990-9090EN, November, 2011.[9] FCC Public Notice DA-05-1776A1, Sale or Use of Transmitters Designed to Prevent, Jam or Interfere with Cell Phone Communications is Prohibited in the United States.[10] Keysight Product Note Optimizing Dynamic Range for Distortion Measurements, Literature Number 5980-3079EN, November 2000.[11] Lui, P.L., Passive intermodulation interference in communication systems, Electronics & Communication Engineering Journal, June 1990.[12] Betts, J.A., Intermodulation interference in mobile multiple-transmission communication systems operating at high frequencies (3-30 MHz), Proceedings of the Institution of Electrical Engineers, November, 1973.[13] Bond, C.D., et.al, Intermodulation generation by electron tunneling through aluminum-oxide films, Proceedings of the IEEE, December, 1979.[14] Keysight Application Note: Innovative Passive Intermodulation (PIM) and S-parameter Measurement Solution with the ENA,Literature Number 5991-0332EN, May 2012.[15] Keysight Application Note 150, Spectrum Analysis Basics, Literature Number 5952-0292, August 2006.[16] Keysight Application Note 1286-1, 8 Hints for Better Spectrum Analysis, Literature Number 5965-7009E, September 2009.
FieldFox handheld analyzers
deliver benchtop-instrument
accuracy in field-test environ-
ments with MIL-spec durability
in satellite communications,
microwave backhaul, military
communications, radar systems
and a wide range of additional
applications.
14 | Keysight | Techniques for Precise Interference Measurements in the Field Using FieldFox Handheld Analyzers - Application Note
Download additional application notes, watch videos, and learn more:
www.keysight.com/find/FieldFox
Related literature Number
FieldFox Combination Analyzers, Technical Overview 5990-9780EN
FieldFox Microwave Spectrum Analyzers, Technical Overview 5990-9782EN
FieldFox Microwave Vector Network Analyzers, Technical Overview 5990-9781EN
FieldFox Handheld Analyzers, Data Sheet 5990-9783EN
FieldFox Handheld Analyzer, Configuration Guide 5990-9836EN
FieldFox N9912A RF Analyzer, Technical Overview 5989-8618EN
FieldFox N9912A RF Analyzer, Data Sheet N9912-90006
FieldFox N9923A RF Vector Network Analyzer, Technical Overview 5990-5087EN
FieldFox N9923A RF Vector Network Analyzer, Data Sheet 5990-5363EN
Carry precision with you.
Every piece of gear in your field kit had to prove its worth. Measuring up and earning a spot is the driving idea behind Keysight’s FieldFox analyzers. They're equipped to handle routine maintenance, in-depth troubleshooting and anything in between. Better yet, FieldFox delivers Keysight-quality measurements - wher-ever you need to go. Add FieldFox to your kit and carry precision with you.
15 | Keysight | Techniques for Precise Interference Measurements in the Field Using FieldFox Handheld Analyzers - Application Note
This information is subject to change without notice.© Keysight Technologies, 2017Published in USA, December 1, 20175991-0418ENwww.keysight.com
www.keysight.com/find/FieldFox
For more information on Keysight Technologies’ products, applications or services, please contact your local Keysight office. The complete list is available at:www.keysight.com/find/contactus
Americas Canada (877) 894 4414Brazil 55 11 3351 7010Mexico 001 800 254 2440United States (800) 829 4444
Asia PacificAustralia 1 800 629 485China 800 810 0189Hong Kong 800 938 693India 1 800 11 2626Japan 0120 (421) 345Korea 080 769 0800Malaysia 1 800 888 848Singapore 1 800 375 8100Taiwan 0800 047 866Other AP Countries (65) 6375 8100
Europe & Middle EastAustria 0800 001122Belgium 0800 58580Finland 0800 523252France 0805 980333Germany 0800 6270999Ireland 1800 832700Israel 1 809 343051Italy 800 599100Luxembourg +32 800 58580Netherlands 0800 0233200Russia 8800 5009286Spain 800 000154Sweden 0200 882255Switzerland 0800 805353
Opt. 1 (DE)Opt. 2 (FR)Opt. 3 (IT)
United Kingdom 0800 0260637
For other unlisted countries:www.keysight.com/find/contactus(BP-9-7-17)
DEKRA CertifiedISO9001 Quality Management System
www.keysight.com/go/qualityKeysight Technologies, Inc.DEKRA Certified ISO 9001:2015Quality Management System
Evolving Since 1939Our unique combination of hardware, software, services, and people can help you reach your next breakthrough. We are unlocking the future of technology. From Hewlett-Packard to Agilent to Keysight.
myKeysightwww.keysight.com/find/mykeysightA personalized view into the information most relevant to you.
www.keysight.com/find/emt_product_registrationRegister your products to get up-to-date product information and find warranty information.
Keysight Serviceswww.keysight.com/find/serviceKeysight Services can help from acquisition to renewal across your instrument’s lifecycle. Our comprehensive service offerings—one-stop calibration, repair, asset management, technology refresh, consulting, training and more—helps you improve product quality and lower costs.
Keysight Assurance Planswww.keysight.com/find/AssurancePlansUp to ten years of protection and no budgetary surprises to ensure your instruments are operating to specification, so you can rely on accurate measurements.
Keysight Channel Partnerswww.keysight.com/find/channelpartnersGet the best of both worlds: Keysight’s measurement expertise and product breadth, combined with channel partner convenience.